Embed Size (px)
Citation preview

161
Chapter - V
SALES BEHAVIOUR AND MARKETED SURPLUS
Section-VJ: INTRODUCTION
This chapter consists of ten sections attempting to focus our attention to
the magnitude of production, techniques of production, application of
fertilizers and pesticides, retention, prices, sales behavior of the farmers,
pattern of land input, infra-structure facilities and education of the
farmers according to size groups. These are the considered factors whose
magnitude can influence the level of marketed surplus directly or
indirectly. These factors are analyzed with the help of data collected from
the farmers of the select area with a view to satisfy the objectives set for
the study.
Considering the volume of output as the sole determinant of marketed
surplus, the present chapter focuses its attention to the analysis of per
capita, per household and per hectare productivities as the indicators of
farmers' efficiency and hence marketed surplus. The techniques of
production, crop rotation and cost of production are assessed in relation
to output with the objective of reaching the conclusion whether these
factors influence the level of output or not. Since the application of
fertilizers and pesticides in cultivation is an integral part of the new
agricultural strategy, these variables have been put in a separate section
to examine their impact on the output level. The analysis of the
behavioral pattern of retention and marketed surplus in accordance of
size groups also constitutes an important section in this chapter. Total
retention has been divided into retention for future consumption,

162
retention for future sale and retention for seed requirements which are
analyzed in individual figures. This is because all forms of retention may
not contradict with marketed surplus without any condition of constancy
o^ the variables, i.e., output, productivity, etc. Further, infra-structure
facilities, such as, irrigation, credit, storage & ware-housing, transport &
communication and marketing facilities have been considered as
important indicators of production and marketed surplus of paddy. Some
of these factors are evaluated in numerical figures of information and
some in attributes depending upon the possibility of data collection.
While analyzing marketing facilities to the farmer-sellers, an analysis of
sales behaviour of the farmers receives due importance in this chapter
both with respect to size-class as well as of different agricultural seasons.
Attention is also given to the analysis of seasonal prices of paddy and
marketed surplus based on the hypothesis that higher prices lead to
higher volume of marketed surplus and vice-versa. Since higher
remunerative prices indicate better margin to the farmers which in turn
inspire them to generate more marketed surplus, the pattern of margins
with respect to size class is analyzed to understand its affect on the
quantum of marketed surplus. Moreover, it is the proportion of area
brought under cultivation of paddy which plays a significant role in
determining the level of output and hence marketed surplus. Therefore,
the chapter provides a necessary space for analyzing the pattern of land
input and proportion of area devoted to paddy cultivation according to
size-class and its impact on marketed surplus.
In addition to this, the present chapter draws attention to highlight the
significance of literacy and level of education of the farmers in
augmenting higher quantum of marketed surplus. Since educated
farmers are assumed to be more efficient and less susceptible to be
exploited by the middlemen, the level of education can really affect the
volume of marketed surplus. However, without capital investment

163
education alone cannot make the farmers to employ modern inputs.
Hence, the analysis of income-saving pattern of the farmers also receives
due importance besides analyzing their levels of education while
determining marketed surplus.
Section- V.2: OUTPUT, COSTS OF PRODUCTION AND
MARKETED SURPLUS
The marketed surplus of an agricultural produce largely depends upon
the level of production. Producers under subsistence cultivation cannot
think of marketed surplus without having minimum amount of
production for their survival. The subsistence farmers carry on their
productive activities primarily with the objective of satisfying their
consumption needs. They derive net marketed surplus from the available
quantity of marketable surplus which is the excess of production over
and above the consumption requirements and other retentions. Prof. Raj
Krishna maintains that output level acts as a sole determinant of
marketed surplus (Krishna, 1965). Further, Kalpana Bardhan, Jagdish
Prasad, M. Upender, Praduman Kumar, and D.S Thakur argued that the
proportion of marketed surplus increases with the increase in production
(Bardhan, 1970, Prasad, 1989, Upender, 1990, Praduman-
Mruthyunjaya, 1989, Thakur et.al, 1997). However, it is not only the
level of production but also the productivity per capita and per hectare
which is assumed to be more effective while determining marketed
surplus (Sengupta, 1998). By agricultural productivity it is meant that
the efficiency with which agricultural inputs are transformed into
agricultural output with the given production process (Said-Said-Ishak,
2006). This makes us to examine the pattern of production and
productivity according to holding sizes coupled with the pattern of

164
production costs. The study of the costs of production is needed to
understand the relative influence of costs on the pattern of production
and thereby marketed surplus.
The wide practice of paddy cultivation in Barak Valley is done mainly in
two seasons depending upon the nature of the monsoon. These two
seasons are Kharif Season (April to September) and Rabi Season (October
to March). For the valley as whole the total production of kharif paddy
stands at 4137.8 quintal only, whereas the production of rabi paddy is
21295.3 quintal. So the total production including kharif and rabi stands
at 25433.1 quintal. In terms of percentage figure it is found that size
class-I of 0-1 hectare contributes only 15.70 per cent to total kharif
production of all the groups, which marginally increases to 20.86 per
cent for size class-II. But a significant contribution is made by size class-
Ill showing 29.79 per cent against 33.65 per cent for the largest class.
This indicates that size class with 2.01-3.0 hectare has a relatively better
share in the production of kharif paddy than the size class of 3.01
hectare and above. The increase in percent contribution of the largest
class is very marginal relative to their size of land holding and better
economic condition, indicating the apathetic attitude of the farmers
belonging to this group. Farmers of this largest group with sound
financial position could have contributed a much better share in the
production of kharif paddy. But most of them arc satisfied only with the
production of rabi paddy which reflects the absence of commercial
attitude of such farmers. A relatively very marginal increase in
production of the largest group compared with the third group may be
due to the practice of share cultivation with small and poor farmers, as
well as the engagement of the farm members in non-agricultural
activities. On the contrary, the contributions (better in relation to their
holding sizes and poverty) made by the first two groups are because of
their direct engagement on land with more personal interest in

165
cultivation, keeping other factors constant. Since due to poverty and the
consequent lack of education and skills the members of the small farms
do not get better sources of income in non-farm sector, they have to carry
out cultivation with sincere effort. This results in higher productivity of
those groups (table -6). A relatively better contribution by size class-Ill
reflects commercial attitude of these farmers which can be substantiated
by their highest level of net marketed surplus as per cent of output
(Table -1).
However, the share contribution of the largest group in total production
of rabi paddy in the valley is very satisfactory and stands at 39.87 per
cent. Whereas it is 21.99 per cent for the third group, and 21.33 per cent
and 16.81 per cent for the second and the first group respectively. From
this it is observed that both the second as well as the third group
contribute nearly the same proportion of rabi production, while in case of
kharif production there exists a considerable gap between them. This
indicates that size class-11 has relatively higher potential in rabi
production, whereas size class-I to some extent holds the same position
as it was in the kharif production. The contribution of the largest class of
3.01 hectare and above occupies the highest rank in total production of
rabi paddy of all the groups. A possible explanatory factor for lower
contribution by the third group of 2.01-3.0 hectare in rabi season
compared with kharif season of paddy production could be the maximum
extent of time needed for re-cleaning and re-ploughing the cultivated plot
due to poor methods of cultivation. This practice does not leave them
with sufficient time for cultivation of rabi crops at the maximum level of
efficiency. Consequently, cultivation is done at the last moment of sowing
season which in turn results in less than the optimum level of output.

166
Table-6
PRODUCTION AND COSTS PATTERN OF PADDY
Size c lass
Net marketed surplus as per cent of output
Production (in quintal)
Production in Kharif Season(quintal)
Percent share in total Kharif production
Production in Rabi Season (quintal)
Per Cent share in total Rabi production
P.C. share of production of the group to total
production
Production per capita (quintal)
Production per household(quintal)
Production per hectare (quintal)
I 0 -
1 h
ecta
re
0.52
4230.6
649.8
15.70
3580.8
16.81
16.63
23.25
48.63
48.44
11
1.01
- 2
.0
hec
tare
19.38
5404.9
86.3
20.86
4541.9
21.33
21.25
26.76
58.75
38.50
III
2.0
1 -
3.0
h
ecta
re
36.43
5915.4
1232.8
29.79
4682.6
21.99
23.26
46.58
96.97
42.89
IV
3.01
hec
tare
&
abo
ve
35.22
9882.2
1392.2
33.65
8490
39.87
38.86
82.35
164.70
35.74
To
tal/
Ag
gre
gat
e
26.36
25433.1
4137.8
100
21295.3
100
100
40.31
84.78
39.60

167
Costs of production per quintal (Rs.)
Cost of production per hectare (Rs.)
176.09
8530.40
176.15
6782.26
163.65
7018.57
175.38
6267.37
172.94
6849.02
Source: Field Survey
Ultimately the crop output becomes poor both in quantity as well as in
quality. The first two groups exhibit their share contribution in rabi
season almost equal to kharif season. This reflects equal emphasis given
by small and marginal farmers in production of both kharif and rabi
paddy, because of the fact that paddy cultivation is their single and
prime source of livelihood. Hence they get involved themselves directly in
cultivation and draw keen interest to increase paddy output for satisfying
their overall consumption needs.
Switching over our analysis to the share contribution in aggregate of
both kharif and rabi paddy, it is revealed that the percent share of
production of the group to total production increases with respect to the
size class. The share of the smallest group is only 16.63 per cent whereas
it is 21.25 per cent for the next group. The third group contributes only
marginally more than the second group being as much as 23.26 per cent.
The contribution of the fourth size class is to the extent of 38.86 per cent
which is the highest among all the size classes. It is also seen that the
total production including both of kharif and rabi seasons increase with
respect to the increase in size class of holdings. The level of production
increases from 4230.6 quintal for size class-1 to 5404.9 quintal for size
class-II, then to 5915.4 quintal for size class-Ill and thereafter increases
to 9882.2 quintal for the largest class. Similarly, the net marketed
surplus as per cent of output records an increasing rate showing 0.52
per cent, 19.38 per cent, 36.43 per cent and 35.22 per cent for first,

168
second, third and the largest class respectively. Likewise, there exists a
direct relationship between the per capita and per household
productivities and the size class. As the size group increases both per
capita and per household productivities increase though with a
considerable differences between higher two classes. The smallest group
shows its per capita productivity as 23.25 quintal against 26.76 quintal
for the second group. The per capita productivity for the third group is
46.58 quintal, whereas the same is 82.35 quintal in case of the largest
group. The average per capita productivity for the valley as whole
constitute only 40.31 quintal. It is thus revealed that per capita
productivity of the farmers rises sharply in accordance with increase in
size class. The rate of increase is very marginal for smaller two groups
and quite higher for larger groups. Regarding per household productivity
the same positive relationship can be observed (table-6). The productivity
per household for size class-I and size class-Il are 48.63 quintal and
58.75 quintal respectively. The per household productivity for the third
and the largest group are 96.97 quintal and 164.70 quintal respectively.
Thus it is seen that productivity per household also increases with the
increase in size class at a low rate for smaller two groups and at a high
rate for larger groups. This indicates that larger two groups perform
much better in terms of per capita and per household productivities than
smaller groups. The possible factors explaining the better position of
larger groups are the use of power tillers, pump sets and harvest
machines (however not widely) which replaces labour units in the farm
on one hand, and on the other large scale possession of cultivated lands
which are found uncommon among the farmers of smaller two groups.
Because, with large area of cultivation and less units of farm labour
engaged due to the application of machineries, per capita productivity
will naturally be higher. The higher extent of per household productivity
for larger two groups may also possibly be due to area availability and
the consequent level of production.
169
However, the study assumes per hectare productivity as the most reliable
measure of farmer's efficiency rather than per capita and per household
productivities which are considered as weak measurements of efficiency.
Though per capita and per household productivities show a direct
relationship with size holdings, it is per hectare productivity which has a
different behavioural pattern. It is noticed that the smallest group marks
the highest level of per hectare productivity to the extent of 48.44 quintal
against 38.50 quintal and 42.89 quintal for the second and third group
respectively. The production per hectare for the largest group is as low as
35.74 quintal reflecting lack of efficiency and disinterest of the
cultivators belonging to this group. This indicates that smaller two
groups attain a better degree of efficiency with regards to productivity per
hectare than larger groups. Of course, this is not due to the improved
methods of cultivation and use of chemical fertilizers and pesticides, but
due to their direct engagement and commitment of hard labour for
farming activities. This reflects that efficiency level of the farmers does
not have either positive or negative relationship with farm size of holding
rather it shows a fluctuating trend. It thus implies that productive
efficiency or per hectare productivity is not influenced by size class but
by some other factors like personal interest in cultivation coupled with
practical engagement of farmers.
An extension of our analysis to the costs of production reveals that there
is very little variation in per quintal cost of production among the size
classes except the third group. The third group shows its production cost
as Rs. 163.65 per quintal of paddy. It is interesting to note here that the
per quintal costs of production for larger two groups are lower than the
smaller groups. This could be due to greater economies of scale availed
by larger size groups in comparison to smaller groups. Due to small
holding sizes the small farmers cannot have access to economies of scale
170
inspite of greater degree of efficiency. The costs of production therefore
tend to be much higher in case of smaller groups. Besides, the small
farmers also have higher running costs as they have to hire power tillers,
pump sets, etc., since they arc unable to invest for the purchase of these
essential agricultural inputs. Though the smallest class registers one of
the highest per quintal costs of production and higher per hectare cost of
production, yet it shows the highest level of per hectare productivity. The
quantity of production per hectare for the largest group is found to be the
lowest with the lowest level of its per hectare cost of production.
However, with the lowest per quintal and a slightly higher per hectare
costs of production the third group shows its per hectare productivity to
be 42.89 quintal which is higher than the largest group. The productivity
per hectare for the second group is also higher than the largest class
with almost similar level of per quintal and per hectare costs of
production. This confirms the reality that larger classes and more
particularly the largest one are not much efficient as far as productivity
per hectare is concerned, reflecting the disinterest of hired labourers as
well as the apathetic attitude of the farmers. Conversely, the small
farmers without depending on hired workers take personal interest in
cultivation with much more hard work. In turn they achieve the highest
level of per hectare productivity with a relatively less costs combination.
Thus, it is clear that farmers belonging to smaller groups are much more
efficient in cultivation compared to the hired workers working on large
sized holdings. The production costs of smaller two groups can be said as
relatively lower, because the costs of production for maximum farmers
belonging to larger size holdings are borne by their share cultivators (who
are from smaller groups) which have not been taken into account in their
(large farmers) cost combinations. It is only the per hectare productivity
which reflects the actual efficiency of the farmers belonging to different
size holdings. The per capita and per household productivities are not
such reliable indicators of farmer's efficiency. The reason being that they

171
arc calculated by dividing the total production by the number of family
members engaged in cultivation and the households respectively. So far
it is observed that in larger two classes persons engaged in the field and
the number of households are relatively less than smaller classes
wherein more households and family members including children are
engaged in cultivation.
Thus from the above analysis it is revealed that net marketed surplus
increases with respect to an increase in the level of production according
to size class. This substantiates the findings drawn by Krishna, Bardhan,
Prasad, Upender, Praduman and Thakur that production is the sole
determinant of marketed surplus as there is positive relationship
between production and marketed surplus (Krishna, 1965, Bardhan,
1970, Prasad, 1989, Upender, 1990, Praduman-Mruthyunjaya, 1989,
and Thakur et al., 1997). It has also been traced that there is a direct
relationship between the per capita as well as per household
productivities of paddy (Table-6) and the per capita as well as per
household marketed surpluses (Table-1) according to size holdings. As
the productivity increases the level of marketed surplus also increases
with respect to size class and vice-versa. The production share of the
group to total production of all the groups also relates positively with
marketed surplus in accordance with size class. Our findings here
confirm Sengupta's realization that per capita and per household
productivities as well as the share of size class in total production has a
positive association with marketed surplus (Sengupta, 1998). However,
no such positive relationship between per hectare productivity and per
hectare marketed surplus is found to exist according to holding sizes
(table-6 & table-1). This supports the realization made by G.P Reddy,
P.G. Chengappa and L. Achoth that productivity has a negligible
contribution to affect marketed surplus (Reddy et al., 1995). Both
productivity per hectare and marketed surplus per hectare decline

172
suddenly in case of the largest class compared to its immediate
preceding class. All gross marketed surplus, net marketed surplus and
per hectare marketed surplus increases with the increase of size holdings
up to size class-Ill, with a marginal deceleration for the largest group.
But the same relationship is not exactly followed by the pattern of per
hectare productivity rather it shows a fluctuating trend.
Section-V.3: TECHNIQUES OF PRODUCTION, CROP ROTATION AND
MARKETED SURPLUS
It is a well known fact that better and improved techniques of cultivation
results in higher productivity and the consequent marketed surplus in
agriculture. Further, crop rotation can possibly improve the quantity of
marketed surplus that can be done well with favourable condition of
monsoon, irrigation facilities and adoption of scientific tools and
techniques. The study of production techniques and crop rotation has
been undertaken here to understand the prevailing methods of
cultivation and the pattern of crop rotation with respect to size class of
holdings in the select area.
An examination of the techniques of production and marketed surplus
reveals that an average of 87.33 per cent of total farmers of all size
groups are using traditional wooden plough and bullock pair or buffalo
for ploughing the land. Out of this almost all farmers belonging to the
smallest group use this kind of traditional method figuring 95.40 per
cent of the group concerned. The percentage of farmers using wooden
plough is the lowest in third group showing 80.33 per cent, whereas the
same is 85.87 per cent and 85 per cent for the second and the largest

173
group respectively. It is thus clear that still traditional practice of using
wooden plough is very popular among the farmers of all size groups and
its use is found to be the highest amongst the smallest group.
It has, however, been found that though the practice of using wooden
plough is very wide in the study area, there are as many as 70 per cent of
the farmers on an average among all the groups who use some modern
implements mainly power tillers, tractors, pump sets and harvest
machines. The largest class shows the highest proportion of its farmers
as much as 86.66 per cent using some of the modern implements,
followed by size class-Ill as 83.61 per cent and size class -II as 77.17 per
cent. The smallest class exhibits the lowest proportion of its farmers
using such implements constituting 41.38 per cent. This trend is an
expected pattern and indicates that farmers in Barak Valley use not only
the wooden plough but also some modern tools and implements which
are mostly on hired basis exhibiting dualism in agricultural cultivation.
Though the process of production is done with such mixed efforts of
traditional and modern tools, yet a large-scale prevalence of the use of
wooden plough still reflects the backward nature of cultivation. It is also
found that the practice of using HYV (High Yielding Variety) seeds
increases with the increase in size holdings. An average of 31.66 per cent
farmers in the valley is found as HYV users and the rests are dependent
on traditional seeds. Though there is wide practice of using traditional
seeds in paddy cultivation, it is seen that even the small and marginal
farmers recently started to use HYV seeds. Out of the total farmers
belonging to the smallest group 19.54 per cent employ HYV seeds,
whereas the percentage is 29.35 for the second group. The same is 32.79

174
Tabic - 7
TECHNIQUES OF PRODUCTION AND CROP ROTATION
Holding Size
Net Marketed Surplus as p.c. of output
P.C. of farmers using wooden plough
P.C. of farmers using tractors/ power tillers/ pump sets / Harvest
machines
P.C. of farmers using HYV seeds
P.C. of farmers cultivate once in a year
P.C. of farmers cultivate twice in a year
P.C. of farmers cultivate thrice in a year
P.C. of farmers produce the crop, other than paddy
I 0
-1
hec
tare
0.52
95.40
41.38
19.54
48.28
50.57
1.15
11.49
II
1.0
1-2
.0
hec
tare
19.38
85.87
77.17
29.35
54.35
43.48
2.17
21.74
III
2.0
1
-3.0
h
ecta
re
36.43
80.33
83.61
32.79
32.79
60.66
6.56
24.59
IV
13.0
1 h
ecta
re &
ab
ove
35.22
85.00
86.66
51.66
38.33
J J . J J
8.33
36.66
Agg
rega
te
26.36
87.33
70.00
31.66
45.00
51.00
4.00
22.33
Source: Field Survey

175
per cent and 51.66 per cent for the third and the fourth group
respectively. So it is observed that larger groups witness the maximum
use of HYV seeds which may be due to their better financial position
compared to smaller two groups. But the use of HYV seeds does not have
meaningful implication in affecting the level of marketed surplus for the
largest group. Despite the highest, use of HYV seeds among the farmers of
the largest group, its marketed surplus is less than the third group who
use a comparatively lower proportion of HYV seeds. The correlation is
positive up to size class-Ill indicating that marketed surplus increases
along with the increase in use of HYV seeds among the farmers.
Somehow the tendency of the farmers to use HYV seeds is increasing
because of awareness campaigns organized by some NGOs and Krishi
Vigyan Kendhra operating in the valley.
Thus it is observed that adoption of modern farm practices among the
farmers increases with the increase in size class. However, the farmer's
efficiency does not increase along with the percentage increase in modern
farm practices according to size groups. Because the finding reveals that
productivity per hectare shows a fluctuating trend throughout the size
classes with the highest productivity of the smallest group and the lowest
productivity of the largest group (table-6). In other words, there is no
such positive relationship between modern farm practices and
productivity per hectare. Therefore, our finding goes in conformity with
the conclusion drawn by N.C. Rao that the use of high technological
inputs is not a contributory factor in raising the efficiency level of the
farmers (Rao, 2004), and so does not support the observation made by
R.P Pradhan and P.P. Reddy (Pradhan, 2003, Reddy, 1997)
Crop rotation has been found to be very weak especially in paddy
cultivation of the study area. The frequency in crop rotation is vital for

176
raising the level of production for a particular agricultural year and in
turn marketed surplus. But crop rotation is very seldom practiced in the
valley which may be due to unfavourable agro-climatic condition, poor
methods of production and of course the pessimistic attitude of the big
farmers. The study reveals that an average of 45 per cent farmers in the
valley as a whole cultivate only once in a year. Farmers cultivating twice
in a year constitute 51 per cent which is the highest, while only 4 per
cent farmers reportedly cultivate three times in a year. Of course, the
valley's atmosphere is not suitable for cultivating thrice in a year because
of the fact that during winter season usually the area experiences
absence of rainfall and irrigation facilities are extremely poor in the
valley. In addition to this, third time cultivation is done for the crop
known as 'baruah' only in the vicinity of rivers, marshes (locally known
as bheels), big ponds etc. by irrigating the water from them which is
costly and time consuming. However, it is seen that a minor proportion
of farmers of all the groups practice such cultivation. As much as 8.33
per cent of farmers belonging to the largest group cultivate thrice in a
year figuring the highest level. The percentage is 6.56 for the third group,
2.17 for the second group and 1.15 per cent for the smallest group. This
indicates that as the size class increases more and more farmers take
interest to cultivate the land three times in an agricultural year.
The proportion of farmers cultivating twice in a year is 50.57 per cent for
size class-I, 43.48 per cent for size class-II, 60.66 per cent and 53.33 per
cent for size class-Ill and size class-TV respectively. This reveals that
maximum number of farmers who cultivate twice in a year belong to the
third group which shows the highest level of net marketed surplus. The
proportion of farmers cultivating twice in a year for the largest group is
lower than the third and similarly the group's marketed surplus is less
than the third group. It may be therefore because o[ maximum

177
proportion of farmers of the third group cultivating twice in a year the
marketed surplus for the same group is maximum.
Since paddy cultivation in the valley takes place mainly in two seasons -
Kharif and Rabi season, cultivation of the crop twice in a year has much
relevance in marketed surplus. It is therefore found that the highest
percentage of total farmers in the valley cultivate twice in a year. But this
does not contribute in generating marketed surplus for the first and the
second groups. The second group, with comparatively less percentage of
crop rotation twice in a year than the first group, shows a far better level
of marketed surplus than the first group. However, the third group with
the highest proportion of two-time' cultivators witness the highest level of
marketed surplus followed by the fourth group. This indicates that crop
rotation twice in a year influences the augmentation of marketed surplus
for larger two classes. The proportion of farmers practicing crop rotation
thrice in a year is not much effective in the generation of marketed
surplus. Because, the third time crop rotation has been a rare practice in
the valley which is done only in the inferior quality of land with old
methods of production. It has been found that each and every size group
under study shows the practice of three times cultivation while the
proportion of farmers under such practice is very small. The proportion
is only 1.15 per cent for the smallest group, 2.17 per cent for the second
group 6.56 per cent and 8.33 per cent for the third and the largest group
respectively. This pattern again depicts the positive relationship with
marketed surplus up to size class-Ill. Although the highest proportion of
farmers undertaking crop rotation thrice in a year is found in the largest
class, its net marketed surplus as per cent of output is little bit smaller
than the third group.

178
Section-VA: THE APPLICATION OF FERTILIZERS AND PESTICIDES
The consumption of fertilizers and pesticides has great implications in
the production pattern of paddy. Since the application of chemical
fertilizers helps in increasing the productive capacity of the land and the
use of pesticides protects the crop from the attack of pests and insects,
consumption of these will increase the quantity of production. This in
turn helps in generating higher level of marketed surplus. The practice of
using chemical fertilizers is found common among all classes of farmers
under study. Table-8 reveals that fertilizer consumption of the farmers
both in volume and in value terms varies from size class to size class.
The smallest class consumes the lowest quantity and the largest class
consumes the highest quantity of fertilizers both in terms of per quintal
as well as per hectare of cultivated land. However, there is not much
variation in fertilizer consumption of the groups in terms of either value
or quantity with respect to per quintal and per hectare consumptions.
This is another indication of the keen interest taken by the small and
marginal farmers to increase the productivity of land. Though larger two
groups comparatively use higher volume of fertilizers, their productivity
per hectare (Table- 6) is not up to the satisfactory level (even smaller
than the smallest group) to influence the level of marketed surplus. This
may be due to the fact that they employ hired labourers in cultivation
and many of them do share cultivation with the landless labourers,
wherein, hired workers cannot draw the utmost attention in cultivation as
the farm workers can.
Further, an analysis of the use pattern of pesticides and insecticides
reveals that the largest class achieves the highest use in value terms,
while the smallest class shows the lowest use, both with respect of per

179
quintal of paddy and per hectare of the cultivated land. There is no
considerable variation found between the second and the third group
with respect to both per quintal and per hectare use of pesticides and
insecticides. But there exists a significant difference between them in
respect of marketed surplus. Table-8 presents the application pattern of
chemical fertilizers and pesticides/insecticides by the farmers of different
size groups. It has been found that as much as 73.66 per cent of the
total farmers in the valley consume chemical fertilizers in cultivation and
49 per cent of the farmers consume pesticides and insecticides.
Out of the total farmers consuming fertilizers 55.17 per cent belong to
the first group and 79.35 per cent belong to the second group. The third
group shows its proportion as 73.77 per cent which is less than the
second group, whereas the fourth group constitutes the highest
proportion of its farmers using chemical fertilizers showing 91.66 per
cent. This indicates that majority of the farmers in each group use
chemical fertilizers for the purpose of increasing the productivity of the
land. But the proportion of farmers using fertilizers does not vary
positively with the increase in size-class, showing a sudden decline in
size class-Ill. The same non-linear relationship is also followed by per
quintal consumption of fertilizers both in volume and in value terms. The
aggregate use of chemical fertilizers for all the size groups under
consideration constitutes only 1.00 kg per quintal, out of which the
smallest group consumes 0.53 kg per quintal at the cost of Rs.5.39. The
per quintal use of the second group is 0.91 kg at Rs. 10.37, while the
same for the third group is 0.89 Kg at the cost of Rs. 10.34. The per
quintal consumption of the largest group is 1.33 kg with the expenditure
of Rs.14.08.

180
Table - 8
APPLICATION PATTERN OF FERTILIZERS AND PESTICIDES
i
Size Class
Net Marketed Surplus as p.c. of output
Amount of Chemical fertilizers used (kg)
Use of fertilizers per quintal of output (Kg.)
Use of fertilizers per hectare (Kg.)
Amount spent on fertilizer per quintal of
output (Rs.) Amount spent on
fertilsers per hectare (Rs.)
Amount spent on pesticides per quintal
(Rs.) Amount spent on
pesticides per hectare (Rs.)
P.C. of farmers use chemical fertilizers
P.C. of farmers use pesticides /insecticides
I 0
-1
hecta
re
0.52
2241
0.53
25.66
5.39
260.87
1.24
60.21
55.17
37.93
II
l.O
l -2
.0
hecta
re
19.38
4903
0.91
34.93
10.37
399.24
1.71
65.75
79.35
46.74
" " " "
O CO u
a ' -2 9 3
36.43
5248
0.89
38.05
1
10.34
443.57
1.44
61.77
73.77
50.82
c8
u
o CO
35.22
13127
1.33
47.47
14.08
bfi a> u bJD W <
26.36
25519
1.00
39.74
10.98
503.13 | 434.68 j
2.26
80.65
91.66
66.66
1.78
70.56
73.66
49
Source: Field Survey

181
However, the per hectare use of fertilizers presents a linear positive
relationship with the size class both in volume and in value terms. It is
seen that the first group consumes only 25.66 kg fertilizers with an
expenditure of Rs.260.87 per hectare against the consumption of 34.93
kg at Rs.399.24 by the second group. The per hectare consumption of
fertilizers for the third group is 38.05 kg at the cost of Rs.443.57,
whereas for the largest group the same is 47.47 kg constituting an
expenditure to the extent of Rs. 503.13.
So far as the application pattern of pesticides and/or insecticides is
concerned, it is found that an aggregate of 49 per cent farmers in the
valley are involved in using the same to save crops from the attack of
pests and insects. Of this 37.93 per cent farmers of the smallest group,
46.74 per cent of the second group, 50.82 per cent of the third group and
66.66 per cent of the largest group use pesticides and/or insecticides.
This means as the size of holdings increases, more and more farmers
apply pesticides/insecticides revealing a positive relationship. But this is
not so in case of per quintal and per hectare use of pesticides in value
terms. The first group spends only Rs.1.24 per quintal and Rs.60.21 per
hectare for the use of pesticides or insecticides. Similarly the second
group spends Rs.1.71 per quintal and Rs.65.75 per hectare for the same.
Whereas the per quintal and per hectare application of pesticides or
insecticides in value terms are Rs.1.44 and Rs.61.77 respectively for the
third group, and to the extent of Rs.2.26 and Rs.80.65 respectively for
the largest group.
It is, therefore, observed that only the smallest group consumes
fertilizers and pesticides at a level far below the other groups both in
physical quantity as well as in value terms. The proportion of farmers
using fertilizers and pesticides belonging to the smallest group is also

182
very low. This is owing to their poverty due to which they cannot afford
for high priced quality fertilizers and pesticides. Though the aggregate
consumption of chemical fertilizers is quite appreciable, majority of the
farmers use low priced poor quality fertilizers which do not increase
productivity. On the other side, the application of pesticides or
insecticides in aggregate is not that much appreciable in relation to large
scale damage of the crops in each and every year due to pests and
insects in the field. This is reportedly due to high purchase cost of
pesticides and insecticides which even many of the large farmers cannot
afford. The smaller use of pesticides and insecticides (per quintal and per
hectare) by the third group compared to the second group is the evidence
here.
Moreover, the smallest group with the lowest consumption of fertilizers
and pesticides has the highest level of per hectare productivity (Table-6).
And the third group with lower level of such consumptions than the
second group achieves higher per hectare productivity than the latter.
While the largest group with the highest application level of fertilizers
and pesticides reveals both lower productivity per hectare and lower level
of marketed surplus than the third group. Thus, it is realized that the
consumption of fertilizers and pesticides does not influence the levels of
productivity and marketed surplus directly. Rather this seems to have a
positive response in affecting the volume of production which is an
important determinant of marketed surplus. However, marketed surplus
is affected not only by the volume of production but also some other
important factors like farm consumption and retentions which are
discussed under separate heads. Notwithstanding, there is an indication
of high interest of the farmers belonging to the first two groups in
cultivating the land for higher quantity of production. This is reflected in
their consumption patterns of fertilizers and pesticides that in spite of
their unsound economic condition they could use a good amount of
183
fertilizers and pesticides in relation to their size of land holding and
poverty. Though there exists a considerable use of the same among the
farmers belonging to larger groups, this however does not indicate any
good performance in productivity per hectare, as their per hectare
productivity is even smaller than the smallest group reflecting poor
efficiency of higher groups. Besides the third group, using smaller value
and quantity of fertilizers and pesticides than the largest group, shows
higher productivity per hectare than the largest group. It is to be
mentioned here that the group's (third group) marketed surplus is also
found at the highest level. All these led us to conclude that the
application level of fertilizers and pesticides/insecticides contribute as a
factor determining per-hectare productivity in average of smaller two
groups. This is however not so relevant for larger two groups in raising
per hectare productivity as well as marketed surplus.
Section -V.5: THE PATTERN OF RETENTION AND MARKETED SURPLUS
It is a well established fact that marketed surplus of an agricultural
produce particularly crops which are used as staple food and its
retention by the producers are contradictory to each other. M. Upender
maintains that the proportion of output retained for domestic
consumption declines with an increase in the farm size (Upender, 1990).
To Sengupta, the volume of retention for the purpose of family
consumption is inversely related to marketed surplus according to size
groups (Sengupta, 1998). In this study total retention of paddy consists
of the retention for farm consumption, future sales and seed
requirements by the farmers. Higher volume of retention implies lower
quantum of marketed surplus and vicc-vcrsa. With a view to understand
the relative influence of retention on marketed surplus of paddy it is
184
pertinent here to analyze the pattern of retentions by different size
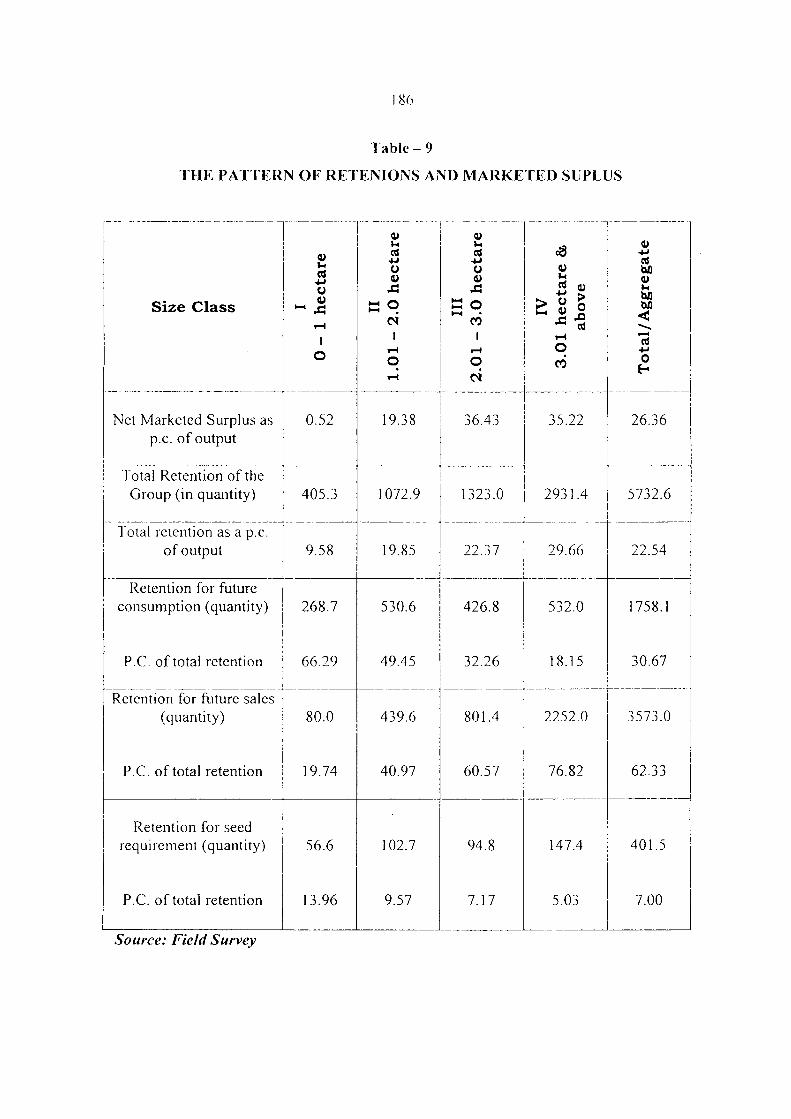
groups. Table-9 presents the retentions of paddy by the farmers for
various purposes and their percentage distribution among the size
classes.
The retention as a proportion of gross output of the group is found
highest among the largest size class showing 29.66 per cent, while its
marketed surplus is less than the third group. But the third group with
lower level of retention as 22.37 per cent generates the highest
proportion of marketed surplus. This reveals a negative relationship
between retention and marketed surplus as lower retention results in
higher marketed surplus and vice-versa. However the same finding is not
confirmed in case of smaller two groups. The first group with 9.58 per
cent of output as retention shows the lowest level of marketed surplus,
whereas the second group with much higher level of retention as 19.85
per cent exhibits a better marketed surplus than the first group. This
indicates that total retention works as a determining factor of marketed
surplus only for larger two groups. Here total retention comprises o^
retention for future consumption, future sales, and seed requirements.
However, in case of smaller two groups total retention does not determine
their level of marketed surplus. This is because both retention and
marketed surplus of the second group are much higher than the first
group.
With a relatively lower volume of output smaller two groups retain the
produce mostly for consumption purpose and for seed requirement.
Therefore, it is not the total retention but the retentions for consumption
and seed requirement which may determine marketed surplus of smaller
groups. It has been observed that retentions for farm consumption as
well as for seed requirement are much lower in proportion for larger two
groups compared to smaller groups. Whereas, the retention by larger

185
groups for the purpose of future sale is much higher than the first two
groups. An analysis of the proportion of retention for consumption to
total retention reveals that the smallest group retains as much as 66.29
per cent for consumption purpose while the same is 49.45 per cent for
the second group. In case of the third and the fourth group the
proportions of retention for consumption are 32.26 per cent and 18.15
per cent respectively. This reflects a negative relationship between
retention for consumption and marketed surplus throughout the size
class. The same relationship is also found between retention for seed
requirement and marketed surplus according to size class up to the third
group. A very marginal and sudden decline in marketed surplus for the
largest group is because of its highest level of retention for future sale
which is as high as 76.82 per cent. In case of the retention for seed
requirement it is found that the proportion of retention by the smallest
group is the highest to the extent of 13.96 per cent of its total retention.
Whereas the same is 9.57 per cent, 7.17 per cent and 5.03 per cent for
the second, the third, and the largest class respectively. This reveals that
smaller groups mostly use traditional seeds rather than high yielding
varieties, which again strengthens our observation of the wide practice of
old and poor methods of cultivation followed by them. Despite the use of
high yielding varieties found among many farmers of larger two groups
the pattern of retention for seed requirement reveals that they are not
totally free of using traditional seeds. This confirms an overall existence
of traditional practice of paddy cultivation in the valley as whole.
In aggregate pattern, out of the total retention of all the size groups 30.67
per cent is retained for farm consumption, 62.33 per cent is for market
sales, and only 7 per cent is for seed requirement. Thus in overall
retention the share component of retention for sales purpose is fairly
significant. This may be due to higher retention power possessed by
larger two classes for the purpose of making future sales in the market.
186
T a b i c - 9
THE PATTERN OE RETEMONS AND MARKETED SL'PLUS
S i z e C l a s s
Net Marketed Surplus as p.c. of output
0.52
Total Retention of the Group (in quantity)
Total retention as a p.c. of output
Retention for future consumption (quantity)
P.C. of total retention
Retention for future sales (quantity)
P.C. of total retention
Retention for seed requirement (quantity)
P.C. of total retention
405.
9.58
<u
O
Xi T H
1 O
<u u rt -M
o Xi
t-H O
1
o i-t
u u a 4->
o xi
a o i—< CO
1
o M
19.38 36.43
1072.9
19.85
268.7
66.29
80.0
19.74
56.6
13.96
530.6
49.45
439.6
40.97
102.7
9.57
1323.0
22.37
426.8
32.26
801.4
60.57
94.8
7.17
" """ '
eg
a>
> 2 o "•Sfl
o CO
35.22
2931.4
d M u bfl
<
tal
o
26.36
5732.6
29.66
532.0
18.15
2252.0
76.82
Source: Field Survey
187
The highest proportion of retention for sales purpose is shown by. the
largest class as 76.82 per cent. The third class shows 60.57 per cent of
such retention against 40.97 and 19.74 per cent for size class-II and size
class-I respectively. So, the lowest level of retention for future sale is
found among the farmers of the smallest group, which is because.of their
higher level retentions for self consumption and seed requirement on the
one hand, and lower level of output on the other. Hence, there exists a
direct and positive relationship between retention for future sales and
the size-group. As a result total retention relates positively with the size
class. The total retention as a proportion of output constitutes only 9.58
per cent for size class-I and 19.85 per cent for size class-II. For size
class-Ill and IV the proportion of retention is 22.37 per cent and 29.66
per cent respectively. It is thus seen that the proportion of retention for
future sales to total retention increases with the increase in size
holdings, reflecting higher and higher potentiality of larger classes in
augmenting the marketed surplus. However, this power of retention
largely depends upon the expectation of higher remunerative prices
during the mid-season and lean season. The possible factors responsible
for not possessing high retention power for the purpose of market sales
by smaller two groups are distress sales and immediate cash
requirements owing to their poor financial conditions.
Therefore, our hypothesis of contradiction between retention and
marketed surplus is confirmed in case of retention for domestic
consumption as well as in case of retention for seed requirement. Thus it
validates the observation made by M. Upender and K. Sengupta as an
inverse association between retention for domestic consumption and
marketed surplus with respect to size class (Upender, 1990, Sengupta,
1998). However, the same inverse relationship between retention and
marketed surplus is not satisfied particularly in case of retention for
sales. The study observes that retention for market sales of the produce

188
increases at an increasing rate as the holding size increases. This
positive relationship between retention for market sales and size class
works as a factor responsible for establishing a positive association
between total retention and marketed surplus according to size class.
Hence, there exists a positive association between total retention as a
proportion of gross output and holding sizes which is also observed by
Sengupta's study (Sengupta, 1998). Therefore, it is not the total retention
rather the retentions for domestic consumption and seed requirement
which play important part in the determination of marketed surplus.
Section -V.6: THE MARGIN, STORAGE FACILITY, IRRIGATION
FACILITY AND HIE CREDIT FACILITY
The margin of profit that the farmers receive from the sale of surplus
agricultural produce is extremely important for determining the level of
marketed surplus. Farmers get incentives to generate higher volume of
marketed surplus if and only if they could receive higher and
remunerative rate of margins. Therefore, a proportionally better rate of
margin means greater incentive to offer more for sales just as lower
margin may discourage them to dispose off more in quantity. The study
defines margin as the difference between the costs of production per
quintal and the price received per quintal. It is revealed that the per
quintal margin in case of the smallest group is not only the lowest but it
shows a negative figure as well, showing a loss of Rs. 107.67, whereas the
same is the highest for the largest group showing a profit of Rs. 121.17.
The negativity in the margin implies loss after selling the produce which
is also incurred by the second group showing a loss of Rs.32.48 per
quintal. The margin per quintal for the third group is Rs.97.47. The
highest level of margin received by the largest class and the negative

189
margins for the first two classes are also revealed in case of per hectare
and per household margins. The appreciated levels of profit margin for
larger two classes can be substantiated by the fact that the economically
well off farmers belonging to these classes have a better bargaining power
than the poor farmers of smaller two groups. It is because of this reason
they could manage to receive maximum prices for their produce by
selling at the time when prices are higher. Conversely, it is not only due
to the weak bargaining power possessed by smaller groups but mainly
due to indulging in distress sales they have to be contended with lower
price and thereby lower margins. Besides, the better retention power of
larger two groups makes them possible to release their produce during
lean season when prices reach the peak. The maximum number of
farmers in smaller groups is bound to dispose off their produce during
harvest season at the lowest level of prices which is the basic cause of
their negative rates of margin. It is the ongoing system of agricultural
marketing in the valley which is perhaps the responsible factor of such
deplorable condition of margins for the small and marginal farmers.
The existing agricultural marketing system in the Barak Valley is largely
influenced by the middlemen. The operations of middlemen in the village
markets of the valley can be classified into three groups - village traders
locally known as 'bhepari', commission agents or big traders and rice-
millers, and the itinerant traders. The village traders appear as the most
common purchasers during the post-harvest season either from 'hats' or
from the 'farm houses' at much lower prices. The itinerant traders
ramble from village to village to collect paddy from the farm houses and
sell them in the nearest markets after converting into rice. The small and
even some of the large farmers always remain satisfied by offering their
produces to the itinerant traders at a relatively low price due to the
absence of quick and low cost transport facilities, storage capacity and
fear of being cheated by the middlemen in market centers. Paddy in the

190
form of rice is also sold by small and marginal farmers weekly and
fortnightly in the periodical markets located in rural areas to meet their
urgent cash requirements. Another kind of selling appeared among the
small and poor farmers termed as distress sales in which case still
money lenders have considerable influence on the marketing of paddy.
The poor farmers generally borrow money from the money lenders on an
oral agreement of selling their produce to them just after the harvest at a
price much below than the prevailing market price. This way the
marginal and small farmers are obliged to make distress sales which
constitute a good share of paddy marketing. However distress sales
generally do not prevail among the large farmers who dispose off their
produce normally during the mid-season and the lean-season at higher
prices because of their capacity to wait for better prices. Many of them
sell their produce without converting into rice to the middlemen at their
door level, because they think that higher price received from market sale
of the produce would not be beneficial after incurring transport cost,
marketing charges and the cost of conversion. They, therefore, remain
contend with door selling behaviour at. a lower price than the market
centers. This in turn calls for a radical change in the prevailing system of
agricultural marketing which is the need of the hour to improve the
condition of the poor farmers.
The storage facility available to the farmers and their capacity of storage
is yet another considerable factor determining marketed surplus. It is
revealed that not even a single farmer under study is reported to be
availing the facility of scientific storage for paddy from the government.
Barring some rich farmers all other farmers store their produce in a
fragile storage made of bamboo and plastered with clay in which the crop
may be either damaged easily or eaten up by rats and other insects.
Some farmers possessing sound economic conditions have made their
storage cemented (pucca) which though not scientific, is more secured

19]
from getting easily damaged. It is generally presumed that farmers with
good quality of storage facility may have higher will of retention for future
sales at higher prices, which in turn encourage their volume of marketed
surplus. An analysis of the proportion of farmers possessing self pucca
storage facility reveals that no farmers belonging to the smallest class
own such kind of storage capacity. However, about 7 per cent of farmers
of the size class next to the smallest class possess the same facility. The
third group shows that about 20 per cent of its farmers avail the facility,
while for the largest group the proportion is exactly 25 per cent which is
the highest. For the valley as a whole an average of 11 per cent of the
farmers are found to possess self-pucca storage facility. It can, therefore,
be traced that higher the size groups more and more farmers are able to
acquire themselves good and secured storage for their produce at farm,
which is due to their better economic bases according to the size class.
On the contrary, coupled with the factors of poor economic conditions
and distress sales, absence of good and secured storage capacity is still
another factor determining unhealthy level of marketed surplus for small
and marginal farmers. On the other hand, because of their high power of
retention with secured storage capacity at farm the farmers belonging to
larger two groups are able to wait for better remunerative prices that
cause their attainment of healthy level of marketed surplus. It may be
mentioned here that there are only two cold storage facilities located in
the valley run by private management which are basically meant for the
crops other than paddy.
Though irrigation facility has been introduced by the Government of
Assam to facilitate the farmers during the shortage of rainfalls and for
operation of multiple crop rotations, the study reveals that not a single
farmer avails of this facility. The irrigation department of the government
is almost inactive especially in all the three districts of Barak Valley. One

192
Tabic- 10
MARGIN, INFRA-STRUCTURE FACILITIES AND MARKETED SURPLUS
Size group
Net Marketed Surplus as p.c. of output
Margin per quintal (Rs.)
Margin per household (Rs.)
Margin per hectare (Rs.)
P.C. of farmers with irrigation facility (Govt.)
P.C. of farmers with private micro irrigation
P.C of farmers with scientific storage facility
P.C. of farmers borrowed for production purpose
P.C. of farmers borrowed from banks and other
institutions
P.C. of farmers borrowed from moneylenders and
others
I 0
-1
hecta
re
0.52
-107.67
-5235.86
-5216.08
Nil
9.19
Nil
35.63
2.29
" "1
II
1.0
1 -
2.0
hecta
re
19.38
-32.48
-1908.09
-1250.49
Nil
7.61
Nil
33.69
9.78
23.91
III
2.0
1 -
3.0
hecta
re
36.43
97.47
9451.93
4180.15
Nil
19.67
Nil
31.15
11.48
19.67
IV
3.0
1 h
ecta
re 8
B ab
ov
e
35.22
121.17
19956.87
4329.98
Nil
16.66
Nil
28.33
21.66
16.66
Ag
gre
gat
e
26.36
44.94
3809.72
1779.74
Nil
12.33
Nil
32.66
10.33
22.33

193
PC. of production costs borrowed
12.13 22 11
f
13.74 19.62 17.59
Source: Field Survey
of the examples of this is the irrigation office located at Barjatrapur of
Cachar district which has now become the grazing field of animals with
all its office buildings in a dilapidated condition. In this plight some
farmers under study create themselves micro irrigation facility using the
water from ponds, rivulets and marshes with the help of pumping
machines or through other means to utilize under surface water for
irrigation purposes. But this venture also needs capital investment which
the small and marginal farmers cannot afford and so they are
discouraged to continue crop rotation. An analysis of the private micro
irrigation facility availed by the farmer shows that the highest proportion
of farmers using such facility belongs to the third group figuring only
19.67 per cent of total farmers of the group. Following this 16.66 per
cent farmers belonging to the largest size group use such micro irrigation
facilities. The proportion of the smallest group is 9.19 per cent which is
however higher than the lowest proportion of the second group showing
only 7.61 per cent. This indicates that there is no positive relationship
between the use of micro irrigation and the size-class reflecting less
interest in paddy cultivation by higher and economically potential
groups. Although such micro irrigation is costly yet a minor proportion of
the farmers belonging to the first two groups create such benefits
showing sincere attention in cultivation which may be due to their urgent
need for food and cash requirements. It is also found that an average of
12.33 per cent farmers of all the groups use such facility in the absence
of any macro irrigation facility from the government. With the existence
of inactive irrigation department of the government which causes some

194
unproductive public expenditure, not a single a farmer is reported to
have benefited from this scheme. Since the agro-climatic condition of the
Barak Valley is not stable and conducive every year and since maximum
farmers are poor in nature irrigation facility from the government is
assumed to be an important means of infrastructure in raising
agricultural productivity. However, our present study finds no such
facility available to the farmers under consideration which restraints
agricultural productivity even after adoption of modern farm practices.
This shows conformity with the finding drawn by M.P Bezbaruah and
Niranjan Roy as the poor system of irrigation and extension services act
as constraints in increasing the levels of agricultural productivity in the
Barak Valley of Assam (Bezbaruah-Roy, 2002).
In modern times capital is the most important factor of production and
agricultural product is not an exception. But the agri-sector in India is
generally a capital starved sector in which most of the producer-sellers
belong to the poor category. This is because of the fact that farmers
cannot produce better quantity and quality of the crops which is more
particularly the case of Barak Valley, for which the overall marketed
surplus in the valley is unsatisfactory. Therefore, credit facilities to the
farmers and the manner of credit availed by them is a very important
factor determining marketed surplus. It has been realized that an
average of only 32.66 per cent farmers in the valley fall under credit
arrangement (institutional and non-institutional), confirming that
maximum farmers are still not covered under credit facilities or not
encouraged to avail such facilities for production purposes.
The study expresses the amount of credit money utilized by the farmers
in terms of percentage of production costs to reflect the actual pattern of
credit facilities availed by different size groups. An analysis of this reveals
that credit used by the second group is the highest to the extent of 22.1 1

195
per cent of production costs. For the largest group the proportion is
19.62 per cent and for the third group the same is 13.74 per cent. The
proportion of credit to the costs of production is the lowest in case of the
smallest group showing 12.13 per cent. This indicates that there is no
direct and positive relationship between the use of credit money in
production and the size class. However, generally it is expected that
farmers of larger size holdings have the tendency of availing greater
amount of credit to improve their methods of production and thereby
productivity. An opposite experience of this, revealed in the study,
reflects the lack of commercial attitude of the big farmers. This is also
confirmed by our finding that an aggregate of merely 17.59 per cent
production costs are borrowed by the farmers for the valley as a whole in
the presence of insufficient capital possessed by the farmers to invest in
agricultural sector.
Switching over our analysis to the proportion of farmers taking loans for
production purposes, it is revealed that the smallest group attains the
highest level to the extent of 35.63 per cent, whereas the largest group
shows the lowest proportion as 28.33 per cent. The proportions of the
second and the third group are 33.69 per cent and 31.15 per cent
respectively, indicating that as the farm size increases less and less
number of farmers are willing to take loans. A relatively higher
proportion of loans taken by smaller two groups are because of their poor
economic conditions who mostly indulge in non-institutional sources of
credit especially from money lenders. On the other hand, due to the lack
of commercial attitude of big farmers the proportion of farmers borrowing
for production purposes is lower in case of larger two groups.
However, there is a tendency of big farmers to avail the credit money
from institutional sources. The institutional credit sources imply the
loans taken from Government, Commercial Banks, Regional Rural

196
Banks, Co-operative Banks, etc., whereas the money lenders, landlords,
relatives and friends, etc. are termed as non-institutional sources. The
proportion of farmers availing the institutional credit is found to be the
highest in the largest group showing 21.66 percent, whereas the same is
the lowest of only 2.29 per cent among the smallest group. For the
second and the third group the percentage is 9.78 and 11.48
respectively. On the contrary, the proportion of farmers availing non-
institutional credit is the highest to the extent of 33.33 per cent for the
smallest class while the same is the lowest in case of the largest class
being only 6.66 per cent. The proportion is 23.9 1 per cent for the second
class and 19.67 per cent for the class next to the second class. Thus, it is
evident that the small and marginal farmers largely take loans from
money lenders, traders, etc. at a very high rate of interest. Consequently,
they are in the cobweb of distress sales which deepens their vicious circle
of poverty due to which their level of net marketed surplus is very
negligent. In reverse case, farmers belonging to larger two groups avail of
credit mostly from institutional sources at a comparatively low rate of
interest. This may be due to their better economic position and perhaps
their level of education. Because the institutional loans are subject to
security in the form of borrower's property and complexity for which the
uneducated farmers are scared of taking such loans. As a result, there
exists a direct relationship between the farmers with institutional credit
and the size-class, and an inverse relationship is revealed between the
farmers with non-institutional credit and the size-class.
Section - V. 7: SALES BEHAVIOUR OF HIE FARMERS
The marketing system of an agricultural produce and the sales behaviour
of farmers are very crucial in determining marketed surplus. This is
because the farmers who sell the produce in the market places are aware

197
of prevailing prices and existing market: conditions, and are therefore
expected to be less exploited by the middlemen. Consequently, they may
receive better prices by selling at the market centers. Higher prices
inspire them to generate more surpluses for the purpose of sale in the
market. Contrary to this, farmers who sell their produce at the village
level do not know the actual prices that exist in the market, and so there
is a greater possibility of being exploited by beparies, commission agents,
etc. at the village level. Moreover, if the local markets and mandies are
not regulated by the government arid if the markets are more influenced
by the middleman, then even the farmers selling their produce in the
market centers would be more exploited in spite of having their
knowledge and consciousness about the prices. Again the distance of
market places from the farmers' house and mode of transportation to the
market centers are still another considerations that affect the market
access of the produce. If the market place is far away from the farm
household and the mode of transportation is very poor and costly, then
the farmers instead of bringing their produce in the market centers
dispose off the produce at their doors. Further, in the absence of usual
character of paddy (without converting into rice) sales in the market
centers and in the absence of warehousing facilities, the market access of
paddy are discouraged specially in case of the farmers who are willing to
sell paddy only.
Table-11 depicts the picture of sales behaviour of the paddy farmers,
marketing costs and distance of the market place in the Barak Valley of
South Assam. It is revealed that marketed surplus of paddy mostly
depends upon the production in the rabi season. Similar to the entire
state of Assam there are two main seasons - Kharif and Rabi during
which the paddy cultivation is generally carried out in the valley. Kharif
season starts from April to September and the Rabi season takes place
over the period from October till March. It has been found out that an
198
average of 73.33 per cent farmer-sellers dispose off paddy (rice) in the
rabi season while only 23.66 per cent dispose off their produce in the
kharif season. The percentage of farmers selling rabi paddy is the lowest
with 52.87 per cent in size class-I, while it is the highest being 95.08 per
cent for size-class-IIl. The percentage for the largest class is little bit less
than the third class showing 93.33 per cent and for the second class it is
65.22 per cent. Whereas, the percentage of farmers selling kharif paddy
is only 8.05 per cent for size class-1 which is also the lowest, but the
highest percentage is found in case of the largest class to the extent of 40
per cent. This indicates that not even a fifty per cent of large farmers
dispose off kharif paddy or rice. This may be due to low volume of
production during the kharif season governed by the factors like vagaries
of monsoons, e.g., flood, drought, late rains, etc., apathetic attitude of
farmers, and absence of modern tools and scientific methods of
production. Besides, high costs and tough task of harvesting and re-
cultivating the plot in the kharif season, sometimes due to heavy rains
and sub-merging of plots, cause discouragement to the farmers. For the
second group the percentage of farmers selling Kharif paddy is 18.48 per
cent and for the third group the same is 37.70 per cent. Thus there is a
positive relationship between the percentage of farmers selling kharif
paddy and the size-class. Whereas the same positive relationship in case
of the farmers selling rabi paddy with the size class is valid only up to
size class-Ill. However, the farmers selling rabi paddy is very high in
percentage with a maximum of 95 per cent and a minimum of 52 per
cent. This is because of higher volume of production during the rabi
season supported by favourable condition of the monsoon, easy process
of harvesting during winter season and above all the personal interest of
the farmers. It is observed that larger two classes show higher percentage
of farmers selling kharif paddy which is possibly because of their
economic power to hire labourers and machineries as well as favourable
condition of their land situation. Low-lying paddy fields around the

199
marshlands cannot: be brought under cultivation during rainy season.
The larger classes reportedly possess more lands covering the up-lying
areas which are favourable for cultivation during the khanf season.
Conversely, the paddy fields of many of the farmers belonging to smaller
two groups are located in the interior and inferior areas, which often
discourage them to cultivate in the kharif season, although they are
needy and interested to cultivate. Because these lands always remain
sub-merged at the time of rainy season where cultivation becomes very
difficult. It is, therefore, due to these reasons the volumes of production
for smaller two groups are very low and so the proportions of farmers
belonging to these groups disposing off kharif paddy or rice is also very
negligible.
An analysis of the marketing behaviour of the farmers reveals that
majority of the farmers sell their produce to the village traders (beparies),
rice millers, etc. instead of bringing them in the market places. For the
valley as a whole an aggregate of only 26 per cent farmers under study
bring their produce (paddy/rice) in the market centers for sale, whereas
60.33 percent farmers regularly sell at the door levels. This indicates that
out of the total quantum of marketed surplus market arrival of paddy or
rice is very negligible for which the farmers do not receive any
remunerative prices. This in turn becomes the cause of lower level of
marketed surplus. Interestingly, it is found that the highest percentage of
farmers who bring their produce in the market places belong to the
smallest group being as high as 41.38 per cent, while the same is only
13.33 per cent for the largest group which is the lowest. This reveals that
market arrivals of paddy (rice) decreases with the increase of size-
holdings. As against this there is an increasing relationship between door

200
Table-11
MARKETED SURPLUS AND SALES PATTERN OE EARMERS
Holding Size
Net Marketed Surplus as p.c. of output
P.C. of farmers sold rabi paddy/rice
P.C. of farmers sold KJiarif paddy/rice
P.C. of farmers sold in the market places
P.C. of farmers sell to middlemen at the door
level
Mean distance to the market places (km)
Marketing cost per quintal of output sold (Rs.)
Marketing cost as per cent of total costs
I 0
-1
hec
tare
0.52
52.87
8.05
41.38
28.74
2.98
12.35
0.93
01 -
2.0
hec
tare
r-<
19.38
65.22
18.48
25.00
50.00
3.44
8.23
1.14
III
01 -
3.0
h
ecta
re
<N
36.43
95.08
37.70
18.03
90.16
3.05
5.54
1.23
IV
3.0
1 h
ecta
re &
ab
ov
e
35.22
93.33
.._.
40.00
13.33
91.66
4.05
5.59
1.12
Ag
gre
gat
e
26.36
73.33
23.66
26.00
60.33
3.38
6.54
1.12
Source: Field Survey

201
level sales and size holdings. This is substantiated by the findings that
28.74 per cent farmers belonging to the smallest group, 50 per cent of
the second group, 90.16 per cent of the third group, and 91.66 per cent
of the largest group sell paddy or rice at their homes in the villages. It is
thus revealed that farmers possessing door selling behaviour are the
highest among the largest group and the lowest among the smallest
group. It can, therefore, be seen that small and marginal farmers of the
first two groups dispose off their produce mostly in the market centers.
However, this is not mainly for the purpose of receiving better prices but
because of the fact that the amount they sell is very small in quantity,
viz. 5 kg/ 10 kg/20 kg/ 50 kg, etc., for which they do not get customer in
their villages. Further the sale of paddy (without conversion into rice) in
small quantity in the market places is not customary in the study area
and therefore the small farmers convert paddy into rice and bring it to
the market. However, even in the market places they do not sell to the
ultimate consumers at maximum prices, but mostly to the middlemen,
i.e. dalals, commission agents, local beparies etc. It has been observed
that almost all the prevailing markets in the Barak Valley are fully or
partially occupied by the middlemen for whom the farmer-sellers are
always exploited. Due to this reason the price spread for paddy (rice) is
very high and producer's share in consumer rupee is quite low which
discourages the farmers to produce for market sales. With this we can
validate Rao's finding that high margins received by various
intermediaries involved in the crop marketing is the main reason for
having small producer's share in consumer rupee which causes
disincentives to the producer in generating marketed surplus (Rao, 1991-
92). But these small and poor farmers have no option rather to sell their
produce to the middlemen in the market at lower prices on account of
their immediate cash requirements.

202
In reverse case, a considerable number of farmers belonging to larger two
groups do not sell customarily in the market places, rather they dispose
off their produce to either beparies or rice millers or others. Reportedly
most of them sell paddy only instead of converting them into rice. They
are not interested to sell either paddy or rice in the market centers. This
is because they think that the cost of converting process of paddy into
rice and the cost of transportation to the market will be equal or almost
equal to the better prices which they would have received from the
market. This can be substantiated by Singhal's conclusion that farmers
averse to selling their produce in market centers, because the prices
received from middlemen are not much different from the prevailing
market price after adjusting for possible transport and marketing costs
(Singhal, 1989). Further it has been observed that majority of such
farmers are not commercial and they do not have the concept of cost-
benefit analysis due to lack of education. They are satisfied with the
prices slightly higher than the harvest price in the absence of proper
bargaining. Besides, nobody knows the actual prices of paddy prevailing
in the market, because there is neither standard system of paddy sales
in the marts or mandies, nor any uniform units of measurement across
the valley. As an outcome, these big farmers have to remain contended
with such door selling behaviour and the surplus they dispose off is not
mainly due to their commercial attitude rather due to more cultivable
lands under their possession, because their per hectare productivity is
found even lower than the smaller groups (Table - 6).
In addition to these, distance of the market places from the farm-
households and marketing charges are the factors which may be
considered responsible for lower quantum of market arrivals. An analysis
of this reveals that mean distance to the market places is about 3 km.
each for the first two groups (2.98 km for size class-I and 3.44 km for
size class-II). Similar case of mean distance is also found for the third

203
group showing 3.05 km, while for the fourth group it is 4.05 km. This
means that there is no significant variation in distances from the farms
to the market places among the size-groups. Since the average distance
is about 3 km up to size class-Ill, an average of only 1 km more distance
for the largest group is not a causative factor for discouragement to the
farmers while bringing their produce in the market centers. However, in
case of some individual farmers it is found that their households are
situated far away from the market places. Another problem faced by the
farmers is that for maximum time in a year the roads remain muddy or
sub-merged in flood waters due to which it is not only costly but also
difficult for them to bring their produce to the market. Therefore, for the
valley as a whole irrespective of the farm-sizes, the physically interrupted
communication system viz. Katcha or muddy roads, poor means of
transportation, less accessibility of farmers to market information and
inadequate market infrastructure have been the crucial factors
responsible for the small volume of market arrivals. However, in case of
small farmers who marketise the paddy or rice in small quantity and in
dry season (Dec-March), these factors are not influential. Because they
incur least costs of marketing on account of easy means of
transportation during the dry season. Most of them carry rice on head-
loads or with the help of bi-cycle or hired/owned hand-puller or hired
rickshaw/auto-rickshaw which involve less costs of marketing.
Sometimes small trucks like auto-truck are used to carry rice if the
amount is more subject to the financial capacity of the farmers and
favourable road condition.
Another usual character of selling behaviour found among the small and
marginal farmers is that most of them sell their produce just after the
harvest under unwritten agreements. This kind of sales takes place with
the local landlords, professional money-lenders, small employees and
businessmen who have the available cash money with them. During the

204
sowing season the poor farmers borrow money from them either to
purchase chemical fertilizers or pesticides or for their own consumption
purposes. They borrow with the contractual obligation that just after the
harvest they must sell paddy or rice to the lenders at a price much below
the prevailing market price. Such kind of sales behaviour is termed as
distress sales which are found common among the farmers belonging to
the first two groups.
It has, however, been observed that due to their higher retention power
to wait for better prices, most of the farmers belonging to larger two
classes dispose off their produce during mid-season or lean season.
These two seasons are naturally rainy seasons in the valley.
Consequently, the farmers of interior places face transportation
problems. Only those who are at the pucca road-side carry their produce
by 407-truck or auto-truck or hand-puller. Even some big farmers from
remote areas use bi-cycles or hand-pullers or boats especially at floods
with a view to sell their produce in the market places. It is because of
this troublesome job the farmers of remote areas have to remain satisfied
with door level sales of paddy or rice. Even those who are not from
remote areas are also contended with such door selling behaviour
because of their lack of commercial attitude and disinterest to process
the paddy into rice. On the other hand, traders and rice-millers persuade
the farmers to sell paddy (without converting into rice) to them. On their
part while purchasing paddy they come at the farm houses and borne
the entire costs of transportation of the produce. In this case, beparies
and small traders use hand-pullers, while rice-millers and big-merchants
use small trucks (if the road condition is favourable) while carrying out
the paddy from farmer's home.
A further analysis of the impact of marketing costs on market arrivals
reveals that marketing charge is not a factor influencing market sales of
205
paddy or rice. Table-11 shows that even the smallest group, showing the
highest percentage of farmers selling in the market centers, incur the
highest level of marketing costs to the extent of Rs. 12.35 per quintal of
paddy. The second group incurs the marketing costs of Rs.8.23 per
quintal, whereas the per quintal marketing costs for the third and the
fourth group are Rs.5.54 and Rs.5.59 respectively. This shows that in
spite of higher marketing costs of smaller two groups the percentage of
farmers selling rice in the market places belonging to these two groups is
higher (table-11). Though per quintal marketing costs for larger two
groups is lower, yet a very small percentage of farmers belonging to these
groups bring their produce in the market (table-11). A comparatively
lower level of marketing costs for larger two groups is not because of
cheap transportation and other marketing facility but because they sell
their produce at their home places where the entire marketing costs is
borne by the buyer himself. Only a few number of farmers belonging to
these groups dispose off their produce in the market places after
converting paddy into rice wherein the farmers themselves borne the
marketing charges. Therefore, marketing costs in the study area is not at
all a determining factor of market arrivals of paddy or rice either in case
of smaller groups or in case of larger groups of farmers.
Section -V.8: SEASONAL PRICES AND MARKETED SURPLUS
It has been hypothesized that price is one of the most important
determinants of marketed surplus of agricultural produces. Higher
remunerative prices provide incentives to the farmers to produce more
for sale with a view to earn higher returns. Conversely, lower prices
create disincentives to the farmers and they will be contended with lower
level of output which is only sufficient for their family consumption
206
needs. Since agricultural crops are seasonal in nature and their prices
also vary from season to season it is pertinent here to analyze marketed
surplus behaviour with respect to seasonal variation in prices. There are
three main seasons identified as related to the sales of paddy or rice in
the Barak Valley. These are:
(i) Post-harvest Season: It happens just after the crop harvest with
an extension of 2 /3 months,
(ii) Mid Season: It is the time period after 2 /3 months of the
harvest and before 2 /3 months of the next harvest,
(iii) Lean Season: The time period just before the harvest extending
to 3/4 months, which is otherwise called pre-harvcst period.
Naturally it is the post-harvest season during which the price of paddy
(rice) comes down at the lowest level since the aggregate supply happens
to be the maximum during the same season. This is because almost all
the small and poor farmers are in a rush to sell their produce in that
season for their immediate cash requirements. The price becomes higher
in the mid-season and reaches the peak level during the lean season.
An examination of the seasonal prices of paddy (rice) and the volume of
sales in different seasons reveals that both prices and sales are the
lowest during post-harvest season. The marketed surplus (net actual
sales) during post harvest season is found as low as 21.74 per cent of the
total marketed surplus in the valley. This lowest level of sales takes place
at the lowest price of Rs.493.00 per quintal of paddy. It is observed that
the volume of sales during this period is the lowest despite greater
tendency of small and marginal farmers to sell the produce. Since this
tendency is due to their cash requirements the lower prices are
responsible for lower level of net sales during the post harvest season.
The marketed surplus during mid-season is revealed as 37.59 per cent

207
which is much higher than post-harvest season at a better price of
Rs.555.00 per quintal. Whereas during lean-season the selling price
reached at the top level of Rs.600.00 per quintal at which the marketed
surplus of paddy takes place at the highest level of 40.67 per cent.
Table-12
SEASONAL PRICES AND SALES OF PADDY
Season
Selling Price of paddy
(Rs. per quintal)
Net Marketed
Surplus as p.c.
of total
Marketed Surplus
Post-harvest
Season
493.00
21.74
Mid Season
555.00
37.59
Lean Season
600.00
40.67
Source: Field Survey
Thus, it is realized that higher prices lead to higher level of sales
confirming the hypothesis that marketed surplus is an increasing
function of price. The level of marketed surplus increases from post-
harvest season to mid-season and further to lean-season with respect to
a rise in the price level. This positive response of marketed surplus to its
price change confirms the realization made by Kumar-Mruthyunjaya and
Reddy-Chengappa-Achoth that the response of marketed surplus of the
produce to its price changes is positive (Kumar-Mruthyunjaya, 1989,
Reddy-Chengappa-Achoth, 1995). The present nature of finding however
does not corroborate with the conclusion drawn by Kalpana Bardhan
that marketed surplus as a proportion of production as well as in

208
absolute terms shows negative response to changes in food grain price
(Bardhan, 1970).
The per cent share of marketed surplus during post-harvest season is
the lowest due to the poorest level of prices on the one hand, and on the
other greater retention power of the economically well off farmers
belonging to larger two groups. The rich farmers can wait for better
prices and so they do not sell just after the harvest. Except a few,
farmers of larger groups sell their produce either in mid-season or in
lean-season subject to their powers of retention. These farmers with the
ownership of large size of land achieve higher volume of production and
hence can offer more quantity for sale in the market. Therefore, it is
found that marketed surplus is higher when price is higher in the mid-
season and it becomes the highest when price reaches the highest. So, it
can be concluded that price is one of the most important determinants of
marketed surplus. It is due to the availability of paddy just after the
harvest the market demand for this by the poor farmers (Who have to
repurchase during lean season) is minimized. At the same time, almost
all the poor farmers are bound to sell their produce for their immediate
cash requirements. As a result, supply of paddy (rice) in the local
markets increases which brings down the prices in post-harvest season.
Due to this low price the rich farmers are averse to selling in the market
and consequently the marketed surplus becomes the lowest among all
other size-groups during the same period. But in the mid-season there is
small quantity of the produce left with small and marginal farmers to sell
in the market and some of them even starts repurchasing rice for their
own use from the market. Consequently, demand for rice or paddy rises
in the local markets and supply starts declining. The market price by
that time also rises which becomes attractive to the rich farmers and
hence there is higher level of marketed surplus in the mid-season.
During lean season, stock of the farmers gets reduced due to the

209
previous sale in the absence of any fresh production. Only those farmers
who have the highest power of retention can wait for this season with the
expectation of receiving higher prices for their produce. Again during lean
season there is a fear of shortage of supply in the market, because the
average farmers customarily dispose off their produce before the arrival
of lean season. On the other hand, the quantity demanded by the
repurchaser is also at the highest level. Consequently, the price rises at
the peak level which gives incentives to the farmers to dispose off the
amount of surplus left with them. Therefore, marketed surplus as a per
cent of total marketed surplus during the lean season is found to be the
highest at maximum level of prices.
An analysis of the seasonal sales behaviour of the farmers reflects that
percentage of farmers selling their produce during post-harvest season is
the highest among the smallest group. The proportion is 45.98 per cent
of the total farmers of the group. The percentage of farmers selling in the
mid-season is highest among the third group showing 63.93 per cent.
During lean season the highest percentage of farmers selling paddy (rice)
belong to the largest group constituting 70 per cent of the farmers in the
group. In the second group the percentage of farmers selling the produce
is 34.78 per cent each in the post-harvest season as well as in the mid-
season. This means that an equal percentage of farmers of this group sell
in both the seasons reflecting the absence of maximum concentration in
sales for a particular season. This implies that most of the small farmers
sell their produce during post-harvest season. Maximum farmers of the
second largest group sell in the mid-season. Whereas majority of the
farmers belonging to the largest group sell during the lean-season.
However, an aggregate figure for the valley as a whole reflects that
percentage of farmers selling in the mid-season is the highest. It is found
that farmers selling in the post-harvest season constitute 31 per cent of
the total farmers of all the groups, whereas for mid-season and lean-

210
season the same is 40.66 per cent and 31 per cent respectively. Thus
maximum farmers unde r s tudy have an inherent tendency to dispose off
their produce dur ing the mid-season.
One of the possible reasons for having maximum tendency of the farmers
to dispose off in the mid-season is the price factor. During mid-season
majority of the small and poor farmers are left with no surplus on
account of their general selling behavior in post-harvest season for
urgent cash requirement. Some of them who committed distress sales
s tart to repurchase during mid-season. As a resul t of this market
demand for paddy rises up , while in the absence of any fresh production
market supply comes down which ultimately lead to increasing price
level. This higher level of price a t t racts the farmers belonging to all size
groups who have disposal capacity to sell in the marke t during mid-
season. Some farmers with retention capacity even from smaller two
groups abs ta in themselves from post-harvest selling in order to receive
better price in the mid-season. Again, a lmost all the farmers belonging to
larger two groups have their general tendency to dispose off the produce
during mid-season. Some of the large and economically well off farmers
who attain the max imum power of retention wait for selling in the lean-
season. Because, they know very well tha t dur ing lean season
repurchases by the poor and small farmers will be maximum and sales
by medium-sized farmers will be minimum. Consequently, the paddy
prices reach to the maximum level which a t t ract such large and
economically well off farmers to sell at higher prices. However, even some
large farmers averse to take risk in selling during lean season by fearing
that if they are fail to sell their produce in the lean-season, they cannot
receive expected price in the next agricultural year for the same produce.
Because, the lean-season in agriculture is followed by the next post-
harvest season recording the lowest price. Hence, there is a convergence

211
Table-13
SEASONAL SALES, PRICES AND MARKETED SURPLUS
Size Class
Net Marketed Surplus as p.c. of output
P.C. of farmers sold in post-harvest season
P.C. of farmers sold in mid-season.
P.C. of farmers sold in the lean season
Mean price at which sold (Rs. Per quintal of
paddy)
Average expected prices at which the farmers want to sell (Rs. Per
quintal of paddy)
Mean prices at which the fanners repurchase (Rs.
Per quintal of paddy)
P.C. of farmers conscious about the
prevalent market prices
I 0
-1
hec
tare
0.52
45.98
19.54
3.45
473.00
628.00
546.00
28.74
II
1.01
-2
.0
hec
tare
19.38
34.78
34.78
15.22
513.00
633.00
545.00
35.87
III
2.01
-3
.0
hec
tare
36.43
16.39
63.93
55.74
542.00
654.00
551.00
67.21
IV
3.01
hec
tare
&
abov
e
35.22
18.33
56.66
70.00
554.00
708.00
550.000
75.00
Ag
gre
gat
e
26.36
31.00
40.66
31.00
521.00
656.00
548.00
48.00
Source: Field Survey

212
among the farmers of all the groups in general and medium-sized groups
in particular to dispose off their produce in the mid-season. It is due to
this fact the proportion of farmers selling in the mid-season is found to
be the highest, whereas the proportions of farmers selling in the post-
harvest season as well as in the lean-season are minimum.
All these reveal that price is a determining factor of marketed surplus
which is also confirmed by the positive relationship between marketed
surplus and prices according to size-class. It has been found that the
smallest group attains the lowest level of marketed surplus of 0.52 per
cent of output at the lowest price of Rs.473.00 per quintal of paddy. The
second group offers a higher quantity of marketed surplus of 19.38 per
cent at a higher price of Rs.513.00 and the third group sells a much
higher amount of 36.43 per cent at further better price of Rs.542.00 per
quintal. Though the largest group's marketed surplus is slightly lower
than the third group which receives the highest price of Rs.554.00 per
quintal, still it is far better than the first two groups. However, farmers of
all the classes are not satisfied with these prices, arguing that such
prices are not remunerative and do not cover the costs of production in
many cases. It is also observed that small farmers who incur high costs
of production would have nothing left with them as profit at such low
level of selling prices during post-harvest season. Since the small farmers
indulge in post-harvest selling, many of them are compelled to accept
losses instead of earning profit at such low prices. Therefore, it is the
prevailing system of low-priced marketing of paddy (rice) in Barak Valley,
which could be a possible factor for the absence of scientific methods of
cultivation and non-commercial mood of farmers and hence the
existence of lower quantum of marketed surplus in aggregate.
There is a strong support from the farmers' side to receive higher
remunerative prices than the prevailing price level. Based on the

213
information received from the selected farmers it; is found that size class-I
expects an average of Rs.628.00 per quintal of paddy, while the expected
price of size class-11 is Rs.633.00. This means that the expected levels of
prices for the first two groups are almost equal and lower than other two
groups, since both these groups indulge in post-harvest selling. The price
expectation by size class-Ill is Rs.654.00, whereas the same is Rs.708.00
for the largest class. Thus, there is considerable difference between price
expectations of larger two groups indicating that larger and larger groups
want to sell at better and better prices which vary from mid-season to
lean-season. For the valley as a whole the aggregate selling price is found
to be Rs.521.00 per quintal of paddy, whereas the aggregate expected
price of selling is Rs.656.00. This again confirms that farmers in the
valley get frustrated due to low price of their produce in each and every
season, which is quite a disturbing factor for generating marketed
surplus and increasing their sales. So, there is a scope of increasing the
levels of marketed surplus if and only if the selling prices are increased
up to the expected levels of the farmers.
But higher prices during mid-season and lean-season would deteriorate
the living condition of the poor farmers who indulge in distress sales.
These farmers possessing a common behaviour of selling their produce
during post-harvest season have to repurchase paddy or rice either in
mid-season or in lean-season. An examination of the percentage of
repurchase to total consumption reveals that the smallest group shows
the highest level to the extent of 24.05 per cent. The group next to the
smallest one shows 12.34 per cent as repurchase, while for the third and
the fourth group the same is only 1.93 per cent and 1.58 per cent
respectively. This shows that repurchase takes place mostly in case of
small and marginal farmers, and for large farmers it is almost said to be
nil. As the size class increases the proportion of repurchase declines and
vice-versa. Such a nature of finding corroborates with the observation
214
made by Gupta and Majid that the proportion of repurchases for family
consumption to the total paddy output declines with the increase in size
class (Gupta-Majid, 1965). The prices of repurchase for the first and the
second group have been detected as Rs.546.00 and Rs.545.00 per
quintal of paddy respectively, which are much higher than their selling
prices of Rs.473.00 and Rs.513 respectively.
This is the indication of their pathetic condition of living. However, for
the third and the fourth group the repurchase prices are Rs.551.00 and
Rs.550.00 respectively which are even less than their selling prices of
Rs.542.00 and Rs.554.00. Since the proportion of repurchases for larger
two groups are very little in amount and at lower prices than their selling
prices, any increase in the level of selling prices will not frustrate them
rather it will give incentives to them in generating more surplus.
Conversely, any increase in the price level particularly during mid-season
and lean-season will cause high costs of subsistence for the poor farmers
(who repurchase) which in turn discourage them to invest in agriculture
for maximizing marketed surplus.
Section -V.9: MARKETED SURPLUS AND THE PATTERN OF LAND
INPUT
According to the finding of G.P. Reddy, P.G. Chengappa and L. Achoth, it
is not the productivity but the expansion of area under the crop which is
the important determinant of marketed surplus (Reddy-Chengappa-
Achoth, 1995). More area brought under cultivation means more amount
of production which in turn causes higher quantum of marketed surplus
and vice-versa. It is a general perception that in subsistence agriculture
farmers who devote more land under cultivation will receive higher

215
volume of production if the productivity of land does not diminish. Due
to this higher production farmers will be able to generate more marketed
surplus on the condition that the level of farm consumption is up to the
satisfactory level. However, the same may not be true in case of small
and marginal farmers belonging to the first two classes, since these
farmers consume far below their satisfactory level of consumption which
is reflected in their deplorable condition of distress sales and
repurchases.
An analysis of the pattern of land input under paddy cultivation shows
that the smallest group owns only 55.62 hectare of cultivable land,
followed by the second group as 133.16 hectare. The third group has
153.36 hectare under its possession, while the largest group possesses
the highest amount of 325.33 hectare available for cultivation. However,
it is not the total available area owned by the farmers, but the proportion
of area devoted for paddy production which is considered as a
determining factor of production and hence marketed surplus. It has
been found that the smallest group devotes as high as 95.83 per cent of
their cultivable area for paddy, whereas it is the lowest for the largest
group being 83.03 per cent only. The group next to the smallest group
devotes 88.48 per cent followed by the third group which stands at 86.79
per cent. Therefore, it is revealed that there is an inverse relationship
between area devoted for rice production and size-class as against the
direct relationship between land availability and size-class. As the
holding size increases area devoted for paddy cultivation declines,
confirming a negative relationship between them. The smallest group
with the lowest amount of land ownership devotes the highest percentage
of area for cultivation which reflects their personal interest. Though the
proportion of area devoted by the second group is less than the first
group, it is somewhat better than the third group. The high level of
personal interest (in cultivation) of the farmers belonging to the first two
216
groups is also confirmed by their per hectare productivities which is even
better than the largest group (Table-6). But it is observed that in spite of
devoting time and energy for cultivation the farmers of smaller two
groups are not able to generate a good volume of marketed surplus. This
may be because of poor availability of cultivable land under their
possession. It is revealed that though the percentage of area devoted by
larger two groups is smaller than the first two groups, yet their marketed
surplus is far better than smaller two groups. This means that marketed
surplus of smaller two groups is not affected by the percentage of area
devoted, but by availability of cultivated area under their possession.
However, the marketed surplus of the third group is better than the
fourth group which may not be due to area available, but due to the
percentage of area devoted for rice cultivation. The third group,
possessing 153.36 hectares of land as against 325.33 hectare for the
fourth group, shows a higher level of net marketed surplus than the
fourth group. Whereas the percentage of area devoted by the third group
is found to be 86.79 per cent which is better than the fourth group
showing 83.03 per cent. However, the marginally lower marketed surplus
of the largest group compared to third group is not because of its lower
proportion of area devotion but because of their higher retention power
for sale purpose as reflected earlier.
The analysis reveals that total area available for cultivation increases
along with the increase in size class. It is also observed that marketed
surplus relates positively with the area available according to holding
sizes. However, the proportion of area devoted for paddy cultivation
declines with an increase in size class and shows an inverse relationship
between area owned and area devoted for paddy cultivation according to
size class. The possible explanatory factors for lower proportion of area
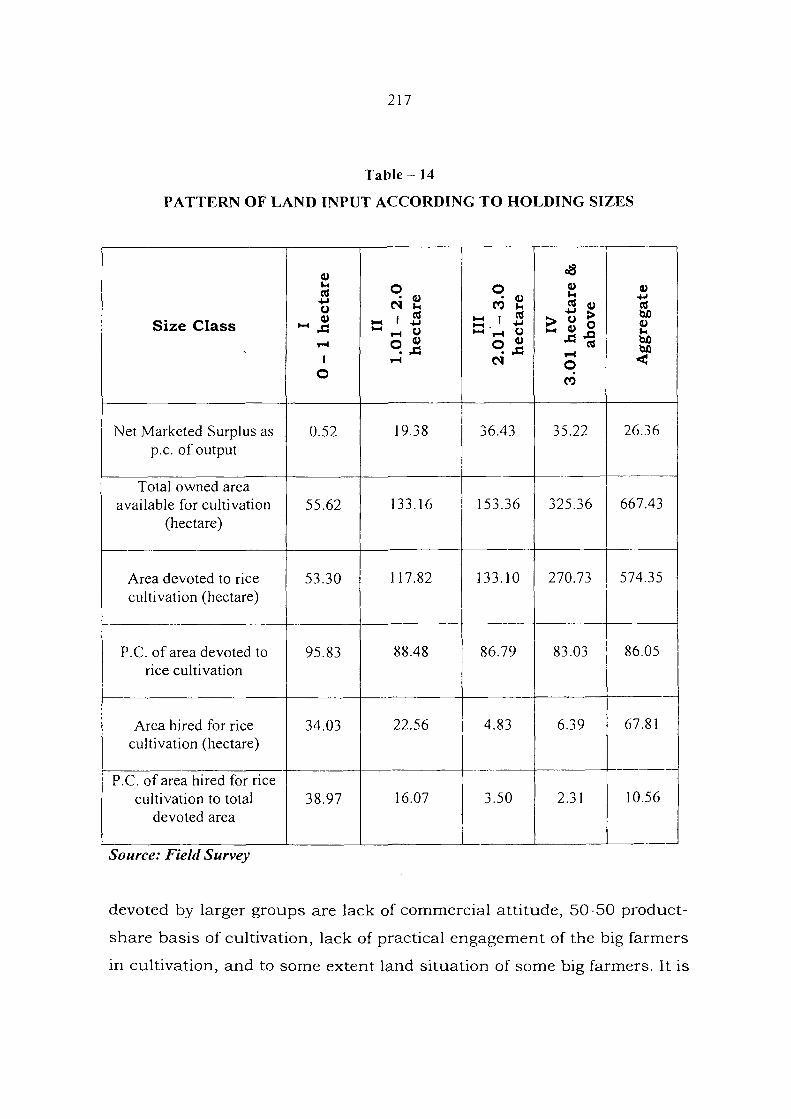
217
Table-14
PATTERN OF LAND INPUT ACCORDING TO HOLDING SIZES
Size Class
Net Marketed Surplus as p.c. of output
Total owned area available for cultivation
(hectare)
Area devoted to rice cultivation (hectare)
P.C. of area devoted to rice cultivation
Area hired for rice cultivation (hectare)
P.C. of area hired for rice cultivation to total
devoted area
I 0
-1
hecta
re
0.52
55.62
53.30
95.83
34.03
38.97
II
1.01
-2
.0
hecta
re
19.38
133.16
117.82
88.48
22.56
16.07
2.0
1
-3.0
h
ecta
re
36.43
153.36
133.10
86.79
4.83
3.50
IV
3.0
1 h
ecta
re &
ab
ov
e
35.22
325.36
270.73
83.03
6.39
2.31
Ag
gre
gat
e
26.36
667.43
574.35
86.05
67.81
10.56
Source: Field Survey
devoted by larger groups are lack of commercial attitude, 50-50 product-
share basis of cultivation, lack of practical engagement of the big farmers
in cultivation, and to some extent land situation of some big farmers. It is

218
inferred that many of the farmers belonging to larger size groups do not
keep them personally engaged in cultivation and let their plots to be
cultivated by small and poor farmers on such 50-50 product-share basis.
In this way sometimes they do not get share cultivators at the right time
due to which some portion of their total area remain uncultivated. They
are not even interested to cultivate by themselves either because of non-
farm business or because of apathetic and non-commercial attitude.
Moreover, some cultivable areas belonging to large farmers situated in
interior and low lying areas having poor fertility level which often the
farmers do not cultivate. It is because of these reasons the proportion of
area devoted for cultivation by larger size groups is relatively lower. In
contrast, small farmers with small-scale ownership of cultivable area put
their maximum possible effort in bringing all the available areas under
cultivation. In absence of any such non-agricultural sources of income
they keep themselves personally engaged in cultivation with their
personal interest. Because they know that paddy cultivation is their
single means of livelihood on which their survival and economic
condition depend. Hence they put every effort in cultivating the total
available land under their possession even if it is located in interior and
low lying areas. Due to these reasons the proportion of area devoted by
smaller groups is relatively better than larger groups. It is therefore
because of the above explanatory factors proportion of available area
devoted for paddy cultivation declines with respect to size class.
Therefore, it is not the proportion of area brought under cultivation but
the area available under the crop which plays important role in
determining marketed surplus of paddy. This nature of finding supports
the observation made by B. Kumar and S.K. Mishra that the area under
particular crop has significant role in determining the marketed surplus
of t h a t particular crop directly (Kumar-Mishra, 1985). It also goes in
conformity with the conclusion drawn by M. Chattopadhyay and I. Sen

219
that marketable surplus of any subsistence crop depends on the per
capita land availability under that crop (Chattopadhyay-Sen, 1988).
Out of the total available area for paddy cultivation in the Barak Valley it
has been estimated that an aggregate of 86.05 per cent land is brought
under cultivation. However, it is due to the absence of scientific
cultivation, frequent floods and droughts, as well as illiteracy and
ignorancy of the- farmers that the valley's present pattern of marketed
surplus is not satisfactory. Barak Valley would be a potential area for
generating sufficient amount of marketed surplus if adequate funds are
available to the poor farmers for facilitating them to avail more cultivable
lands, besides using scientific tools and techniques, chemical fertilizers
and pesticides on the one hand, and on the other introduction of the
motivational campaign for conducting agriculture on commercial lines
with proper marketing facilities and price incentives. Since the small and
marginal farmers are always in need of cash it will be very convenient to
encourage them to conduct their business on commercial lines by
providing them all the need-based facilities during the process from
production till marketing of the produce. But for rich farmers belonging
to larger two groups proper motivation is required either with attractive
price incentives or with the supply of low cost modern inputs.
This will certainly help them to change their attitude towards commercial
lines of cultivation. This is important because such farmers with the
possession of large amount of cultivable lands (potential for generating
higher marketed surplus than the present level) devote comparatively a
less proportion of area than smaller two groups. More particularly it is
the largest group in our study which shows the lowest ratio of area
devoted with ownership of the highest amount of cultivable lands. A
possible explanatory factor for this is the leasing out of land by the rich
farmers to the small and poor farmers. Because, in some cases the

220
members of the economically well off farm family earn incomes not only
from agriculture but also from other non-agricultural sources, due to
which they remain busy in non-farm sector. They have to either lease out
the land or perform product-share cultivation mostly with the poor and
marginal farmers. This is reflected in the proportion of area hired for rice
cultivation to total devoted area with respect to size-class. It has been
realized that the proportion of area hired by the smallest group is the
highest to the extent of 38.97 per cent of the total area devoted by the
group. Following this the second group devotes 16.07 per cent, as hired
land, whereas for the third and the largest group the proportion is only
3.50 per cent and 2.31 per cent respectively. Thus, it is revealed that the
proportion of hired land devoted to rice cultivation is the lowest in case of
the largest group followed by the third group. This shows that large
farmers in general do not hire land for cultivation except few. However,
for smaller groups the magnitude of land hiring almost constitutes a
characteristic feature of their land input. The pattern of land hiring also
indicates that available lands which cannot be devoted by the big farmers
goes at the hands of small farmers either through product-share
cultivation or through lease out system. Often the rich farmers ask the
small and poor farmers to cultivate their lands on unwritten agreement
of 50-50 share of the crop after the harvest.
It is not that large farmers do not hire lands at all. A few of them who
conduct cultivation on commercial basis undertake land hiring for
cultivation but in different style. They do not hire the land on 50-50
share of the crop, rather they lend money to the needy farmers with the
agreement of mortgaging the land to them. This agreement is signed on a
stamped paper with a declaration by the borrower that until and unless
he is able to repay the debt, the land would remain under the possession
of the lender. In this way large farmers hire the land and devote for
cultivation. It is thus found that there is an absolute difference in the

221
ways of hiring the land between the smaller two groups and larger
groups. Since land hiring by the small farmers is on purely temporary
basis (based on the sympathy of land owners) with the agreement of fifty-
fifty crop share, these farmers do not take much interest in cultivating
the hired lands due to which marketed surplus for larger groups is
hampered to some extent. Nonetheless, land hiring in case of large
farmers is very negligible both in actual figures as well as in percentages
and so this is not a causative factor for influencing their levels of
marketed surplus. The only factors are their disinterest in commercial
cultivation which is also reflected in their lower proportions of area
devoted (Table-14) and lower productivity reflected in their per hectare
productivities (Table-6).
Section - V.10: MARKETED SURPLUS, LITERACY AND SAVING-INCOME
PATTERN OF THE FARMERS
Literacy and the level of education of the farmers have been considered
as important indicators of marketed surplus. They are expected to be
aware about the prevailing prices and norms and procedures for taking
loans from the institutional sources at subsidized rate for production
purpose. As a result, it is possible for them to introduce scientific
methods of production along with the use of irrigation facility, HYV
seeds, chemical fertilizers and pesticides. By this their per hectare and
per capita productivities will be higher which would maximize their
volume of marketed surplus. S. Subhas, P. G. D. Bino and Ramanathan
maintain that education is the crucial factor determining the efficiency
variations in rice production (Subhas-Bino-Ramanathan, 2004).
Therefore, the study is based on the hypothesis that farmers with
222
education and farming knowledge are capable of generating higher
marketed surplus, unlike the farmers with no education.
It is revealed that an average of 59.33 per cent of the sample farmers
throughout the valley is literate. Farmers who acquire formal education
ranging from primary to intermediate levels are categorized as literate
farmers. It has been found that an extent of 52.87 per cent farmers of
size class-I and 57.61 per cent farmers of size class-11 have formal
education. Whereas for size class-Ill literate farmers constitute 62.29 per
cent and the same for the largest group is 68.33 per cent. It is thus
observed that as the size class increases the percentage of literate
farmers of the group also increases showing a positive relationship
between farmer's literacy and size class. Similarly the marketed surplus
as a proportion of output also records an increasing trend with respect to
the size group from the lowest to the largest group. The lowest group
shows only 0.52 per cent of output as marketed surplus followed by the
second group as 19.38 per cent. The marketed surplus for the third and
the largest group are observed as 36.43 per cent and 35.22 per cent
respectively. Hence there exists a positive relationship between literacy of
the farmers and marketed surplus.
Table-15 shows that the first group with the lowest literacy rate also
offers the lowest level of marketed surplus. The marketed surplus of the
second group is much better than the first group with higher ratio of
literate farmers. Similar is the case for the third group which shows
better marketed surplus with higher ratio of literate farmers than the
first two groups. However for the largest group the same does not hold
good. The group with the highest ratio of literacy shows the level of

223
Table- 15
LITERACY LEVEL AND MARKETED SURLUS OF THE FARMERS
Size Class
Net Marketed Surplus as p.c. of output
Number of literate farmers
P.C. of literate farmers to total farmers of the group
Number of higher educated farmers
P.C. of higher educated farmers to total farmers of
the group
I 0
-1
hec
tare
0.52
46
52.87
02
2.29
II
1.01
-2
.0
hec
tare
19.38
53
57.61
09
9.78
III
2.01
-3
.0
hec
tare
36.43
38
62.29
07
11.48
IV
3.01
hec
tare
&
abov
e
35.22
41
68.33
17
28.33
To
tal/
Ag
gre
gat
e
26.36
178
59.33
35
11.66
Source: Field Survey
marketed surplus as 35.22 per cent which is less than the third group.
But this is mainly because of the maximum power of retention by the
largest group for sales purpose. Therefore, it is revealed that literacy of
the farmers certainly affect the level of marketed surplus of all the size
groups. Moreover, since marketed surplus of the largest group is not
much lower than the third group we can deduce a positive association

224
between literacy of the farmers and marketed surplus according to size
class. And since we have already confirmed a positive association
between per capita productivity and marketed surplus per capita (table-
6) we can substantiate here the findings drawn by Mittal-Kumar,
Siddiqui-Ahmed and Ghosh revealing the positive relationship between
literacy and crop productivity (Mittal-Kumar, 2000, Siddiqui-Ahmed,
2004, and Ghosh, 2006). However, it is seen that the magnitude of
variation in literacy ratio from size-class to size-class is almost equal for
each and every class, as against the wide variations in marketed surplus
as a proportion of output according to size class. This leads us to
conclude that though farmer's literacy has positive association with
marketed surplus it does not play crucial part in determining the
marketed surplus level of paddy in Barak Valley.
Further, in recent times due to the spread of higher educational
institutions all over the valley some members of the farming families
have access to higher education. The study defines higher education as
the pursuance of under-graduate and post-graduate degrees by the
members of farm households either in general or in technical division. It
is considered that persons with higher education in the farming sector
are supposed to be efficient in improving their per capita and per hectare
productivities than the mere literate or matriculate or intermediate ones.
It is revealed that merely 2.29 per cent farmers of the smallest group
attain higher education which is the lowest against the highest figure of
28.33 per cent as shown by the largest group. The proportions of higher
educated farmers for the second and the third group are 9.78 per cent
and 11.48 per cent respectively. This again shows a positive relationship
between higher education and marketed surplus in accordance with the
size class except for the largest group. The proportion of higher educated
farmers for the largest group is more than double the third group,

225
whereas its marketed surplus is lower than the latter group. This
indicates that for the largest group farmers' access to higher education
does not influence the level of marketed surplus. A possible factor for
this is that the farm members with higher education belonging to this
particular group are mostly engaged in non-agricultural practices to earn
their livelihoods. They do not have enough time to carry out their
agricultural activities and many of them undertake cultivation through
crop sharing basis with the small farmers. But the same is not true in
case of the third group. Farmers having higher education in the third
group keep themselves engaged mostly in agricultural sector and hence
their marketed surplus reaches the highest level among all the groups.
Therefore, it is not merely the higher education of the farmers but the
direct engagement of higher educated farmers in agriculture which plays
crucial part in determining the level of marketed surplus.
The engagement level of educated farmers in agriculture and
non-agricultural sector is reflected in the earning pattern of the
farmers (Table-16). It is found that the income of the third group from
agricultural source is 42.99 per cent of their total income and from non-
agricultural sources it is 18.90 per cent of the total non-agricultural
incomes of all the groups. This reveals lower engagement of farmers of
the group in non-agricultural sector. Whereas, the income of the largest
group from agricultural sector is slightly higher than the third group
showing 44.02 per cent and from non-agricultural sources the same is
34.35 per cent. This is the indication of higher level of farmers'
engagement among the fourth group in non-agricultural activities in
comparison to the third group. Since the level of marketed surplus for
the first two groups is lower than larger groups, their agricultural
incomes are also low, revealing 18.35 per cent for the smallest group and
17.21 per cent for the second group. However, the non-agricultural

226
incomes of the second group is appreciable showing even better than the
third group, but the same is extremely small in case of the first group.
Table- 16
INCOME-EXPENDITURE AND SAVING PATTERN OF THE FARMERS
Size Class
Net Marketed Surplus as p.c. of output
P.C. of income earned from agriculture
P.C. of income earned from sources other than agriculture to total non-
agricultural incomes of all the groups
P.C. of income spent on food, cloth, health,
electricity and daily livings
P.C. of income spent on education
Saving as P.C. of income of the group
I 0
-1
hecta
re
0.52
18.35
12.07
96.27
7.67
Nil
n 1.
01
-2.0
h
ecta
re
19.38
17.21
33.68
46.21
8.64
5.15
III
2.0
1
-3.0
h
ecta
re
36.43
42.99
18.90
48.31
7.61
44.08
IV
3.0
1 h
ecta
re &
ab
ov
e
35.22
44.02
34.35
33.21
7.97
58.82
To
tal/
Ag
gre
gate
26.36
33.85
100
46.29
8.05
45.66
Source: Field Survey

227
The incomes from non-agricultural sources for the smallest and the
second group is 12.07 per cent and 33.68 per cent of the total non-
agricultural incomes of all the groups respectively. This might be the
reason due to which distress sales of the second group is lower than the
first group and consequently the net marketed surplus of the former
group is much better than the latter.
The saving pattern of the farmers is also delineated in the table-16 which
is being computed after deducting total consumption expenditures from
their total incomes. The total expenditure comprises of expenditure on
food, cloth, electricity, health and daily livings, as well as expenditure on
education for the family members of the farmers. It has been realized
that the costs of living (expenditure on food, cloth, health, electricity and
others) for the first group is the highest, as a proportion of their income
which is to the extent of 96.27 per cent. In addition to this the group's
educational expenditure is 7.67 per cent of their income. Thus the total
expenditure exceeds their level of income and so there is zero saving
shown by the smallest group.
There is not much difference between the costs of living and between the
expenditures on education of the second and the third group. The
proportion of income spent on food, clothing, health, electricity and daily
livings constitute 46.21 per cent for the second group and 48.31 per cent
for the third group, showing little difference between the costs of living of
the two groups. Further, the proportion of income spent on education by
the second group and the third group is 8.64 per cent and 7.61 per cent
respectively. This again shows a minor difference between educational
expenditures of the two groups. But since the total incomes (both
agricultural and non-agricultural) of the third group is far better than the
second group, its saving is also better showing 44.08 per cent of its total
income against the saving of 25.15 per cent for the second group. It is

228
interesting to note here that though marketed surplus for the third group
is at the highest level, yet its total income is less than the largest group.
This is, however, not because of small earnings of the group from
agriculture but because of poor earnings from non-farm sector which
results in its lower level of saving in comparison to the largest group. The
saving of the largest group is 58.82 per cent of its income which secures
the highest position among all other groups.
However, this highest level of saving of the largest group does not give
them stimuli to generate more marketed surplus and hence their level of
marketed surplus is relatively less than the third group. Similarly the
saving level of the second group docs not encourage their marketed
surplus. This is due to the fact that per cent share of incomes from non-
agricultural sector both for the second and the fourth groups is much
better than the first and the third groups. Thus the higher saving level of
these two groups is mainly due to the contribution of non-agricultural
incomes. Since their savings are not as a result of effective contribution
by their agricultural incomes, they do not encourage the farmers to
invest in agriculture for increasing their levels of marketed surplus.
Though the smallest group earns income from agricultural sector
equivalent to the second group, but due to its poor earnings from non-
agricultural sector the group has zero saving which indicates no capital
is available to them for investment in maximizing the quantum of
marketed surplus. It is only the third group whose saving is generated
mostly from their incomes received from agriculture. This in turn
inspires the farmers belonging to this group to invest their capital in
achieving higher quantum of marketed surplus. As a result, marketed
surplus of this particular group is found to be the highest to the extent of
36.43 per cent of output among all the groups.

229
Our analys is t h u s reveals that farmer's response of marketed surplus is
positive to both price and non-price factors except retention factor. The
seasonal prices of rice have positive association with marketed surplus in
accordance of size class . Similarly, the non-price factors like paddy
output , profit margin of the farmer-sellers, area availability under paddy
crop, a s well a s literacy and education level of the farmers have positive
relat ionship with marketed surp lus according to size groups. The study
however t raced a negative association between marketed surplus and
retent ions for farm consumpt ion and seed requirement , besides finding a
direct relat ionship between marketed surp lus and retention for sales
purpose. Finally, the saving-income pattern of the farmers reflects that
saving from agricultural income encourages farmers to generate more
marketed su rp lus , whereas the saving from non-agricul tural income does
not work a s a sensitive factor in raising the level of marketed surp lus .
References:
Bezbaruah, M.P. and Roy, Niranjan (2002): Factors Affecting Cropping Intensity
and Use of Fertilizers and High-Yielding Variety Seeds in Barak Valley, Indian
Journal of Agricultural Economics, Vol. 57, No. 2, April-June.
Bardhan, Kalpana (1970): Price and Output Response of Marketed Surplus of
Foodgrains - A Cross-Sectional Study of Some North Indian Villages, American
Journal of Agricultural Economics, Vol.52, No.l.
Chattopadhyay, M. and Sen, lpsita (1988): Marketable Surplus and Size-Classes
of Holdings, Economic and Political Weekly, December.
Field Survey (2005-06): Conducted by the researcher through personal interview
method in the Barak Valley of South Assam.

230
Ghosh, Madhusudan (2006): Regional Convergence in Indian Agriculture, Indian
Journal of Agricultural Economics, Vol.61, No.4. October-December.
Gupta, S.C. and Majid, A. (1965): Producer's Response to Changes in Prices and
Marketing Policies - A Case Study of Sugarcane and. Paddy in Eastern U.P., Asia
Publishing House, Bombay.
Krishna, Raj (1965): The Marketable Surplus Function for a Subsistence Crop. An
Analysis with Indian data, The Economic Weekly, February, Vol. 1 7.
Kumar, B. and Mishra, S.K. (1985): Determinants of Regional Marketed Surplus of
Agricultural Commodities - A Case Study of Gaya District, Bihar, The NEHU
Journal of Social Sciences and Humanities, Vol. HI (3).
Kumar, Praduman and Mruthyunjaya (1989): Price Policy and Marketed Surplus
of Paddy and Wheat in India, Indian Journal of Agricultural Economics,
Vol.44, No.4, October-December.
Mittal, Surabhi and Kumar, Praduman (2000): Literacy, Technology Adoption,
Factor Demand and Productivity—An Econometric Analysis, Indian Journal of
Agricultural Economics, Vol.55, No.3, July—September.
Narayanmurthy, A. (2000): Farmers' Education and Productivity of Crops—A New
Approach, Indian Journal of Agricultural Economics, Vol.55, No.3, July—
September.
Prasad, Jagdish (1989): Marketable Surplus and Market Performance - A Study
with Special Reference to Muzaffarpur Foodgrain Market in Bihar, Mittal
Publications, Delhi.
Pradhan, Rudra Prakash (2003): Agri-Infrastructure and Modem Farm Practices—
Their Impact on Agricultural Productivity, Indian Journal of Economics,
Vol.LXXXIV, Part-2, No.333, October.
231
Reddy, G.P., Chengappa, P.O. and Acholh, L. (1995): Marketed Surplus Response
of Millets—Some Policy Implications, Indian Journal of Agricultural
Economics, Vol.50, No.4, October—December.
Rao, TV. Chandrasekhar (2004): Aggregate Agricultural Supply Response in
Andhra Pradesh, Indian Journal of Agricultural Economics, Vol.59, No.l,
January—March.
Reddy, P. Prudhuikar (1997): An analysis of Inter-Regional and Temporal
Variations of Costs, Productivity and Sources of Growth of Paddy in Andhra
Pradesh, Indian Journal of Agricultural Economics, Vol.52, No.3, July -
September.
Rao, N. Venkata (1991-1992): Production Trends and Marketing of Pineapple in
Meghalaya, Journal of the North-Eastern Council, Vol. XIII & XIV, No.4&l,
October-December, 1991 & Jan-March, 1992.
Sengupta, Keya (1998): Behavioural Pattern of Marketed Surplus in the Barak
Valley of South Assam, Agricultural Situation in India, October.
Said, Fatimah, Said, Saad Mohd and Ishak, Nur Annizah (2006): Malaysian.
Agricultural Sector - Sources of Growth, Journal of Rural Development, Vol.
25, No. 2, April-June, National Institute of Rural Development, Hyderabad,
Singhal, A.K. (1989): Agricultural Marketing in India, Anmal Publications, New
Delhi.
Siddiqui, S.H. and Ahmed, Mumtaz (2004): Levels of Agricultural Development in
Uttaranchal, Indian Journal of Regional Science, Vol.XXXVI, No. 2
232
Subhas, S., Bino Paul CD. and Ramanathan (2004): Technical Efficiency in Rice
Production -An Application of Stochastic Frontier Analysis, Indian Journal of
Regional Science, Vol.35, No.l.
Thakur, D.S., Lai, H., Thakur, D.R., Sharma, K.D. and Saim, A.S. (1997): Market
Supply Response and Marketing Problems of Farmers in the Hills, Indian
Journal of Agricultural Economics, Vol. 52, No.l, January- March.
Upender, M. (1 990): Marketable and Marketed Surplus in Agncullure-A Study at
Farm Land, Mitlal Publications, New Delhi.
u##D#tiiiutii<timmt!uutuimtini;ttiiHmuu