Embed Size (px)
Citation preview

168
CHAPTER V
DATA ANALYSIS AND INTERPRETATION OF THE STUDY
5.1. Introduction
5.2. Scope of Analysis
5.3. Profile Analysis
5.3.1. Employee's position
5.3.2. Gender
5.3.3. Educational Qualification
5.4. Universal Analysis
5.4.1. A comparative study between the actual score and expected score
regarding components qualitative characteristics of financial reporting
in Indian banks.
5.4.2. A comparative study between the public and private sector banks
regarding components qualitative characteristics of financial reporting
information.
5.4.3. A comparative study between the public and private sector banks
regarding the compliance with RBI prudential norms.
5.4.4. A comparative study between the public and private sector banks
regarding the compliance with accounting standards.
5.5. Multiple Regression Analysis
5.5.1. Impact of RBI prudential norms on qualitative characteristics of
financial reporting information in Indian banks.
5.5.2. Impact of Accounting Standards on qualitative characteristics of
financial reporting information in Indian banks.
5.6. Conclusive Analysis
5.6.1. A comparative study between the actual score and expected score
regarding the qualitative characteristics of financial reporting in Indian
banks.
5.6.2. A comparative study between the public and private sector banks
regarding the qualitative characteristics of financial reporting
information.
5.7. Conclusive Universal Analysis
5.7.1. Actual score and expected score for the quality of financial reporting
information in Indian banks.
5.7.2. Quality of financial reporting information between public and private
sector banks in Indian
5.8. Conclusive Regression Analysis
5.8.1. Impact of the RBI prudential norms on quality of financial reporting
information in banks.
5.8.2. Impact of Accounting Standards on quality of financial reporting
information in banks
5.9. Conclusion

169
CHAPTER V
DATA ANALYSIS AND INTERPRETATION OF THE STUDY
5.1. Introduction
The present research investigates the qualitative characteristics of financial
reporting information system in Indian banking industry, a comparative study of public
and private sector banks. This chapter attempts to analyze and interpret the data
intended to determine and measure the quality of financial reporting information based
on the perceptions of top managers, senior managers and accountants. The survey helps
to: (i) identify gaps between the actual score and expected score regarding the quality of
financial reporting information by Indian banks; (ii) identify the difference between the
public sector banks and private sector banks regarding the quality of financial reporting
information; (iii) examine the impact of RBI prudential norms on quality of financial
reporting information in banks and (iv) examine the impact of Accounting Standards on
quality of financial reporting information in banks.
5.2. Scope of Analysis
The primary data required for the present study were collected from top managers,
senior managers and accountants in the public and private sector banks. Structured
questionnaire was developed for collecting the data from the sample respondents on
their perceptions about the qualitative characteristics of financial reporting information,
RBI prudential norms, and Accounting Standards related to financial reporting
information by banks.
The scope of analysis of the empirical research included profile analysis,
universal analysis, multiple regression analysis, and conclusive analysis with regard to
qualitative characteristics, RBI prudential norms, and Accounting Standards of financial

170
reporting information in banks. The analysis and interpretation of data covering the
above dimensions have been presented below.
5.3. Profile Analysis
Profile analysis covers three variables viz. employee's position; gender and
educational qualification.
5.3.1. Employee's position
The employee working position in the banks plays very important role in
enhancing or decrease the quality of financial reporting information. The primary data
required for the present study were collected from top managers, senior managers, and
accountants in the public and private sector banks, because this group of employee more
than related and within reach of financial information. Table 5.1 and Chart 5.1 present
the status of the sample respondents numbering 465.
Table No.5.1
Classification-Based on Position
Position Sector Banks
Total Public Private
Top Manager Nos. 94 22 116
Per cent 25% 24% 25%
Senior Manager Nos. 93 22 115
Per cent 25% 24% 25%
Second manager or Accountant
Nos. 188 46 234
Per cent 50% 52% 50%
Total Nos. 375 90 465
Per cent 100 100 100
Source: Filed Survey

171
Chart No.5.1
Response Rate of Employee's Position
Majority of the respondents were of public sector banks and the sample
respondents numbering 375 and representing 80% of total sample respondents. The first
group of the respondents included 94 top level managers which encompasses 25% of
the total sample respondents of public sector banks. Next in the respondents were 93
senior managers and comprises 25% while the third respondents were second level 188
managers or accountants which cover 50% of the total number of respondents from
public sector banks.
In this study 90 respondents were from the private sector banks, representing 20
% of total sample respondents. The first group of the respondents was 22 top managers
representing 24% of the total number of respondents of private sector banks. The
second group of the respondents included 22 senior managers representing 24% and the
third group of the respondents comprises 46 second managers or accountants
representing 52% of the total number of respondents of private sector banks.
Top managwer
25%
Senior Manager
25%
Second manager or Accountant
50%

172
5.3.2. Gender
Table 5.2 and Chart 5.2 present the gender status of the sample respondents by
classifying than on the basis of gender.
Table No.5.2
Classification-Based on Gender
Gender Public Sector Banks Private Sector Banks
Total Top Manager
Senior Manager
Second manager
Top Manager
Senior Manager
Second manager
Male Nos. 84 85 161 15 17 33 395
Per cent
89% 91% 86% 68% 77% 72% 85%
Female Nos. 10 8 27 7 5 13 70
Per cent
11% 9% 14% 32% 23% 28% 15%
Total Nos. 94 93 188 22 22 46 465
Per cent
100% 100% 100% 100% 100% 100% 100%
Source: Filed Survey
Chart No.5.2
Response Rate of Gender
Majority of the respondents were males including 395 representing 85% of the
total sample as against 70 female representing 15%. Among male bankers, in the public
sector banks the percent of top managers, senior managers and accountants stood at
89%, 91% and 86% respectively, while in the private sector banks the percent of top
managers, senior managers and accountants stood at 68%, 77% and 72% respectively.
Male 85%
Female15%

173
Amid female, in the public sector banks the percent of top managers, senior
managers and accountants stood at 11%, 9% and 14% respectively, while in the private
sector banks the percent of top managers, senior managers and accountants stood at
32%, 23% and 28% respectively.
5.3.3. Educational Qualification
Education is one of main factors to help the employee for better understanding of
the situation and decision making. Level of the education can change the employee’s
attitudes, efficiency and supple in the working environment. It leads to update, learning
and adjusts in the changing of the technology and the prudential norms based banking
sector. Table 5.3 and Chart 5.3 highlight the grouping of respondents based on
educational qualification.
Table No.5.3
Classification- Based on Education
Gender Public Sector Banks Private Sector Banks
Total Top Manager
Senior Manager
Second manager
Top Manager
Senior Manager
Second manager
Bachelor Nos. 44 47 101 2 4 16 231
Per cent 47% 51% 53% 9% 18% 35% 50%
Master Nos. 21 19 35 8 9 14 92
Per cent 22% 21% 18% 36% 41% 30% 20%
Professional Nos. 25 19 40 9 7 12 110
Per cent 27% 21% 21% 41% 32% 26% 23%
Other Nos. 4 7 13 3 2 4 32
Per cent 4% 7% 8% 14% 9% 9% 7%
Total Nos. 94 92 189 22 22 46 465
Per cent 100% 100% 100% 100% 100% 100% 100%
Source: Filed Survey

174
Chart No.5.3
Response Rate of Educational Qualification
Majority of the respondents were bachelor's degree holders and their number
stood at 231 representing 50% as against professionals numbering 110 and representing
23%, master's degree holders numbered 92 and represented 20 % while others
numbered 32 and represented 7%. Among bachelors, in the public sector banks the
percent of top managers, senior managers and accountants stood at 47%, 51% and 53%
respectively, while in the private sector banks the percent of top managers, senior
managers and accountants stood at 9%, 18% and 35% respectively.
Amidst professionals, in the public sector banks the percent of top managers,
senior managers and accountants stood at 27%, 21% and 21% respectively, while in the
private sector banks the percent of top managers, senior managers and accountants
stood at 41%, 32% and 26% respectively. Among the masters, in the public sector
banks the percent of top managers, senior managers and accountants stood at 22%, 21%
and 18% respectively, while in the private sector banks the percent of top managers,
senior managers and accountants stood at 36%, 41% and 30% respectively.
Bachelor50%
Master20%
Professional23%
Other7%

175
Amid others, in the public sector banks the percent of top managers, senior
manager and accountants stood at 4%, 7% and 8% respectively, while in the private
sector banks the percent of top managers, senior managers and accountants stood at
14%, 9% and 9% respectively.
5.4. Universal Analysis
The universal analysis encompasses the perceptions of all the sample respondents
about; gap between the actual score and the expected score regarding the component of
qualitative characteristics of financial reporting in banks and difference between the
public sector banks and private sector banks regarding the component of qualitative
characteristics of financial reporting.
5.4.1. A Comparative Study between the Actual Score and Expected Score
Regarding the Components of Qualitative Characteristics of Financial
Reporting Information in Indian Banks.
Relevance is one of the two fundamental qualitative characteristic of financial
reporting information. Relevance was analyzed with two components: predictive value -
containing 9, and confirmatory value- containing 5 variables.
Predictive value in measuring relevance is highlighted in Table 5.4 and Chart
5.4, which presents the perceptions of all the sample respondents. Predictive value was
tested with 9 variables. The total Mean and SD values for actual score stood at 3.74 and
0.41 respectively, the total Mean and SD values expected Score stood at 4.02 and 0.50
respectively with a gap score of 5.6 percent.

176
Table No.5.4
Actual score and expected score for Predictive value of financial reporting information
Qualitative characteristics of financial reporting information
Actual Score Expected Score Gap
Mean SD Per cent
Mean SD Per cent
MD Per cent
Predictive value 3.74 0.41 74.8 4.02 0.5 80.4 0.28 5.6
Estimate of profits and losses 3.45 0.582 69.0 3.78 0.692 75.6 0.33 6.6
Non Financial Information 3.97 0.556 79.4 4.05 0.617 81.0 0.08 1.6
Forward looking information 4.55 0.604 91.0 4.6 0.576 92.0 0.05 1.0
Information on corporate social responsibility
4.35 0.801 87.0 4.54 0.71 90.8 0.19 3.8
Analysis of cash flow 3.85 0.936 77.0 4.08 0.987 81.6 0.23 4.6
Intangible assets disclosure 3.54 0.727 70.8 3.71 0.877 74.2 0.17 3.4
Off balance activities disclosure 2.85 1.155 57.0 3.69 1.371 73.8 0.84 16.8
Information concerning going concern
3.2 0.801 64.0 3.65 0.66 73.0 0.45 9.0
Fair value (FV) vs. historical cost(HC)
3.9 0.700 78.0 4.08 0.638 81.6 0.18 3.6
Source: primary data, SD= Standard Deviation, MD= Mean Difference
Based on the Mean and Standard Deviation, regarding mean value of actual score
and expected score of predictive value, a mean value of actual score and expected score
of ‘off balance’ activities disclosure' stood at 2.85 and 3.96 respectively with a
maximum gap score of 16.8 percent, and it was followed by the 'Information concerning
going concern' with actual score and expected score 3.20 and 3.65 respectively with a
gap score of 9 percent, 'Estimate of profits and losses' with actual score and expected
score 3.45 and 3.78 respectively with a gap score of 6.6 percent, 'Analysis of cash flow'
74.880.4
5.6
0
20
40
60
80
100
Predictive value
Chart No.5.4 Actual score and expected score for predictive
value of financial reporting information
Actual score Expected score Gap
177
with actual score and expected score 3.85 and 4.08 respectively with a gap score of 4.6
percent, 'Information on corporate social responsibility (CSR)' with actual score and
expected score 4.35 and 4.54 respectively with a gap score of 3.8 percent, 'Fair value
(FV) vs. historical cost(HC)' with actual score and expected score 3.90 and 4.08
respectively with a gap score of 3.6 percent, 'Intangible assets disclosure' with actual
score and expected score 3.54 and 3.71 respectively with a gap score of 3.4 percent,
'Non Financial Information' with actual score and expected score 3.97 and 4.05
respectively with a gap score of 1.6 percent, and 'Forward looking information' with
actual score and expected score 4.55 and 4.60 respectively with a gap score of 1.00
percent.
The results of t-test are given in Table 5.5. The result obtained shows that, there is
a gap between actual score and expected score for predictive value of financial reporting
information in Indian banks. As the table below, it is seen that P = 0.001 < 0.05.
Table No.5.5
Results of t-test on the actual score and expected score for predictive value
Score Type Group Statistics Paired Samples Test
Mean SD MD SD t-value df P-value
Actual Score
Expected Score
3.74 0.41 0.28 3.48 15.54 464 0.001
4.02 0.50
P-value (t-test, 2 tailed), SD= Standard Deviation, MD= Mean Difference
Confirmatory value in measuring relevance is highlighted in Table 5.6 and Chart
5.5, which present the perceptions of all the sample respondents. Confirmatory value
was tested with 5 variables. The total Mean and SD values for actual score stood at 3.51
and 0.59 respectively, while the total Mean and SD values for expected score stood at
3.83 and 0.75 respectively with a gap score of 6.4 percent.

178
Table No.5.6
Actual score and expected score for confirmatory value of financial reporting information
Qualitative characteristics of financial reporting information
Actual Score Expected Score Gap
Mean SD Per cent
Mean SD Per cent
MD Per cent
Confirmatory value 3.51 0.59 70.2 3.83 0.75 76.6 0.32 6.4
Information from supervisory board
3.53 0.666 70.6 3.71 0.667 74.2 0.18 3.6
Information regarding personal policies
3.44 0.752 68.8 3.59 0.758 71.8 0.15 3.0
Information concerning divisions 3.45 1.317 69.0 3.73 1.337 74.6 0.28 5.6
Financial structure disclosed 3.12 0.922 62.4 3.76 0.773 75.2 0.64 12.8
Interim financial reports published
4.03 0.606 80.6 4.38 0.681 87.6 0.35 7.0
Source: primary data, SD= Standard Deviation, MD= Mean Difference
Based on the Mean and Standard Deviation value, regarding mean value of
actual score and expected score of confirmatory value, the mean value of actual score
and expected score of 'financial structure disclosed' stood at 3.12 and 3.76 respectively
with a maximum gap score of 12.8 percent, and it was followed by the 'interim financial
reports published' with actual score and expected score 4.03 and 4.38 respectively with
a gap score of 7.00 percent, 'information concerning divisions' with actual score and
expected score 3.45 and 3.73 respectively with a gap score of 5.6 percent, 'information
from supervisory board' with actual score and expected score 3.53 and 3.71 respectively
70.276.6
6.4
0
20
40
60
80
100
Confirmatory value
Chart No.5.5 Actual score and expected score for confirmatory value of
financial reporting information in banks
Actual score Expected score Gap

179
with a gap score of 3.6 percent, and 'information regarding personal policies' with actual
score and expected score 3.44 and 3.59 respectively with a gap score of 3.00 percent.
The results of t-test are given in Table 5.7.The results show that there is a
statistically significant gap between the actual score and expected score for the
confirmatory value of financial reporting in Indian banks. As the table below, it is seen
that P = 0.001 < 0.05.
Table No.5.7
Results of t-test on the actual score and expected score for confirmatory value
Score Type Group Statistics Paired Samples Test
Mean SD MD SD t-value df P-value Actual Score
Expected Score
3.51 0.59 0.32 0.39 17.79 464 0.001
3.83 0.74
P-value (t-test, 2 tailed), SD= Standard Deviation, MD= Mean Difference
Faithful Representation (Reliability) is one of the two fundamental qualitative
characteristic of financial reporting information. Reliability was analyzed with four
components: completeness - containing 2, neutrality- containing 2, free from material
error- containing 2 and verifiability - containing 2 variables.
Completeness in measuring reliability is highlighted in Table 5.8 and Chart 5.6,
which present the perceptions of all the sample respondents. Completeness was tested
with 2 variables. The total Mean and SD values for actual score stood at 4.13 and 0.49
respectively, while the total Mean and SD values expected score stood at 4.24 and 0.45
respectively with a gap score of 2.2 percent.
Table No.5.8
Actual score and expected score for completeness of financial reporting information
Source: primary data, SD= Standard Deviation, MD= Mean Difference
Qualitative characteristics of financial reporting information
Actual Score Expected Score Gap
Mean SD Per cent
Mean SD Per cent
MD Per cent
Completeness 4.13 0.49 82.6 4.24 0.45 84.8 0.11 2.2
Description corporate governance 4.43 0.69 88.6 4.55 0.60 91.0 0.12 2.4
Contingencies disclosure 3.83 0.93 76.6 3.94 0.91 78.8 0.11 2.2

180
Based on the Mean and Standard Deviation value, regarding mean value of actual
score and expected score for completeness, a mean value of actual score and expected
score of 'description corporate governance’ stood at 4.43 and 4.55 respectively with a
maximum gap score of 2.4 percent, and it was followed by the ‘contingencies
disclosure’ with actual score and expected score 3.83 and 3.94 respectively with a gap
score of 2.2 percent.
The results of t-test are given in Table 5.9. The results show that there is a
statistically significant gap between the actual score and expected score for
completeness of financial reporting in Indian banks. As the table below, it is seen that P
= 0.001 < 0.05.
Table No.5.9
Result of t-test on the actual score and expected score for completeness
Score Type Group Statistics Paired Samples Test
Mean SD MD SD t-value df P-value Actual Score
Expected Score
4.13 0.49 0.11 0.57 4.26 464 0.001
4.24 0.45
P-value (t-test, 2 tailed), SD= Standard Deviation, MD= Mean Difference
Neutrality in measuring reliability is highlighted in Table 5.10 and Chart 5.7,
which present the perceptions of all the sample respondents. Neutrality was tested with
2 variables. The total Mean and SD values for actual score stood at 3.54 and 0.68
82.6 84.8
2.20
20
40
60
80
100
Completeness
Chart No.5.6 Actual score and expected score for completeness of
financial reporting information in banks
Actual score Expected score Gap

181
respectively, while the total Mean and SD values for expected score stood at 3.92 and
0.82 respectively with a gap score of 7.6 per cent.
Table No.5.10
Actual score and expected score for neutrality of financial reporting information
Source: primary data, SD= Standard Deviation, MD= Mean Difference
Based on the Mean and Standard Deviation value, regarding mean value of actual
score and expected score for neutrality, a mean value of the actual score and expected
score of 'information concerning bonuses’ stood at 3.32 and 3.77 respectively with a
maximum gap score of 9.00 percent, and it was followed by the 'Comply or explain
disclosure' with the actual score and expected score 3.76 and 4.07 respectively with a
gap score of 6.2 percent.
The results of t-test are given in Table 5.11. The results show that there is a
statistically significant gap between the actual score and expected score for the
neutrality of financial reporting in banks. As the table below, it is seen that P = 0.001 <
0.05.
70.878.4
7.6
0
10
20
30
40
50
60
70
80
90
Neutrality
Chart No.5.7 Actual score and expected score for
Neutrality of financial reporting information
Actual score Expected score Gap
Qualitative characteristics of financial reporting information
Actual Score Expected Score Gap
Mean SD Per cent
Mean SD Per cent
MD Per cent
Neutrality 3.54 0.68 70.8 3.92 0.82 78.4 0.38 7.6
"Comply or explain" disclosure 3.76 0.98 75.2 4.07 0.96 81.4 0.31 6.2
Information concerning bonuses 3.32 0.68 66.4 3.77 0.78 75.4 0.45 9.0

182
Table No.5.11
Result of t-test on the actual score and expected score for neutrality
Score Type Group Statistics Paired Samples Test
Mean SD MD SD t-value df P-value Actual Score
Expected Score
3.54 0.68 0.38 0.72 11.28 464 0.001
3.92 0.82
P-value (t-test, 2 tailed), SD= Standard Deviation, MD= Mean Difference
Free from material error in measuring reliability is highlighted in Table 5.12
and Chart 5.8, which present the perceptions of all the sample respondents. Free from
material was tested with 2 variables. The total Mean and SD values for actual score
stood at 3.92 and 0.40 respectively, while the total Mean and SD values for expected
score stood at 3.97 and 0.41 respectively with a gap score of 1.00 percent.
Table No.5.12
Actual and expected score for free from material error of financial reporting information
Source: primary data, SD= Standard Deviation, MD= Mean Difference
Based on the Mean and Standard Deviation value, regarding mean value of actual
score and expected score for free from material error, the Mean value of actual score
and expected score of ‘descriptions auditor's report’ stood at 4.21 and 4.31 respectively
78.4 79.4
10
20
40
60
80
100
Free from material error
Chart No.5.8 Actual score and expected score for free from
material error of financial reporting information in Indian banks
Actual score Expected score Gap
Qualitative characteristics of financial reporting
information
Actual Score Expected Score Gap
Mean SD Per cent
Mean SD Per cent
MD Per cent
Free from material error 3.92 0.4 78.4 3.97 0.41 79.4 0.05 1.0
Descriptions auditor's report 4.21 0.644 84.2 4.31 0.68 86.2 0.1 2.0
Type of auditor’s report 3.63 0.663 72.6 3.64 0.669 72.8 0.01 0.2

183
with a maximum gap score of 2.00 percent, and it was followed by the ‘type of auditor’s
report’ with the same actual and expected score 3.63, 3.64 and without a gap score.
The results of t-test are given in Table 5.13. The results show that there is a
statistically significant gap between the actual score and expected score for free from
material error of financial reporting in Indian banks. As the table below, it is seen that
P= 0.001 < 0.05.
Table No.5.13
Results of t-test actual score and expected score for free from material error
Score Type Group Statistics Paired Samples Test
Mean SD MD SD t-value df P-value Actual Score
Expected Score
3.92 0.40 0.05 0.22 5.14 464 0.001
3.97 0.41
P-value (t-test, two tailed), SD= Standard Deviation, MD= Mean Difference
Verifiability in measuring reliability is highlighted in Table 5.14 and Chart 5.9,
which present the perceptions of all the sample respondents. Verifiability was tested
with 2 variables. The total Mean and SD values for actual score stood at 3.85 and 0.61
respectively, while the total Mean and SD values for expected score stood at 4.19 and
0.67 respectively with a gap score of 6.8 percent.
Table No.5.14
Actual score and expected score for verifiability of financial reporting information
Source: primary data, SD= Standard Deviation, MD= Mean Difference
Qualitative characteristics of financial reporting information
Actual Score Expected Score Gap
Mean SD Per cent
Mean SD Per cent
MD Per cent
Verifiability 3.85 0.61 77.0 4.19 0.67 83.8 0.34 6.8
Valid argument estimates in annual report
3.83 0.91 76.6 4.01 0.95 80.2 0.18 3.6
Valid argument for choice accounting principles
3.87 0.48 77.4 4.35 0.51 87.0 0.48 9.6

184
Based on the Mean and Standard Deviation value, regarding mean value of actual
score and expected score of verifiability, a mean value of actual score and expected
score of ‘valid argument for choice accounting principles’ stood at 3.87 and 4.35
respectively with a maximum gap score of 9.6 percent, and it was followed by the
‘Valid argument estimates in annual report’ with actual score and expected score 3.83
and 4.01 respectively with a gap score of 3.6 percent.
The results of t-test are given in Table 5.15. The results show that there is a
statistically significant gap between the actual score and expected score for verifiability
of financial reporting in Indian banks. As the table below, it is seen that P = 0.001 <
0.05.
Table No.5.15
Results of t-test the actual score and expected score for verifiability
Score Type Group Statistics Paired Samples Test
Mean SD MD SD t-value df P-value Actual Score
Expected Score
3.85 0.61 0.34 0.58 12.3 464 0.001
4.19 0.67
P-value (t-test, two tailed), SD= Standard Deviation, MD= Mean Difference
Understandability is highlighted in Table 5.16 and Chart 5.10, which present the
perceptions of all the sample respondents. Understandability was tested with 7
variables. The total Mean and SD values for actual score stood at 3.81 and 0.32
7783.8
6.8
0
20
40
60
80
100
Verifiability
Chart No.5.9 Actual score and expected score for 'Verifiability' of
financial reporting information in Indian banks
Actual score Expected score Gap

185
respectively, while the total Mean and SD values for expected score stood at 4.1 and
0.35 respectively with a gap score of 5.8 percent.
Table No.5.16
Actual score and expected score for understandability of financial reporting information
Qualitative characteristics of financial reporting information
Actual Score Expected Score Gap
Mean SD Per cent
Mean SD Per cent
MD Per cent
Understandability 3.81 0.318 76.2 4.1 0.351 82 0.29 5.8
Manner of organized annual report
4.66 0.684 93.2 4.78 0.574 95.6 0.12 2.4
The extent presented of graphs and tables
2.92 0.756 58.4 3.39 0.764 67.8 0.47 9.4
The extent of jargon in annual report
4.08 0.933 81.6 4.23 0.884 84.6 0.15 3.0
The size of the glossary 2.8 1.402 56.0 3.41 1.512 68.2 0.61 12.2
Information concerning mission and strategy
4.3 0.669 86.0 4.36 0.559 87.2 0.06 1.2
Annual report understandable 4.3 0.724 86.0 4.42 0.625 88.4 0.12 2.4
Classifications financial statement's elements
3.64 0.853 72.8 3.98 0.89 79.6 0.34 6.8
Source: primary data, SD= Standard Deviation, MD= Mean Difference
Based on the Mean and Standard Deviation value, regarding mean value of actual
score and expected score of understandability a mean value of actual score and expected
score of ‘the size of the glossary’ stood at 2.80 and 3.41 respectively with a maximum
gap score of 12.2 percent, and it was followed by the ‘extent presented of graphs and
tables’ with actual score and expected score 2.92 and 3.39 respectively with a gap score
of 9.4 percent, 'classifications financial statement’s elements' with actual score and
76.2 82
5.8
0
20
40
60
80
100
Understandability
Chart No.5.10 Actual score and expected score for Understandability of
financial reporting information in Indian banks
Actual score Expected score Gap

186
expected score 3.64 and 3.98 respectively with a gap score of 6.8 percent, 'extent of
jargon in annual report' with actual score and expected score 4.08 and 4.23 respectively
with a gap score of 3 percent, 'manner of organized annual report' with actual score and
expected score 4.66 and 4.78 respectively with a gap score of 2.4 percent, 'annual report
understandable' with actual score and expected score 4.30 and 4.42 respectively with a
gap score of 2.4 percent, and 'information concerning mission and strategy' with actual
score and expected score 4.30 and 4.36 respectively with a gap score of 1.2 percent.
The results of t-test are given in Table 5.17. The results show that there is a
statistically significant gap between the actual score and expected score for the
understandability of financial reporting in Indian banks. As the table below, it is seen
that P= 0.001 < 0.05.
Table No.5.17
Result of t-test on the actual score and expected score for understandability
Score Type Group Statistics Paired Samples Test
Mean SD MD SD t-value df P-value Actual Score
Expected Score
3.81 0.32 0.27 0.25 22.79 464 0.001
4.08 0.35
P-value (t-test, two tailed), SD= Standard Deviation, MD= Mean Difference
Comparability refers to the quality of information that enables users to identify
similarities in and differences between two set of economic phenomena. Comparability
was analyzed with two components: consistency- containing 5, and comparable -
containing 2 variables.
Consistency in measuring comparability is highlighted in Table 5.18 and Chart
5.11, which present the perceptions of all the sample respondents. Consistency was
tested with 5 variables. The total Mean and SD values for the actual score stood at 3.23
and 0.44 respectively, while the total Mean and SD values for expected score stood at
3.65 and 0.53 respectively with a gap score of 8.4 percent.

187
Table No.5.18
Actual score and expected score for consistency of financial reporting information
Qualitative characteristics of financial reporting information
Actual Score Expected Score Gap
Mean SD Per cent
Mean SD Per cent
MD Per cent
Consistency 3.23 0.44 64.6 3.65 0.53 73.0 0.42 8.4
Changes in accounting policies disclosure
3.31 0.669 66.2 3.73 0.623 74.6 0.42 8.4
Changes in accounting estimates disclosure
3.51 0.673 70.2 3.57 0.745 71.4 0.06 1.2
Effects of accounting policy changes
2.66 0.698 53.2 3.58 0.85 71.6 0.92 18.4
Information concerning companies’ shares
3.05 0.469 61.0 3.31 0.724 66.2 0.26 5.2
Benchmark information 3.6 0.882 72.0 4.08 1.036 81.6 0.48 9.6
Source: primary data, SD= Standard Deviation, MD= Mean Difference
Based on the Mean and Standard Deviation value, regarding mean value of the
actual score and expected score for consistency a mean value of actual score and
expected score of ‘effects of accounting policy changes’ stood at 2.66 and 3.58
respectively with a maximum gap score of 18.4 percent, and it was followed by the
‘benchmark information’ with actual score and expected score 3.60 and 4.08
respectively with a gap score of 9.6 percent, 'changes in accounting policies disclosure'
with actual score and expected score 3.31 and 3.73 respectively with a gap score of 8.4
percent, 'information concerning companies’ shares' with actual score and expected
64.673
8.4
0
10
20
30
40
50
60
70
80
Consistency
Chart No.5.11 Actual score and expected score
for 'Consistency' of financial reporting information in Indian banks
Actual score Expected score Gap

188
score 3.05 and 3.31 respectively with a gap score of 5.2 percent, and 'changes in
accounting estimates disclosure' with actual score and expected score 3.51 and 3.57
respectively with a gap score of 1.2 percent.
The results of t-test are given in Table 5.19. The results show that there is a
statistically significant gap between the actual score and expected score for consistency
of financial reporting in Indian banks. As the table below, it is seen that P = 0.001 <
0.05.
Table No.5.19 Result of t-test on the actual score and expected score for consistency
Score Type Group Statistics Paired Samples Test
Mean SD MD SD t-value df P-value Actual Score
Expected Score
3.23 0.44 0.42 0.47 19.57 464 0.001
3.65 0.53
P-value (t-test, two tailed), SD= Standard Deviation, MD= Mean Difference
Comparable in measuring comparability is highlighted in Table 5.20 and Chart
5.12, which present the perceptions of all the sample respondents. Comparable was
tested with 2 variables. The total Mean and SD values for the actual score stood at 3.77
and 0.39 respectively, while the total Mean and SD values for expected score stood at
4.00 and 0.53 respectively with a gap score of 4.6 percent.
Table No.5.20
Actual score and expected score for comparable of financial reporting information
Qualitative characteristics of financial reporting information
Actual Score Expected Score Gap
Mean SD Per cent
Mean SD Per cent
MD Per cent
Comparable 3.77 0.39 75.4 4.0 0.53 80.0 0.23 4.6
Financial index numbers and ratios
3.61 0.655 72.2 3.76 0.721 75.2 0.15 3.0
Items of previous year represented
3.94 0.352 78.8 4.25 0.55 85.0 0.31 6.2
Source: primary data, SD= Standard Deviation, MD= Mean Difference

189
Based on the Mean and Standard Deviation value, regarding mean value of actual
score and expected score for comparable the Mean value of the actual score and
expected score of ‘items of previous year represented’ stood at 3.94 and 4.25
respectively with a maximum gap score of 6.2 percent, and it was followed by the
‘financial index numbers and ratios’ with the actual score and expected score 3.61 and
3.76 respectively with a gap score of 3.00 percent.
The results of t-test are given in Table 5.21. The results show that there is a
statistically significant gap between the actual score and expected score for comparable
of financial reporting in Indian banks. As the table below, it is seen that P= 0.001 <
0.05.
Table No.5.21
Result of t-test on the actual score and expected score for comparable
Score Type Group Statistics Paired Samples Test
Mean SD MD SD t-value df P-value
Actual Score
Expected Score
3.77 0.39 0.23 0.44 11.16 464 0.001
4.00 0.53
P-value (t-test, two tailed), SD= Standard Deviation, MD= Mean Difference
75.4 80
4.6
0
20
40
60
80
100
Comparable
Chart No.5.12 Actual score and expected score for comparable of
financial reporting information in Indian banks
Actual score Expected score Gap

190
5.4.2. A Comparative Study between the Public and Private Sector Banks
Regarding the Components of Qualitative Characteristics of Financial
Reporting Information.
Relevance is one of the two fundamental qualitative characteristic of financial
reporting information. Relevance was analyzed with two components: Predictive value -
containing 9 and Confirmatory value- containing 5 variables.
Predictive value in measuring relevance is highlighted in Table 5.22 and Chart
5.13, which present the perceptions of 375 sample respondents of the public sector
banks and 90 sample respondents of the private sector banks. Predictive value was
tested with 9 variables. The total Mean and SD values of banks in the public sector
stood at 3.69 and 0.28 respectively, while the total Mean and SD values for the private
sector stood at 3.96 and 0.71 respectively with a gap score of 5.4 percent.
Table No.5.22
Predictive value of financial reporting information in Indian banks
Qualitative characteristics of financial reporting information
Public Sector Private Sector Gap
Mean SD Per cent
Mean SD Per cent
MD Per cent
Predictive value 3.69 0.28 73.8 3.96 0.71 79.2 0.27 5.4
Estimate of profits and losses 3.43 0.56 68.6 3.51 0.67 70.2 0.08 1.6
Non Financial Information 3.96 0.48 79.2 4.02 0.79 80.4 0.06 1.2
Forward looking information 4.59 0.49 91.8 4.34 0.91 86.8 0.25 5.0
Information on corporate social responsibility
4.43 0.73 88.6 4.01 0.99 80.2 0.42 8.4
Analysis of cash flow 3.77 0.92 75.4 4.17 0.93 83.4 0.4 8.0
Intangible assets disclosure 3.46 0.67 69.2 3.89 0.85 77.8 0.43 8.6
Off balance activities disclosure 2.57 1.02 51.4 4.01 0.93 80.2 1.44 28.8
Information concerning going concern
3.1 0.73 62 3.63 0.93 72.6 0.53 10.6
Fair value (FV) vs. historical cost(HC)
3.86 0.66 77.2 4.07 0.85 81.4 0.21 4.2
Source: primary data, SD= Standard Deviation, MD= Mean Difference

191
Based on the Mean and Standard Deviation value, the bank in the private sector
have disclosed more predictive value of financial information (Mean 3.96) than the
banks in the public sector (Mean 3.69). The study found that on seven items of the
financial information in private sector were significantly better than those in the public
sector. These items relate to 'estimate of profits and losses', 'non financial information',
'analysis of cash flow', 'intangible assets disclosure', 'off balance activities disclosure',
'information concerning going concern', and 'fair value vs. historical cost'. On the other
hand, on two items, the predictive value of financial information in the public sector
banks, the score was significantly better than in the private sector, particularly regarding
'forward looking information', and 'information on corporate social responsibility'.
The results of t-test are given in Table 5.23. The results show that there is a
statistically significant difference between the public and private sector banks regarding
the predictive value of financial reporting. As the table below, it is seen that
P = 0.001 < 0.05.
73.8 79.2
5.4
0
20
40
60
80
100
Predictive value
Chart No.5.13 predictive value of financial reporting information in
Indian banks
Public sector Private Sector Gap

192
Table No.5.23
Result of t-test on predictive value of financial reporting information in Indian banks
Sector Type Group Statistics Independent Samples Test
N Mean SD MD t-value df P-value
Public Sector
Private Sector
375 3.69 0.28 0.27 5.88 463 0.001
90 3.96 0.71
P-value (t-test, 2 tailed), SD= Standard Deviation, MD= Mean Difference
Confirmatory value in measuring relevance is highlighted in Table 5.24 and
Chart 5.14, which present the perceptions of 375 sample respondents of the public
sector banks and 90 sample respondents of the private sector banks. Confirmatory value
was tested with 5 variables. The total Mean and SD values for public sector banks stood
at 3.38 and 0.48 respectively, while the total Mean and SD values for private sector
banks stood at 4.06 and 0.67 respectively with a difference score of 13.6 percent.
Table No.5.24
Confirmatory value of financial reporting information in Indian banks
Qualitative characteristics of financial reporting information
Public Sector Private Sector Gap
Mean SD Per cent
Mean SD Per cent
MD Per cent
Confirmatory value 3.38 0.48 67.6 4.06 0.67 81.2 0.68 13.6
Information from supervisory board
3.47 0.57 69.4 3.79 0.94 75.8 0.32 6.4
Information regarding personal policies
3.29 0.67 65.8 4.03 0.77 80.6 0.74 14.8
Information concerning divisions 3.37 1.37 67.4 3.81 1.02 76.2 0.44 8.8
Financial structure disclosed 2.87 0.72 57.4 4.17 0.93 83.4 1.3 26
Interim financial reports published 3.91 0.57 78.2 4.52 0.5 90.4 0.61 12.2
Source: primary data, SD= Standard Deviation, MD= Mean Difference
67.681.2
13.6
020406080
100
Confirmatory value
Chart No.5.14 Confirmatory value of financial reporting information
in Indian banks
Public sector Private Sector Gap

193
Based on the Mean and Standard Deviation value and t-test (two-tailed)
analysis, banks in the private sector have disclosed more the confirmatory value of
financial reporting (Mean 4.06) than public sector banks (Mean 3.38). The study found
that on all five items of qualitative characteristics of financial reporting information in
private sector banks significantly better that public sector banks.
The results of t-test are given in Table 5.25. The results show that there is a
statistically significant difference between the public and private sector banks regarding
the confirmatory value of financial reporting. As the table below, it is seen that
P = 0.001 < 0.05.
Table No.5.25
Results of t-test on confirmatory value of financial reporting information in Indian banks
Sector Type Group Statistics Independent Samples Test
N Mean SD MD t-value df P-value
Public Sector
Private Sector
375 3.38 0.48 0.68 11.06 463 0.001
90 4.06 0.67
P-value (t-test, 2 tailed), SD= Standard Deviation, MD= Mean Difference
Faithful Representation (Reliability) is one of the two fundamental qualitative
characteristic of financial reporting information. Reliability was analyzed with four
components: completeness- containing 2, neutrality- containing 2, free from material
error- containing 2 and verifiability- containing 2 variables.
Completeness in measuring reliability is highlighted in Table 5.26 and Chart
5.15, which present the perceptions of 375 sample respondents of public sector banks
and 90 sample respondents of private sector banks. Completeness was tested with 2
variables. The total Mean and SD values for public sector stood at 4.15 and 0.40
respectively, while the total Mean and SD values for the private sector stood at 4.07 and
0.78 respectively with a difference score of 1.6 percent.

194
Table No.5.26
Completeness of financial reporting information in Indian banks
Qualitative characteristics of financial reporting information
Public Sector Private Sector Gap
Mean SD Per cent
Mean SD Per cent
MD Per cent
Completeness 4.15 0.4 83 4.07 0.78 81.4 0.08 1.6
Description corporate governance (CG)
4.57 0.5 91.4 3.86 1.02 77.2 0.71 14.2
Contingencies disclosure 3.72 0.89 74.4 4.28 0.95 85.6 0.56 11.2
Source: primary data, SD= Standard Deviation, MD= Mean Difference
Based on the Mean and Standard Deviation value and t-test (two-tailed) analysis,
public sector banks have disclosed more completeness of financial reporting (Mean
4.15) than private sector banks (Mean 4.07). The study found that on one item of
completeness of financial reporting in the private sector banks disclosed significantly
better that public sector banks. This item relates to 'Contingencies disclosure'. On the
other hand, on one the item of the completeness of financial reporting, the public sector
banks scored significantly better than the private sector banks, i.e., 'Description
corporate governance' (CG).
The results of t-test are given in Table 5.27. The results show that there isn’t
statistically significant difference between the public and private sector banks regarding
the completeness of financial reporting. As the table below, it is seen that P = 0.17 >
0.05.
83 81.4
1.60
20
40
60
80
100
completeness
Chart No.5.15 Completeness of financial reporting information in
Indian banks
Public sector Private Sector Gap

195
Table No.5.27
Results of T-test on completeness of financial reporting information in Indian banks
Sector Type Group Statistics Independent Samples Test
N Mean SD MD t-value df P-value
Public Sector
Private Sector
375 4.15 0.40 0.08 1.38 463 0.17
90 4.07 0.78
P-value (t-test, 2 tailed), SD= Standard Deviation, MD= Mean Difference
Neutrality in measuring reliability is highlighted in Table 5.28 and Chart 5.16,
which present the perceptions of 375 sample respondents of public sector banks and 90
sample respondents of private sector banks. Neutrality was tested with 2 variables. The
total Mean and SD values for public sector banks stood at 3.65 and 0.57 respectively,
while the total Mean and SD values for private sector banks stood at 4.27 and 0.64
respectively with a difference score of 18.2 percent.
Table No.5.28
Neutrality of financial reporting information in Indian banks
Qualitative characteristics of financial reporting information
Public Sector Private Sector Gap
Mean SD Per cent
Mean SD Per cent
MD Per cent
Neutrality 3.36 0.57 67.2 4.27 0.64 85.4 0.91 18.2
"Comply or explain" disclosure 3.62 0.93 72.4 4.36 0.94 87.2 0.74 14.8
Information concerning bonuses 3.11 0.51 62.2 4.19 0.63 83.8 1.08 21.6
Source: primary data, SD= Standard Deviation, MD= Mean Difference
67.2
85.4
18.2
0
20
40
60
80
100
Neutrality
Chart No.5.16 Neutralityof financial reporting information in
Indian banks
Public sector Private Sector Gap

196
Table 5.28 shows that the private sector banks have disclosed more neutrality of
financial reporting (Mean 4.27) than public sector banks (Mean 3.36). The study found
that on both items of neutrality of qualitative characteristics of financial reporting
information, the private sector banks disclosed significantly better than public sector
banks.
The results of t-test are given in Table 5.29. The results show that there is a
statistically significant difference between the public and private sector banks regarding
the neutrality of financial reporting information. As the table below, it is seen that
P = 0.001 < 0.05.
Table No.5.29
Results of t-test on neutrality of financial reporting information in Indian banks
Sector Type Group Statistics Independent Samples Test
N Mean SD MD t-value df P-value
Public Sector
Private Sector
375 3.36 0.57 0.91 13.23 463 0.001
90 4.27 0.63
P-value (t-test, 2 tailed), SD= Standard Deviation, MD= Mean difference
Free from material error in measuring reliability is highlighted in Table 5.30
and Chart 5.17, which present the perceptions of 375 sample respondents of public
sector banks and 90 sample respondents of private sector banks. Free from material
error as an attribute was tested with 2 variables. The total Mean and SD values for the
public sector banks stood at 3.94 and 0.33 respectively, while those for the private
sector banks stood at 3.84 and 0.60 respectively with a difference score of 2.00 percent.
Table 5.30 shows that the public sector banks have disclosed more free from
material error attribute in measuring of financial reporting (Mean 3.94) than banks in
the private sector (Mean 3.84). The study found that on one item of free from material
error in measuring of qualitative characteristics of financial reporting in the private
sector banks significantly better that public sector banks. This item relates to

197
'descriptions auditor's report'. On the other hand, on one item, of ‘free from material
error’ qualitative characteristics of financial reporting in the public sector banks, the
score being significantly better than in the private sector banks, going by the 'type of
auditor’s report'.
Table No.5.30
Free from material error of financial reporting information in Indian banks
Qualitative characteristics of financial reporting information
Public Sector Private Sector Gap
Mean SD Per cent
Mean SD Per cent
MD Per cent
Free from material error 3.94 0.33 78.8 3.84 0.6 76.8 0.1 2.0
Descriptions auditor's report 4.32 0.5 86.4 3.74 0.91 74.8 0.58 11.6
Type of auditor’s report 3.56 0.63 71.2 3.93 0.73 78.6 0.37 7.4
Source: primary data, SD= Standard Deviation, MD= Mean Difference
The results of t-test are given in Table 5.31. The results show that there isn’t
statistically significant difference between the public and private sector banks regarding
the free from material error criterion of financial reporting. As the table below, it is seen
that P = 0.32 > 0.05.
Table No.5.31
Results of t-test on free from material error of financial reporting in Indian banks
Sector Type Group Statistics Independent Samples Test
N Mean SD MD t-value df P-value
Public Sector
Private Sector
375 3.94 0.33 0.1 2.15 463 0.32
90 3.84 0.60
P-value (t-test, 2 tailed), SD= Standard Deviation, MD= Mean difference
78.8 76.8
20
20
40
60
80
100
Free from material error
Chart No.5.17 Free from material error of financial reporting
information in Indian banks
Public sector Private Sector Gap
198
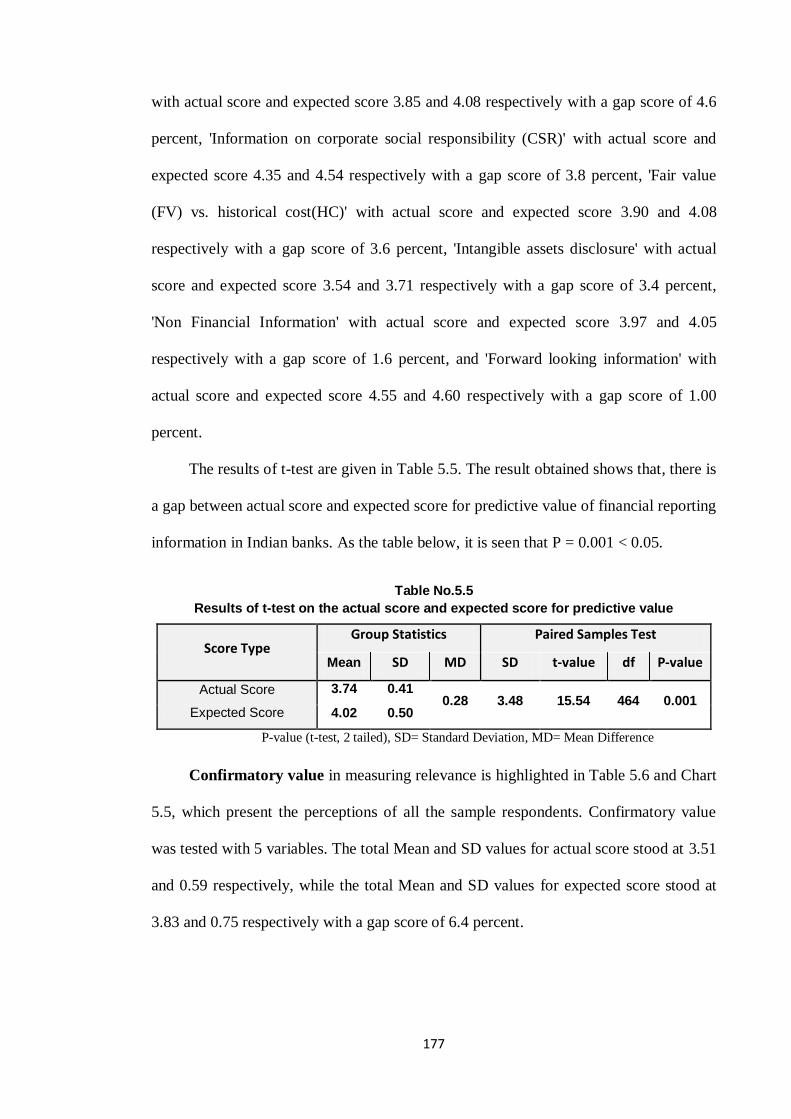
Verifiability in measuring reliability is highlighted in Table 5.32 and Chart 5.18,
which present the perceptions of 375 sample respondents of public sector banks and 90
sample respondents of private sector banks. Verifiability criterion was tested with 2
variables. The total Mean and SD values for public sector banks stood at 3.75 and 0.55
respectively, while those for private sector banks stood at 4.25 and 0.68 respectively
with a difference score of 10 percent.
Table No.5.32
Verifiability of financial reporting information in Indian banks
Qualitative characteristics of financial reporting information
Public Sector Private Sector Gap
Mean SD Per cent
Mean SD Per cent
MD Per cent
Verifiability 3.75 0.55 75 4.25 0.68 85 0.5 10
Valid argument estimates in annual report
3.73 0.88 74.6 4.27 0.95 85.4 0.54 10.8
Valid argument for choice accounting principles
3.78 0.41 75.6 4.24 0.57 84.8 0.46 9.2
Source: primary data, SD= Standard Deviation, MD= Mean Difference
Table 5.32 shows that the private sector banks have disclosed more verifiability
of financial reporting (Mean 4.25) than public sector banks (Mean 3.75). The study
found that on both the items 'Valid argument estimates in the annual report' and 'Valid
argument for choice accounting principles' of verifiability of financial reporting
information in private sector banks significantly better than public sector banks.
7585
10
0
20
40
60
80
100
Verifiability
Chart No.5.18 Verifiabilityof financial reporting information in
Indian banks
Public sector Private Sector Gap

199
The results of t-test are given in Table 5.33. The result shows that there is a
statistically significant difference between the public and private sector banks regarding
verifiability of financial reporting. As the table below, it is seen that P = 0.001 < 0.05.
Table No.5.33
Results of t-test on verifiability of financial reporting information in Indian banks
Sector Type Group Statistics Independent Samples Test
N Mean SD MD t-value df P-value
Public Sector
Private Sector
375 3.75 0.55 0.5 -7.43 463 0.001
90 4.25 0.68
P-value (t-test, 2 tailed), SD= Standard Deviation, MD= Mean difference
Understandability is highlighted in Table 5.34 and Chart 5.19, which present
the perceptions of 375 sample respondents of public sector banks and 90 sample
respondents of private sector banks. Understandability was tested with 7 variables. The
total Mean and SD values for public sector banks stood at 3.82 and 0.31 respectively,
while the total Mean and SD values for private sector banks stood at 3.79 and 0.35
respectively with a gap score of 0.6 per cent.
Table No.5.34
Understandability of financial reporting information in Indian banks
Qualitative characteristics of financial reporting information
Public Sector Private Sector Gap
Mean SD Per cent
Mean SD Per cent
MD Per cent
Understandability 3.82 0.31 76.4 3.79 0.35 75.8 0.03 0.6
Manner of organized annual report 4.65 0.68 93 4.67 0.7 93.4 0.02 0.4
The extent presented of graphs and tables
2.88 0.74 57.6 3.09 0.8 61.8 0.21 4.2
The extent of jargon in annual report
4.11 0.93 82.2 3.98 0.92 79.6 0.13 2.6
The size of the glossary 2.87 1.35 57.4 2.51 1.57 50.2 0.36 7.2
Information concerning mission and strategy
4.29 0.66 85.8 4.34 0.72 86.8 0.05 1.0
Annual report understandable 4.28 0.75 85.6 4.37 0.61 87.4 0.09 1.8
Classifications financial statement's elements
3.65 0.86 73.0 3.59 0.83 71.8 0.06 1.2
Source: primary data, SD= Standard Deviation, MD= Mean Difference,

200
Table 5.34 shows that the banks in the public sector have divulged more easily
understandable of financial reporting information (Mean 3.82) than the banks in the
private sector (Mean 3.79).
The public sector banks indicated higher score in understandability of financial
reporting when compared to private sector banks. The main reason for this difference
score is that there exists high degree of jargon in annual reports 82.2%, size of the
glossary 57.4% and classifications financial statement's elements 73% when compare
with private sector banks 79.6%, 50.2% and 71.8 percent respectively.
The private sector banks have shown more understandability in organized annual
report 93.4%, presented of graphs and tables 61.8% and information concerning mission
and strategy 86.8% when compared with public sector banks 93%, 57.6% and 85.8%
respectively.
The results of t-test are given in Table 5.35. The results show that there isn’t
statistically significant difference between the public and private sector banks regarding
the understandability of financial reporting information by them. As the table below, it
is seen that P = 0.46 > 0.05.
76.475.8
0.60
20
40
60
80
100
Understandability
Chart No.5.19 Understandabilityof financial ireporting information in
Indian banks
Public sector Private Sector Gap

201
Table No.5.35
Results of t-test on understandability of financial reporting information in Indian banks
Sector Type Group Statistics Independent Samples Test
N Mean SD MD t-value df P-value
Public Sector
Private Sector
375 3.82 0.31 0.03 0.78 463 0.46
90 3.79 0.35
P-value (t-test, 2 tailed), SD= Standard Deviation, MD= Mean difference
Comparability refers to the quality of information that enables users to identify
similarities in and differences between two set of economic phenomena. Comparability
was analyzed with two components: Consistency - containing 5, and Comparable-
containing 2 variables.
Consistency in measuring comparability is highlighted in Table 5.36 and Chart
5.20, which present the perceptions of 375 sample respondents of public sector banks
and 90 sample respondents of private sector banks. Consistency was tested with 5
variables. The total Mean and SD values for the public sector banks stood at 3.25 and
0.47 respectively, while the total Mean and SD values for these in the private sector
banks stood at 3.11 and 0.28 respectively with a difference score of 2.8 percent.
Table 5.36 shows that the public sector banks have disclosed better consistency
of financial reporting (Mean 3.25) than banks in the private sector (Mean 3.11). The
study found that on two items of consistency of financial reporting, bank in the private
sector significantly better than those in the public sector banks. These items relate to
‘changes in accounting estimates disclosure’ and ‘information concerning companies'
shares’. On the other hand, on three items of consistency of financial information, banks
in the public sector score significantly better than the private sector banks. These items
included ‘changes in accounting policies disclosure’, ‘effects of accounting policy
changes’, and ‘Benchmark information’.

202
Table No.5.36
Consistency of financial reporting information in Indian banks
Qualitative characteristics of financial reporting information
Public Sector Private Sector Gap
Mean SD Per cent
Mean SD Per cent
MD Per cent
Consistency 3.25 0.47 65 3.11 0.28 62.2 0.14 2.8
Changes in accounting policies disclosure
3.36 0.72 67.2 3.1 0.3 62 0.26 5.2
Changes in accounting estimates disclosure
3.5 0.69 70 3.57 0.58 71.4 0.07 1.4
Effects of accounting policy changes
2.69 0.72 53.8 2.53 0.56 50.6 0.16 3.2
Information concerning companies’ shares
3.05 0.49 61.0 3.06 0.35 61.2 0.01 0.2
Benchmark information 3.68 0.88 73.6 3.3 0.84 66 0.38 7.6
Source: primary data, SD= Standard Deviation, MD= Mean Difference,
The results of t-test are given in Table 5.37. The results show that there is a
statistically significant difference between the public and private sector banks regarding
the consistency of financial reporting information reported by them. As the table below,
it is seen that P = 0.01 < 0.05.
Table No.5.37
Results of t-test on consistency of financial reporting information in Indian banks
Sector Type Group Statistics Independent Samples Test
N Mean SD MD t-value df P-value
Public Sector
Private Sector
375 3.25 0.47 0.14 2.78 463 0.01
90 3.11 0.28
P-value (t-test, 2 tailed), SD= Standard Deviation, MD= Mean difference
65 62.2
2.8
0
20
40
60
80
Consistency
Chart No.5.20 Consistency of financial reporting information in
Indian banks
Public sector Private Sector Gap
203
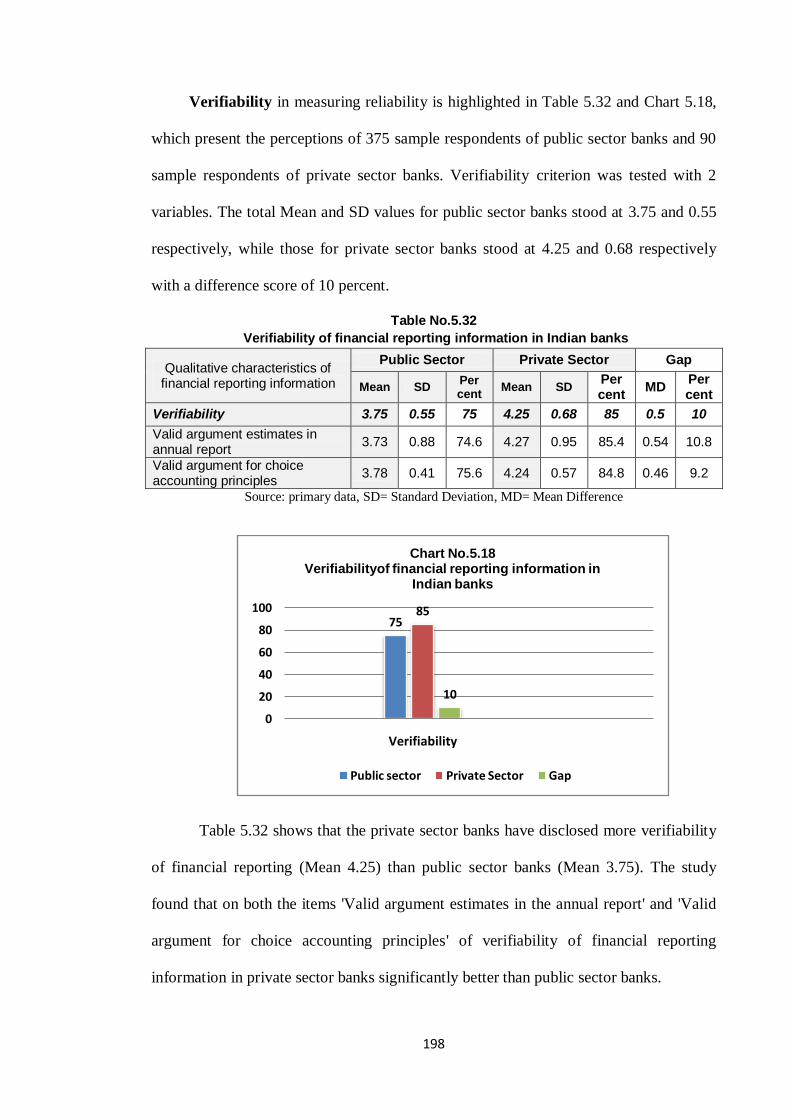
Comparable criterion in measuring comparability is highlighted in Table 5.38
and Chart 5.21, which present the perceptions of 375 sample respondents of the public
sector banks and 90 sample respondents of the private sector banks. The ‘Comparable’
criterion was tested with 2 variables. The total Mean and SD values for the public sector
banks stood at 3.78 and 0.38 respectively, while the total Mean and SD values for the
private sector banks stood at 3.73 and 0.40 respectively with a difference score of 1.00
percent.
Table No.5.38
Comparable of financial reporting information in Indian banks
Qualitative characteristics of financial reporting information
Public Sector Private Sector Gap
Mean SD Per cent
Mean SD Per cent
MD Per cent
Comparable 3.78 0.38 75.6 3.73 0.4 74.6 0.05 1.0
Financial index numbers and ratios
3.62 0.64 72.4 3.56 0.7 71.2 0.06 1.2
Items of previous year represented
3.95 0.36 79.0 3.9 0.3 78.0 0.05 1.0
Source: primary data, SD= Standard Deviation, MD= Mean Difference
Table 5.38 shows that the public sector banks have disclosed comparable of
financial reporting (Mean 3.78) better than banks in the private sector (Mean 3.73). The
study found that on both items the 'financial index numbers and ratios' and 'items of
previous year represented' regarding comparability of financial reporting information in
public sector banks was significantly better than private sector banks.
75.6 74.6
10
20
40
60
80
Comparable
Chart No.5.21 Comparable of financial reporting information in
Indian banks
Public sector Private Sector Gap

204
The results of T-test are given in Table 5.39. The results show that there is no
statistically significant difference between the public and private sector banks regarding
the comparable criterion of financial reporting reported by them. As the table below, it
is seen that P = 0.21 > 0.05.
Table No.5.39
Results of t-test on comparable of financial reporting information in Indian banks
Sector Type Group Statistics Independent Samples Test
N Mean SD MD t-value d f P-value
Public Sector
Private Sector
375 3.78 0.38 0.05 1.27 463 0.21
90 3.73 0.40
P-value (t-test, 2 tailed), SD= Standard Deviation, MD= Mean difference
5.4.3 A Comparative Study between the Public and Private Sector Banks
Regarding the Compliance with RBI Prudential Norms.
The compliance in actual performance in financial reporting with RBI prudential
norms in Indian banking system in respect of asset classification, provisioning norms,
capital adequacy and income recognition are catching up a satisfying level. As table
5.40 and chart 5.22 shows, the score of compliance in actual performance in financial
reporting with RBI prudential norms in Indian banking system average is 90.6 per cent
which is at a very satisfying level. The reason for the above result can be due to the
obligatory nature of the RBI prudential norms especially in the public sector banks
(94%) in which the compliance in actual performance in financial reporting is more
than private sector banks (87.4%).
Table No.5.40
Compliance with RBI prudential norms in Indian banks
RBI prudential norms
Public Sector Private Sector Total
Mean SD Per cent
Mean SD Per cent
Mean SD Per cent
Asset Classification 4.58 0.377 91.6 4.4 0.47 88 4.49 0.403 89.8
Provisioning Norms 4.61 0.382 92.2 4.25 0.682 85.0 4.43 0.477 88.6
Capital Adequacy 4.7 0.352 94.0 4.27 0.641 85.4 4.48 0.456 89.6
Income Recognition 4.9 0.011 98.0 4.54 0.429 90.8 4.72 0.302 94.4
Total 4.7 0.289 94.0 4.37 0.534 87.4 4.53 0.374 90.6
Source: primary data, SD= Standard Deviation, MD= Mean Difference

205
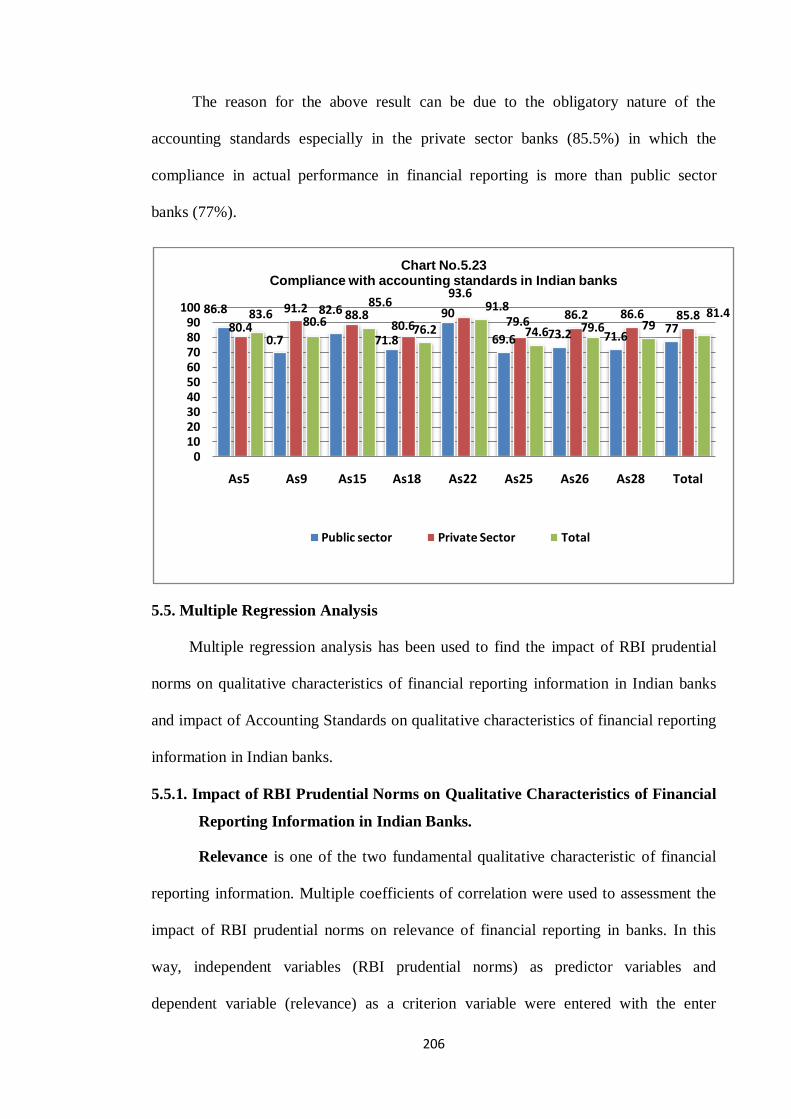
5.4.4. A Comparative Study between the Public and Private Sector Banks
Regarding the Compliance with Accounting Standards.
The compliance in actual performance in financial reporting information with
Accounting Standards in Indian banking system are needed to be improved. As table
5.41 and chart 5.23 shows, the score of compliance in actual performance in financial
reporting with Accounting Standards in Indian banking system average is 81.4 percent.
It is needed to state that the average score of private sector banks is slightly higher than
public sector banks.
Table No.5.41
Compliance with accounting standards in Indian banks
Accounting Standards
Public Sector Private Sector Total
Mean SD Per cent
Mean SD Per cent
Mean SD Per cent
AS5 Prior Period Items 4.34 0.474 86.8 4.02 0.793 80.4 4.18 0.563 83.6
AS9 Revenue Recognition 3.5 0.58 70.0 4.56 0.543 91.2 4.03 0.707 80.6
AS15 Retirement Benefits 4.13 1.06 82.6 4.44 0.901 88.8 4.28 1.037 85.6
AS18 Related party disclosures
3.59 0.728 71.8 4.03 0.867 80.6 3.81 0.776 76.2
AS22 Taxes on income 4.5 0.542 90.0 4.68 0.47 93.6 4.59 0.533 91.8
AS25 Interim Financial Reporting
3.48 0.58 69.6 3.98 0.821 79.6 3.73 0.662 74.6
AS26 Intangible asset 3.66 0.844 73.2 4.31 0.956 86.2 3.98 0.903 79.6
AS28 Impairment of assets 3.58 0.864 71.6 4.33 0.581 86.6 3.95 0.868 79.0
Total 3.85 0.551 77.0 4.29 0.508 85.8 4.07 0.57 81.4
Source: primary data, SD= Standard Deviation, MD= Mean Difference
91.6 92.294
98
94
0.8885 85.4
90.887.4
89.8 88.6 89.6
94.4
90.6
75
80
85
90
95
100
Asset Classification
Provisioning Norms
Capital Adequacy
Income Recognition
Total
Chart No.5.22 Compliance with RBI prudential norms in Indian banks
Public sector Private Sector Total
206
The reason for the above result can be due to the obligatory nature of the
accounting standards especially in the private sector banks (85.5%) in which the
compliance in actual performance in financial reporting is more than public sector
banks (77%).
5.5. Multiple Regression Analysis
Multiple regression analysis has been used to find the impact of RBI prudential
norms on qualitative characteristics of financial reporting information in Indian banks
and impact of Accounting Standards on qualitative characteristics of financial reporting
information in Indian banks.
5.5.1. Impact of RBI Prudential Norms on Qualitative Characteristics of Financial
Reporting Information in Indian Banks.
Relevance is one of the two fundamental qualitative characteristic of financial
reporting information. Multiple coefficients of correlation were used to assessment the
impact of RBI prudential norms on relevance of financial reporting in banks. In this
way, independent variables (RBI prudential norms) as predictor variables and
dependent variable (relevance) as a criterion variable were entered with the enter
86.8
0.7
82.6
71.8
90
69.6 73.2 71.67780.4
91.2 88.880.6
93.6
79.686.2 86.6 85.883.6
80.6
85.6
76.2
91.8
74.6 79.6 7981.4
0102030405060708090
100
As5 As9 As15 As18 As22 As25 As26 As28 Total
Chart No.5.23Compliance with accounting standards in Indian banks
Public sector Private Sector Total

207
method into regression equation. The multiple coefficient of correlation between the
variables in total sample (R=0.590) and R-Square to explanation of variance of
relevance was (R2=0.349) that implies 35 percent of variance of relevance is able to be
explained on the basis of predictor variables.
Model R R-Square Adjusted R-Square Std. Error of the Estimate
1 0.590 0.349 0.343 0.38726
Analysis of variance was used to determine the significance of R-Square. Since
the proportion of observed F(61.54) with the degree of freedom (4,460) was more than
its critical value (0.195), the R-Square (0.349) and sum up the regression was
statistically significant (P=.001). Therefore, the results showed that there is a multiple
correlation between the RBI prudential norms and relevance in model enter (R=0.590;
R2=0.349; df; 4, 460; F=61.54; P=0.001) (Table 5.42).
Table No.5.42
ANOVA
Model Sum of Squares df Mean Square F Sig.
1
Regression 36.916 4 9.229 61.538 0.001
Residual 68.987 460 0.150
Total 105.902 464
Dependent variable: Relevance
As shown in the table 5.43, Provisioning Norms (Beta=0.539, t=5.757, P=0.001),
Income Recognition (Beta=.394, t=6.878, P=0.001), and Asset Classification
(Beta=0.313, t=3.982, P= 0.001) were the best predictors of relevance respectively.
Table No.5.43 Coefficients
Model Unstandardized Coefficients
Standardized Coefficients t Sig.
B Std. Error Beta
1
(Constant) 2.743 0.310 8.850 0.001
Asset Classification 0.372 0.093 0.313 3.982 0.001
Provisioning Norms 0.540 0.094 0.539 5.757 0.001
Capital Adequacy 0.052 0.081 0.050 0.643 0.521
Income Recognition 0.623 0.091 0.394 6.878 0.001
Dependent variable: Relevance

208
Reliability is one of the two fundamental qualitative characteristic of financial
reporting information. Multiple coefficients of correlation were used to assessment the
impact of RBI prudential norms on reliability of financial reporting in banks. In this
way, independent variables (RBI prudential norms) as predictor variables and
dependent variable (reliability) as a criterion variable were entered with the enter
method into regression equation. The multiple coefficient of correlation between the
variables in total sample (R=0.652) and R-Square to explanation of variance of
reliability was (R2=0.425) that implies 42 percent of variance of reliability is able to be
explained on the basis of predictor variables.
Model R R-Square Adjusted R-Square Std. Error of the Estimate
1 0.652 0.425 0.420 0.30733
Analysis of variance was used to determine the significance of R-Square. Since
the proportion of observed F(85.16) with the degree of freedom (4,460) was more than
its critical value (0.195), the R-Square (0.425) and sum up the regression was
statistically significant (P=0.001). Therefore, the results showed that there is a multiple
correlation between the RBI prudential norms and reliability in model enter (R=0.652;
R2=0.425; df; 4, 460; F=85.16; P=0.001) (Table 5.44).
Table No.5.44 ANOVA
Model Sum of Squares df Mean Square F Sig.
1
Regression 32.173 4 8.043 85.16 0.001
Residual 43.449 460 0.094
Total 75.622 464
Dependent variable: Reliability
As shown in the table 5.45, Asset Classification (Beta=0.762, t=10.324,
P=0.001), and Capital Adequacy (Beta=0.315, t=4.329, P=0.001) were the best
predictors of reliability respectively.

209
Table No.5.45 Coefficients
Model Unstandardized Coefficients
Standardized Coefficients
t Sig. B Std. Error Beta
1
(Constant) 1.376 0.246 5.593 0.001
Asset Classification 0.765 0.074 0.762 10.324 0.001
Provisioning Norms 0.133 0.074 0.157 1.790 0.074
Capital Adequacy -0.279 0.064 0.315 4.329 0.001
Income Recognition -0.063 0.072 0.047 0.878 0.381
Dependent variable: Reliability
Understandability is the quality of information that enables users to comprehend
its meaning. Understandability is enhanced when information is classified,
characterized and presented clearly and concisely. Multiple coefficients of correlation
were used to assessment the impact of RBI prudential norms on understandability of
financial reporting in banks. In this way, independent variables (RBI prudential norms)
as predictor variables and dependent variable (understandability) as a criterion variable
were entered with the enter method into regression equation. The multiple coefficient of
correlation between the variables in total sample (R=0.188) and R-Square to
explanation of variance of understandability was (R2=0.035) that implies .035 percent
of variance of understandability is able to be explained on the basis of predictor
variables.
Model R R-Square Adjusted R-Square Std. Error of the Estimate
1 0.188 0.035 0.027 0.31414
Analysis of variance was used to determine the significance of R-Square. Since
the proportion of observed F(4.212) with the degree of freedom (4,460) was more than
its critical value (0.195), the R-Square (0.035) and sum up the regression was
statistically significant (P=0.002). Therefore, the results showed that there is a multiple
correlation between the RBI prudential norms and understandability in model enter
(R=0.188; R2=0.035; df; 4, 460; F=4.212; P=0.002) (Table 5.46).

210
Table No.5.46
ANOVA
Model Sum of Squares df Mean Square F Sig.
1
Regression 1.663 4 0.416 4.212 0.002
Residual 45.394 460 0.099
Total 47.057 464
Dependent variable: Understandability
As shown in the table 5.47, Provisioning Norms (Beta=0.363, t=3.188, P= 0.002),
and Asset Classification (Beta=0.206, t=2.152, P= 0.032) were the best predictors of
relevance respectively.
Table No.5.47 Coefficients
Model Unstandardized Coefficients
Standardized Coefficients
t Sig. B Std. Error Beta
1
(Constant) 3.804 0.251 15.127 0.001
Asset Classification 0.163 0.076 0.206 2.152 0.032
Provisioning Norms 0.243 0.076 0.363 3.188 0.002
Capital Adequacy 0.021 0.066 0.031 0.326 0.744
Income Recognition 0.093 0.074 0.088 1.269 0.205
Dependent variable: Understandability
Comparability refers to the quality of information that enables users to identify
similarities in and differences between two set of economic phenomena. Multiple
coefficients of correlation were used to assessment the impact of RBI prudential norms
on comparability of financial reporting in banks. In this way, independent variables
(RBI prudential norms) as predictor variables and dependent variable (comparability) as
a criterion variable were entered with the enter method into regression equation. The
multiple coefficient of correlation between the variables in total sample (R=0.635) and
R-Square to explanation of variance of comparability was (R2=0.402) that implies 40
percent of variance of comparability is able to be explained on the basis of predictor
variables.

211
Model R R-Square Adjusted R-Square Std. Error of the Estimate
1 0.634 0.402 0.397 0.29041
Analysis of variance was used to determine the significance of R-Square. Since
the proportion of observed F(77.30) with the degree of freedom (4,460) was more than
its critical value (0.195), the R-Square (0.402) and sum up the regression was
statistically significant (P=0.001). Therefore, the results showed that there is a multiple
correlation between the RBI prudential norms and comparability in model enter
(R=0.634; R2=0.402; df; 4, 460; F=77.30; P=0.001) (Table 5.48).
Table No.5.48 ANOVA
Model Sum of Squares df Mean Square F Sig.
1
Regression 26.079 4 6.520 77.30 0.001
Residual 38.796 460 0.084
Total 64.875 464
Dependent variable: Comparability
As shown in the table 5.49, Asset Classification (Beta=0.656, t=8.70, P= 0.001),
Income Recognition (Beta=.195, t=3.56, P=0.001), and Provisioning Norms
(Beta=0.21, t=2.34, P= 0.019) were the best predictors of comparability respectively.
Table No.5.49 Coefficients
Model Unstandardized Coefficients
Standardized Coefficients t Sig.
B Std. Error Beta
1
(Constant) 1.683 0.232 7.240 0.001
Asset Classification 0.609 0.070 0.656 8.703 0.001
Provisioning Norms 0.165 0.070 0.210 2.344 0.019
Capital Adequacy 0.115 0.061 0.140 1.882 0.060
Income Recognition 0.242 0.068 0.195 3.560 0.001
Dependent variable: Comparability

212
5.5.2. Impact of Accounting Standards on Qualitative Characteristics of Financial
Reporting Information in Indian Banks.
Relevance is one of the two fundamental qualitative characteristic of financial
reporting information. Multiple coefficients of correlation were used to assessment the
impact of Accounting Standards on relevance of financial reporting information in
Indian banks. In this way, independent variables (Accounting Standards) as predictor
variables and dependent variable (relevance) as a criterion variable were entered with
the enter method into regression equation. The multiple coefficient of correlation
between the variables in total sample (R=0.826) and R-Square to explanation of
variance of relevance was (R2=0.683) that implies 68 percent of variance of relevance is
able to be explained on the basis of predictor variables.
Model R R-Square Adjusted R-Square Std. Error of the Estimate
1 0.826 0.683 0.677 0.27153
Analysis of variance was used to determine the significance of R-Square. Since
the proportion of observed F(122.55) with the degree of freedom (8,456) was more than
its critical value (0.195), the R-Square (0.683) and sum up the regression was
statistically significant (P=0.001). Therefore, the results showed that there is a multiple
correlation between the Accounting Standards and relevance in model enter (R=0.826;
R2=0.683; df; 8, 456; F=122.55; P=0.001).
Table No.5.50 ANOVA
Model Sum of Squares df Mean Square F Sig.
1
Regression 72.282 8 9.035 122.55 0.001
Residual 33.621 456 0.074
Total 105.902 464
Dependent Variable: Relevance
As shown in the table 5.51, AS25 Interim Financial Reporting (Beta=0.603,
t=4.071, P=0.001), AS18 Related Party Disclosures (Beta=0.382, t=3.296, P=0.001),

213
AS15 Retirement Benefits (Beta=0.139, t=2.884, P=0.004) and AS9 Revenue
Recognition (Beta=0.175, t=2.696, P=0.007) were the best predictors of relevance
respectively.
Table No. 5.51
Coefficients
Model
Unstandardized Coefficients
Standardized Coefficients t Sig.
B Std. Error Beta
1
(Constant) 1.205 0.187 6.450 0.001
AS5 Prior Period Items -0.002 0.060 0.003 0.036 0.971
AS9 Revenue Recognition 0.118 0.044 0.175 2.696 0.007
AS15 Retirement Benefits -0.064 0.022 0.139 2.884 0.004
AS18 Related Party Disclosures 0.235 0.071 0.382 3.296 0.001
AS22 Taxes on Income 0.025 0.088 0.027 0.281 0.778
AS25 Interim Financial Reporting 0.435 0.107 0.603 4.071 0.001
AS26 Intangible Asset -0.140 0.076 0.264 1.848 0.065
AS28 Impairment of Assets 0.070 0.037 0.126 1.894 0.059
Dependent Variable: Relevance
Reliability is one of the two fundamental qualitative characteristic of financial
reporting information. Multiple coefficients of correlation were used to assessment the
impact of Accounting Standards on reliability of financial reporting in banks. In this
way, independent variables (Accounting Standards) as predictor variables and
dependent variable (reliability) as a criterion variable were entered with the enter
method into regression equation. The multiple coefficient of correlation between the
variables in total sample (R=0.822) and R-Square to explanation of variance of
reliability was (R2=0.676) that implies 68 percent of variance of reliability is able to be
explained on the basis of predictor variables.
Model R R-Square Adjusted R-Square Std. Error of the Estimate
1 0.822 0.676 0.670 0.23182
Analysis of variance was used to determine the significance of R-Square. Since
the proportion of observed F(118.90) with the degree of freedom (8,456) was more than

214
its critical value (0.195), the R-Square (0.676) and sum up the regression was
statistically significant (P=0.001). Therefore, the results showed that there is a multiple
correlation between the accounting standards and reliability in model enter (R=0.822;
R2=0.676; df; 8, 456; F=118.90; P=0.001) (Table 5.52).
Table No.5.52
ANOVA
Model Sum of Squares df Mean Square F Sig.
1
Regression 51.117 8 6.390 118.90 0.001
Residual 24.505 456 0.054
Total 75.622 464
Dependent Variable: Reliability
As shown in the table 5.53, AS5 Prior Period Items (Beta=0.483, t=6.772,
P=0.001), AS26 Intangible Asset (Beta=0.602, t=4.172, P=0.001), AS15 Retirement
Benefits (Beta=0.151, t=3.103, P=0.002) and AS9 Revenue Recognition (Beta=0.150,
t=2.286, P=0.023) were the best predictors of reliability respectively.
Table No.5.53 Coefficients
Model
Unstandardized Coefficients
Standardized Coefficients t Sig.
B Std. Error Beta
1
(Constant) 1.692 0.159 10.614 0.001
AS5 Prior Period Items 0.346 0.051 0.483 6.772 0.001
AS9 Revenue Recognition 0.086 0.037 0.150 2.286 0.023
AS15 Retirement Benefits -0.059 0.019 0.151 3.103 0.002
AS18 Related Party Disclosures 0.109 0.061 0.210 1.793 0.074
AS22 Taxes on Income -0.129 0.075 0.170 1.721 0.086
AS25 Interim Financial
Reporting -0.011 0.091 0.018 0.118 0.906
AS26 Intangible Asset 0.269 0.065 0.602 4.172 0.001
AS28 Impairment of Assets -0.049 0.031 0.105 1.563 0.119
Dependent Variable: Reliability
Understandability is the quality of information that enables users to comprehend
its meaning. Understandability is enhanced when information is classified,
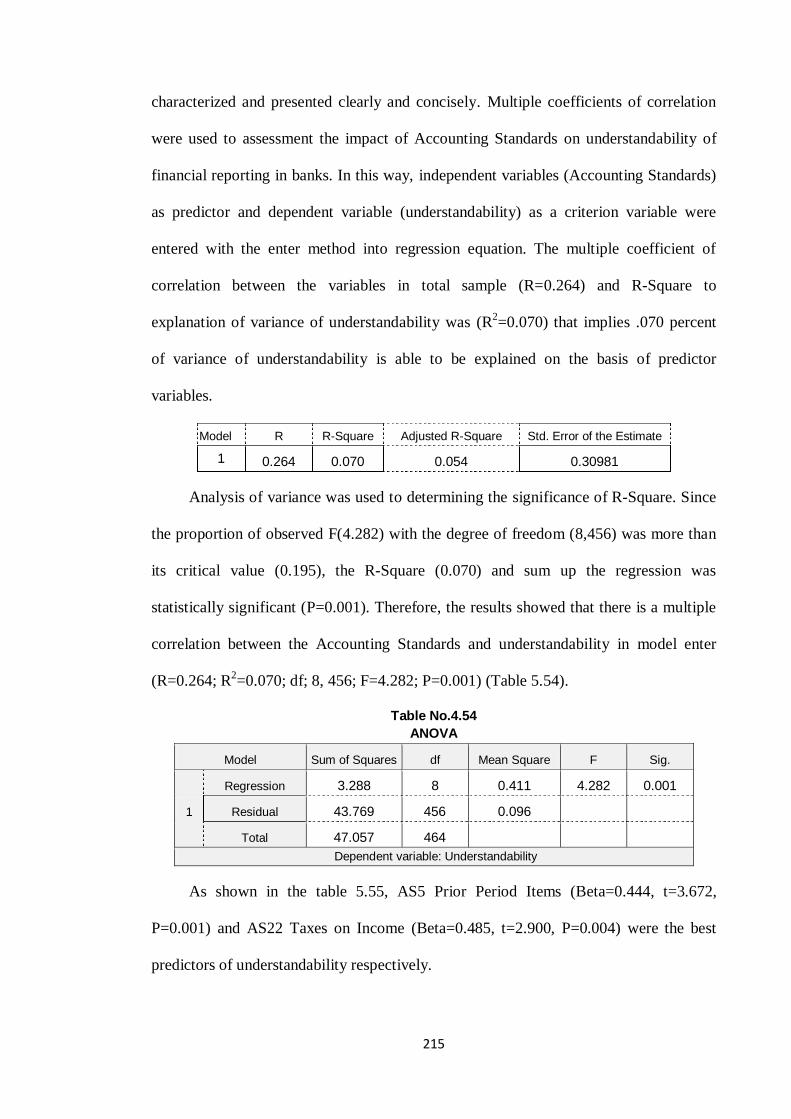
215
characterized and presented clearly and concisely. Multiple coefficients of correlation
were used to assessment the impact of Accounting Standards on understandability of
financial reporting in banks. In this way, independent variables (Accounting Standards)
as predictor and dependent variable (understandability) as a criterion variable were
entered with the enter method into regression equation. The multiple coefficient of
correlation between the variables in total sample (R=0.264) and R-Square to
explanation of variance of understandability was (R2=0.070) that implies .070 percent
of variance of understandability is able to be explained on the basis of predictor
variables.
Model R R-Square Adjusted R-Square Std. Error of the Estimate
1 0.264 0.070 0.054 0.30981
Analysis of variance was used to determining the significance of R-Square. Since
the proportion of observed F(4.282) with the degree of freedom (8,456) was more than
its critical value (0.195), the R-Square (0.070) and sum up the regression was
statistically significant (P=0.001). Therefore, the results showed that there is a multiple
correlation between the Accounting Standards and understandability in model enter
(R=0.264; R2=0.070; df; 8, 456; F=4.282; P=0.001) (Table 5.54).
Table No.4.54 ANOVA
Model Sum of Squares df Mean Square F Sig.
1
Regression 3.288 8 0.411 4.282 0.001
Residual 43.769 456 0.096
Total 47.057 464
Dependent variable: Understandability
As shown in the table 5.55, AS5 Prior Period Items (Beta=0.444, t=3.672,
P=0.001) and AS22 Taxes on Income (Beta=0.485, t=2.900, P=0.004) were the best
predictors of understandability respectively.

216
Table No.5.55 Coefficients
Model
Unstandardized
Coefficients
Standardized
Coefficients t Sig.
B Std. Error Beta
1
(Constant) 3.734 0.213 17.522 0.001
AS5 Prior Period Items 0.251 0.068 0.444 3.672 0.001
AS9 Revenue Recognition 0.062 0.050 0.139 1.246 0.213
AS15 Retirement Benefits 0.015 0.025 0.049 0.601 0.548
AS18 Related Party Disclosures 0.103 0.081 0.250 1.258 0.209
AS22 Taxes on income -0.290 0.100 0.485 2.900 0.004
AS25 Interim Financial
Reporting -0.203 0.122 0.422 1.667 0.096
AS26 Intangible Asset 0.117 0.086 0.331 1.356 0.176
AS28 Impairment of Assets -0.019 0.042 0.051 0.449 0.654
Dependent variable: Understandability
Comparability refers to the quality of information that enables users to identify
similarities in and differences between two set of economic phenomena. Multiple
coefficients of correlation were used to assessment the impact of Accounting Standards
on comparability of financial reporting in banks. In this way, independent variables
(Accounting Standards) as predictor and dependent variable (comparability) as a
criterion variable were entered with the enter method into regression equation. The
multiple coefficient of correlation between the variables in total sample (R=0.732) and
R-Square to explanation of variance of comparability was (R2=0.536) that implies 54
percent of variance of comparability is able to be explained on the basis of predictor
variables.
Model R R-Square Adjusted R-Square Std. Error of the Estimate
1 0.732 0.536 0.528 0.25703
Analysis of variance was used to determine the significance of R-Square. Since
the proportion of observed F(65.75) with the degree of freedom (8,456) was more than
its critical value (0.195), the R-Square (0.536) and sum up the regression was
statistically significant (P=0.001). Therefore, the results showed that there is a multiple

217
correlation between the accounting standards and comparability in model enter
(R=0.732; R2=0.536; df; 8, 456; F=65.75; P=0.001) (Table 5.56).
Table No.5.56 ANOVA
Model Sum of Squares df Mean Square F Sig.
1
Regression 34.751 8 4.344 65.75 0.001
Residual 30.124 456 0.066
Total 64.875 464
Dependent variable: Comparability
As shown in the table 5.57, AS22 Taxes on Income (Beta=0.773, t=6.542,
P=0.001), AS25 Interim Financial Reporting (Beta=0.639, t=3.567, P=0.001), AS5
Prior Period Items (Beta=0.509, t=5.952, P=0.001), AS18 Related Party Disclosures
(Beta=0.507, t=3.618, P=0.001), AS9 Revenue Recognition (Beta=0.401, t=5.107,
P=0.001) and AS28 Impairment of Assets (Beta=0.235, t=2.918, P=0.004) were the best
predictors of comparability respectively.
Table No.5.57 Coefficients
Model
Unstandardized Coefficients
Standardized Coefficients T Sig.
B Std. Error Beta
1
(Constant) 1.836 0.177 10.384 0.001
AS5 Prior Period Items -0.338 0.057 0.509 5.952 0.001
AS9 Revenue Recognition -0.212 0.042 0.401 5.107 0.001
AS15 Retirement Benefits 0.001 0.021 0.002 0.038 0.969
AS18 Related Party Disclosures 0.245 0.068 0.507 3.618 0.001
AS22 Taxes on Income 0.542 0.083 0.773 6.542 0.001
AS25 Interim Financial Reporting 0.361 0.101 0.639 3.567 0.001
AS26 Intangible Asset -0.099 0.072 0.240 1.388 0.166
AS28 Impairment of Assets -0.101 0.035 0.235 2.918 0.004
Dependent variable: Comparability

218
5.6. Conclusive Analysis
The conclusive analyses of the gap between the actual score and expected score
regarding the qualitative characteristics of financial reporting information in Indian
banks and different between the public and private sector banks regarding the
qualitative characteristics of financial reporting have been presented under conclusive
analysis.
5.6.1. A Comparative Study between the Actual Score and Expected Score
Regarding the Qualitative Characteristics of Financial Reporting
Information in Indian Banks.
Relevance is one of the two fundamental qualitative characteristic of financial
reporting information. Relevance was analyzed with two components: predictive value
and confirmatory value.
Relevance in measuring quality is highlighted in Table 5.58 and chart 5.24, which
present the perceptions of all the sample respondents. The total Mean and SD values for
the actual score stood at 3.63 and 0.478 respectively, while the total Mean and SD
values for the expected score stood at 3.93 and 0.607 respectively with a gap score of 6
percent. This gap reflects negatively on the banks estimations of returns, profit, social
responsibility, bank liquidity, and the fair value of the financial reports in the decision
making process of the mangers, shareholders, investors in taking an appropriate
decision to the global educative market.
The study found that on both items of relevance of financial reporting (Predictive
value and Confirmatory value) in the expected score was significantly better than the
actual score.

219
Table No.5.58
Actual score and expected score for Relevance of financial reporting information
Qualitative characteristics of financial reporting information
Actual Score Expected Score Gap
Mean SD Per cent
Mean SD Per cent
MD Per cent
Relevance 3.63 0.478 72.6 3.93 0.607 78.6 0.3 6.0
A) Predictive value 3.74 0.41 74.8 4.02 0.5 80.4 0.28 5.6
B) Confirmatory value 3.51 0.59 70.2 3.83 0.75 76.6 0.32 6.4
Source: Tables 5.4 to 5.7, SD= Standard Deviation, MD= Mean Difference
The results of t-test are given in Table 5.59. The results show that there is a
statistically significant gap between the actual score and expected score for relevance of
financial reporting information in Indian banks. As the table below, it is seen that
P = 0.001 < 0.05.
Table 5.59
Result of t-test on the actual and expected score for relevance of financial reporting
Score Type Group Statistics Paired Samples Test
Mean SD MD SD t-value df P-value Actual Score
Expected Score
3.63 0.478 0.30 0.362 17.74 464 0.001
3.93 0.609
P-value (t-test, 2 tailed), SD= Standard Deviation, MD= Mean Difference
74.8 70.2 72.680.4 76.6 78.6
5.6 6.4 6
0
20
40
60
80
100
Predictive value Confirmatory value
Relevance
Chart No.5.24 Actual score and expected score for relevance of financial
reporting information in Indian banks
Actual score Expected score Gap

220
Reliability is one of the two fundamental qualitative characteristic of financial
reporting information. Reliability was analyzed with four quality characteristics:
completeness, neutrality, free from material error and verifiability.
Reliability in measuring quality is highlighted in Table 5.60 and chart 5.25, which
present the perceptions of all the sample respondents. The total Mean and SD values for
actual score stood at 3.86 and 0.40 respectively, while the total Mean and SD values for
expected score stood at 4.08 and 0.49 respectively, with a gap score of 4.4 percent. This
gap influences negatively on Indian banking system in the mind of global people about
the governance, bonuses related information, quality of audit and decision making
process.
The study found that on the four items for reliability of financial reporting
information (completeness, neutrality, free from material error and verifiability), the
expected score was significantly better than the actual scorer.
Table No.5.60
Actual score and expected score for reliability of financial reporting information
Source: Tables 5.8 to 5.15, SD= Standard Deviation, MD= Mean Difference
Qualitative characteristics of financial reporting information
Actual Score Expected Score Gap
Mean SD Per cent
Mean SD Per cent
MD Per cent
Faithful Representation (Reliability)
3.86 0.4 77.2 4.08 0.49 81.6 0.22 4.4
A)Completeness 4.13 0.49 82.6 4.24 0.45 84.8 0.11 2.2
B)Neutrality 3.54 0.68 70.8 3.92 0.82 78.4 0.38 7.6
C)Free from material error 3.92 0.4 78.4 3.97 0.41 79.4 0.05 1.0
D) Verifiability 3.85 0.61 77.0 4.19 0.67 83.8 0.34 6.8

221
The results of t-test are given in Table 5.61. The result shows that there is a
statistically significant gap between the actual score and the expected score for
reliability of financial reporting information in Indian banks. As the table below, it is
seen that P = 0.001 < 0.05.
Table No.5.61
Result of t-test on the actual and expected score for reliability of financial reporting
Score Type Group Statistics Paired Samples Test
Mean SD MD SD t-value df P-value Actual Score
Expected Score
3.86 0.403 0.22 0.340 13.86 464 0.001
4.08 0.449
P-value (t-test, 2 tailed), SD= Standard Deviation, MD= Mean Difference
Understandability is the quality of information that enables users to comprehend
its meaning. Understandability was tested with 7 variables.
Understandability in measuring quality is highlighted in Table 5.62 and chart
5.26, which present the perceptions of all the sample respondents. The total Mean and
SD values for the actual score stood at 3.81 and 0.318 respectively, while the total Mean
and SD values for the expected score stood at 4.1 and 0.351 respectively, with a gap
score of 5.8 percent. This gap makes confusions in the minds of the investors, policy
makers, and stakeholders, in choosing Indian banks as their option. The study found that
82.6
70.878.4 77 77.2
84.878.4 79.4 83.8 81.6
2.27.6
16.8 4.4
0
10
20
30
40
50
60
70
80
90
Completeness Neutrality Free material error
Verifiability Reliability
Chart No.5.25 Actual score and expected score for reliability of financial
reporting information in Indian banks
Actual score Expected score Gap

222
as regards understandability of financial reporting the expected score was significantly
better than the actual scorer.
Table No.5.62
Actual score and expected score for Understandability of financial reporting information
Qualitative characteristic of financial reporting information
Actual Score Expected Score Gap
Mean SD Per cent
Mean SD Per cent
MD Per cent
Understandability 3.81 0.318 76.2 4.1 0.351 82 0.29 5.8
Source: Tables 5.16 to 5.17, SD= Standard Deviation, MD= Mean Difference
The results of t-test are given in Table 5.63. The results show that there is a
statistically significant gap between the actual score and the expected score relating to
the understandability of financial reporting information in Indian banks. As the table
below, it is seen that P = 0.001 < 0.05.
Table No.5.63
Result of t-test on the actual and expected score for understandability of financial
reporting
Score Type Group Statistics Paired Samples Test
Mean SD MD SD t-value df P-value
Actual Score
Expected Score
3.81 0.318 0.27 0.253 22.79 464 0.001
4.08 0.351
P-value (t-test, 2 tailed), SD= Standard Deviation, MD= Mean Difference
76.282
5.8
0
20
40
60
80
100
Understandability
Chart No.5.26 Actual score and expected score for Understandability of
financial reporting in Indian banks
Actual score Expected score Gap

223
Comparability refers to the quality of information that enables users to identify
similarities in and differences between two set of economic phenomena. Comparability
was analyzed with two components: consistency and comparable aspect.
Comparability in measuring quality is highlighted in Table 5.64 and chart 5.27,
which present the perceptions of 465 sample respondents. The total Mean and SD
values for the actual score stood at 3.50 and 0.374 respectively, while the total Mean
and SD values for the expected score stood at 3.83 and 0.477 respectively.
The study revealed that there is a difference of 6.6% in the actual score and
expected score of financial reporting information about comparability of Indian banking
financial data’s relating to past years. In the competitive global market, Indian banks
also are marketing their banking products. To ensure market potentialities, the banks
must disclose their financial information through which the users can easily understand
and make comparison. The study found that on both items of comparability of financial
reporting (Consistency and Comparable aspect), the expected score was significantly
better than the actual score.
Table No.5.64
Actual score and expected score for Comparability of financial reporting information
Qualitative characteristics of financial reporting information
Actual Score Expected Score Gap
Mean SD Per cent
Mean SD Per cent
MD Per cent
Comparability 3.5 0.374 70.0 3.83 0.477 76.6 0.33 6.6
A)Consistency 3.23 0.44 64.6 3.65 0.53 73.0 0.42 8.4
B)Comparable 3.77 0.39 75.4 4.0 0.53 80.0 0.23 4.6
Source: Tables 5.18 to 5.21, SD= Standard Deviation, MD= Mean Difference

224
The results of t-test are given in Table 5.65. The results show that there is a
statistically significant gap between the actual score and the expected score relating to
the comparability of financial reporting information in Indian banks. As the table below,
it is seen that P = 0.001 < 0.05.
Table 5.65
Result of t-test on actual and expected score for comparability of financial reporting
Score Type Group Statistics Paired Samples Test
Mean SD MD SD t-value df P-value
Actual Score
Expected Score
3.50 0.375 0.33 0.357 19.80 464 0.001
3.83 0.478
P-value (t-test, 2 tailed), SD= Standard Deviation, MD= Mean Difference
5.6.2. A Comparative Study between the Public and Private Sector Banks
Regarding the Qualitative Characteristics of Financial Reporting
Information.
Relevance in measuring quality is highlighted in Table 5.66 and chart 5.28, which
present the perceptions of 375 sample respondents of public sector banks and 90 sample
respondents of private sector banks. The total Mean and SD values of banks in the
public sector stood at 3.54 and 0.354 respectively, while the total Mean and SD values
64.6
75.47073
80 76.6
8.4 4.6 6.6
0
20
40
60
80
100
Consistency Comparable Comparability
Chart No.5.27Actual score and expected score for comparability
of financial reporting in Indian banks
Actual score Expected score Gap

225
for the private sector stood at 4.01 and 0.69 respectively with a difference score of .9.4
percent.
In private and public sector banks disclosing the financial reporting information is
based on the prudential norms of RBI and accounting principles in India. It is
unfortunate that there is a difference between the public and private sector banks to the
extent of 9.4% in relevance of financial reporting information. The study found that on
both items Predictive Value and Confirmatory Value of relevance of financial reporting,
the private sector banks significantly better than public sector banks.
Table No.5.66
Relevance of financial reporting information in Indian banks
Qualitative characteristics of financial reporting information
Public Sector Private Sector Gap
Mean SD Per cent
Mean SD Per cent
MD Per cent
Relevance 3.54 0.354 70.8 4.01 0.69 80.2 0.47 9.4
A) Predictive value 3.69 0.28 73.8 3.96 0.71 79.2 0.27 5.4
B) Confirmatory value 3.38 0.48 67.6 4.06 0.67 81.2 0.68 13.6
Source: Tables 5.22 up to 5.25, SD= Standard Deviation, MD= Mean Difference
The results of t-test are given in Table 5.67. The results show that there is a
statistically significant difference between the public and private sector banks regarding
73.8 67.6 70.879.2 81.2 80.2
5.413.6 9.4
0
20
40
60
80
100
Predictive Value
Confirmatory value
Relevance
Chart No.5.28 Relevance of financial reporting information in
Indian banks
Public sector Private Sector Gap

226
the relevance of financial reporting information. As the table below, it is seen that
P = 0.001 < 0.05.
Table No.5.67
Result of t-test on the relevance of financial reporting information in Indian banks
Sector Type Group Statistics Independent Samples Test
N Mean SD MD t-value df P-value
Public Sector
Private Sector
379 3.54 0.354 0.47 9.29 463 0.001
90 4.01 0.690
P-value (t-test, 2 tailed), SD= Standard Deviation, MD= Mean Difference
Reliability in measuring quality is highlighted in Table 5.68 and chart 5.29,
which present the perceptions of 375 sample respondents of the public sector banks and
90 sample respondents of the private sector banks. Reliability was analyzed with four
quality characteristics: completeness, neutrality, free from material error, and
verifiability. The total Mean and SD values for the public sector banks stood at 3.8 and
0.343 respectively, while the total Mean and SD values for the private sector banks
stood at 4.11 and 0.527 respectively, with a difference score of 6.2 percent.
The private sector banks are upper hand in disclosing the financial reporting
information regarding to neutrality and verifiability 85.4% and 85% respectively when
compared with public sector banks 67.2% and 75% respectively. The study discloses
that, the public sector banks are holding higher degree in disclosing the financial
reporting information regarding to completeness and free from material error 83% and
78.8% respectively when compare to private sector banks 81.4% and 76.8%
respectively. The study also depicts that, disclosing the private sector banks' financial
reporting information in respect of reliability with 82.2% is more qualitative than public
sector banks with 76%.
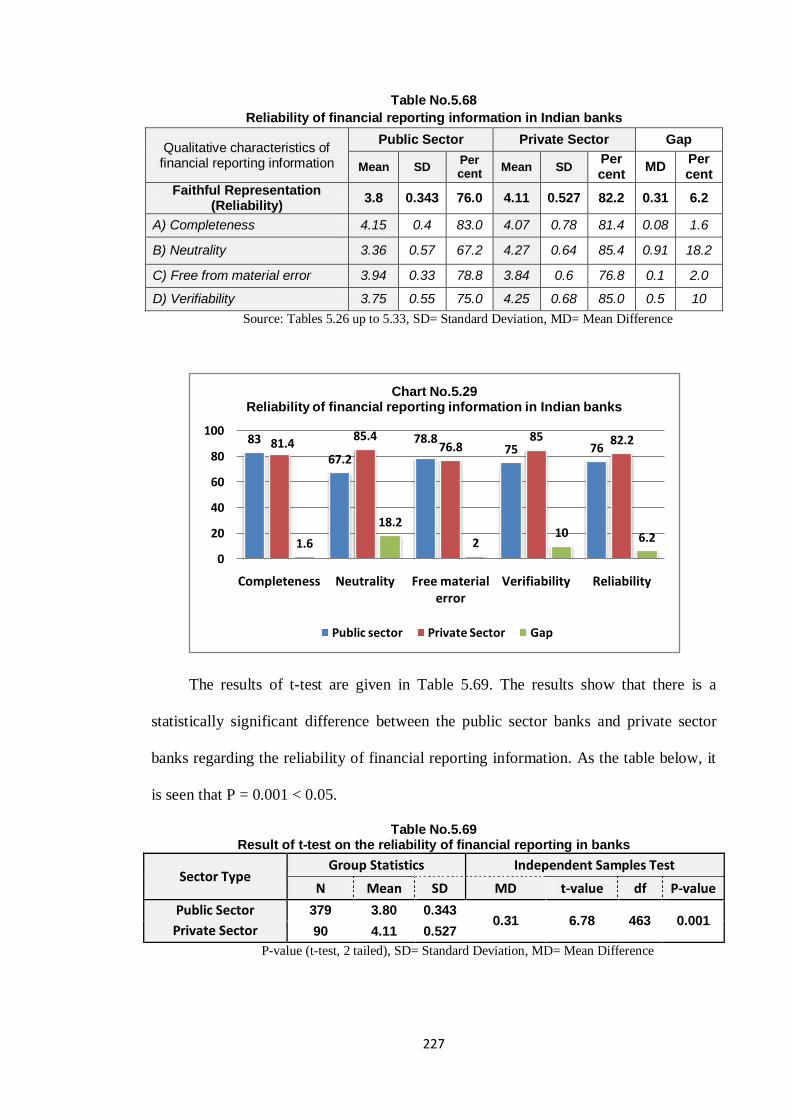
227
Table No.5.68
Reliability of financial reporting information in Indian banks
Qualitative characteristics of financial reporting information
Public Sector Private Sector Gap
Mean SD Per cent
Mean SD Per cent
MD Per cent
Faithful Representation (Reliability)
3.8 0.343 76.0 4.11 0.527 82.2 0.31 6.2
A) Completeness 4.15 0.4 83.0 4.07 0.78 81.4 0.08 1.6
B) Neutrality 3.36 0.57 67.2 4.27 0.64 85.4 0.91 18.2
C) Free from material error 3.94 0.33 78.8 3.84 0.6 76.8 0.1 2.0
D) Verifiability 3.75 0.55 75.0 4.25 0.68 85.0 0.5 10
Source: Tables 5.26 up to 5.33, SD= Standard Deviation, MD= Mean Difference
The results of t-test are given in Table 5.69. The results show that there is a
statistically significant difference between the public sector banks and private sector
banks regarding the reliability of financial reporting information. As the table below, it
is seen that P = 0.001 < 0.05.
Table No.5.69 Result of t-test on the reliability of financial reporting in banks
Sector Type Group Statistics Independent Samples Test
N Mean SD MD t-value df P-value
Public Sector
Private Sector
379 3.80 0.343 0.31 6.78 463 0.001
90 4.11 0.527
P-value (t-test, 2 tailed), SD= Standard Deviation, MD= Mean Difference
83
67.2
78.875 7681.4
85.476.8
85 82.2
1.6
18.2
210 6.2
0
20
40
60
80
100
Completeness Neutrality Free material error
Verifiability Reliability
Chart No.5.29 Reliability of financial reporting information in Indian banks
Public sector Private Sector Gap

228
Understandability in measuring quality is highlighted in Table 5.70 and chart
5.30, which present the perceptions of 375 sample respondents of the public sector
banks and 90 sample respondents of the private sector banks. The total Mean and SD
values for public sector banks stood at 3.82 and 0.31 respectively, while the total Mean
and SD values for private sector banks stood at 3.79 and 0.35 respectively, with a
difference score of 0.6 percent. The study furthermore reveals that, disclosing the public
sector banks' financial reporting information in respect of understandability with 76.4%
is more qualitative than private sector banks whit 75.8%.
The study found that understandability of financial information reported by
public sector banks significantly better than private sector banks.
Table No.5.70
Understandability of financial reporting information in Indian banks
Qualitative characteristics of financial reporting information
Public Sector Private Sector Gap
Mean SD Per cent
Mean SD Per cent
MD Per cent
Understandability 3.82 0.31 76.4 3.79 0.35 75.8 0.03 0.6
Source: Tables 5.34 up to 5.35, SD= Standard Deviation, MD= Mean Difference
76.475.8
0.60
10
20
304050
6070
80
90
Understandability
Chart No.5.30 Understandabilityof financial reporting information in
Indian banks
Public sector Private Sector Gap
229
The results of t-test are given in Table 5.71. The results show that there is no
statistically significant difference between the public sector banks and private sector
banks regarding the understandability of financial reporting information. As the table
below, it is seen that P = 0.44 > 0.05.
Table No.5.71
Result of t-test on the understandability of financial reporting information in Indian banks
Sector Type
Group Statistics Independent Samples Test
N Mean SD MD t-value d f P-
value
Public Sector
Private Sector
379 3.82 0.310 0.03 0.778 463 0.44
90 3.79 0.354
P-value (t-test, 2 tailed), SD= Standard Deviation, MD= Mean Difference
Comparability refers to the quality of information that enables users to identify
similarities in and differences between two set of economic phenomena. Comparability
was analyzed with two components: consistency and comparable.
Comparability in measuring quality is highlighted in Table 5.72 and chart 5.31,
which present the perceptions of 375 sample respondents of the public sector banks and
90 sample respondents of the private sector banks. The total Mean and SD values for
the public sector banks stood at 3.52 and 0.39 respectively, while the total Mean and SD
values for the private sector banks stood at 3.42 and 0.287 respectively, with a
difference score of 2.00 percent.
The financial reporting information in public sector banks has a higher degree
70.4% of comparability when compared to private sector banks 68.4%. The study also
shows that, there is a significant difference in the comparability of financial information
between the public and private sector banks.
The main reason for low score in comparability of financial reporting information
in private sector banks when compared to public sector banks, is that there exists high
degree of consistency and comparability with regard to using changes in accounting

230
policies disclosure, benchmark information, financial index numbers and better
disclosed items of previous year represented in financial reporting's public sector banks.
Table No.5.72
Comparability of financial reporting information in Indian banks
Qualitative characteristics of financial reporting information
Public Sector Private Sector Gap
Mean SD Per cent
Mean SD Per cent
MD Per cent
Comparability 3.52 0.39 70.4 3.42 0.287 68.4 0.1 2.0
A) Consistency 3.25 0.47 65 3.11 0.28 62.2 0.14 2.8
B) Comparable 3.78 0.38 75.6 3.73 0.4 74.6 0.05 1.0
Source: Tables 5.36 up to 5.39, SD= Standard Deviation, MD= Mean Difference
The results of t-test are given in Table 5.73. The results show that there is a
statistically significant difference between the public sector banks and public sector
banks regarding comparability of financial reporting information. As the table below, it
is seen that P = 0.02 < 0.05.
Table No.5.73
Result of t-test on comparability of financial reporting information in Indian banks
Sector Type Group Statistics Independent Samples Test
N Mean SD MD t-value df P-value
Public Sector
Private Sector
379 3.52 0.390 0.10 2.305 463 0.02
90 3.42 0.287
P-value (t-test, 2 tailed), SD= Standard Deviation, MD= Mean Difference
6575.6 70.4
62.274.6 68.4
2.8 1 2
0
10
20
30
40
50
60
70
80
Consistency Comparable Comparability
Chart No.5.31 comparability of financial reporting information in
Indian banks
Public sector Private Sector Gap

231
5.7. Conclusive Universal Analysis
The conclusive universal analyses of the results regarding the components of
quality have been analyzed under based on the gap between the actual score and the
expected score regarding the quality of financial reporting information in Indian bank,
and difference between the public and private sector banks regarding the quality of
financial reporting.
5.7.1. Actual Score and Expected Score for the Quality of Financial Reporting
Information in Indian Banks
Quality of financial reporting information in Indian banks is highlighted in Table
5.74 and chart 5.32, which present the perceptions of all the sample respondents. The
total Mean and SD values for actual score stood at 3.7 and 0.269 respectively, while the
total Mean and SD values for expected score stood at 3.98 and 0.37 respectively, with a
gap score of 5.6 percent. The study found that as regards quality of financial reporting
information in the expected score was significantly better than the actual scorer.
The practice of qualitative characteristics of financial reports in Indian banking
system in respect of relevance, reliability, understandability, and comparability are not
matching the expected standard of accounting. The study found that, the expected score
is 79.6 % and it is clearly obvious that, the expected level of accounting knowledge is
lower in banking people compared with the global standards.
Table No.5.74
Actual and expected score for quality of financials reporting information in Indian banks
No Qualitative
characteristics
Actual Score Expected Score Gap
Mean S D Per cent
Mean SD Per cent
MD Per cent
1 Relevance 3.63 0.478 72.6 3.93 0.607 78.6 0.3 6.0
2 Reliability 3.86 0.404 77.2 4.07 0.449 81.4 0.21 4.2
3 Understandability 3.81 0.318 76.2 4.1 0.351 82.0 0.29 5.8
4 Comparability 3.5 0.374 70.0 3.83 0.477 76.6 0.33 6.6
Total 3.7 0.269 74.0 3.98 0.37 79.6 0.28 5.6
Source: Tables 5.58 up to 5.65, SD= Standard Deviation, MD= Mean Difference

232
The results of t-test are given in Table 5.75. The results show that there is
statistically significant gap between the actual score and expected score relating to the
quality of financial reporting information in Indian banks. As the table below, it is seen
that P = 0.001 < 0.05.
Table No.5.75
Result of t-test on the actual and expected score regarding the quality of financial
reporting information in Indian banks
Score Type Group Statistics Paired Samples Test
Mean SD MD SD t-value df P-value Actual Score
Expected Score
3.70 0.269 0.28 0.189 31.64 464 0.001
3.98 0.370
P-value (t-test, 2 tailed), SD= Standard Deviation, MD= Mean Difference
5.7.2. Quality of Financial Reporting Information between Public and Private
Sector Banks in Indian.
Quality of financial reporting information in Indian banks is highlighted in Table
5.76 and Chart 5.33, which presents the perceptions of 375 sample respondents of the
public sector banks and 90 sample respondents of the private sector banks. The total
Mean and SD values for the public sector banks stood at 3.67 and 0.235 respectively,
while the total Mean and SD values for the private sector banks stood at 3.83 and 0.353
respectively, with a difference of 3.2 percent.
72.677.2 76.2
7074
78.681.4 82
76.6 79.6
6 4.2 5.8 6.6 5.6
010
20
30
4050
6070
80
90
Relevance Reliability Understandability Comparability Quality
Chart No.5.32 Actual score and expected score for quality of financial reporting
information in Indian banks
Actual score Expected score Gap

233
The private sector banks are upper hand in disclosing the financial reporting
information regarding to relevance and reliability 80.2% and 82.2% respectively when
compared to public sector banks 70.8% and 76% respectively.
The public sector banks are higher in disclosing the financial reporting
information regarding to understandability and comparability 76.4% and 70.4%
respectively when compared to private sector banks 75.8% and 68.4% respectively.
The study revealed that the quality of financial reporting in the private sector
banks was rather higher 76.6% than the public sector banks 73.4%. The reason for the
above result must be because of the fact that the private sector banks try to gain the
customers' reliance and to achieve acceptable auditing reports in order to reduce
operational risks are more willing to consider and apply the accounting standards. This
can be one of the factors explaining the difference related to the quality level reporting
between private and public sector banks.
Table No.5.76
Quality of financial reporting information in Indian banks
No Qualitative
characteristics
Public Sector Private Sector Gap
N Mean S D Per cent
N Mean S D Per cent
MD Per cent
1 Relevance 375 3.54 0.354 70.8 90 4.01 0.690 80.2 0.47 9.4
2 Reliability 375 3.80 0.343 76.0 90 4.11 0.527 82.2 0.31 6.2
3 Understandability 375 3.82 0.31 76.4 90 3.79 0.354 75.8 0.03 0.6
4 Comparability 375 3.52 0.39 70.4 90 3.42 0.287 68.4 0.1 2.0
Total 375 3.67 0.235 73.4 90 3.83 0.353 76.6 0.16 3.2
Source: Tables 5.66 up to 5.73, SD= Standard Deviation, MD= Mean Difference

234
The results of t-test are given in Table 5.77. The results show that there is a
statistically significant difference between the public and the private sector banks
regarding the quality of financial reporting information. As the table below, it is seen
that P = 0.001 < 0.05.
Table No.5.77
Results of T-test on quality of financial reporting information in Indian Banks
Sector Type Group Statistics Independent Samples Test
N Mean SD MD t-value df P-value
Public Sector
Private Sector
375 3.67 0.235 0.16 5.34 463 0.001
90 3.83 0.353
P-value (t-test, 2 tailed), SD= Standard Deviation, MD= Mean Difference
5.8. Conclusive Regression Analysis
The conclusive regression analysis of the results regarding the quality of financial
reporting information have been analyzed according to the impact of the RBI prudential
norms on quality of financial reporting information in banks, and impact of Accounting
Standards on quality of financial reporting information in banks.
70.876 76.4
70.4 73.480.2 82.2
75.868.4
76.6
9.4 6.20.6 2 3.2
0102030405060708090
Relevance Reliability Understandability Comparability Total
Chart No.5.33 Quality of financial reporting information in Indian banks
Public sector Private Sector Gap
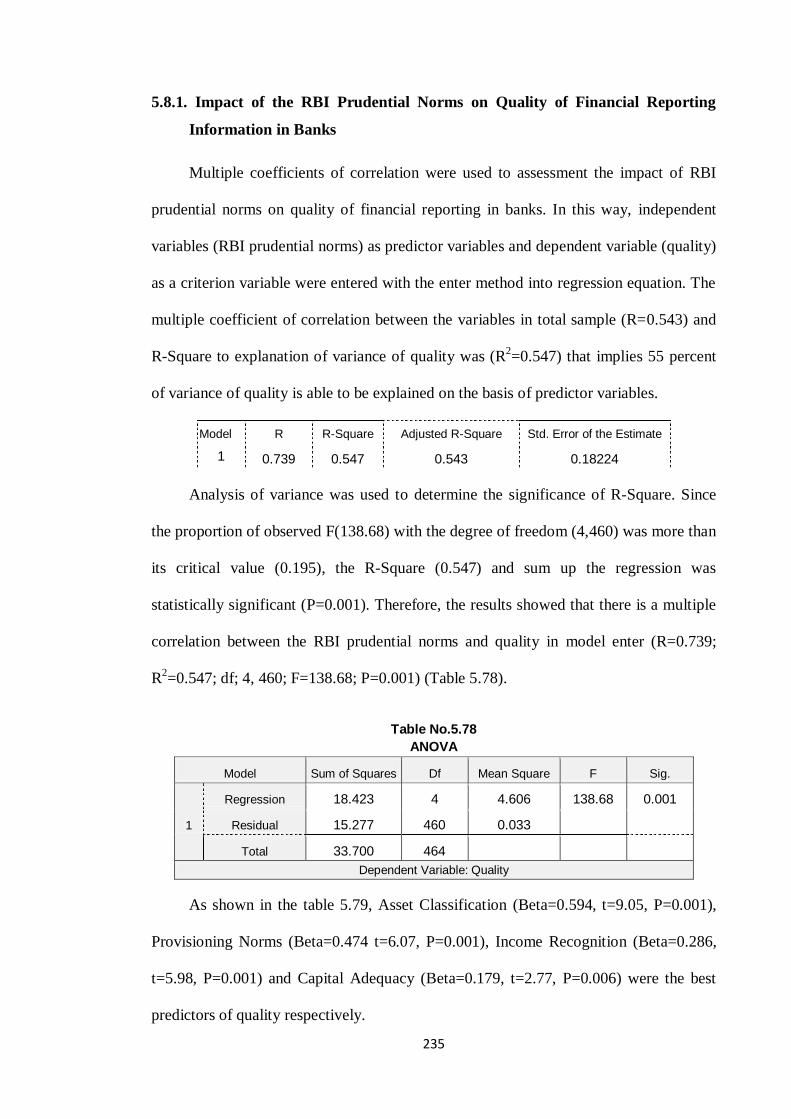
235
5.8.1. Impact of the RBI Prudential Norms on Quality of Financial Reporting
Information in Banks
Multiple coefficients of correlation were used to assessment the impact of RBI
prudential norms on quality of financial reporting in banks. In this way, independent
variables (RBI prudential norms) as predictor variables and dependent variable (quality)
as a criterion variable were entered with the enter method into regression equation. The
multiple coefficient of correlation between the variables in total sample (R=0.543) and
R-Square to explanation of variance of quality was (R2=0.547) that implies 55 percent
of variance of quality is able to be explained on the basis of predictor variables.
Model R R-Square Adjusted R-Square Std. Error of the Estimate
1 0.739 0.547 0.543 0.18224
Analysis of variance was used to determine the significance of R-Square. Since
the proportion of observed F(138.68) with the degree of freedom (4,460) was more than
its critical value (0.195), the R-Square (0.547) and sum up the regression was
statistically significant (P=0.001). Therefore, the results showed that there is a multiple
correlation between the RBI prudential norms and quality in model enter (R=0.739;
R2=0.547; df; 4, 460; F=138.68; P=0.001) (Table 5.78).
Table No.5.78 ANOVA
Model Sum of Squares Df Mean Square F Sig.
1
Regression 18.423 4 4.606 138.68 0.001
Residual 15.277 460 0.033
Total 33.700 464
Dependent Variable: Quality
As shown in the table 5.79, Asset Classification (Beta=0.594, t=9.05, P=0.001),
Provisioning Norms (Beta=0.474 t=6.07, P=0.001), Income Recognition (Beta=0.286,
t=5.98, P=0.001) and Capital Adequacy (Beta=0.179, t=2.77, P=0.006) were the best
predictors of quality respectively.

236
Table No.5.79 Coefficients
Model
Unstandardized Coefficients
Standardized Coefficients T Sig.
B Std. Error Beta
1
(Constant) 2.402 0.146 16.47 0.001
Asset Classification 0.398 0.044 0.594 9.05 0.001
Provisioning Norms 0.268 0.056 0.474 6.07 0.001
Capital Adequacy -0.106 0.038 0.179 2.77 0.006
Income Recognition 1.255 0.063 0.286 5.98 0.001
Dependent Variable: Quality
5.8.2. Impact of Accounting Standards on Quality of Financial Reporting
Information in Banks
Multiple coefficients of correlation were used to assessment the impact of
Accounting Standards on quality of financial reporting information in banks. In this
way, independent variables (Accounting Standards) as predictor variables and
dependent variable (quality) as a criterion variable were entered with the enter method
into regression equation. The multiple coefficient of correlation between the variables in
total sample (R=0.874) and R-Square to explanation of variance of quality was
(R2=0.764) that implies 76 percent of variance of quality is able to be explained on the
basis of predictor variables.
Model R R-Square Adjusted R-Square Std. Error of the Estimate
1 0.874 0.764 0.759 0.13217
Analysis of variance was used to determining the significance of R-Square.
Since the proportion of observed F(187.15) with the degree of freedom (8,456) was
more than its critical value (0.195), the R-Square (0.764) and sum up the regression was
statistically significant (P=0.001). Therefore, the results showed that there is a multiple
correlation between Accounting Standards and quality in model enter (R=.874;
R2=0.759; df; 8, 456; F=184.15; P=0.001) (Table 5.80).

237
Table No.5.80
ANOVA
Model Sum of Squares df Mean Square F Sig.
1
Regression 25.734 8 3.217 184.15 0.001
Residual 7.966 456 0.017
Total 33.700 465
Dependent variable: Quality
As shown in the table 5.81, AS18 Related Party Disclosures (Beta=0.494,
t=4.941, P=0.001), AS25 Interim Financial Reporting (Beta=0.353, t=2.801, P=0.005),
AS15 Retirement Benefits (Beta=0.104, t=2.499, P=0.013) and AS5 Prior Period Items
(Beta=0.135, t=2.221, P=0.027) were the best predictors of quality respectively. In other
words, higher the compliance with Accounting Standards, higher is the quality of
financial reporting in banks.
Table No.5.81 Coefficients
Model
Unstandardized Coefficients
Standardized Coefficients t Sig.
B Std. Error Beta
1
(Constant) 2.116 0.091 23.276 0.001
AS5 Prior Period Items 0.065 0.029 0.135 2.221 0.027
AS9 Revenue Recognition 0.014 0.021 0.037 0.662 0.508
AS15 Retirement Benefits -0.027 0.011 0.104 2.499 0.013
AS18 Related Party Disclosures 0.172 0.035 0.494 4.941 0.001
AS22 Taxes on Income 0.038 0.043 0.074 0.880 0.379
AS25 Interim Financial Reporting 0.146 0.052 0.353 2.801 0.005
AS26 Intangible Asset 0.037 0.037 0.124 1.004 0.316
AS28 Impairment of Assets -0.025 0.018 0.080 1.384 0.167
Dependent Variable: Quality
5.9. Conclusion
In this chapter by using different statistical tests, the study analyzed and
interpreted the data in three levels; universal analysis, regression analysis, and
conclusive analysis. The universal analysis contained two different sections. In the first

238
section, we determined the gap of the variables of components of qualitative
characteristics of financial reporting information between actual score and expected
score based on the aggregated perception of all respondents. In the second section, we
determined the different scores of the variables of components of qualitative
characteristics of financial information reporting between the public sector banks and
private sector banks. The regression analysis contained two different sections. In the
first section, we determined the impact of the RBI prudential norms on components of
qualitative characteristics of financial reporting information in banks. In the second
section, we determined the impact of Accounting Standards on components of
qualitative characteristics of financial reporting information in banks. The conclusive
analysis contained three different sections. In the first section of conclusive analysis, we
determined the gap between the actual score and the expected score of qualitative
characteristics of financial reporting information in banks. In the second section of
conclusive analysis, we determined the difference in the scores of qualitative
characteristics of financial reporting information between the public sector banks and
the private sector banks. In the third section of conclusive universal analysis we
determined the gap between the actual score and the expected score in quality of
financial reporting information, and determined the difference in quality of financial
reporting information between the public sector banks and the private sector banks. This
section of conclusive analysis also revealed the impact of RBI prudential norms on
quality of financial reporting information in banks and the impact of Accounting
Standards on quality of financial reporting information in banks.