Embed Size (px)
Citation preview
CHAPTER V
CONCLUSION AND RECOMMENDATION
This chapter explains about the findings of the research. The author will elaborate more
on the conclusion, managerial implications, limitations, and give suggestions for future
research.
5.1 Conclusion
To look back of what have already been discussed, these are the few key important
points of this research. This is a replication research and is titled “Analyzing the
relationship between shopping orientation (hedonism and utilitarianism) and perceived
value, store loyalty, and purchased amount: the case of MAP fashion store in Jakarta”
and the research aims to find out:
1. Whether hedonism and utilitarianism shopping orientation have impact on perceived
value
2: Whether hedonism and utilitarianism shopping orientation have impact on store
loyalty
3: Whether shopping orientation has impact on purchased amount
4: Whether perceived value have impact on store loyalty
5: Whether perceived value have impact on purchase amount

This is a replica research from original journal “Fashion stores between fun and
usefulness” by Daniele Scarpi in 2006. The original previous research was done in Italy,
and the current research was done in Jakarta, therefore making it to have different result
of the findings.
During the research, the author uses descriptive analysis (factor analysis), reliability and
validity test, and linear regression multiple and simple) which are checked by SPSS
20.0 to test on the hypotheses. 150 respondents were used to conduct this research on
paper-based questionnaires that are distributed through author’s convenient sampling
(Bina Nusantara Univeristy, Plaza Indonesia and Grand Indonesia). There are 8
hypotheses in this research, and 4 of them were rejected.
From the result, hedonism and utilitarianism contributes in the perceived value, store
loyalty and purchased amount in fashion stores in Jakarta. The result of the research
shows the relationship between the shopping orientations, which are hedonism and
utilitarianism towards perceived value, store loyalty, and purchased amount. There are 5
variables in this research, and there are 8 hypotheses to be analyzed. Out of 8
hypotheses, there are 4 hypotheses that are rejected because there is no significance
relationship between the variables.
5.2 Managerial Implications
During the writing process, the author has few findings that will be useful in the future
as implications and it is expected to be beneficial to those who are engaged in shopping
in fashion stores.
There are two types of shoppers in MAP fashion stores in Jakarta. Those
shoppers that are being studied in this research are hedonic shoppers and
utilitarian shoppers, which both exist as the shopping orientation. Knowing the
customers’ shopping behavior is important for the managers of the stores in
order to make a proper marketing strategy. Having to know that these two types
of customers exist, managers can choose whether they going to implant a
marketing strategy to target hedonic shoppers or utilitarian shoppers, or maybe
both.
Based on the findings, utilitarian shoppers who are shopping in MAP don’t have
positive impact on store loyalty while hedonic shoppers have a positive impact.
Price, quality, and availability of the products can trigger this situation to
happen. Utilitarian shoppers are shoppers who only buy products based on their
needs and shop only for task related. Therefore, price can be a factor for this as
they can just choose another store to buy the items that they are looking for.
Another factor can be the quality as some people might seek for a good quality
and some don’t really care about the quality. However, managers need to
understand this problem. It is difficult to set prices that are low and suitable for
the customers while trying to meet their expectations such as quality. In
addition, when utilitarian shoppers are looking for certain items, they don’t
necessarily have to buy from one specific store because the items may not be
available in those stores. Moreover, utilitarian shoppers will be disappointed if
they can’t find the items that they are looking for in the store, or rather the items
are disappointing. With that being said, it is difficult to maintain utilitarian
shoppers’ store loyalty. Managers of the stores might want to consider
implementing strategy to maintain hedonic shoppers.
There is no relationship between utilitarianism and purchased amount. This
proves that utilitarian shoppers only buy specific items that they need, which can
be just few things with lesser amount that the hedonic shoppers would purchase.
The term hedonism itself means making a purchase based on the fun and
playfulness and does not really based on the items, so in other words, they tend
to shop spontaneously and does not really care whether they need the items or
not. With that being said, we can conclude that utilitarian shoppers buy fewer
items with lesser amount than hedonic shoppers. MAP fashion stores are placed
in major malls in Jakarta with high traffic, great shopping ambience such as
clean and tidy as well as nice decorations. Moreover, most of its stores have
great store atmosphere where it will make it enjoyable for customers to shop,
and on top of all, stores are located strategic places for customers to shop
hedonically to increase the sales. If MAP business plan involves making
customers to purchase more in the stores, that we can conclude that MAP has

successfully implement their marketing strategy and target their customers very
well.
5. 3 Limitations
There are few aspects that are limiting the author to conduct the research, which the
author did not manage to cover. The author will list what are the limitations so that it
will be beneficial for the purpose of next research on this study.
Limited to only 3 fashion stores and those stores are under MAP fashion stores.
The reason why the author chose stores that are under MAP is to simplify the
research and to be more specific, and most importantly, because most of MAP
fashion stores have the same target market. Moreover, the author chose those 3
stores, which are Zara, Bershka, and Pull and Bear is because those are the
stores that have been known to be the top 3 “top of the mind” store, based o the
pilot study that the author has conducted.
Limited to only 150 respondents, and those respondents are only those that are
in Jakarta. With more respondents, there might be more things that can be
discovered and investigated. The author only conducts this research in one
specific area/city, which is Jakarta, rather than the country (Indonesia) as a
whole because the author is currently based in Jakarta. The author believes that
people in Indonesia are diverse, meaning; people in Jakarta will have different

characteristics than people in (example) Bandung, Surabaya, Makassar.
Therefore, the result of this research does not apply to city outside Jakarta
There can be other ways to analyze this research, however, the author only use
Reliability and Validity Test by Cronbach’s alpha, factor analysis that includes
KMO and Barlatt’s test with fixed number of 1, as well as multiple and simple
regression analysis. The reason is to make it easier and more simplified.
5.4 Recommendations for future research
After finishing this research, the author would like to give some recommendations that
can be used in order to conduct future research.
The author did not cover the research in the country (Indonesia) as a whole,
rather only focus and limit it to people in Jakarta. The author believes that
people in different cities have different characteristics; therefore, in order to gain
further insight of the study, it will be beneficial if the future research will cover
other cities such as Bali, Bandung, Medan, Manado, etc.
For future use, the author also recommends to not focus on these fashion stores
that are under MAP, because some other stores may have different marketing
strategy such as pricing and target market.

Future research can involve alternative research, such as focus group or
interview. By conducting this qualitative research, it will be beneficial because it
can go through in depth study, as well as to cover other aspects such as
psychological reaction or behavior.

Bibliography
Anonymous. (2011). Retail Sales Survey. Retrieved 03 28, 2012, from Bi.Go.Id:
http://www.bi.go.id/NR/rdonlyres/4FFC1E56-2B1F-4563-A997-
95862DB80B16/25407/SPE12e.pdf
Antariksa, Y. (2011). blog strategi + manajemen. Retrieved 02 10, 2012, from The Rise
of Indonesian Middle Class: http://strategimanajemen.net/2011/12/12/the-rise-of-
indonesian-middle-class/
Atradius. Atradius Country Report. Jakarta: Atradius.
Bank, T. W. (2009). The World Bank. Retrieved 03 28, 2012, from The World Bank:
http://data.worldbank.orThe =g/country/indonesia
Benton, S. (2007). The Importance of Style and Fashion in Today's Society. Retrieved
03 28, 2012, from Ezine Articles: http://ezinearticles.com/?The-Importance-of-Style-
and-Fashion-in-Todays-Society&id=1700160
Bermudez, J. (2012). Analysis: Indonesia: On the market. Retrieved 04 01, 2012, from
The Jakarta Post: Jacobo Bermudez
Binninger, A.-S. (2008). Exploring the relationships between retail brands and
consumer store loyalty. International Journal of Retail & Distribution Management ,
94-110.

Carpenter, J. M. (2005). Consumer shopping value, satisfaction, and loyalty for retail
apparel brands. Journal of Fashion Marketing and Management , 256-269.
ESQ-NEWS.com. (2011). http://esq-news.com/2011/berita/10/20/tertinggi-di-asia-
pertumbuhan-jumlah-orang-kaya-ri.html. Retrieved 01 18, 2012, from Tertinggi di
Asia, Pertumbuhan Jumlah Orang Kaya RI: http://esq-
news.com/2011/berita/10/20/tertinggi-di-asia-pertumbuhan-jumlah-orang-kaya-ri.html
Fashionproducts.com. (2010). Fashion Products. Retrieved 02 10, 2012, from Fashion
Accessories Overview: http://www.fashionproducts.com/fashion-accessories-
overview.html
Heine, K. (2012). Luxury Glossary. Retrieved 03 28, 2012, from The Concept of
Luxury Brands Main menu : http://www.conceptofluxurybrands.com/concept/luxury-
glossary
Indonesia, P. (2008). Plaza Indonesia Shopping Center. Retrieved 03 27, 2012, from
Plaza Indonesia Realty:
http://www.plazaindonesiarealty.com/detail_news.php?id_ref_menu=28&id_parents_m
enu=4&id_news=4&id_ref_news_category=1
Irani, N. (2011). The Effects of Variety-seeking Buying Tendency and Price Sensitivity
on Utilitarian and Hedonic Value in Apparel Shopping Satisfaction. International
Journal of Marketing Studies , 89-107.

Jack, T. (2009). FASHION : ALTERNATIVE HEDONISM: WHY LUXURY GROWS.
Retrieved 03 28, 2012, from The Melbourne Review:
http://www.melbournereview.com.au/read/148/
Juan Carlos Fandos Roig, J. S. (2006). Customer Perceived Value in Banking Services.
LVMH. (2012). LVMH - Indonesia will become the largest luxury market in Southeast
Asia. Retrieved 03 27, 2012, from CPP-LUXURY.com: http://www.cpp-
luxury.com/en/lvmh---indonesia-will-become-the-largest-luxury-market-in-southeast-
asia_2152.html
Malhotra, N.K. (2010). Marketing Research: an Applied Orientation. New Jersey:
Pearson Education.
Miranda, M. J. (2009). Engaging the purchase motivations to charm shoppers.
Marketing Intelligence & Planning, 27, 127-145.
Nielsen. Consumers and Designer Brands. America: Global Nielsen Report.
Park-Poaps, J. K. (2009). Hedonic and utilitarian shopping motivations of fashion
leadership. JFMM , 312-328.
Perkasa, P. M. (2011). Company Overview. Retrieved March 28, 2012, from MAP
Mitra AdiPerkasa: http://map-indonesia.com/flash/main.php
Richard Michon, H. Y. (2007). The influence of mall environment on female fashion
shoppers’ value and behaviour. Journal of Fashion Marketing and Management , 456-
468.

Ryu, K. (2010). Relationships among hedonic and utilitarian values, satisfaction and
behavioral intentions in the fast-casual restaurant industry. International Journal of
Contemporary Hospitality Management , 416-432.
Salim, L. Store Loyalty Determinants : Of Modern Retailing in Indonesia A Structural
Equation Modelling (SEM). Malaysia: Universiti Utara Malaysia.
Sarkar, A. (2011). Impact of Utilitarian and Hedonic Shopping Values on Individual’s
Perceived Benefits and Risks in Online Shopping. International Management Review ,
58-95.
Scarpi, D. (2006). Fashion stores between fun and usefulness. Journal of Fashion
marketing and management , 7-24.
simamora, e. (2011). Marak hingga Pasar Tradisional Konsumsi Produk Impor Makin
Tinggi. Retrieved 03 27, 2012, from Medan Bisnis:
http://www.medanbisnisdaily.com/news/read/2011/05/11/33517/marak_hingga_pasar_t
radisional_konsumsi_produk_impor_makin_tinggi/
Soelaeman, H. T. (2009). Surganya Pemburu dan Pemilik Merek Supermewah.
Retrieved 03 29, 2012, from SWA Sembada :
http://202.59.162.82/swamajalah/tren/details.php?cid=1&id=9161&pageNum=5
Tempo, T. (2012). http://id.berita.yahoo.com/ledakan-jumlah-orang-kaya-baru-di-
indonesia-033632119.html. Retrieved 02 21, 2012, from Ledakan Jumlah Orang Kaya
Baru di Indonesia: http://id.berita.yahoo.com/ledakan-jumlah-orang-kaya-baru-di-
indonesia-033632119.html

Wirtz, J., Mattila, A. S., & Tan, R. L. (2007). The role of arousal congruency in
influencing consumers’ satisfaction evaluations and in-store behaviors. International
Journal of Service Industry Management, 18 (1), 6-24.
Wulandari, K. (2009). My Jakarta: Heidi Laksana, Gucci Store Supervisor. Retrieved
03 28, 2012, from Jakarta Globe: http://www.thejakartaglobe.com/home/my-jakarta-
heidi-laksana-gucci-store-supervisor/332786
Yavas, U. (2009). Retail store loyalty: a comparison of two customer segments.
International Journal of Retail & Distribution Management , 477-492.
Yu, L. (2006). CROSS-SHOPPING AND SHOPPING ORIENTATION: CONSUMER
PERCEIVED VALUE IN TODAY’S DYNAMIC RETAIL ENVIRONMENT. Greensboro:
ProQuest.
COVER LETTER
Kepada Yth.
Bpk / Ibu/ Sdr./ i.
Di Tempat
Dengan Hormat,
Nama Saya Pingkan Isabella Wantah, mahasiswi Bina Nusantara Internasional jurusan
marketing. Berkenaan dengan pengerjaan skripsi saya yang berjudul ‘Analyzing the
relationship between shopping orientation (hedonism and utilitarianism) and perceived
value, store loyalty, and purchase amount: the case of MAP fashion stores in Jakarta’.
Kesediaan waktu anda untuk mengisi angket ini saat di harapkan untuk membantu
mengisi riset saya.
Seluruh informasi yang anda berikan bersifat konfidensial dan hanya akan digunakan
untuk kebutuhan akademis. Terima kasih atas waktu dan perhatian anda.
Hormat Saya,
Pingkan Isabella WantaH
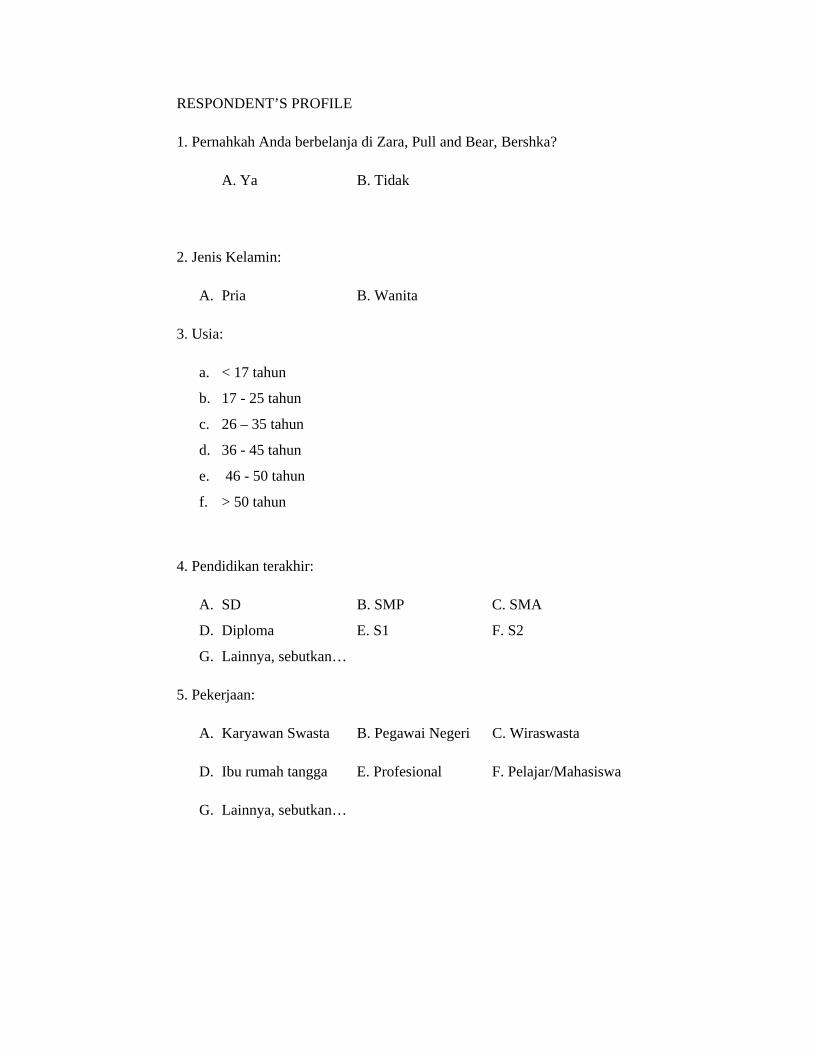
RESPONDENT’S PROFILE
1. Pernahkah Anda berbelanja di Zara, Pull and Bear, Bershka?
A. Ya B. Tidak
2. Jenis Kelamin:
A. Pria B. Wanita
3. Usia:
a. < 17 tahun
b. 17 - 25 tahun
c. 26 – 35 tahun
d. 36 - 45 tahun
e. 46 - 50 tahun
f. > 50 tahun
4. Pendidikan terakhir:
A. SD B. SMP C. SMA
D. Diploma E. S1 F. S2
G. Lainnya, sebutkan…
5. Pekerjaan:
A. Karyawan Swasta B. Pegawai Negeri C. Wiraswasta
D. Ibu rumah tangga E. Profesional F. Pelajar/Mahasiswa
G. Lainnya, sebutkan…

6. Pengeluaran Anda Sebulan:
a. < Rp 2.500.000
b. Rp 2.500.001 – Rp 7.500.000
c. Rp 7.500.001 – Rp 12.500.000
d. Rp 12.500.001 – Rp 17.500.000
e. Rp 17.500.001 – Rp 20.000.000
f. > Rp 20.000.000
7. Dari ketiga toko ini, manakah yang terakhir anda kunjungi?
A. Zara
B. Bershka
C. Pull and Bear
8. Kapan terakhir anda berkunjung di toko tersebut ?
a. < 1 minggu
b. 2 – 6 minggu
c. 7 – 11 minggu
d. 12 – 16 minggu
e. > 16 minggu

Jawablah pertanyaan dibawah ini berdasarkan jawaban anda pertanyaan nomor 7
Sangat
Tidak
Setuju
Tidak
Setuju
Netral Setuju Sangat setuju
Aktivitas belanja di toko ini menyenangkan
Saya suka kegiatan belanja di toko ini, bukan hanya
karena barang yang saya beli
Saya belanja di toko ini bukan karena saya harus,
tetapi karena saya mau
Saya menikmati aktivitas berbelanja ini karena saya
bisa membeli secara spontan
Saya mendapatkan barang yang saya mau pada saat
belanja di toko ini
Saya hanya mendapatkan barang yang saya cari di
toko ini
Saya kecewa karena masih harus ke toko lain untuk
melengkapi belanja
Saya akan datang lagi ke toko ini
Saya akan mengunjungi toko lainnya sebelum saya
datang ke toko ini
Lain kali bila saya akan ke toko fashion, saya akan
mengunjungi toko ini
Harga barang di toko ini sesuai untuk saya
Secara kesuluruhan, aktivitas belanja ini memuaskan
Saya belanja dengan baik di toko ini
Saya telah membeli barang-barang mahal di toko ini
Berapa banyak barang yang Anda beli di toko ini pada kunjungan terakhir?
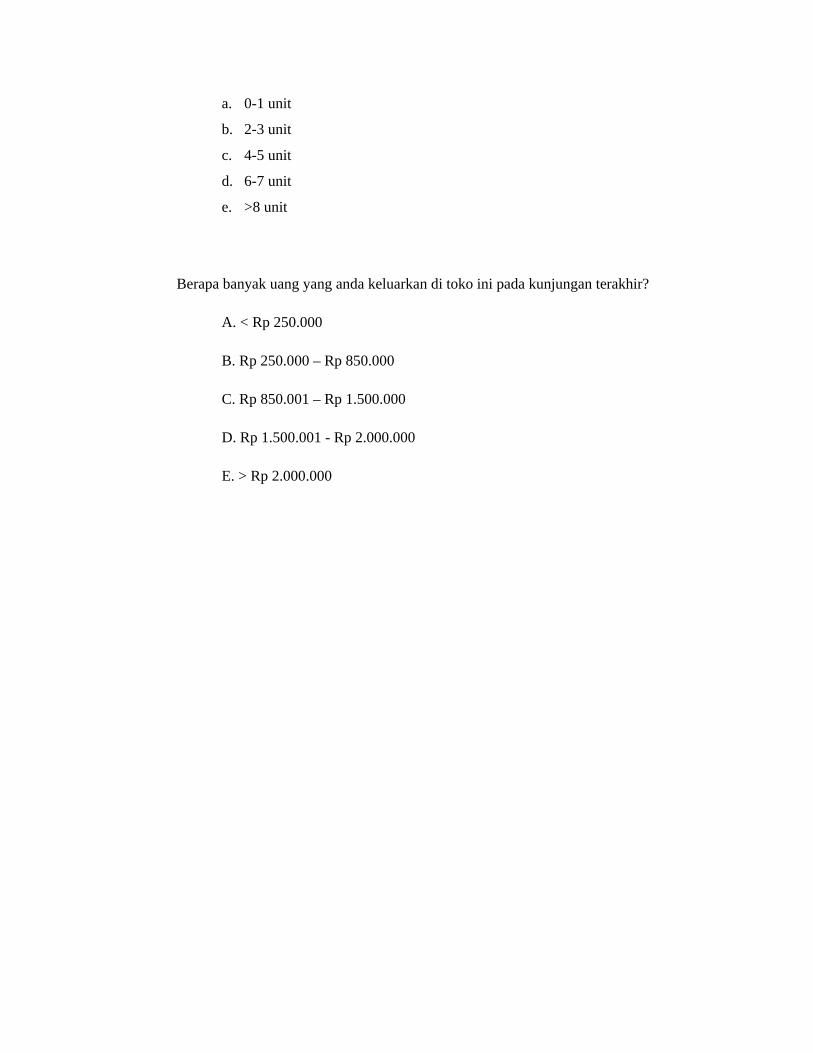
a. 0-1 unit
b. 2-3 unit
c. 4-5 unit
d. 6-7 unit
e. >8 unit
Berapa banyak uang yang anda keluarkan di toko ini pada kunjungan terakhir?
A. < Rp 250.000
B. Rp 250.000 – Rp 850.000
C. Rp 850.001 – Rp 1.500.000
D. Rp 1.500.001 - Rp 2.000.000
E. > Rp 2.000.000

CURRICULUM VITAE
Personal Information
Name: Pingkan Isabella Wantah
Gender: Female
Date of Birth: 20 September 1991
Country of Birth: Indonesia
Contact Number: +6281294037643
Email: [email protected]
Address: Jl. Anggrek Rosliana blok F no. 6, West Jakarta, Indonesia
Language Spoken: English (Fluent), Mandarin Chinese (Fluent), Bahasa Indonesia (Fluent), German (Basic)
Qualifications
‐ The ability to work in high pressure job setting ‐ Skilled communicator and negotiator ‐ Good interpersonal skill ‐ Developing/maintaining business to business/business to customer relationship ‐ Able to adjust with the ever changing business situations ‐ Able to give high level of hospitality ‐ Good appearance ‐ Good networking and high capability to socialize well ‐ Active an independent
Achievements & Certificates
Cambridge International Certificate for O’ Level
John Robert Powers Certificate

Result of Demographic Data
Statistics Jenis
Kelamin Usia Pendidikan Pekerjaan Pengeluaran
N Valid 150 150 150 150 150 Missing 0 0 0 0 0
Jenis Kelamin Frequency Percent Valid Percent Cumulative
Percent
Valid Pria 75 50.0 50.0 50.0Wanita 75 50.0 50.0 100.0Total 150 100.0 100.0
Usia Frequency Percent Valid Percent Cumulative
Percent
Valid
< 17 tahun 9 6.0 6.0 6.018 - 25 tahun 73 48.7 48.7 54.726 - 35 tahun 39 26.0 26.0 80.736 - 45 tahun 17 11.3 11.3 92.046 - 50 tahun 7 4.7 4.7 96.7> 50 tahun 5 3.3 3.3 100.0Total 150 100.0 100.0
Pendidikan
Frequency Percent Valid Percent Cumulative Percent
Valid
SMP 6 4.0 4.0 4.0
SMA 48 32.0 32.0 36.0
Diploma 22 14.7 14.7 50.7
S1 60 40.0 40.0 90.7
S2 14 9.3 9.3 100.0
Total 150 100.0 100.0

Pekerjaan Frequency Percent Valid Percent Cumulative
Percent
Valid
Karyawan Swasta 46 30.7 30.7 30.7Pegawai Negeri 6 4.0 4.0 34.7Wiraswasta 21 14.0 14.0 48.7Ibu Rumah tangga 11 7.3 7.3 56.0Profesional 11 7.3 7.3 63.3Pelajar/Mahasiswa 54 36.0 36.0 99.3Lainnya 1 .7 .7 100.0Total 150 100.0 100.0
Pengeluaran Frequency Percent Valid
Percent Cumulative
Percent
Valid
< Rp 2.500.000 21 14.0 14.0 14.0Rp 2.500.001-Rp 7.500.000
55 36.7 36.7 50.7
Rp 7.500.001-Rp 12.500.000
39 26.0 26.0 76.7
Rp 12.500.001-Rp 17.500.000
16 10.7 10.7 87.3
Rp 17.500.001 - Rp 20.000.000
4 2.7 2.7 90.0
> Rp 20.000.000 15 10.0 10.0 100.0Total 150 100.0 100.0

Filtered Question
Statistics Toko Terakhir
Kunjungan
N Valid 150 150Missing 0 0
Toko Frequency Percent Valid Percent Cumulative
Percent
Valid
Zara 107 71.3 71.3 71.3Bershka 19 12.7 12.7 84.0Pull and Bear 24 16.0 16.0 100.0Total 150 100.0 100.0
Terakhir Kunjungan Frequency Percent Valid Percent Cumulative
Percent
Valid
< 1 minggu 69 46.0 46.0 46.02-6 minggu 47 31.3 31.3 77.37-11 minggu 20 13.3 13.3 90.712-16 minggu 10 6.7 6.7 97.3> 16 minggu 4 2.7 2.7 100.0Total 150 100.0 100.0

Pre Test Reliability HEDONISM
Reliability StatisticsCronbach's Alpha N of Items
.897 4 UTILITARIANISM
Reliability StatisticsCronbach's Alpha N of Items
.785 3
Perceived Value
Reliability Statistics Cronbach's Alpha N of Items
.910 3
Store Loyalty
Reliability Statistics
Cronbach's Alpha N of Items
.650 3
Purchased Amount
Reliability StatisticsCronbach's Alpha N of Items
.796 3

Pre Test Validity HEDONISM
KMO and Bartlett's TestKaiser-Meyer-Olkin Measure of Sampling Adequacy. .816
Bartlett's Test of Sphericity Approx. Chi-Square 68.694 df 6 Sig. .000
Communalities Initial Extraction Hedonism1 1.000 .828Hedonism2 1.000 .769Hedonism3 1.000 .747Hedonism4 1.000 .746Extraction Method: Principal Component Analysis.
Total Variance Explained Component Initial Eigenvalues Extraction Sums of Squared
Loadings Total % of
Variance Cumulative
% Total % of
Variance Cumulative
% 1 3.090 77.251 77.251 3.090 77.251 77.2512 .374 9.344 86.595 3 .338 8.460 95.055 4 .198 4.945 100.000
Extraction Method: Principal Component Analysis.

Pre Test Validity UTILITARIANISM
KMO and Bartlett's TestKaiser-Meyer-Olkin Measure of Sampling Adequacy. .638
Bartlett's Test of Sphericity Approx. Chi-Square 30.231 df 3 Sig. .000
Communalities Initial Extraction Utilitarianism1 1.000 .812Utilitarianism2 1.000 .787Utilitarianism3 1.000 .521Extraction Method: Principal Component Analysis.
Total Variance ExplainedComponent Initial Eigenvalues Extraction Sums of Squared
Loadings Total % of
Variance Cumulative
% Total % of
Variance Cumulative
% 1 2.120 70.670 70.670 2.120 70.670 70.6702 .636 21.209 91.879 3 .244 8.121 100.000
Extraction Method: Principal Component Analysis.
Component Matrixa
Component 1
Utilitarianism1 .901Utilitarianism2 .887Utilitarianism3 .722Extraction Method: Principal Component Analysis. a. 1 components extracted.

Pre Test Validity Perceived Value KMO and Bartlett's Test
Kaiser-Meyer-Olkin Measure of Sampling Adequacy. .730
Bartlett's Test of Sphericity Approx. Chi-Square 59.749 df 3 Sig. .000
Communalities Initial Extraction Perceived Value1 1.000 .786Perceived Value2 1.000 .872Perceived Value3 1.000 .891Extraction Method: Principal Component Analysis.
Total Variance Explained Component Initial Eigenvalues Extraction Sums of Squared
Loadings Total % of
Variance Cumulative
% Total % of
Variance Cumulative
% 1 2.549 84.982 84.982 2.549 84.982 84.9822 .310 10.348 95.330 3 .140 4.670 100.000
Extraction Method: Principal Component Analysis.
Component Matrixa
Component 1
Perceived Value1 .887Perceived Value2 .934Perceived Value3 .944Extraction Method: Principal Component Analysis. a. 1 components extracted. Pre Test Validity Store Loyalty
KMO and Bartlett's TestKaiser-Meyer-Olkin Measure of Sampling Adequacy. .581 Bartlett's Test of Sphericity Approx. Chi-Square 13.378

df 3 Sig. .004
Communalities Initial Extraction Store Loyalty1 1.000 .740Store Loyalty2 1.000 .462Store Loyalty3 1.000 .579Extraction Method: Principal Component Analysis.
Total Variance ExplainedComponent Initial Eigenvalues Extraction Sums of Squared
Loadings Total % of
Variance Cumulative
% Total % of
Variance Cumulative
% 1 1.780 59.347 59.347 1.780 59.347 59.3472 .779 25.963 85.310 3 .441 14.690 100.000
Extraction Method: Principal Component Analysis.
Component Matrixa Component
1 Store Loyalty1 .860Store Loyalty2 .679Store Loyalty3 .761Extraction Method: Principal Component Analysis. a. 1 components extracted.
Pre Test Validity Purchased Amount
KMO and Bartlett's Test Kaiser-Meyer-Olkin Measure of Sampling Adequacy. .644 Bartlett's Test of Sphericity Approx. Chi-Square 31.973

df 3 Sig. .000
Communalities Initial Extraction Purchased Amount1 1.000 .655Purchased Amount2 1.000 .842Purchased Amount3 1.000 .698Extraction Method: Principal Component Analysis.
Total Variance Explained Component Initial Eigenvalues Extraction Sums of Squared
Loadings Total % of
Variance Cumulative
% Total % of
Variance Cumulative
% 1 2.194 73.146 73.146 2.194 73.146 73.1462 .550 18.347 91.494 3 .255 8.506 100.000
Extraction Method: Principal Component Analysis.
Component Matrixa
Component 1
Purchased Amount1 .809Purchased Amount2 .917Purchased Amount3 .835Extraction Method: Principal Component Analysis. a. 1 components extracted. 150 Respondents Validity Hedonism
KMO and Bartlett's TestKaiser-Meyer-Olkin Measure of Sampling Adequacy. .797
Bartlett's Test of Sphericity Approx. Chi-Square 219.749 df 6 Sig. .000

Communalities Initial Extraction Hedonism1 1.000 .741Hedonism2 1.000 .731Hedonism3 1.000 .635Hedonism4 1.000 .535Extraction Method: Principal Component Analysis.
Total Variance ExplainedComponent Initial Eigenvalues Extraction Sums of Squared
Loadings Total % of
Variance Cumulative
% Total % of
Variance Cumulative
% 1 2.641 66.025 66.025 2.641 66.025 66.0252 .609 15.230 81.256 3 .412 10.302 91.558 4 .338 8.442 100.000
Extraction Method: Principal Component Analysis.
Component Matrixa
Component 1
Hedonism1 .861Hedonism2 .855Hedonism3 .797Hedonism4 .731Extraction Method: Principal Component Analysis. a. 1 components extracted.

150 respondents Validity Utilitarianism
KMO and Bartlett's TestKaiser-Meyer-Olkin Measure of Sampling Adequacy. .627
Bartlett's Test of Sphericity Approx. Chi-Square 52.476 df 3 Sig. .000
Communalities
Initial Extraction Utilitarianism1 1.000 .500Utilitarianism2 1.000 .647Utilitarianism3 1.000 .563Extraction Method: Principal Component Analysis.
Total Variance ExplainedComponent Initial Eigenvalues Extraction Sums of Squared
Loadings Total % of
Variance Cumulative
% Total % of
Variance Cumulative
% 1 1.710 56.989 56.989 1.710 56.989 56.9892 .727 24.246 81.235 3 .563 18.765 100.000
Extraction Method: Principal Component Analysis.
Component Matrixa
Component 1
Utilitarianism1 .707Utilitarianism2 .805Utilitarianism3 .750Extraction Method: Principal Component Analysis. a. 1 components extracted.
150 Respondents Validity Store Loyalty

KMO and Bartlett's Test
Kaiser-Meyer-Olkin Measure of Sampling Adequacy. .637
Bartlett's Test of Sphericity Approx. Chi-Square 68.851 df 3 Sig. .000
Communalities Initial Extraction Store Loyalty1 1.000 .666Store Loyalty2 1.000 .488Store Loyalty3 1.000 .649Extraction Method: Principal Component Analysis.
Total Variance ExplainedComponent Initial Eigenvalues Extraction Sums of Squared
Loadings Total % of
Variance Cumulative
% Total % of
Variance Cumulative
% 1 1.803 60.092 60.092 1.803 60.092 60.0922 .703 23.435 83.527 3 .494 16.473 100.000
Extraction Method: Principal Component Analysis.
Component Matrixa
Component 1
Store Loyalty1 .816Store Loyalty2 .698Store Loyalty3 .805Extraction Method: Principal Component Analysis. a. 1 components extracted.
150 Respondents Validity Perceived Value

KMO and Bartlett's Test Kaiser-Meyer-Olkin Measure of Sampling Adequacy. .688
Bartlett's Test of Sphericity Approx. Chi-Square 110.012 df 3 Sig. .000
Communalities
Initial Extraction Perceived Value1 1.000 .693Perceived Value2 1.000 .708Perceived Value3 1.000 .626Extraction Method: Principal Component Analysis.
Total Variance ExplainedComponent Initial Eigenvalues Extraction Sums of Squared
Loadings Total % of
Variance Cumulative
% Total % of
Variance Cumulative
% 1 2.027 67.564 67.564 2.027 67.564 67.5642 .542 18.074 85.638 3 .431 14.362 100.000
Extraction Method: Principal Component Analysis.
Component Matrixa
Component 1
Perceived Value1 .832Perceived Value2 .842Perceived Value3 .791Extraction Method: Principal Component Analysis. a. 1 components extracted.
150 Respondents Validity Purchased Amount
KMO and Bartlett's Test Kaiser-Meyer-Olkin Measure of Sampling Adequacy. .673 Bartlett's Test of Sphericity Approx. Chi-Square 87.539

df 3 Sig. .000
Communalities Initial Extraction Purchased Amount1 1.000 .610Purchased Amount2 1.000 .624Purchased Amount3 1.000 .689Extraction Method: Principal Component Analysis.
Total Variance Explained Component Initial Eigenvalues Extraction Sums of Squared
Loadings Total % of
Variance Cumulative
% Total % of
Variance Cumulative
% 1 1.924 64.117 64.117 1.924 64.117 64.1172 .592 19.738 83.856 3 .484 16.144 100.000
Extraction Method: Principal Component Analysis.
Component Matrixa
Component 1
Purchased Amount1 .781Purchased Amount2 .790Purchased Amount3 .830Extraction Method: Principal Component Analysis. a. 1 components extracted.
150 Respondent Reliability Hedonism
Reliability Statistics Cronbach's
Alpha N of Items

.823 4
Utilitarianism
Reliability Statistics Cronbach's
Alpha N of Items
.621 3 Store Loyalty
Reliability Statistics Cronbach's
Alpha N of Items
.661 3
Perceived Value
Reliability StatisticsCronbach's
Alpha N of Items
.757 3
Purchased Amount
Reliability StatisticsCronbach's
Alpha N of Items
.713 3
Multiple Regression Hedonism, Utilitarianism Perceived Value
Variables Entered/Removeda
Model Variables Entered
Variables Removed
Method
1 utilitarianism, hedonismb
. Enter
a. Dependent Variable: perceivedvalue

b. All requested variables entered.
Model SummaryModel R R Square Adjusted R
Square Std. Error of the
Estimate 1 .457a .209 .198 .58866 a. Predictors: (Constant), utilitarianism, hedonism
ANOVAa
Model Sum of Squares df Mean Square F Sig.
1 Regression 13.438 2 6.719 19.390 .000b Residual 50.939 147 .347
Total 64.377 149
a. Dependent Variable: perceivedvalue b. Predictors: (Constant), utilitarianism, hedonism
Coefficientsa
Model Unstandardized Coefficients
Standardized Coefficients
t Sig.
B Std. Error Beta
1 (Constant) 1.171 .408 2.871 .005hedonism .218 .068 .237 3.219 .002utilitarianism .396 .078 .373 5.071 .000
a. Dependent Variable: perceivedvalue
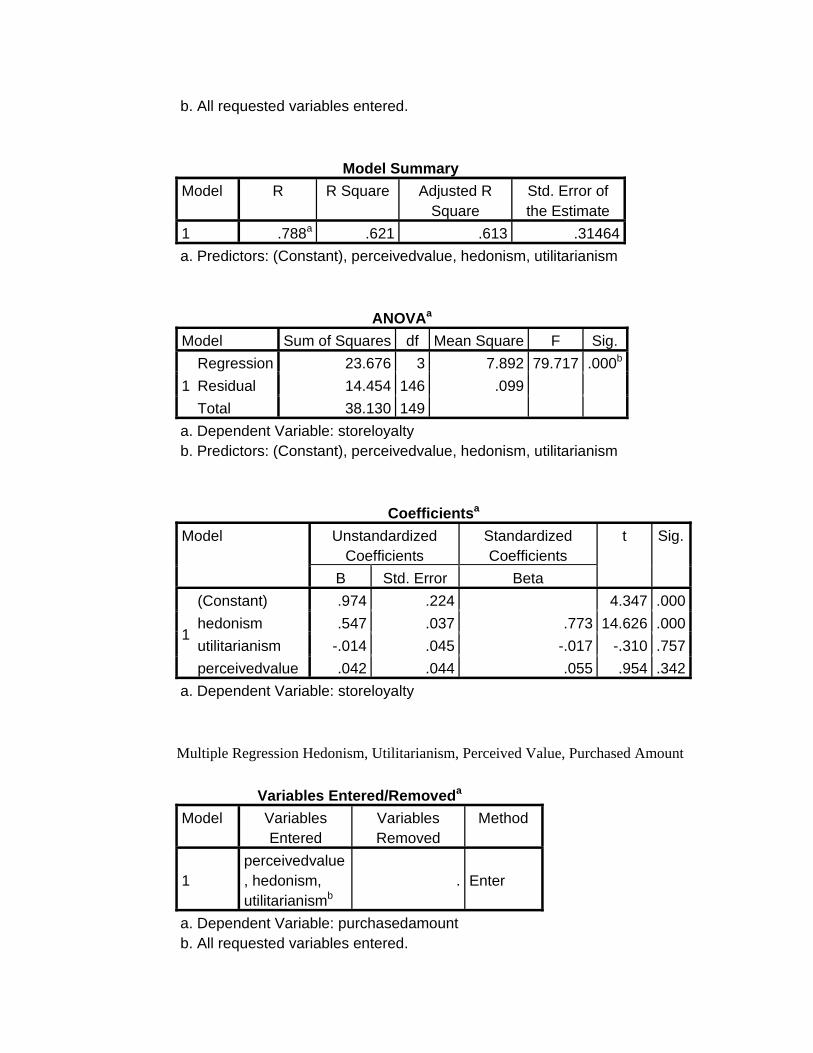
Multiple Regression Hedonism, Utilitarianism, Perceived Value Store Loyalty
Variables Entered/Removeda Model Variables
Entered Variables Removed
Method
1 perceivedvalue, hedonism, utilitarianismb
. Enter
a. Dependent Variable: storeloyalty
b. All requested variables entered.
Model SummaryModel R R Square Adjusted R
Square Std. Error of the Estimate
1 .788a .621 .613 .31464 a. Predictors: (Constant), perceivedvalue, hedonism, utilitarianism
ANOVAa
Model Sum of Squares df Mean Square F Sig.
1 Regression 23.676 3 7.892 79.717 .000b Residual 14.454 146 .099
Total 38.130 149
a. Dependent Variable: storeloyalty b. Predictors: (Constant), perceivedvalue, hedonism, utilitarianism
Coefficientsa
Model Unstandardized Coefficients
Standardized Coefficients
t Sig.
B Std. Error Beta
1
(Constant) .974 .224 4.347 .000hedonism .547 .037 .773 14.626 .000utilitarianism -.014 .045 -.017 -.310 .757perceivedvalue .042 .044 .055 .954 .342
a. Dependent Variable: storeloyalty Multiple Regression Hedonism, Utilitarianism, Perceived Value, Purchased Amount
Variables Entered/Removeda
Model Variables Entered
Variables Removed
Method
1 perceivedvalue, hedonism, utilitarianismb
. Enter
a. Dependent Variable: purchasedamount b. All requested variables entered.

Model SummaryModel R R Square Adjusted R
Square Std. Error of the Estimate
1 .346a .120 .102 .70579 a. Predictors: (Constant), perceivedvalue, hedonism, utilitarianism
ANOVAa
Model Sum of Squares df Mean Square F Sig.
1 Regression 9.920 3 3.307 6.638 .000b Residual 72.729 146 .498
Total 82.649 149
a. Dependent Variable: purchasedamount b. Predictors: (Constant), perceivedvalue, hedonism, utilitarianism
Coefficientsa
Model Unstandardized Coefficients
Standardized Coefficients
t Sig.
B Std. Error Beta
1
(Constant) .601 .503 1.195 .234hedonism .304 .084 .292 3.629 .000utilitarianism .041 .101 .034 .408 .684perceivedvalue .124 .099 .109 1.253 .212
a. Dependent Variable: purchasedamount