Embed Size (px)
Citation preview

Global Health: today’s challenges 1
Chapter One
Global Health:today’s challenges
Reviewing the latest global health trends, this chapter findsdisturbing evidence of widening gaps in health worldwide. In2002, while life expectancy at birth reached 78 years forwomen in developed countries, it fell back to less than 46years for men in sub-Saharan Africa, largely because of theHIV/AIDS epidemic. For millions of children today, particularlyin Africa, the biggest health challenge is to survive until theirfifth birthday, and their chances of doing so are less than theywere a decade ago. This is a result of the continuing impactof communicable diseases. However, a global increase innoncommunicable diseases is simultaneously occurring,adding to the daunting challenges already facing manydeveloping countries.

2 The World Health Report 2003
Global Health: today’s challenges 3
1Global Health:today’s challenges
Although this report is global in scope, the findings irresistibly draw the main focus to theincreasingly fragile health of sub-Saharan Africa. It is here, where scores of millions of peoplescrape a living from the dust of poverty, that the price of being poor can be most starkly seen.Almost an entire continent is being left behind.
Overall, 35% of Africa’s children are at higher risk of death than they were 10 years ago. Everyhour, more than 500 African mothers lose a small child. In 2002, more than four millionAfrican children died. Those who do make it past childhood are confronted with adult deathrates that exceed those of 30 years ago. Life expectancy, always shorter here than almostanywhere else, is shrinking. In some African countries, it has been cut by 20 years and lifeexpectancy for men is less than 46 years.
Mostly, death comes in familiar garb. The main causes among children are depressingly rec-ognizable: the perinatal conditions closely associated with poverty; diarrhoeal diseases; pneu-monia and other lower respiratory tract conditions; and malaria. Becoming more familiar bythe day, HIV/AIDS, now the world’s leading cause of death in adults aged 15–59 years, iskilling almost 5000 men and women in this age group, and almost 1000 of their children,every 24 hours in sub-Saharan Africa.
The main components of Africa’s tragedy are shared by many of the poorest people every-where and include the agonizingly slow progress towards the Millennium Development Goalsof reduced maternal and child mortality; the HIV/AIDS pandemic; and the double burden ofcommunicable diseases plus noncommunicable diseases, including the tobacco epidemic andthe avoidable deaths from road traffic crashes. Subsequent chapters of this report will exam-ine each of these components and show how they can and must be reshaped for a betterfuture.
The global pictureLife expectancy improves – but not for allOver the past 50 years, average life expectancy at birth has increased globally by almost 20years, from 46.5 years in 1950–1955 to 65.2 years in 2002. This represents a global averageincrease in life expectancy of 4 months per year across this period. On average, the gain in lifeexpectancy was 9 years in developed countries (including Australia, European countries,Japan, New Zealand and North America), 17 years in the high-mortality developing coun-tries (with high child and adult mortality levels), including most African countries and poorer

4 The World Health Report 2003
countries in Asia, the Eastern Mediterranean Region and Latin America; and 26 years in thelow-mortality developing countries. As shown in Figure 1.1, the large life expectancy gapbetween the developed and developing countries in the 1950s has changed to a large gapbetween the high-mortality developing countries and others.
Life expectancy at birth in 2002 ranged from 78 years for women in developed countries toless than 46 years for men in sub-Saharan Africa, a 1.7-fold difference in total life expectancy.Exceptions to the life expectancy increases in most regions of the world in the last 50 years areAfrica and countries of eastern Europe formerly in the Soviet Union. In the latter case, maleand female life expectancies at birth declined, by 2.9 years and 1 year, respectively, over theperiod 1990 to 2000. Estimated life expectancies for males and females for 2002 are given inAnnex Table 1 for all Member States of the World Health Organization (WHO).
The increases in life expectancy that occurred in the first half of the 20th century in devel-oped countries were the result of rapid declines in mortality, particularly infant and maternalmortality, and that caused by infectious diseases in childhood and early adulthood. Access tobetter housing, sanitation and education, a trend to smaller families, growing incomes, andpublic health measures such as immunization against infectious diseases all contributed greatlyto this epidemiological transition. In many developed countries, this shift started approxi-mately 100 to 150 years ago. In a number of countries, such as Japan, the transition startedlater but proceeded much more quickly. In many developing countries, the transition startedeven later and has not yet been completed. In developed countries, improvements in lifeexpectancy now come mainly from reductions in death rates among adults.
Global mortality patternsAlmost 57 million people died in 2002, 10.5 million (or nearly 20%) of whom were childrenof less than 5 years of age (see Figure 1.2). Of these child deaths, 98% occurred in developing
0
10
20
30
40
50
60
70
80
1940 1960 1980 2000 2020Year
Life
exp
ecta
ncy
at b
irth
(yea
rs)
Note: The term developed countries includes Australia, Canada, European countries, former Soviet countries, Japan, New Zealand and theUSA. High-mortality developing countries include those in sub-Saharan Africa, and countries with high child and adult mortality in Asia,Central and South America and the Eastern Mediterranean. Other developing countries are referred to as “developing – low mortality”.
Developed
Developing – low mortality
Developing – high mortality
Figure 1.1 Life expectancy at birth: developed and developing countries, 1955–2002

Global Health: today’s challenges 5
countries. Over 60% of deaths in developed countries occur beyond age 70, compared withabout 30% in developing countries. A key point is the comparatively high number of deathsin developing countries at younger adult ages (15–59 years). Just over 30% of all deaths indeveloping countries occur at these ages, compared with 20% in richer regions. This vastpremature adult mortality in developing countries is a major public health concern.
Developing countries themselves are a very heterogeneous group in terms of mortality (Fig-ure 1.1). A contrast between low-mortality developing countries such as China (with morethan one-sixth of the world’s population) and high-mortality countries in Africa (with one-tenth of the global population) illustrates the extreme diversity in health conditions amongdeveloping countries. Less than 10% of deaths in China occur below 5 years of age comparedwith 40% in Africa. Conversely, 48% of deaths in China occur beyond age 70, compared withonly 10% in Africa.1
Although risk of death is the simplest comparable measure of health status for populations,there has been increasing interest in describing, measuring and comparing health states ofpopulations. Mortality statistics, in particular, substantially underestimate the burden fromnoncommunicable adult disease because they exclude non-fatal health outcomes such as de-pression and visual impairment. A useful method of formulating a composite summary ofdisease burden is to calculate disability-adjusted life years (DALYs), which combine years oflife lost (YLLs) through premature death with years lived with disability (YLDs) (1). OneDALY can be thought of as one lost year of “healthy” life and the measured disease burden isthe gap between a population’s health status and that of a normative global reference popula-tion with high life expectancy lived in full health. In terms of DALYs, 36% of total lost yearsof healthy life for the world in 2002 were a result of disease and injury in children aged lessthan 15 years, and almost 50% as a result of disease and injury in adults aged 15–59 years (seeFigure 1.3).2
1 Estimated deaths by cause, age group and sex for 2002 are available on the WHO web site for the six WHOregions and for the 14 epidemiological subregions (www.who.int/evidence/bod).
2 Estimated DALYs by cause, age group and sex for 2002 are available on the WHO web site for the six WHOregions and for the 14 epidemiological subregions (www.who.int/evidence/bod).
0
10 000
20 000
30 000
40 000
50 000
60 000
Developed Low-mortalitydeveloping
High-mortalitydeveloping
World
Num
ber
of d
eath
s (0
00)
0–45–1415–5960+
Figure 1.2 Age distribution of global mortality: developed and developingcountries, 2002

6 The World Health Report 2003
As Figure 1.3 illustrates, child survival continues to be a major focus of the internationalhealth agenda for developing countries (2). Because nearly 90% of global deaths under age 15occur before the age of 5, the following sections focus on child deaths under 5 years. In con-trast, the international effort to understand the magnitude of challenges to adult health indeveloping countries is still in its early stages. Even at present, there remains a perception thatadult health is of great concern only in wealthy countries, where premature mortality amongchildren has been substantially reduced. However, Figures 1.2 and 1.3 also illustrate the highproportion of burden of disease and injury suffered by adults in developing countries, a grow-ing burden that requires urgent action by the global public health community. This chaptertherefore first examines trends and issues in child health, focusing on ages 0–4, then amongadults aged 15–59 years and among adults aged 60 years and over.
Unfortunately, complete cause-specific death registration data are routinely available for onlya minority of the world’s countries (see Chapter 7 and the Explanatory Notes in the Statisti-cal Annex). However, complete or incomplete vital registration data (see Box 1.1) together
0–429%
5–147%15–59
49%
60+15%
0–46% 5–14
4%
15–5957%
60+33%
0–440%
5–149%
15–5943%
60+8%0–4
18%
5–146%
15–5957%
60+19%
World Developed regions
Low-mortality developing regions High-mortality developing regions
Figure 1.3 Distribution of disease burden (DALYs) by age group and region, 2002

Global Health: today’s challenges 7
with sample registration systems now capture one-third of deaths globally and provide infor-mation on 74% of global mortality, and these have been used to analyse adult mortalitypatterns and trends here.
Surviving the first five years of lifeAlthough approximately 10.5 million children under 5 years of age still die every year in theworld, progress has been made since 1970, when the figure was more than 17 million. Thesereductions did not take place uniformly across time and regions, but the success stories indeveloping countries demonstrate clearly that low mortality levels are attainable in thosesettings. The effects of such achievements are not to be underestimated. If the whole worldwere able to share the current child mortality experience of Iceland (the lowest in the worldin 2002), over 10 million child deaths could be prevented each year.
Today nearly all child deaths occur in developing countries, almost half of them in Africa.While some African countries have made considerable strides in reducing child mortality,the majority of African children live in countries where the survival gains of the past havebeen wiped out, largely as a result of the HIV/AIDS epidemic.
Across the world, children are at higher risk of dying if they are poor. The most impressivedeclines in child mortality have occurred in developed countries, and in low-mortality devel-oping countries whose economic situation has improved. In contrast, the declines observedin countries with higher mortality have occurred at a slower rate, stagnated or even reversed.Owing to the overall gains in developing regions, the mortality gap between the developingand developed world has narrowed since 1970. However, because the better-off countries indeveloping regions are improving at a fast rate, and many of the poorer populations are los-ing ground, the disparity between the different developing regions is widening.
Box 1.1 Sentinel vital registration in the United Republic of Tanzania
Accurate statistics on basic demographic events are an important foun-dation of rational health and public policy. Unfortunately, reliable vitalregistration is lacking for the vast majority of the world’s poorest coun-tries. Some new approaches to meeting the need for mortality and mor-bidity data have been pioneered in the United Republic of Tanzania. In1992, the Ministry of Health established the Adult Morbidity and Mor-tality Project (AMMP) in partnership with the University of Newcastleupon Tyne, England, and with funding from the United Kingdom Depart-ment for International Development.
AMMP developed a demographic surveillance system and verbalautopsy tools for measuring levels and causes of death, and a validatedtool for estimating household consumption expenditure to monitor in-come poverty. One of the initial project aims was to establish baselinelevels of adult mortality by cause in three selected districts (3–5). In1997, the Ministry of Health elected to expand data collection to a largersample of districts and to establish a national sentinel system for healthand poverty monitoring. In addition, the contributions of other demo-graphic surveillance sites were coordinated to produce annual healthstatistics abstracts and public health sector performance profiles.
In 2002, sentinel vital registration, cause of death, and povertymonitoring figures flowing from five sites managed by the Ministry ofHealth and local councils and three sites managed by health develop-
ment and research bodies began to provide essential indicators to theNational Poverty Monitoring Master Plan. In the context of all informa-tion systems in the United Republic of Tanzania that produce demo-graphic, health and poverty indicators, sentinel demographic surveillancegenerates a large number of indicators from a sample of over 500 000people, at a per capita recurrent cost of US$ 0.02 per year. These costsare considerably less than for many other systems.
At the local level, AMMP has helped districts to feed sentinel sur-veillance information about the prevailing burden of disease back tocommunity members who have, in turn, actively participated in settingpriorities for district health. One local council was prompted by data onhealth-seeking for children dying at home from acute febrile illness toincrease the resources allocated to fight malaria and to promote the useof treated bednets. At the national level, these same data provided anevidence base for a policy change in first-line malaria drug use, and theoverall cause-specific mortality burden measured in years of life lostwas a key input to the design of the first national package of essentialhealth interventions. Drawing on the poverty data from sentinel sites, ithas also been possible to provide government with solid evidence abouthow health intervention priorities among the poorest citizens differ fromthose of others.

8 The World Health Report 2003
Child mortality: global contrastsRegional child mortality levels are indicated in Figure 1.4. Of the 20 countries in the worldwith the highest child mortality (probability of death under 5 years of age), 19 are in Africa,the exception being Afghanistan.
A baby born in Sierra Leone is three and a half times more likely to die before its fifth birth-day than a child born in India, and more than a hundred times more likely to die than a childborn in Iceland or Singapore. Fifteen countries, mainly European but including Japan andSingapore, had child mortality rates in 2002 of less than 5 per 1000 live births. Estimatedchild mortality rates for 2002 are given for all WHO Member States in Annex Table 1.
Child mortality: gender and socioeconomic differencesThroughout the world, child mortality is higher in males than in females, with only a fewexceptions. In China, India, Nepal and Pakistan, mortality in girls exceeds that of boys. Thisdisparity is particularly noticeable in China, where girls have a 33% higher risk of dying thantheir male counterparts. These inequities are thought to arise from the preferential treatmentof boys in family health care-seeking behaviour and in nutrition.
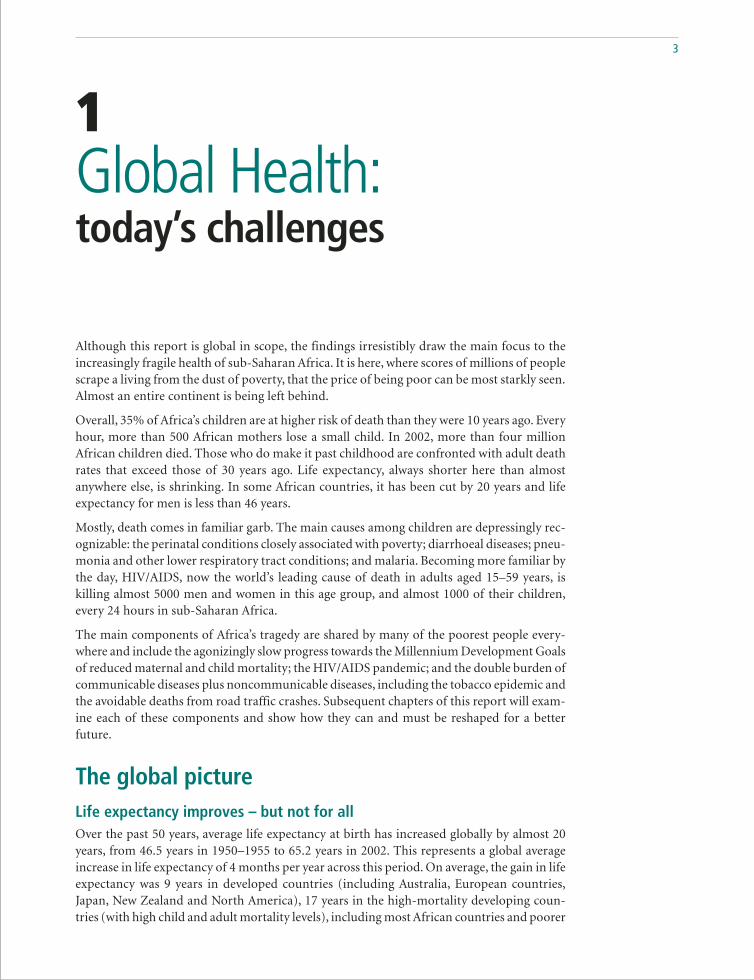
There is considerable variability in child mortality across different income groups withincountries. Data collected by 106 demographic and health surveys in more than 60 countriesshow that children from poor households have a significantly higher risk of dying before theage of 5 years than the children of richer households. This is illustrated in Figure 1.5, usingthe results for three countries from different regions. The vertical axis represents the prob-ability of dying in childhood (on a zero to one scale). The horizontal axis shows the informa-tion by “poor” and “non-poor”.1 The identification of poor and non-poor populations uses aglobal scale based on an estimate of permanent income constructed from information onownership of assets, availability of services and household characteristics. This approach hasthe advantage of allowing comparison of socioeconomic levels across countries. It impliesthat the individuals defined as poor in Bangladesh have the same economic status as thepopulation defined as poor in Bolivia or Niger.
1 The “poor” are individuals from the lowest quintile of income, while the “non-poor” are the remainder.
0
20
40
60
80
100
120
140
160
180
Africa Americas EasternMediterranean
EuropeSouth-EastAsia
WesternPacific
World
Dea
ths
per
1000
live
bir
ths
Figure 1.4 Child mortality in the six WHO regions, 2002
Global Health: today’s challenges 9
There are significant differences in child mortality risks by poverty status in all countries,although the size of the gap varies; the risk of dying in childhood is approximately 13 per-centage points higher for the poor than for the non-poor in Niger but less than 3 percentagepoints higher in Bangladesh.
Child mortality rates among the poor are much higher in Africa than in any other regiondespite the same level of income used to define poverty. The probability of poor children inAfrica dying is almost twice that of poor children in the Americas. Likewise, better-off chil-dren in Africa have double the probability of dying than their counterparts in the Americas.Moreover, better-off children in Africa have a higher mortality risk (16%) than poor childrenin the Americas, whose risk of death is 14%.
Child survival: improvements for someThe last three decades have witnessed considerable gains in child survival worldwide (shownby WHO region in Figure 1.6). Global child mortality decreased from 147 per 1000 live birthsin 1970 to about 80 per 1000 live births in 2002. The reduction in child mortality has beenparticularly compelling in certain countries of the Eastern Mediterranean and South-EastAsia Regions and Latin America, while that of African countries was more modest. Gains inchild survival have also occurred in rich industrialized nations, where levels of mortalitywere already low.
Although child mortality has fallen in most regions of the world, the gains were not consist-ent across time and regions. The greatest reductions in child mortality across the world oc-curred 20–30 years ago, though not in the African or the Western Pacific Regions, where thedecline slowed down during the 1980s, nor in some eastern European countries, where mor-tality actually increased in the 1970s. Over the past decade, only countries of the South-EastAsia Region and the higher mortality countries in Latin America have further acceleratedtheir reduction in child mortality.
Figure 1.5 Differences in child mortality in three developing countriesaccording to socioeconomic status
0.00
0.05
0.10
0.15
0.20
0.25
0.30
0.35
0.40
Poor Non-poor Poor Non-poor Poor Non-poor
Prob
abili
ty o
f dy
ing
befo
re 5
yea
rs o
f ag
e
Niger BoliviaBangladesh

10 The World Health Report 2003
The most impressive gains in child survival over the past 30 years occurred in developingcountries where child mortality was already relatively low, whereas countries with the highestrates had a less pronounced decline. Despite an overall decline in global child mortality overthe past three decades, the gap between and within developing regions has widened.
Although the chances of child survival among less developed regions of the world are becom-ing increasingly disparate, the gaps in child mortality among affluent nations have been clos-ing over the past 30 years, largely as a result of medico-technological advances, particularly inthe area of neonatal survival.
In 16 countries (14 of which are in Africa) current levels of under-5 mortality are higherthan those observed in 1990. In nine countries (eight of which are in Africa) current levelsexceed even those observed over two decades ago. HIV/AIDS has played a large part in thesereversals.
Analyses from the demographic and health surveys show that, while child mortality has in-creased in many of the African countries surveyed, the gap between poor and non-poorpopulations has remained constant over time in this setting. In contrast, there has been awidening of the mortality gap between poor and better-off groups in the Americas, whereoverall child mortality rates have fallen. This indicates that survival gains in many regionshave benefited the better-off. The reduction in child mortality has been much slower in ruralareas, where poor people are concentrated, than in urban areas (6). These analyses suggestthat health interventions implemented in the past decade have not been effective in reachingpoor people.
Losses in child survival in the countries described above are at odds with impressive gains insome African countries. Despite the ravages of the HIV/AIDS epidemic in Africa, eight coun-tries in the region have reduced child mortality by more than 50% since 1970. Among theseare Gabon, the Gambia and Ghana.
Overall, at least 169 countries, 112 of them developing countries, have shown a decline inchild mortality since 1970. Some of these are presented in Figure 1.7. Oman has had the most
Figure 1.6 Changes in child mortality rates by WHO region, 1970–2002
-80
-70
-60
-50
-40
-30
-20
-10
0
% c
hang
e in
chi
ld m
orta
lity
Africa Americas EasternMediterranean
Europe WorldSouth-EastAsia
WesternPacific

Global Health: today’s challenges 11
striking reduction, from 242 per 1000 live births in 1970 to its current rate of 15 per 1000 livebirths, which is lower than that of many countries in Europe. Overall, the lower mortalitycountries of the Eastern Mediterranean Region experienced an impressive decline in childmortality, which has been accompanied by a reduction in the gap between countries’ childmortality levels since 1970.
Child mortality has also declined substantially in the Americas. The most striking propor-tional reductions in mortality have been seen in Chile, Costa Rica and Cuba, where childmortality has decreased by over 80% since 1970. There have also been large absolute reduc-tions in child mortality in Bolivia, Nicaragua and Peru. In contrast, Haitian child mortalityrates are still 133 per 1000: almost double the mortality rate of Bolivia, the next highest coun-try in the Americas.
An interesting pattern of child mortality trends has been observed in several eastern Europeancountries. Here, child mortality initially increased or remained constant during the 1970s,only to decline after 1980 (7). This may to some extent be attributed to a more completeregistration of child and infant deaths during that period. Interestingly, while adult mortalitylevels increased in the early 1990s, child mortality continued to decline. There is no otherregion where this particular pattern of mortality has occurred in such a systematic manner,and the reasons for the trend remain poorly understood.
Causes of death in childrenInfectious and parasitic diseases remain the major killers of children in the developing world,partly as a result of the HIV/AIDS epidemic. Although notable success has been achieved incertain areas (for example, polio), communicable diseases still represent seven out of the top10 causes of child deaths, and account for about 60% of all child deaths. Overall, the 10leading causes represent 86% of all child deaths (see Table 1.1).
Many countries of the Eastern Mediterranean Region and in Latin America and Asia havepartly shifted towards the cause-of-death pattern observed in developed countries. Here,conditions arising in the perinatal period, including birth asphyxia, birth trauma and lowbirth weight, have replaced infectious diseases as the leading cause of death and are now
Figure 1.7 Countries with large absolute reductions in child mortality since 1970
1970 1980 1990 2000Year
OmanBoliviaBangladeshGambia
0
50
100
150
200
250
Und
er-5
mor
talit
y pe
r 10
00 li
ve b
irth
s
300
350

12 The World Health Report 2003
responsible for one-fifth to one-third ofdeaths. Such a shift in the cause-of-death pat-tern has not occurred in sub-Saharan Africa,where perinatal conditions rank in fourthplace. Here, undernutrition, malaria, lowerrespiratory tract infections and diarrhoealdiseases continue to be among the leadingcauses of death in children, accounting for45% of all deaths.
About 90% of all HIV/AIDS and malariadeaths in children in developing countriesoccur in sub-Saharan Africa, where 23% ofthe world’s births and 42% of the world’s childdeaths are observed (see Box 1.2). The im-mense surge of HIV/AIDS mortality in chil-dren in recent years means that HIV/AIDS is
now responsible for 332 000 child deaths in sub-Saharan Africa, nearly 8% of all child deathsin the region.
Some progress has been observed in the areas of diarrhoeal diseases and measles. While inci-dence is thought to have remained stable, mortality from diarrhoeal diseases has fallen from2.5 million deaths in 1990 to about 1.6 million deaths in 2002, now accounting for 15% of allchild deaths. There has also been a modest decline in deaths from measles, although morethan half a million children under 5 years of age still succumb to the disease every year (8).Malaria causes around a million child deaths per year, of which 90% are children under 5years of age. In this age group the disease accounts for nearly 11% of all deaths (see Table 1.1).
The overall number of child deaths in India has fallen from approximately 3.5 million in1990 to approximately 2.3 million in 2002. This impressive decline is a result of a reductionin overall child mortality rates of about 30%, and a decline in total fertility rates of around10%. The cause-of-death pattern has remained fairly stable, with the exception of perinatalconditions whose proportion has notably increased. There were some declines in the propor-tion of deaths from diarrhoeal diseases, measles and tetanus, which may be the result ofincreased use of oral rehydration therapy and improved coverage of routine vaccination, aswell as intensive immunization campaigns.
A similar picture is emerging in China, where the number of child deaths has decreased by30% since 1990, owing to a reduction in child mortality of 18% and a 6% decline in totalfertility. As in India, the most notable change in the cause-of-death pattern in China over thepast decade is an increase in the proportion of perinatal deaths.
The challenge of reducing child mortality is widely recognized and effective interventions areavailable. The issue now is urgent implementation. The adult mortality challenges are morecomplex, as described in the next section.
Adult health at risk: slowing gains andwidening gapsAdult mortality rates have been declining in recent decades in most regions of the world. Lifeexpectancy at age 15 has increased by between 2 and 3 years for most regions over the last 20years. The notable exceptions are the high-mortality countries in Africa, where life expect-
Table 1.1 Leading causes of death in children in developingcountries, 2002
Rank Cause Numbers (000) % of all deaths
1 Perinatal conditions 2 375 23.12 Lower respiratory infections 1 856 18.13 Diarrhoeal diseases 1 566 15.24 Malaria 1 098 10.75 Measles 551 5.46 Congenital anomalies 386 3.87 HIV/AIDS 370 3.68 Pertussis 301 2.99 Tetanus 185 1.8
10 Protein-energy malnutrition 138 1.3Other causes 1 437 14.0
Total 10 263 100000000

Global Health: today’s challenges 13
ancy at age 15 decreased by nearly 7 years between 1980 and 2002, and the high-mortalitycountries, mainly those of the former Soviet Union, in eastern Europe, where life expectancyat age 15 decreased over the same period by 4.2 years for males and 1.6 years for females.
Of the 45 million deaths among adults aged 15 years and over in 2002, 32 million, or almostthree-quarters, were caused by noncommunicable diseases, which killed almost four times asmany people as communicable diseases and maternal, perinatal and nutritional conditionscombined (8.2 million, or 18% of all causes). Injuries killed a further 4.5 million adults in2002, 1 in 10 of the total adult deaths. More than 3 million of these injury deaths – almost70% of them – concern males, whose higher risk is most pronounced for road traffic injuries(three times higher) and for violence and war (more than four times higher).
The relative importance of these causes varies markedly across regions. Thus in Africa, onlyabout 1 in 3 adult deaths is caused by noncommunicable diseases, compared with nearly 9out of 10 in developed countries. It is of concern that 3 in 4 adult deaths in Latin America andin the developing countries of Asia and the Western Pacific Region are caused bynoncommunicable disease, reflecting the relatively advanced stage of the epidemiologicaltransition achieved in these populations and the emergence of the double burden of disease.Estimated total deaths by cause in 2002 are given for each of the epidemiological subregionsand the world in Annex Table 2. More detailed tables showing deaths by cause, age and sex ineach of the regions are available on the WHO web site (http://www.who.int/evidence/bod).
Figure 1.8 highlights the marked contrast in patterns of health transition among adults (aged15 years and over) in different parts of the world. In developed countries, communicablediseases and maternal, perinatal and nutritional conditions contribute only 5% to the totalburden of disease, while in high-mortality developing regions this figure rises to 40%. InAfrican regions where the HIV/AIDS epidemic has confounded the pattern of health transi-tion during the past decade, these conditions can contribute as much as 50–60% of the over-
Box 1.2 The African crisis of child mortality
There are 14 countries inWHO’s African Region inwhich child mortality has risensince reaching its lowest levelin 1990. About 34% of thepopulation under five years ofage in sub-Saharan Africa isnow exposed to this disturb-ing trend. Only two countriesoutside Africa observed simi-lar setbacks in the sameperiod – countries that expe-rienced armed conflict or eco-nomic sanctions. Eight of the14 countries are in southernAfrica, which boasted some ofthe most notable gains in childsurvival during the 1970s and1980s. Those promising gainshave been wiped out in a meredecade.
The surge of HIV/AIDS isdirectly responsible for up to60% of child deaths in Africa,as illustrated by the causes ofchild deaths in Botswanashown in the figure.
The indirect effects ofHIV/AIDS in adults contributeto the tragedy. Children wholose their mothers to HIV/AIDS are more likely to diethan children with livingmothers, irrespective of theirown HIV status. The diversionof already stretched healthresources away from childhealth programmes into careof people living with AIDS fur-ther compounds the situation,in the presence of increasingmalaria mortality, civil unrestor social anarchy.
HIV/AIDS
Perinatalconditions
Diarrhoealdiseases
Respiratoryinfections
Causes of child deaths in Botswana, 2002
InjuriesMalariaMeasles
Whooping cough Congenital anomaliesTuberculosisOther

14 The World Health Report 2003
all disease burden. Estimated total DALYs by cause in 2002 are given for each of the epide-miological subregions and the world in Annex Table 3.
The 10 leading causes of disease burden among men and women aged 15 years and over areshown in Table 1.2. Ischaemic heart disease and stroke (cerebrovascular disease) are two ofthe three leading causes of burden of disease in adult males globally. HIV/AIDS is the leadingcause for males and the second leading cause for females, accounting for around 6% of theglobal burden of disease. Unipolar depressive disorders are the leading cause of burden forfemales, reflecting their higher prevalence in women. Though the individual maternal condi-tions of haemorrhage, sepsis and obstructed labour do not appear in Table 1.2, as a groupthey remain one of the leading causes of the burden of disease for women globally, reflectingthe continuing high levels of maternal mortality in many developing countries, and also thehigh levels of disability resulting from these conditions.
0 20 40 60 80 100
Eur-AAmr-AWpr-AEur-BEur-CEmr-BWpr-BAmr-BSear-BEmr-DSear-DAmr-DAfr-DAfr-E
World
High-mortalitydeveloping regions
Low-mortalitydeveloping regions
Developed regions
Figure 1.8 Disease burden (DALYs) among adults (aged 15 years and over)by broad cause, selected epidemiological subregions, 2002
Percentage
InjuriesNoncommunicable diseases
See List of Member States for an explanation of subregions.
Communicable diseases, maternal,perinatal and nutritional conditions
Table 1.2 Leading causes of disease burden (DALYs) for males and femalesaged 15 years and older, worldwide, 2002
Males %DALYs Females %DALYs
1 HIV/AIDS 7.4 1 Unipolar depressive disorders 8.42 Ischaemic heart disease 6.8 2 HIV/AIDS 7.23 Cerebrovascular disease 5.0 3 Ischaemic heart disease 5.34 Unipolar depressive disorders 4.8 4 Cerebrovascular disease 5.25 Road traffic injuries 4.3 5 Cataracts 3.16 Tuberculosis 4.2 6 Hearing loss, adult onset 2.87 Alcohol use disorders 3.4 7 Chronic obstructive pulmonary disease 2.78 Violence 3.3 8 Tuberculosis 2.69 Chronic obstructive pulmonary disease 3.1 9 Osteoarthritis 2.0
10 Hearing loss, adult onset 2.7 10 Diabetes mellitus 1.9

Global Health: today’s challenges 15
The following section summarizes the risk of premature adult death in terms of the probabil-ity of death between 15 and 60 years of age – the proportion of 15-year-olds who will diebefore their 60th birthday – and examines global patterns of cause of death in the age range15–59 years. The health of adults aged 60 years and older is then examined.
Global patterns of premature mortality riskThe probability of premature adult death varies widely between regions, as shown in Figure1.9. For example, the probability of premature adult death in some parts of sub-SaharanAfrica is much higher – nearly four times higher – than that observed in low-mortality coun-tries of the Western Pacific Region. Even within developed regions there are wide variations.Men in some eastern European countries are three to four times more likely to die prema-turely than men in other developed regions. Furthermore, male adult mortality in easternEurope is much greater than in developing countries of the Americas, Asia and the EasternMediterranean Region. In all regions, male mortality is higher than female, and the discrep-ancy between the two sexes in mortality risk is much larger than that seen among children.The variation in the proportion of women dying prematurely is much less dramatic.
Adult mortality trends: 15–59 years of ageThere have been impressive gains in the health status of adults worldwide in the past fivedecades. The risk of death between ages 15 and 60 has declined substantially from a globalaverage of 354 per 1000 in 1955 to 207 per 1000 in 2002. The recent slowdown in the rate ofdecline is a clear warning that continued reductions in adult mortality, particularly in devel-oping countries, will not be easily achieved.
Figure 1.9 Adult mortality: probabilities of death between 15 and 60 years of age by cause,selected epidemiological subregions, 2002
100 200 300 400 500 6000
Africavery high adult mortality
Americaslow adult mortality
Europevery low adult mortality
Europehigh adult mortality
South-East Asialow adult mortality
Western Pacificlow adult mortality
World
Probability of death between 15 and 60 years of age per 1000 population
HIV/AIDS
Other communicable diseases
Noncommunicable diseases
Injuries
See List of Member States for an explanation of subregions.

16 The World Health Report 2003
There is substantial variation in the pace and magnitude of declining trends in prematureadult mortality across both sexes and global regions (see Figure 1.10). The global slowdownof the pace is primarily a result of a shift in trends in adult mortality in a few regions. Amongthe signs of deteriorating adult health, the most disturbing is the fact that adult mortality inAfrica has reversed, shifting in 1990 from a state of steady decline into a situation character-ized by rapidly increasing mortality. The reversal in parts of sub-Saharan Africa has been sodrastic that current adult mortality rates today exceed the levels of three decades ago. InZimbabwe, upturns in reported adult deaths were significantly greater in 1991–1995 than in1986–1990. Older childhood and older adult mortality have changed little (9). Without HIV/AIDS, life expectancy at birth in the African Region would have been almost 6.1 years higherin 2002. The reduction in life expectancy varies significantly across the African Region. Thegreatest impact has been in Botswana, Lesotho, Swaziland and Zimbabwe, where HIV/AIDShas reduced male and female life expectancies by more than 20 years.
The fragile state of adult health in the face of social, economic and political instability is alsoapparent in regions outside Africa. Male mortality in some countries in eastern Europehas increased substantially and is approaching the level of adult mortality in some African
Africa – very high adult mortality
Africa – high adult mortalityEurope – high adult mortality
South-East Asia – low adult mortality
Western Pacific – low adult mortality
World
Africa – very high adult mortality
Africa – high adult mortality
Europe – high adult mortality
South-East Asia – low adult mortality
Western Pacific – low adult mortality
World
600
0
200
400
1970Year
200019901980
600
0
200
400
1970Year
200019901980
Poss
ibili
ty o
f dea
th b
etw
een
15 a
nd 6
0 ye
ars
of a
ge p
er 1
000
popu
lati
on
Females
Males
See List of Member States for an explanation of subregions.
Figure 1.10 Trends of adult mortality by sex, selected epidemiological subregions, 1970–2002

Global Health: today’s challenges 17
countries. As a result, for the European Region as a whole, average adult mortality risk formen between 15 and 60 years is 230 per 1000, which is similar to the rate observed in the1980s. This contrasts with the continuously declining trend for women in this region as awhole. Their risk has declined from 130 in 1970 to 98 in 2002. Figure 1.8 illustrates thefact that the probability of death from injury among adults aged 15–59 years in the high-mortality countries of eastern Europe is nearly six times higher than in neighbouring westernEuropean countries.
Adult mortality: widening gapsContinuously declining adult mortality in low-mortality regions, combined with trend re-versals in high-mortality areas, have resulted in widening gaps in adult mortality worldwide.The gap between the lowest and highest regional adult mortality risk between ages 15 and 60has now increased to a level of 340 per 1000 in 2002. Regional aggregation of adult mortalityalso hides enormous and sobering disparities between countries. For example, within theEastern Mediterranean Region, adult mortality risk between ages 15 and 60 among womenin Djibouti was seven times higher than that of women in Kuwait in 2002. Overall, there is analmost 12-fold difference between the world’s lowest and highest adult mortality at countrylevel (see Annex Table 1).
HIV/AIDS: the leading health threatTable 1.3 shows the leading causes of deaths and DALYs among adults worldwide for 2002.Despite global trends of declining communicable disease burden in adults, HIV/AIDS hasbecome the leading cause of mortality and the single most important contributor to theburden of disease among adults aged 15–59 years (see Chapter 3).
Mortality – adults aged 15–59
Rank Cause Deaths (000)
1 HIV/AIDS 22792 Ischaemic heart disease 13323 Tuberculosis 10364 Road traffic injuries 8145 Cerebrovascular disease 7836 Self-inflicted injuries 6727 Violence 4738 Cirrhosis of the liver 3829 Lower respiratory infections 352
10 Chronic obstructive pulmonary disease 343
Disease burden – adults aged 60+
Rank Cause DALYs (000)
1 Ischaemic heart disease 31 4812 Cerebrovascular disease 29 5953 Chronic obstructive pulmonary disease 14 3804 Alzheimer and other dementias 8 5695 Cataracts 7 3846 Lower respiratory infections 6 5977 Hearing loss, adult onset 6 5488 Trachea, bronchus, lung cancers 5 9529 Diabetes mellitus 5 882
10 Vision disorders, age-related and other 4 766
Disease burden – adults aged 15–59
Rank Cause DALYs (000)
1 HIV/AIDS 68 6612 Unipolar depressive disorders 57 8433 Tuberculosis 28 3804 Road traffic injuries 27 2645 Ischaemic heart disease 26 1556 Alcohol use disorders 19 5677 Hearing loss, adult onset 19 4868 Violence 18 9629 Cerebrovascular disease 18 749
10 Self-inflicted injuries 18 522
Mortality – adults aged 60+
Rank Cause Deaths (000)
1 Ischaemic heart disease 58252 Cerebrovascular disease 46893 Chronic obstructive pulmonary disease 23994 Lower respiratory infections 13965 Trachea, bronchus, lung cancers 9286 Diabetes mellitus 7547 Hypertensive heart disease 7358 Stomach cancer 6059 Tuberculosis 495
10 Colon and rectum cancers 477
Table 1.3 Leading causes of mortality and disease burden (DALYs) among adults, worldwide, 2002

18 The World Health Report 2003
Nearly 80% of the almost 3 million global deaths from HIV/AIDS in 2002 occurred in sub-Saharan Africa. As stated earlier, HIV/AIDS is the leading cause of death in this region. Itcauses more than 6000 deaths every day and accounts for one in two deaths of adults aged15–59 years. It has reversed mortality trends among adults in this region and turned previousgains in life expectancy into a continuous decline in life expectancy since 1990.
Mortality and disease among older adultsIn developing countries, 42% of adult deaths occur after 60 years of age, compared with 78%in developed countries. Globally, 60-year-olds have a 55% chance of dying before their 80thbirthday. Regional variations in risk of death at older ages are smaller, ranging from around40% in the developed countries of western Europe to 60% in most developing regions and70% in Africa. Historical data from countries such as Australia and Sweden show that lifeexpectancy at age 60 changed slowly during the first six to seven decades of the 20th centurybut, since around 1970, has started to increase substantially. Life expectancy at age 60 hasnow reached 25 years in Japan. From 1990 onwards, eastern European countries such as Hun-gary and Poland have started to experience similar improvements in mortality for older peo-ple, but others, such as the Russian Federation, have not, and are experiencing worseningtrends. The leading causes of mortality and burden of disease in older people have not changedgreatly over the past decade.
The growing burden of noncommunicable diseasesThe burden of noncommunicable diseases is increasing, accounting for nearly half of theglobal burden of disease (all ages), a 10% increase from estimated levels in 1990. While theproportion of burden from noncommunicable diseases in developed countries remains sta-ble at over 80% in adults aged 15 years and over, the proportion in middle-income countrieshas already exceeded 70%. Surprisingly, almost 50% of the adult disease burden in the high-mortality regions of the world is now attributable to noncommunicable diseases. Populationageing (see Box 1.3) and changes in the distribution of risk factors have accelerated the epi-demic of noncommunicable diseases in many developing countries (10).
Box 1.3 Population ageing
A demographic revolution is under way throughout the world. Today,there are around 600 million people in the world aged 60 years andover. This total will double by 2025 and by 2050 will reach two billion,the vast majority of whom will be in the developing world. Such acceler-ated global population ageing will increase economic and social de-mands on all countries.
While the consequences of population ageing in the areas of healthand income security are already at the centre of discussions by policy-makers and planners in the developed world, the speed and impact ofpopulation ageing in the less developed regions are yet to be fully ap-preciated. By 2025, in countries such as Brazil, China and Thailand, theproportion of older people will be above 15% of the population, whilein Colombia, Indonesia and Kenya the absolute numbers will increaseby up to 400% over the next 25 years – up to eight times higher thanthe increases in already aged societies in western Europe where popu-lation ageing occurred over a much longer period of time (11).
Population ageing is driven by two factors: a decline in the pro-portion of children, reflecting declines in fertility rates in the overallpopulation, and an increase in the proportion of adults 60 years of ageand over as mortality rates decline. This demographic transition will bring
with it a number of major challenges for health and social policy plan-ners. As populations age, the burden of noncommunicable diseases in-creases. Evidence from developed countries, however, shows that theprevalence of chronic diseases and the levels of disability in older peo-ple can be reduced with appropriate health promotion and strategies toprevent noncommunicable diseases. It is of great concern that the preva-lence of risk factors for chronic diseases is on the increase in developingcountries. Opportunities missed by health systems to deal with or man-age age-related noncommunicable diseases will lead to increases in theincidence, prevalence and complications of these diseases and may takeresources away from other priorities, such as child and maternal health.
Improving health systems and their responses to population age-ing makes economic sense. With old-age dependency ratios increasingin virtually all countries of the world, the economic contributions andproductive roles of older people will assume greater importance. Sup-porting people to remain healthy and ensure a good quality of life intheir later years is one of the greatest challenges for the health sector inboth developed and developing countries (12).

Global Health: today’s challenges 19
Cardiovascular diseases account for 13% of the disease burden among adults over 15 years ofage. Ischaemic heart disease and cerebrovascular disease (stroke) are the two leading causesof mortality and disease burden among older adults (over age 60). In developed countries,ischaemic heart disease and cerebrovascular disease are together responsible for 36% ofdeaths, and death rates are higher for men than women. The increase in cardiovascular mor-tality in eastern European countries has been offset by continuing declines in many otherdeveloped countries. In contrast, the mortality and burden resulting from cardiovasculardiseases are rapidly increasing in developing regions (see Chapter 6).
Of the 7.1 million cancer deaths estimated to have occurred in 2002, 17% were attributable tolung cancer alone and of these, three-quarters occurred among men (13). There were anestimated 1.2 million lung cancer deaths in 2000, an increase of nearly 30% in the 10 yearsfrom 1990, reflecting the emergence of the tobacco epidemic in low-income and middle-income countries.
Stomach cancer, which until recently was the leading cause of cancer mortality worldwide,has been declining in all parts of the world where trends can be reliably assessed, and nowcauses 850 000 deaths each year, or about two-thirds as many as lung cancer. Liver and colon/rectum cancers are the third and fourth leading causes. More than half of all liver cancerdeaths are estimated to occur in the Western Pacific Region. Among women, the leadingcause of cancer deaths is breast cancer. During the past decade, breast cancer survival rateshave been improving, though the chance of survival varies according to factors such as cover-age and access to secondary prevention. Globally, neuropsychiatric conditions account for19% of disease burden among adults (see Box 1.4), almost all of this resulting from non-fatalhealth outcomes.
Injuries – a hidden epidemic among young menInjuries, both unintentional and intentional, primarily affect young adults, often resulting insevere disabling consequences. Overall, injuries accounted for over 14% of adult disease bur-den in the world in 2002. In parts of the Americas, eastern Europe and the Eastern Mediter-ranean Region, more than 30% of the entire disease burden among male adults aged 15–44years is attributable to injuries.
Box 1.4 The burden of mental ill-health
Mental, neurological and substance use disorders cause a large burdenof disease and disability: globally, 13% of overall disability-adjusted lifeyears (DALYs) and 33% of overall years lived with disability (YLDs). Be-hind these stark figures lies human suffering: more than 150 millionpeople suffer from depression at any point in time; nearly 1 million com-mit suicide every year; and about 25 million suffer from schizophrenia,38 million from epilepsy, and more than 90 million from an alcohol ordrug use disorder.
A large proportion of individuals do not receive any health carefor their condition, firstly because the mental health infrastructure andservices in most countries are grossly insufficient for the large and grow-ing needs (14) and, secondly, because widely prevalent stigma and dis-crimination prevent them from seeking help. A policy for mental healthcare is lacking in 40% of countries, and 25% of those with a policyassign no budget to implement it. Even where a budget exists, it is verysmall: 36% of countries devote less than 1% of their total health re-sources to mental health care. Though community-based services arerecognized to be the most effective, 65% of all psychiatric beds are stillin mental hospitals – cutting into the already meagre budgets while
providing largely custodial care in an environment that may infringepatients’ basic human rights.
Cost-effective health care interventions are available. Recent re-search clearly demonstrates that disorders such as depression, schizo-phrenia, alcohol problems and epilepsy can be treated within primaryhealth care. Such treatment is well within the reach of even low-incomecountries and will reduce substantially the overall burden of these disor-ders. Interventions rely on inexpensive medicines that are commonlyavailable and, for the most part, free of patent restrictions, and basictraining of health professionals (15).
Mental health also has an impact on health care systems in otherways. A large proportion of people with chronic physical diseases suchas diabetes and hypertension, malignancies and HIV/AIDS suffer fromconcurrent depression, which significantly interferes with their adher-ence to health care regimens. Behavioural and lifestyle factors are alsoresponsible for many communicable and noncommunicable diseases (10).Though these links have been recognized, most countries are not ad-equately using this information to enhance the effectiveness of theirhealth care systems.

20 The World Health Report 2003
Among men, road traffic injuries, violence and self-inflicted injuries are all among the top 10leading causes of disease burden in the 15–44-year-old age group. Globally, road traffic inju-ries are the third leading cause of burden in that age and sex group, preceded only by HIV/AIDS and unipolar depression. The burden of road traffic injuries is increasing, especially inthe developing countries of sub-Saharan Africa and South-East Asia, and particularly affectsmales (see Chapter 6).
Intentional injuries, a group that includes self-inflicted injuries and suicide, violence andwar, account for an increasing share of the burden, especially among economically produc-tive young adults. In developed countries, suicides account for the largest share of intentionalinjury burden whereas, in developing regions, violence and war are the major causes. Coun-tries of the former Soviet Union and other high-mortality countries of eastern Europe haverates of injury death and disability among males that are similar to those in sub-SaharanAfrica.
Non-fatal health outcomesThe overall burden of non-fatal disabling conditions is dominated by a relatively short list ofcauses. In all regions, neuropsychiatric conditions, largely depression, are the most impor-tant causes of disability, accounting for over 35% of YLDs among adults (aged 15 and over).Their disabling burden is almost the same for men and women, but the major contributingcauses are different. The burden of depression is 50% higher for women than for men, andwomen also have higher burden from anxiety disorders, migraine and senile dementias. Incontrast, the burden for alcohol and drug use disorders is nearly six times higher in men thanin women, and accounts for one-quarter of the male neuropsychiatric burden.
In high-mortality developing regions, visual impairment, hearing loss and HIV/AIDS are theother major contributors to YLDs. In developed and low-mortality developing regions, visualimpairment, hearing loss, musculoskeletal disease, chronic obstructive pulmonary disease,and other noncommunicable diseases, particularly stroke, account for the majority of adultdisability.1
1 Estimated YLDs by cause, age group and sex for 2002 are available on the WHO web site for the six WHOregions and for the 14 epidemiological subregions (www.who.int/evidence/bod).
0
50
100
150
200
Age
-sta
ndar
dize
d YL
Ds
rate
per
1000
pop
ulat
ion
Developed Low-mortalitydeveloping
High-mortalitydeveloping
World
Figure 1.11 Age-standardized rate of years lived with disability (YLDs): developedand developing countries, 2002

Global Health: today’s challenges 21
Surprisingly, more than 80% of global YLDs are in developing countries and nearly halfoccur in high-mortality developing countries. Figure 1.11 shows higher rates of YLDs per1000 (age-standardized to the world population in 2002) in developing regions, indicating ahigher incidence of disabling conditions as well as increased levels of severity of these condi-tions. Although the prevalence of disabling conditions, such as dementia and musculoskel-etal disease, is higher in countries with long life expectancies, this is offset by lower disabilityfrom conditions such as cardiovascular disease, chronic respiratory diseases and long-termsequelae of communicable diseases and nutritional deficiencies. In other words, people liv-ing in developing countries not only face lower life expectancies (higher risk of prematuredeath) than those in developed countries, but also live a higher proportion of their lives inpoor health.
Healthy life expectancy varies across regions of the world even more than total life expect-ancy, ranging from a low of 41 years for sub-Saharan Africa to 71.4 years for western Europe,with a global average of 57.7 years in 2002. Healthy life expectancy converts total life expect-ancy into equivalent years of “full health” by taking into account years lived in less than fullhealth as a result of diseases and injuries. The gap between total life expectancy and healthylife expectancy represents the equivalent lost healthy years resulting from states of less thanfull health in the population, and ranges from 9% in the European Region and the WesternPacific Region to 15% in Africa. Annex Table 4 contains estimates of healthy life expectancyfor all WHO Member States in 2002.
To sum up, this chapter is a reminder that children are among the most vulnerable membersof societies around the world. Despite considerable achievements, much still needs to bedone, urgently, to avert child deaths from preventable causes. The success stories in manypoor countries in all regions demonstrate clearly that much progress can be made with lim-ited resources. Tragically, many other countries, particularly in Africa, have lost the groundgained in previous decades. The gaps in mortality between rich and poor populations arewidening, leaving 7% of the world’s children and 35% of Africa’s children at higher risk ofdeath today than they were 10 years ago.
In the last five decades there have been impressive gains in adult health status worldwide. Theaverage figures, however, mask disparities in population health. Of great concern are the re-versals in adult mortality in the 1990s in sub-Saharan Africa caused by HIV/AIDS and inparts of eastern Europe attributable to a number of noncommunicable diseases (particularlycardiovascular and alcohol-related diseases) and injuries.
Demographic trends and health transitions, along with changes in the distribution of riskfactors, have accelerated the epidemic of noncommunicable disease in many developing coun-tries. Infectious diseases such as HIV/AIDS and tuberculosis have serious socioeconomic con-sequences in both the developed and the developing worlds. Thus, the majority of developingcountries are facing a double burden from both communicable and noncommunicablediseases. In addition, contrary to common perceptions, disabilities tend to be more prevalentin developing regions, as the disease burden is often skewed towards highly vulnerable sub-populations. The global public health community is now faced with a more complex anddiverse pattern of adult disease than previously expected. It has been estimated that 47% ofpremature deaths and 39% of the total disease burden result from 20 leading risk factors forchildhood and adult diseases and injuries and that removal of these risks would increaseglobal healthy life expectancy by 9.3 years, ranging from 4.4 years in industrialized countriesof the Western Pacific Region to 16.1 years in parts of sub-Saharan Africa (16).
22 The World Health Report 2003
Historically unprecedented increases in life expectancy at older ages in developed countrieshave already exceeded earlier predictions of maximum population life expectancy. With suchincreases, the non-fatal burden of disease plays an increasingly important role, and it will bea major goal of health policy worldwide to ensure that longer life is accompanied by greaterhealth and less disability.
This chapter has described many of the facts of life and death across the world and the under-lying trends that influence them. Much of what has been reviewed here relates closely to thehealth-related Millennium Development Goals. Understanding the goals, and why the progresstowards them is so important and at the same time so difficult, is the subject of the nextchapter.
References1. Murray CJL, Lopez AD, eds. The global burden of disease: a comprehensive assessment of mortality and
disability from diseases, injuries and risk factors in 1990 and projected to 2020. Cambridge, MA, HarvardSchool of Public Health on behalf of the World Health Organization and the World Bank, 1996 (GlobalBurden of Disease and Injury Series, Vol. I).
2. Lee JW. Child survival: a global health challenge. Lancet, 2003, 362:262.
3. Mswia R et al. and the AMMP Team. Dar es Salaam demographic surveillance system. In: The INDEPTHNetwork. Population and health in developing countries. Vol. 1: Population, health and survival at INDEPTHsites. Ottawa, International Development Research Centre, 2002:143–150.
4. Mswia R et al. and the AMMP Team. Hai demographic surveillance system. In: The INDEPTH Network.Population and health in developing countries. Vol. 1: Population, health and survival at INDEPTH sites.Ottawa, International Development Research Centre, 2002:151–158.
5. Mswia R et al. and the AMMP Team. Morogoro demographic surveillance system. In: The INDEPTHNetwork. Population and health in developing countries. Vol. 1: Population, health and survival at INDEPTHsites. Ottawa, International Development Research Centre, 2002:167–172.
6. Wang L. Determinants of child mortality in LDCs: empirical findings from demographic and health surveys.Health Policy, 2003, 65:277–299.
7. Lock K et al. What targets for international development policies are appropriate for improving health inRussia? Health Policy and Planning, 2002, 17:257–263.
8. Stein CE et al. The global burden of measles in the year 2000 – a model using country specific indicators.Journal of Infectious Disease, 2003, 187(S1):8–14.
9. Gregson S et al. Recent upturn in mortality in rural Zimbabwe: evidence for an early demographic impactof HIV-1 infection? AIDS, 1997, 11:1269–1280.
10. The world health report 2002 – Reducing risks, promoting healthy life. Geneva, World Health Organization,2002.
11. World population prospects – the 2002 revision. New York, NY, United Nations, Population Division, 2002.
12. Active ageing – a policy framework. Geneva, World Health Organization, 2002 (WHO/NMH/02.8).
13. Shibuya K et al. Global and regional estimates of cancer mortality and incidence by site: II. Results for theGlobal Burden of Disease 2000. BMC Cancer, 2002, 2:37.
14. Atlas: country profiles on mental health resources 2001. Geneva, World Health Organization, 2001(WHO/NMH/MSD/MDP/01.3).
15. The world health report 2001 – Mental health: new understanding, new hope. Geneva, World HealthOrganization, 2001.
16. Ezzati M et al. Estimates of global and regional potential health gains from reducing multiple major riskfactors. Lancet, 2003, 362:271–280.