Embed Size (px)
Citation preview
116
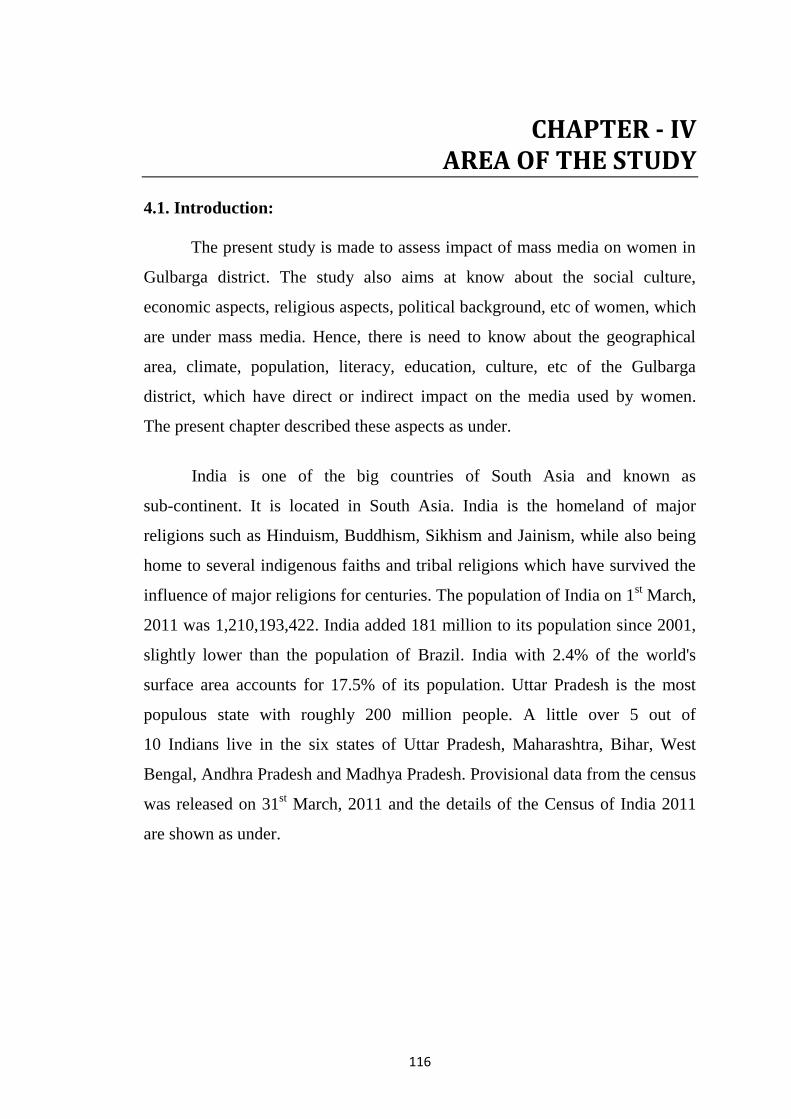
CHAPTER - IV AREA OF THE STUDY
4.1. Introduction:
The present study is made to assess impact of mass media on women in
Gulbarga district. The study also aims at know about the social culture,
economic aspects, religious aspects, political background, etc of women, which
are under mass media. Hence, there is need to know about the geographical
area, climate, population, literacy, education, culture, etc of the Gulbarga
district, which have direct or indirect impact on the media used by women.
The present chapter described these aspects as under.
India is one of the big countries of South Asia and known as
sub-continent. It is located in South Asia. India is the homeland of major
religions such as Hinduism, Buddhism, Sikhism and Jainism, while also being
home to several indigenous faiths and tribal religions which have survived the
influence of major religions for centuries. The population of India on 1st March,
2011 was 1,210,193,422. India added 181 million to its population since 2001,
slightly lower than the population of Brazil. India with 2.4% of the world's
surface area accounts for 17.5% of its population. Uttar Pradesh is the most
populous state with roughly 200 million people. A little over 5 out of
10 Indians live in the six states of Uttar Pradesh, Maharashtra, Bihar, West
Bengal, Andhra Pradesh and Madhya Pradesh. Provisional data from the census
was released on 31st March, 2011 and the details of the Census of India 2011
are shown as under.

117
Table No. 4.1. Census of India 2011: Highlights (Estimates)
Population Total 1,210,193,422
Males 623,724,248
Females 586,469,174
Literacy Total 74.04%
Males 82.14%
Females 65.46%
Density of population per km2 382
Sex ratio per 1000 males 940 females
Child Sex ratio (0–6 age group) per 1000 males 914 females
The current population of India is shown in the following table:
Table No. 4.2. State-wise Current Population of India 2012
Rank State or UT
Population
(2011
Census)
Density
(per km2)
Sex Ratio
01 Uttar Pradesh 199581477 828 908
02 Maharashtra 112372972 365 946
03 Bihar 103804637 1102 918
04 West Bengal 91347736 1029 947
05 Andhra Pradesh 84665533 308 992
06 Madhya Pradesh 72597565 236 930
07 Tamil Nadu 72138958 555 995
08 Rajasthan 68621012 201 926
09 Karnataka 68621012 201 968
10 Gujarat 61130704 319 918
11 Odisha 41947358 269 978
12 Kerala 33387677 859 1084
13 Jharkhand 32966238 414 947
14 Assam 31169272 397 954
15 Punjab 27704236 550 893
16 Haryana 25353081 573 877
17 Chhattisgarh 25540196 189 991
18 Jammu & Kashmir 12548926 56 883
19 Uttarakhand 10116752 189 963
20 Himachal Pradesh 6856509 123 974
21 Tripura 3671032 350 961
22 Meghalaya 2694007 132 986
23 Manipur 2721756 122 987

118
24 Nagaland 1980602 119 931
25 Goa 1457723 394 968
26 Arunachal Pradesh 1382611 17 920
27 Mizoram 1091014 52 975
28 Sikkim 607688 86 889
UT1 Delhi 16753235 9340 866
UT2 Puducherry 1244464 2598 1038
UT3 Chandigarh 1054686 9252 818
UT4 Andaman & Nicobar
Islands
379944 46 878
UT5 Dadra & Nagar
Haveli
342853 698 775
UT6 Daman & Diu 242911 2169 618
UT7 Lakshadweep 64429 2013 946
Total India 1210193422 382 940
Karnataka is located at the South-west part of India. Karnataka is a state
of diverse cultures, languages and faiths and the economic and social scenario
within the state, in many ways, mirrors the scenario prevalent in the country
itself. Located in the southern part of India, between the latitudes 11.31° and
18.45° North and the longitudes 74.12° and 78.40° East, Karnataka is, in terms
of population, the ninth largest state among India‘s 28 major states and 7 Union
Territories. Along its northern borders lie the states of Maharashtra and Goa;
Andhra Pradesh is to the east; Tamil Nadu and Kerala to the south, while the
Arabian Sea forms the western boundary. Karnataka came into being as a state
of the Union of India on November 1st, 1956 as a result of the merger of five
territories where Kannada was the language of the people. These were: four
districts of the erstwhile Bombay state; three districts of the erstwhile princely
state of Hyderabad; two districts and one taluk of the former Madras state; the
former Part C state of Coorg (now known as Kodagu); and nine districts of the
former princely state of Mysore. Map of Karnataka is given as under:

119
Map No. 1. Karnataka State in India with districts
The new state was initially known as Mysore, but subsequently, in 1973,
it was renamed ‗Karnataka‘, thereby fulfilling a long standing demand of the
people of the state. For administrative purposes, the state is divided into
30 revenue districts. It is the eighth largest Indian State by area, with
61,130,704 inhabitants at the 2011 census, Karnataka is the ninth state by
population, comprising 30 districts. Kannada is the most widely spoken and
official language of the state. The statistics of Karnataka population as per the
Census of India 2011 is as under:

120
Table No. 4.3. Statistics of Karnataka
Particulars 2011 2001
Approximate Population 6.11 Crore 5.29 Crore
Actual Population 61130704 52850562
Male 31057742 26898918
Female 30072962 25951644
Population Growth 15.67% 17.25%
Percentage of Total
Population
5.05% 5.14%
Sex Ratio 968 964
Child Sex Ratio 943 973
Literacy 75.60% 66.64%
Male Literacy 82.85% 76.06%
Female Literacy 68.13% 57.80%
Total Literates 41029323 30434962
Male Literates 22808468 17661211
Female Literates 18220855 12773751
The distribution of population in districts of Karnataka including
Gulbarga as per the Census of India, 2011 is shown in the following table.
Table No. 4.4. Distribution of Population in Districts of Karnataka
District
Code State/ District
Population in 2011
Persons Male Female
Karnataka 61130704 31057742 30072962
01 Belgaum 4778439 2427104 2351335
02 Bagalkot 1890826 952902 937924
03 Bijapur 2175102 1112953 1062149
04 Bidar 1700018 870850 829168
05 Raichur 1924773 966493 958280
06 Koppal 1391292 701479 689813
07 Gadag 1065235 538477 526758
08 Dharwad 1846993 939127 907866
09 Uttara Kannada 1436847 727424 709423
10 Haveri 1598506 819295 779211
11 Bellary 2532383 1280402 1251981
12 Chitradurga 1660378 843411 816967
13 Davanagere 1946905 989602 957303
14 Shimoga 1755512 879817 875695
15 Udupi 1177908 562896 615012
16 Chikmagalur 1137753 567483 570270
17 Tumkur 2681449 1354770 1326679
18 Bangalore 9588910 5025498 4563412

121
19 Mandya 1808680 909441 899239
20 Hassan 1776221 885807 890414
21 Dakshina
Kannada
2083625 1032577 1051048
22 Kodagu 554762 274725 280037
23 Mysore 2994744 1511206 1483538
24 Chamarajanagar 1020962 513359 507603
25 Gulbarga 2564892 1307061 1257831
26 Yadgir 1172985 591104 581881
27 Kolar 1540231 779401 760830
28 Chikkaballapur 1254377 637504 616873
29 Bangalore
Rural
987257 507514 479743
30 Ramanagar 1082739 548060 534679 Source: Census of India, 2011
The state income or Net State Domestic Product (at 1993-94 prices)
increased from Rs. 30,087.57 crore in 1990-91 to Rs. 61,386.40 crore in
2001-02 registering an increase of 9.5 per cent per annum. The per capita
income (NSDP) at constant prices increased from Rs. 6,739 to Rs. 11,516
showing an annual increase of 7.1 per cent during the same period. Agriculture
is the mainstay of the people in the state. Cultivators and agricultural labourers
form about 56 percent of the workforce (2001 census). Agriculture in the state
is characterized by wide crop diversification.
4.2. Gulbarga District:
Gulbarga district is one of the three districts that were transferred from
Hyderabad State to Karnataka state at the time of re-organization of the state in
1956 and is also called as ―Kalaburgi‖ in Kannada. The district is one among
the 30 districts of Karnataka State. It is located in the Northern part of the state.
The District was a biggest district in the state and in 2008, it was divided and
new district Yadgir was formed with 3 talukas from Gulbarga district.
Gulbarga district is bounded on the west by Bijapur district of Karnataka and
Sholapur district of Maharashtra, on the west by Bijapur district of Andhra
Pradesh, on the north by Bidar district of and Osmanabad district of
Maharashtra and on the south by Raichur district of Karnataka. There are seven

122
talukas located in Gulbarga district, namely, Afzalpur, Aland, Chincholli,
Chittapur, Gulbarga, Jewargi and Sedam. In 2011, Gulbarga had population of
2,564,892 of which male and female were 1,307,061 and 1,257,831
respectively. In 2001 census, Gulbarga had a population of 2,174,742 of which
males were 1,110,442 and remaining 1,064,200 were females. Geographical
location of Gulbarga district in Karnataka state is shown as under.
Map No. 2. Gulbarga district in Karnataka and India

123
1. Brief History:
The District was under the rule of Nijam of Hyderabad before
independence. The district has a rich background of knowledge and culture.
The existence of university at Nagai in Chitapur, Vignaneshwaras Mitakshara,
Nrupatungas Kavirajmarg and the religious and social revolution led by
Shivsharanas and the Sufi saint Banda Nawaz are all evidence of it.
However, due to erratic rainfall and continuous occurrence of droughts in the
19th
century the life of the people was never smooth and secure. Further during
the Nizams‘ period, the district could not develop due to the negligence and
inefficient administration. The distance was also a factor contributing to it.
Thus it was one of the most backward districts when it joined the old Mysore
State. This position has not changed even after five decades. The map of
Gulbarga district is shown as under.
Map No. 3. Gulbarga District
2. Socio Economic Background:
In recent years a High Power Committee was constituted by the govt. of
Karnataka to look into the problem of regional imbalances in the state.
The Committee (popularly known as Nanjundappa Committee) submitted its

124
report in 2002. The committee, on the basis of various socio-economic
indicators assessed the development of 175 talukas in the state. The Committee
has identified nine talukas among the ten talukas in Old Gulbarga district as the
most backward talukas.
Table No. 4.5. Most Backward Talukas of Gulbarga District
in Karnataka State
Taluka Rank in State Index
Sedam 155 0.72
Chittapur 165 0.65
Afzalpur 170 0.62
Aland 172 0.61
Chincholi 173 0.57
Jewargi 174 0.57
Source: Report of the High Power Committee for Redressal of Regional
Imbalance in Karnataka, Govt. of Karnataka Bangalore 2002
3. Position of the District in Human Development:
Karnataka State has published Human development Report in 1999
based on 1991 date for the then 20 district in the state. The progress in human
Development was brought out through another report published in 2005 for
27 districts in the state today based on 2001 Data. The position of the district
along with the other district in Hyderabad Karnataka Region is indicated in the
following table. The district in both the reports is at the bottom level.
Table No. 4.6. Human Development and Gender Development in
Gulbarga District and HK region
Districts HDI
1991 Rank
HDI
2001 Rank
GDI
1991 Rank
GDI
2001 Rank
Bellary 0.512 18 .617 18 0.499 17 0.606 17
Bidar 0.496 23 0.599 21 0.477 23 0.572 22
Gulbarga 0.453 25 0.564 26 0.432 25 0.543 26
Raichur 0.443 27 0.547 27 0.422 27 0.530 27
State 0.541 - 0.650 - 0.525 - 0.637 -
Source: Human Development Report 2005 Govt. of Karnataka.

125
The position of the district has come down from 25th
to 26th
in the State.
This is because of slow progress in the field of Education and fall in Income
index.
Table No. 4.7. Various Indices of human Development for
Gulbarga District
Year Health
Index Rank
Education
Index Rank
Income
Index Rank
1991 0.575 23 0.432 25 0.352 24
State 0.618 - 0.602 - 0.402 -
2001 0.632 20 0.572 25 0.490 25
State 0.680 - 0.712 - 0.559 -
Source: Human Development Report 2005 Govt. of Karnataka
Thus, the position of the district has not improved significantly over the
years. The gap between the State and the district is reduced by only a margin of
0.2 (From 0.88 to 0.86).
4. Geographical Traits:
The district has total area of 16174 Sq. Kms. This constitutes 5.93% of
the area of the state. The region is characterized by black cotton soil, expanses
of flat treeless surface, a range of hills covering a surface of about 60 miles and
same lower belts following the main rivers. The district is devoid of forest
except in the hilly portion of Aland and Chincholi. The area under forest is
4.2% of the total area.
Table No. 4.8. Area of Gulbarga district
Sl.
No. Taluks Hoblies
Grama
Panchayaths Inhabited
Un-
Inhabited Towns/ Urban
Agglomeration
1 2 3 4 5 6 7
1 Afzalpur 3 22 89 4 0
2 Aland 5 39 135 1 1
3 Chincholli 4 32 137 11 0
4 Chittapur 5 35 122 3 5
5 Gulbarga 6 36 136 4 1
6 Jewargi 5 33 145 14 0
7 Sedam 4 23 109 8 3
TOTAL 32 220 873 45 10
126
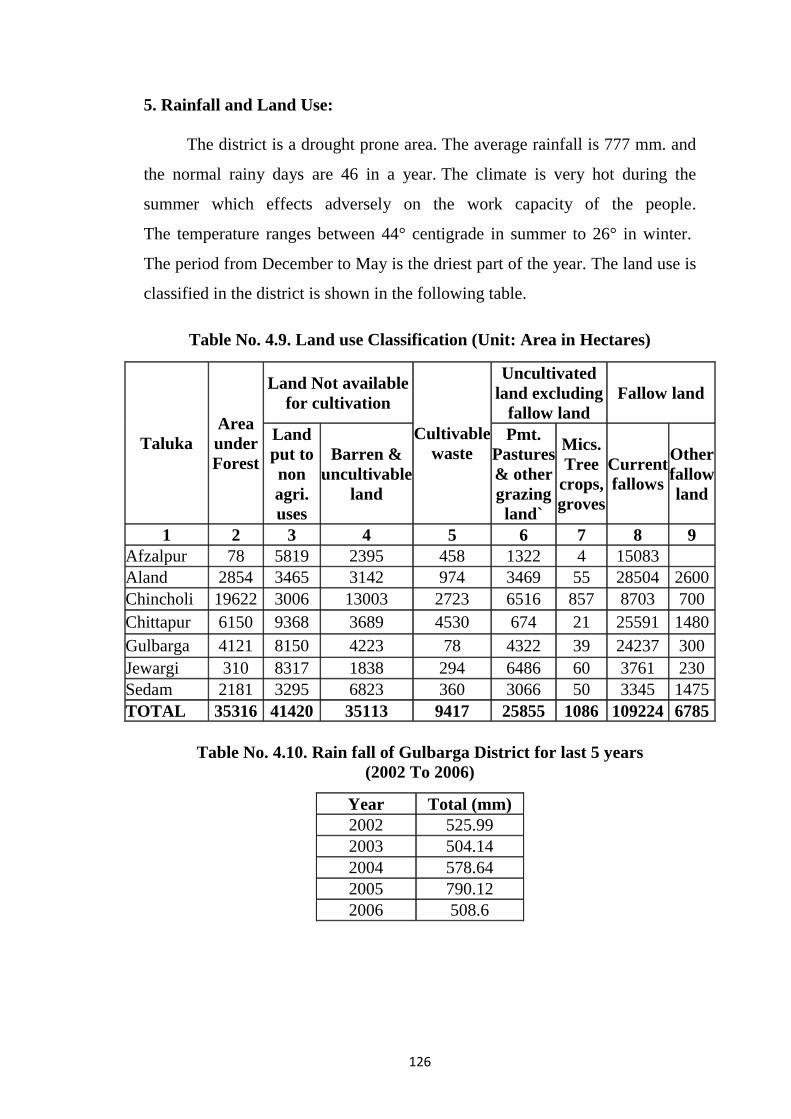
5. Rainfall and Land Use:
The district is a drought prone area. The average rainfall is 777 mm. and
the normal rainy days are 46 in a year. The climate is very hot during the
summer which effects adversely on the work capacity of the people.
The temperature ranges between 44° centigrade in summer to 26° in winter.
The period from December to May is the driest part of the year. The land use is
classified in the district is shown in the following table.
Table No. 4.9. Land use Classification (Unit: Area in Hectares)
Taluka
Area
under
Forest
Land Not available
for cultivation
Cultivable
waste
Uncultivated
land excluding
fallow land
Fallow land
Land
put to
non
agri.
uses
Barren &
uncultivable
land
Pmt.
Pastures
& other
grazing
land`
Mics.
Tree
crops,
groves
Current
fallows
Other
fallow
land
1 2 3 4 5 6 7 8 9
Afzalpur 78 5819 2395 458 1322 4 15083
Aland 2854 3465 3142 974 3469 55 28504 2600
Chincholi 19622 3006 13003 2723 6516 857 8703 700
Chittapur 6150 9368 3689 4530 674 21 25591 1480
Gulbarga 4121 8150 4223 78 4322 39 24237 300
Jewargi 310 8317 1838 294 6486 60 3761 230
Sedam 2181 3295 6823 360 3066 50 3345 1475
TOTAL 35316 41420 35113 9417 25855 1086 109224 6785
Table No. 4.10. Rain fall of Gulbarga District for last 5 years
(2002 To 2006)
Year Total (mm)
2002 525.99
2003 504.14
2004 578.64
2005 790.12
2006 508.6

127
6. Basic Infrastructure:
The district also lacks adequate infrastructure which is one of the basic
cause of long economic stagnation in the district. The total length of surface
roads is only 28.26 kms. The length of village roads is 3678.75 kms. A large
part of these roads are closed during rainy season. The total length of railway
line is 225 kms. The district headquarters lies on the main National Network.
But the internal network availability is very low. Only 4 talukas Afzalpur,
Chittapur, Gulbarga and Sedam are connected by a railway line.
Table No. 4.11. Basic Infrastructure
Taluka State
Highways
Major
District
Roads
Other
District
Roads
Village
Roads
Railway
Route
Length
Afzalpur 101.1 141.48 ---- 602.4 31
Aland 185.1 182.5 ---- 703.2 ---
Chincholi 131.6 112 ---- 582.85 ---
Chittapur 56.3 272.2 ---- 693.35 66
Gulbarga 112.3 48.85 0 648.79 38
Jewargi 36.35 239.1 ---- 1045.7
Sedam 95.6 117 0 381.45 32
TOTAL 718.35 1113.13 0 4657.74 167
Table No. 4.12. Area Irrigated through various Sources
Taluka Canals Tanks Wells Borewells Lift
Irrigation
Other
Sources Total
Afzalpur 67 8891 970 60 1653 11641
Aland -- 165 6045 247 177 7297
Chincholi 1529 324 544 799 --- 158 3354
Chittapur -- -- 538 265 --- 518 1321
Gulbarga 77 45 3112 202 --- --- 3436
Jewargi 16859 -- 6000 330 --- 592 23781
Sedam -- 480 1215 179 --- 293 2167
Total 18465 1081 26345 2745 307 3391 52997

128
Table No. 4.13. Rural Electrification
Taluka Total
Villages
Villages
electrified IP Sets
Afzalpur 89 93 9251
Aland 135 75 11567
Chincholi 137 125 1800
Chittapur 122 68 2358
Gulbarga 136 29 7599
Jewargi 145 36 2644
Sedam 109 34 1840
TOTAL 873 460 37059
7. Educational Infrastructure:
The district has following infrastructure for provision of Education.
Table No. 4.14. Educational Infrastructure according to Census 2001
Primary Schools 2800
High Schools 500
Junior College 132
General Colleges; 26
Medical Colleges
(Including ISM) 06
Polytechnic Colleges 08
Engineering Colleges 04
8. Demographic Trends:
Gulbarga District is experiencing rapid growth of population since 1951.
The decimal growth rate has increased from 14.5 percent to 15.3 percent between
1951 to 61 to 24.2 percent between 1981 to 1991 and has slightly come down to
21 percent between 1999 to 2001. The population of the district as per 2001
census is 31, 30,922 of which male population is 15,92,789 and female population
is 15,38,133. The sex ratio is 966 per 1000 male persons. This is slightly above the
state average of 965 and well above the national average of 933.72% of the
population lives in rural areas. The population is spread over the geographical area
and the density of population is 192 per sq.km.

129
Table No. 4.15. Population trends during the 20th century Decadal
variation
Year Population Decadal Variation
Percentage
1901 883062 --
1911 964468 9.22
1921 887875 -7.94
1931 990505 11.56
1941 1059716 6.99
1951 1213608 14.5
1961 1399457 15.31
1971 1739220 24.2
1981 2080643 19.6
1991 2582169 24.1
2001 3130922 21.4
Source: Census of India District census Hand book:
Gulbarga District 1961-2001.
Table No. 4.16. Demographic Characteristics - 2001
Taluka Area Total
Population Male Female Rural Urban
Afzalpur 1305 180071 92538 87533 160736 19335
Aland 1735 297136 152233 144903 261891 35245
Chincholi 1569 223646 113309 110337 206502 17144
Chittapur 1765 366802 186390 180412 238532 12870
Gulbarga 1730 675679 348665 327014 245414 430265
Jewargi 1822 235254 119598 115656 216075 19179
Sedam 1025 196154 97709 98445 156026 40128
District 10951 2174742 1110442 1064300 1485176 574166
Table No. 4.17. Density of Population and Sex Ratio
Taluka % of Urban
Population
Sex
Ratio Density
Afzalpur 10.7 946 116
Aland 11.9 952 150
Chincholi 7.7 974 121
Chittapur 35 968 175
Gulbarga 63.7 938 303
Jewargi 8.2 967 104
Sedam 20.5 1008 159
DISTRICT 157.7 6753 1128

130
9. SC and ST Population:
Gulbarga district has a sizable part of Scheduled Caste Population. It is
23% of the total population of the district. It is ranked 3rd in the state in respect
of this next to Kolar and Chamraj Nagar. In absolute numbers, the position of
the district (7,17,595) is next to Bangalore Urban (8,51,047). The SC and ST
population forms 22.9 and 4.9 percent of total population respectively.
Within the district the SC population is concentrated in the talukas of
Chincholi (33.2%) Chittapur (29.3%) and Sedam (25.8%). It is lowest in
Afzalpur taluka i.e., 17.8%. The proportion of SC population to total
population has declined from 23.6% to 22.9% between 1991-2001. The decline
follows mainly from two talukas i.e., Gulbarga (21.4% to 20.4%) and Afzalpur
(18.6% to 17.8%).
The proportion of ST population in district population has increased
marginally from 4% to 4.9%. The total ST population of the district as per 2001
census is 154195. It was 106935 in 1991. The growth rate per annum is 4.4%.
Table No. 4.18. Population of Scheduled Castes and Schedule Tribes 2001
Taluka
Scheduled Castes Schedule Tribes
Total Rural Urban
Proportion
to total
population
(percent)
Total Rural Urban
Proportion
to total
population
(percent)
Afzalpur 32103 28607 3496 17.82 3720 3667 53 2.06
Aland 67652 63682 3970 22.77 6194 6035 159 2.08
Chincholi 74337 70023 4314 33.23 5153 4917 236 2.3
Chittapur 107506 66845 40661 29.3 5789 4560 1229 15.78
Gulbarga 138047 73669 64378 20.43 9986 5335 4651 14.78
Jewargi 46806 43240 3566 19.89 11221 10454 767 4.76
Sedam 50686 42248 8438 25.83 5072 4129 943 2.58
TOTAL 517137 388314 128823 169.27 47135 39097 8038 44.34

131
Table No. 4.19. Literacy Rate- Scheduled Caste
Talukas Total Rural Urban
Male Female Total Male Female Total Male Female Total
Afzalpur 45.7 24.4 35.4 45.07 23.43 34.59 51.04 32.21 42.14
Aland 46.8 25.1 36.3 46.12 24.43 35.53 57.14 37.06 47.78
Chincholi 41 20 30.8 44.12 23.65 34.31 66.23 46.31 56.74
Chittapur 43 24.84 34.08 39.3 19.2 29.75 56.7 35 47.19
Gulbarga 54.7 34.1 44.8 28.9 13.98 21.47 51.47 30.15 41.14
Jewargi 36.8 18 27.5 35.38 18.66 27.15 55.48 35.08 45.5
Sedam 32.8 16.6 24.7 35.4 16.88 26.27 53.04 30.95 42.54
TOTAL 300.8 163.04 233.58 274.29 140.23 209.07 391.1 246.76 323.03
Table No. 4.20. Literacy Rate - Scheduled Tribes
Sl. No. Talukas Male Female Total Rural Urban
1 Afzalpur 48.4 28.6 39 39 39.6
2 Aland 46.8 25.2 36.4 36.2 42.1
3 Chincholi 50.2 27.3 39 38.6 47
4 Chittapur 38.4 19.9 29.4 24.6 47.1
5 Gulbarga 55.2 35.9 45.9 33 60.7
6 Jewargi 37 15.7 26.5 25.6 38.4
7 Sedam 34.5 17 25.6 24 32.2
TOTAL 310.5 169.6 241.8 221 307.1
10. Social Indicators:
The basic social indicators are presented in the following table. The help
us to understand the general conditions of the people, there literacy levels and
other Gender related issues. High proportion of agricultural labourers and non
workers as well as the SC/ST population indicates high incidence of poverty in
the district.

132
Table No. 4.21. Social Indicators of the District
Name of
the
taluka
Population Sex
Ratio
Proportion of
agricultural
labourers to total
workers
Proportion of
SC/ST
population
Proportion
of non
workers
Literacy
2001 2001 1991 2001 1991 2001 1991 2001 1991 2001
Afzalpur 180071 946 53.86 48.27 20.6 19.89 56.1 57.31 37.62 51.67
Aland 297136 952 50.34 50.39 27.1 24.85 54 48.63 39.12 53.79
Chincholi 223646 974 47.42 47.52 35.7 35.54 51.3 49.91 33.41 49.38
Chittapur 366802 968 36.33 30.48 31.4 30.88 59.8 61.49 38.72 50.25
Gulbarga 675679 938 25.57 22.85 23.1 21.9 67.5 67.04 57.33 67.46
Jewargi 235254 967 49.13 52.45 26.6 24.66 56.7 53.71 32.85 44.26
Sedam 196154 1008 35.71 39.5 25.4 28.42 52.4 53.42 34.5 45.23
District 2174742 6753 298.36 291.46 189.9 186.14 397.8 391.51 273.55 362.04
Table No. 4.22. Literacy and Education
Taluka
Growth in literacy 1961 to 2001 (percent)
Total literacy rate Growth in literacy
1961 1971 1981 1991 2001 1961-71 1971-81 1981-91 1991-01 1961-01
Afzalpur 9.2 16 23.7 37.62 51.67 73.91 48.13 58.73 37.34 461.63
Aland 14.23 18.2 24.8 39.12 53.79 27.89 36.26 57.74 37.5 278
Chincholi 14.45 16.8 21.3 33.41 49.38 16.26 26.78 56.85 47.8 241.73
Chittapur 13.06 18.8 25.46 38.72 50.25 43.95 35.42 52.08 29.77 284.76
Gulbarga 24.8 31 38.65 57.33 67.46 25.01 24.67 48.33 17.66 172.01
Jewargi 9.8 15.2 20.87 32.85 44.26 55.11 37.3 57.4 34.73 351.63
Sedam 13.7 15.7 21.67 34.5 45.23 14.59 38.02 59.2 31.1 230.14
TOTAL 99.24 131.7 176.45 273.55 362.04 256.72 246.58 390.33 235.9 2019.9
11. Employment and Occupation:
The employment and occupations of the people in Gulbarga district is
discussed as under.

133
Table No. 4.23. Work participate rate: proportion of workers
(Main and Marginal workers) to total population (rural +urban)
Taluka
Total Workers Male Female
1991 2001 1991 2001 1991 2001
Afzalpur 43.83 42.68 51.61 51.5 35.6 33.4
Aland 45.98 51.36 47 56.1 38.45 46.4
Chincholi 48.6 50.08 53.26 53.8 43.83 46.2
Chittapur 40.2 38.5 39.61 48.8 27.23 27.9
Gulbarga 32.49 32.95 20.7 45.5 16.16 19.5
Jewargi 48.3 46.28 52.92 51.3 43.6 41.1
Sedam 47.57 46.58 48.61 53.2 37.55 40
TOTAL 306.97 308.43 313.71 360.2 242.42 254.5
Table No. 4. 24. Growth of Main Workers 1991-2001
Taluka Main workers 2001 Main workers 1991
Decadal growth in
main workers
(1991-2001)
Persons Male Female Persons Male Female Persons Male Female
Afzalpur 54890 40251 14639 61858 39818 22040 0 0 0
Aland 106212 71457 34755 113536 68530 45006 -6.45 4.27 -2.28
Chincholi 80993 53341 27652 86337 50794 35543 0 0 0
Chittapur 113667 80839 32828 116123 78789 37334 -2.11 2.6 -12.06
Gulbarga 182003 142050 39953 164428 120522 43906 10.68 17.86 -10.36
Jewargi 78852 53540 25312 82837 50048 32789 0 0 0
Sedam 66359 45668 20691 71106 45129 25977 -6.67 1.19 -20.3
TOTAL 682976 487146 195830 696225 453630 242595 -4.55 25.92 -45
The district economy is mainly an agricultural economy as agriculture
contributes 31.7% of district income and provides employment to 67% of the
population. (A large part of the land is under dry land cultivation as the area
under irrigation is only 18.8 percent of the net area sown).

134
Table No. 4.25. Occupational pattern of the workforce (Main workers%)
Census
Year Cultivators
Agricultural
labourers
Household
industry
Other
Workers Total
1961 45.55 26.44 9.21 18.8 100
1971 34.13 36.55 4.4 24.92 100
1981 36.78 43.95 2.66 16.61 100
1991 35.19 50.15 2.06 12.6 100
2001 27.1 40 2.5 30.4 100
The occupational structure is stagnant over the time period.
The proportion of population engaged in agriculture has increased from 70% in
1961 to 75% during 1981-91 and has fallen down to 67% in 2001. The other
trend observed is the percentage of agricultural laborers was increasing till
1991. It has increased from 26.44% in 1961 to 40.1% in 1991 but has come
down to 39.96% in 2001. Though the share of tertiary sector in district income
has increased from 36.6 in 1991 to 45.2 percent in 2001-02 but its share in
employment has increased from 12.6 to 30.4% in 2001 during the same period.
Thus a trend of employment generation in service sector is set in post 1991
period.
Table No. 4.26. Distribution of Land Holding in the District
Holdings Number Percentage Area Percentage
Marginal
Holding 112331 20.46 13463 1.0
Small
holdings 191271 34.86 281868 20.93
Semi
Medium 158492 28.87 435718 32.36
Medium 73750 13.45 435001 32.32
Large 12956 2.36 180220 13.39
Total 548808 100 1346270 100
The distribution of land holdings indicates the domination of semi
medium holdings. They form 28.87 percent of total holdings and cover an area
of 32.36 percent.

135
Table No. 4.27. Land under Cultivation
Taluka
Net
area
sown
Area sown
more than
once
Total
cropped
area
Area
under
Food
grains
Afzalpur 105000 11000 116000 84926
Aland 128354 3800 166354 115484
Chincholi 100724 23416 124140 104319
Chittapur 124944 15000 139944 131719
Gulbarga 127695 19510 147205 116151
Jewargi 164017 24451 188468 133700
Sedam 81850 13517 95367 88854
District 832584 110694 977478 775153
12. Cropping Pattern:
The cropping pattern is mainly dominated by food crops. Tur is the main
crop produced in the district. The district is called as Tur Bowl of the state.
Jawar is the other main food crop Sunflower and Groundnut are the major
oilseeds which occupy the area of 1783870 and 59047 respectively.
Table No. 4.28. Area under Principal Crops and Cereals (in Ha)
Taluka Paddy Jowar Bajra Maize Wheat
Other
cereals
& Minor
Millets
Total
Cereals
& Minor
Millets
Afzalpur 71 26645 6105 440 3255 14 36530
Aland 651 30190 11172 564 3542 2 46121
Chincholi 225 22267 1314 72 139 15 24032
Chittapur 632 25690 3232 43 680 13 30290
Gulbarga 585 33753 8455 245 1829 27 44894
Jewargi 2894 37410 6320 346 4894 13 51877
Sedam 1105 19941 408 0 185 3 21642
DISTRICT 6163 195896 37006 1710 14524 87 255386

136
Table No. 4.29. Area under Pulses
Taluka Gram Tur Other
Pulses Total
Afzalpur 12140 32123 4133 48396
Aland 8117 39995 21251 69363
Chincholi 12784 40816 26687 80287
Chittapur 32285 54803 14341 101429
Gulbarga 11624 50307 9326 71257
Jewargi 13642 58615 9566 81823
Sedam 15857 30553 20802 67212
District 106449 307212 106106 519767
Table No. 4.30. Area under Oilseeds
Taluka Groundnut Sunflower Oilseeds Other
Pulses
Afzalpur 2701 23163 3268 29132
Aland 898 39171 10213 50282
Chincholi 57 285 3016 3358
Chittapur 290 4902 3657 8849
Gulbarga 512 18846 6524 25882
Jewargi 8528 29108 2732 40368
Sedam 756 3041 1935 5732
DISTRICT 13742 118516 31345 163603
13. Commercial Crops:
Sugarcane and cotton are the two commercial crops produced in the
district. But the area under these crops is very less.
Table No. 4.31. Area under Commercial Crops
Taluka Sugarcane Cotton
Afzalpur 3057 615
Aland 1236 --
Chincholi 1740 121
Chittapur 40 88
Gulbarga 527 3
Jewargi 200 4046
Sedam 31 --
DISTRICT 6831 4873

137
Table No. 4.32. Agricultural Production during X plan
Sl.
No. Crops
Production in Lakh tones ( Cotton – Lakh bales)
2002-03 2003-04 2004-05 2005-06 2006-07 Average
1 2 3 4 5 6 7 8
1 Total Cereals 4.235 4.742 3.816 5.34 3.903 4.407
2 Total Pulses 2.516 2.576 2.52 2.781 1.512 2.381
Total Food grains 6.751 7.318 6.336 8.121 5.415 6.788
3 Total Oilseeds 0.188 0.664 0.197 0.22 0.223 0.298
4 Commercial
Crops
I) Cotton 0.041 0.0134 0.097 0.035 0.0133 0.0398
II) Sugarcane 7.63 7.105 8.68 14.44 9.941
14. Industries and Employment:
The total number of registered factories and industries is 113 and the
employment provided by these industries and factories is 8985 in 2006.
The total statistics of factories and employment in 2001 is as under.
Table No. 4.33. Factories and Employment
Textiles Chemical Engineering Others Total Employment
Afzalpur --- 1 --- 1 2 3000
Aland 1 --- 1 2 4 400
Chincholi --- --- 1 --- 1 50
Chittapur --- --- 4 4 8 300
Gulbarga --- 3 9 47 59 3000
Jewargi --- --- 1 --- 1 50
Sedam --- --- --- 3 3 1500
District 1 4 16 57 78 8300
The small scale industries are developed in Automobiles, Electrical and
Electronics and food and intoxicants.

138
Table No. 4.34. Employment in Small Scale Industry
Taluka Automobiles Electrical & Electronics
Food &
Intoxicants
Number Workers Number Workers Number Workers
Afzalpur 10 20 --- --- 4 24
Aland 15 30 0 0 2 8
Chincholi 9 18 0 0 3 12
Chittapur 19 38 0 0 5 20
Gulbarga 36 176 8 40 25 178
Jewargi 2 4 0 0 1 6
Sedam 4 8 0 0 2 16
DISTRICT 95 294 8 40 42 264

139
4.3. References:
1. Karnataka Handbook 2010.
2. Gulbarga District Web site: http://gulbarga.nic.in
3. Gulbarga District at a Glance, 2011-12.
4. Human Development Report, 2005.
5. Maps accessed from http://www.mapsofindia.com