Embed Size (px)
Citation preview
CHAPTER IV
ADSORPTION ON C-TiO2
AND PHOTOCATALYSIS
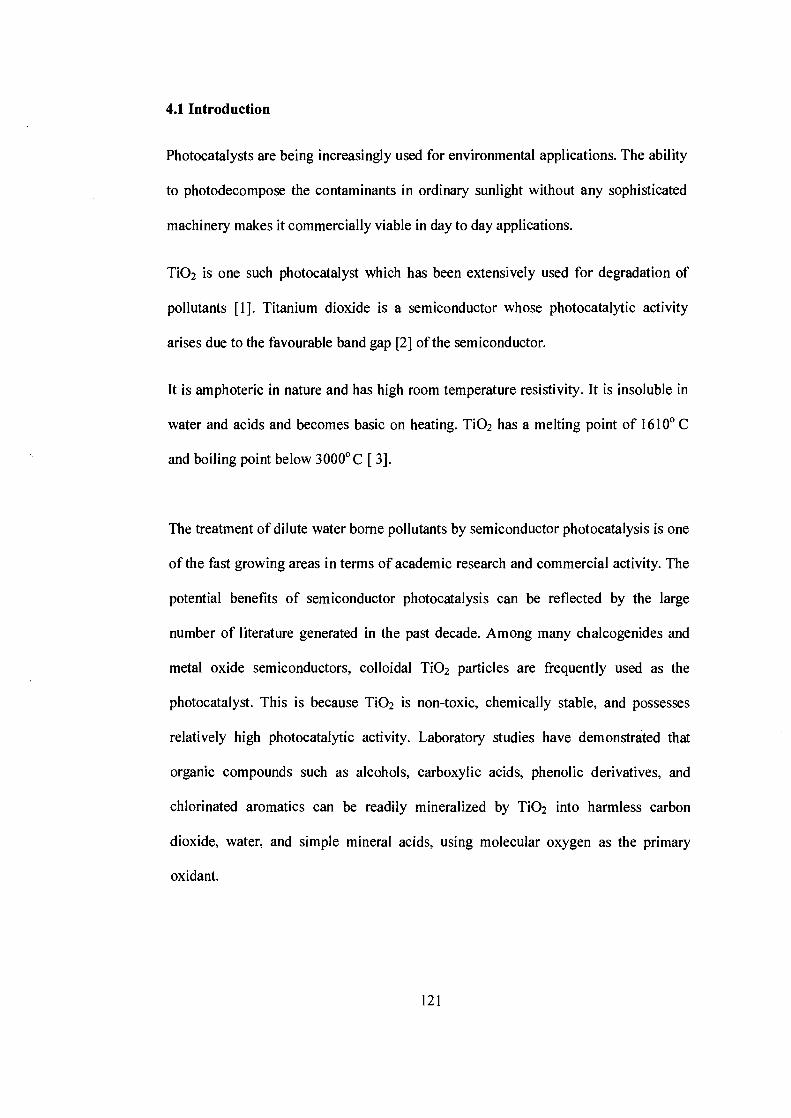
4.1 Introduction
Photocatalysts are being increasingly used for environmental applications. The ability
to photodecompose the contaminants in ordinary sunlight without any sophisticated
machinery makes it commercially viable in day to day applications.
TiO2 is one such photocatalyst which has been extensively used for degradation of
pollutants [1]. Titanium dioxide is a semiconductor whose photocatalytic activity
arises due to the favourable band gap [2] of the semiconductor.
It is amphoteric in nature and has high room temperature resistivity. It is insoluble in
water and acids and becomes basic on heating. TiO2 has a melting point of 1610 ° C
and boiling point below 3000 ° C [ 3].
The treatment of dilute water borne pollutants by semiconductor photocatalysis is one
of the fast growing areas in terms of academic research and commercial activity. The
potential benefits of semiconductor photocatalysis can be reflected by the large
number of literature generated in the past decade. Among many chalcogenides and
metal oxide semiconductors, colloidal TiO2 particles are frequently used as the
photocatalyst. This is because TiO2 is non-toxic, chemically stable, and possesses
relatively high photocatalytic activity. Laboratory studies have demonstrated that
organic compounds such as alcohols, carboxylic acids, phenolic derivatives, and
chlorinated aromatics can be readily mineralized by TiO2 into harmless carbon
dioxide, water, and simple mineral acids, using molecular oxygen as the primary
oxidant.
121

4.2 Phases of TiO2
TiO2 exists in three polymorphic forms —Rutile, Anatase and Brookite — built from
(Ti06) octahedra whose chains are differently assembled [4-5].
Rhombohedral Brookite is rather unstable and is rarely encountered in chemical
applications [6]. It has a rather complex structure with both edge and corner sharing.
Anatase on the other hand is most widely investigated due to its high surface area and
other favourable properties. Here the cation, Ti 4+ is surrounded by an octahedron of
oxygen anions. There is an edge — shared bonding amongst the [Ti06] octahedra and 4
edges are shared by the octahedron. In rutile, likewise, the cation is surrounded by the
octahedron of anions. The octahedron in rutile is not regular and shows slight
orthorhombic distortion; while the octahedron in anatase is significantly distorted [7].
In rutile there is edge sharing along the C — axis to form chains which link to each
other by corner 0 atoms to form three dimensional frameworks.
A
30 10
2.)
Fig 4.1 XRD profiles of Anatase (A) and rutile (R) phase of TiO2
122

Thus the number of edges shared by an octahedron increase from 2 (out of 12) for
brookite, 3 for rutile and 4 for anatase [8]. Fig 4.1 gives XRD profiles of Anatase
(Al) and rutile (R1) phase of TiO2
The characteristic peaks for the rutile and anatase forms of TiO2 and the
corresponding (hkl) values are as reported in Table 4.1 [9].
Rutile Anatase
d I/Io hkl d I/Io Hkl
3.2483 100 110 3.5169 100 101
3.1871 20 111 2.3785 21 004
1.6874 69 211 1.8925 33 200
Table 4.1 Characteristic peaks of rutile and anatase TiO2
123

4.3 Mechanism of photodegradation
When photocatalyst titanium dioxide (TiO 2) absorbs Ultraviolet (UV) radiation from
sunlight or illuminated light source (fluorescent lamps), it will produce pairs of
electrons and holes. The electron of the valence band of titanium dioxide becomes
excited when illuminated by light. The excess energy of this excited electron
promoted the electron to the conduction band of titanium dioxide therefore creating
the negative-electron (e -) and positive-hole (h+) pair. This stage is referred as the
semiconductor's 'photo-excitation' state. The energy difference between the valence
band and the conduction band is known as the 'Band Gap'. Wavelength of the light
necessary for photo-excitation is 388 nm [10].
1240 x (Planck constant, h) / (band gap energy, 3.2 eV) = 388 nm [10]
Fig 4.2 Mechanism of photocatalytic degradation of a dye molecule
124
Under illumination, the TiO2 photocatalyst absorbs photons with energy equal or
higher than its band gap energy (385 nm). This will delocalize a valence electron and
excite it to the conduction band of the semiconductor. These photoexcited charge
carriers can initiate the degradation of the adsorbed chemical species by one or more
forms of electron transfer reactions. Alternatively, they can recombine radiatively or
non-radiatively and dissipating the input energy as heat.
As in classical heterogeneous catalysis, the size of TiO2 particles usually defines the
surface area in a system available for adsorption and decomposition of the organic
pollutants. In many occasion, nanosized TiO2 particles are considered desirable.
The TiO2 mediated oxidation of coloured pollutants such as dyes may occur by the
process known as photosensitization. In this process a coloured compound adsorbed
on to the Ti02, absorbs radiation in the visible range, becomes photochemically
excited, and transfers an electron to the semiconductor particle which, in turn, reduces
molecular 02 to form a superoxide anion radical. The radical generated from the dye
may then undergo degradation reactions possibly with other dye molecules, with
super oxide anion, or other active oxygen species that might be generated.
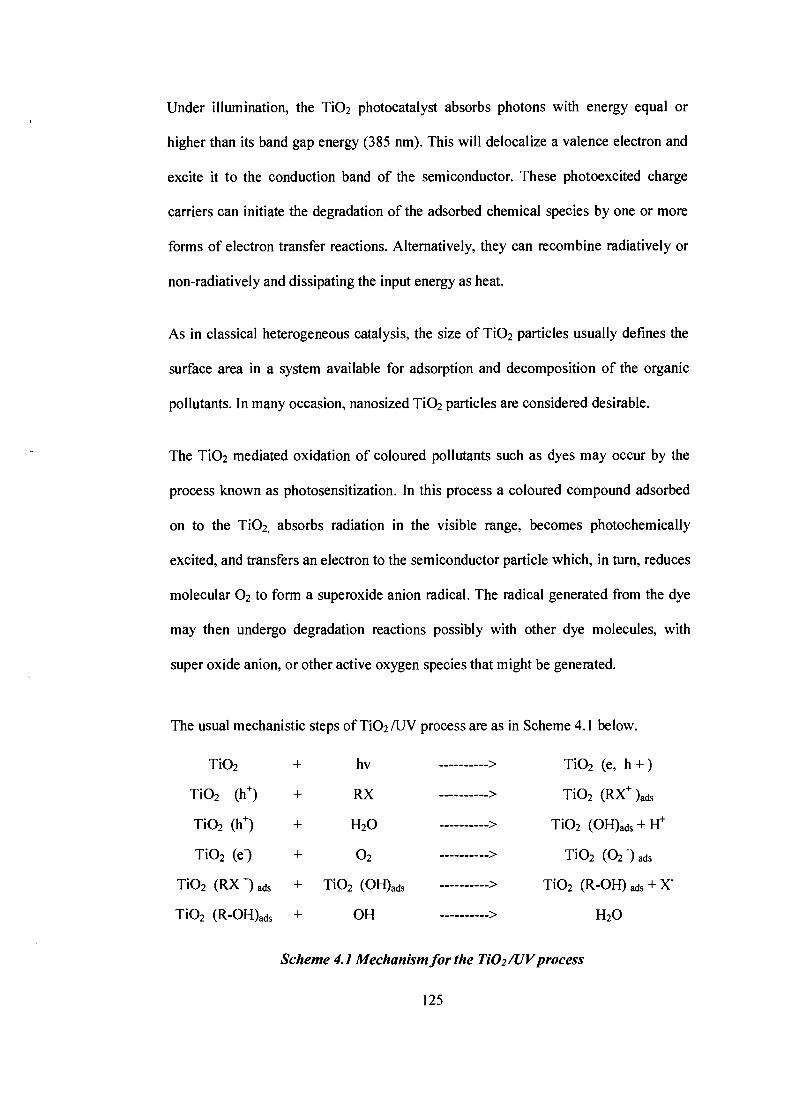
The usual mechanistic steps of TiO2 /UV process are as in Scheme 4.1 below.
TiO2
TiO2 (h+)
TiO2 (h+)
TiO2 (e)
TiO2 (RX1 +, ads
TiO2 (R-OH)ads
+
+
+
+
+
+
hv
RX
H2O
02
TiO2 (OH)ads
OH
>
>
>
>
>
>
TiO2 (e, h + )
TiO2 (RX+ 1
TiO2 (OH)ads + F1+
TiO2 ( 0 2 s)ads iads
TiO2 (R-OH)ads
- -
+ x
- H2O
Scheme 4.1 Mechanism for the Ti02/UV process
125

4.4 Synthesis of pure and suggested TiO2
Anatase is known to be metastable with respect to rutile under all conditions of
temperature and ambient pressure [11-13]. Factors like temperature, pH, type of
solvent, route of synthesis, presence of certain ions in solution are known to influence
the phase composition [14].
In most synthesis routes, employment of lower synthesis temperatures (< 500 °C)
generally yields anatase phase whereas higher temperatures yield predominantly rutile
phase [15-21]. However the synthesis of rutile phase around room temperature has
also been reported [23].
TiO2 nano particles have been synthesized by several methods. Some of them being
thermal oxidation of Ti, plasma spraying„ anodization and chemical vapour
deposition [7]. But all these techniques require special apparatus, which is a major
disadvantage. Highly active nanosize TiO2 is also prepared by sol-gel route, either
using Ti alkoxide or chlorides as the source of Ti [8]. It can also be obtained by the
hydrothermal treatment of the alkoxide gel [11]. Moreover high cost of alkoxide limit
commercialization of this process
S. Yang et al. extended the growth unit model of anion co-ordination polyhedron to
phase formation in liquid reaction systems. As per that, there exists a competition
among the rutile and anatase growth units in a liquid reaction system. Owing to the
low formation energy, intense structure and short bond length of Ti-0 in rutile, its
growth unit is more stable and appears more at lower temperature. So rutile TiO2
could also be obtained at lower temperatures. Phase formation is also influenced by
the presence of certain anions. It has been reported that presence of sulphate anions
126
gives anatase phase while the presence of perchlorate anions in the thermolysis of a
very acidic solution of TiC1 4 leads to only rutile phase [23-24].
It is well known that there are two routes in sol - gel synthesis depending on the
chemical nature of the precursors [25].
i. Aqueous route: It is based on inorganic salts dissolved in water.
ii. Metal — organic route : Alkoxides dissolved in organic solvents.
127
4.5 TiO2 on Supports
To enhance the photocatalytic activity of Ti0 2, various materials have been used as
supports such as Al203 and Si02 [27], cellulose and activated carbons [28].The
purpose is to concentrate the organic compounds around the loaded TiO2 catalyst.
It has been observed that carbon supports for TiO2 gave better photocatalytic activity
[29]. There is a synergy created between the acid and basic sites of TiO 2 and the
surface area and porosity provided by the carbon [30]. The sol — gel synthesis of
inorganic and carbonaceous supports or catalysts, is a frequently used method to
enhance pore volumes where many reactions in the gas phase is carried out [31-38].
In the case of inorganic solids, the method involves the hydrolysis and condensation
of inorganic alkoxides. One of the most commonly used techniques to prepare
carbonaceous materials is the aqueous poly condensation of resorcinol with
formaldehyde, producing organic polymers. When they are pyrolysed in an inert
atmosphere, carbon aerogels or xerogels are obtained [35-37].
Ti02/C composite xerogels and aerogels were obtained by polymerization of mixture
of resorcinol, formaldehyde and tetrabutyl orthotitanate. Samples so obtained were
dried with supercritical CO2 to obtain aerogels or at 110 °C in an oven to obtain
xerogel. The aerogel was prepared with two different percentages of TiO2 contents of
30 and 49%.The aerogel as well as the xerogel were subsequently carbonized in an
inert atmosphere of 500 to 900 °C [39].
Composites of Carbon/TiO2 microspheres have been prepared by carbonization of
cellulose/TiO2. Cellulose/TiO2 microspheres were in turn made by one step phase
128
separation method using cellulose xanthate aqueous solution and polyacrylate
aqueous solution. The distribution of TiO2 was adjusted by addition of polyethylene
glycol as diluents [40]
C/TiO2 microsphere composites have been used for removal of acetaldehyde the
efficiency of which was much higher than that of cellulose/TiO2 composites [41].
C/TiO2 have also been used as catalyst in the decomposition reaction of isopropanol.
[39].
The present investigation describes a simple method to prepare carbon supported TiO2
for photocatalytic degradation of dyes.
129
4.6 EXPERIMENTAL
4.6.1 Synthesis of TiO2 /C
TiO2 was supported on carbon. Two methods were employed, namely, mechanical
mixing and insitu preparation.
General Procedure
1. Activated carbon C 2
Activated carbon prepared from coconut shell was obtained from Indo German
Company Limited (IGCL), Alwaye , Kerala
Chemicals: TiC13, HNO3, Urea, Oxalic acid, of AR grade chemicals of Loba Chemie
(India) make, were used for synthesis purpose.
2. Synthesis of rutile TiO2
The rutile TiO2 was synthesized by a method reported in [26].
Calculated quantity of TiC13 was taken in an evaporating dish, followed by dropwise
addition of 0.5 M HNO 3, till the colour changed from violet to colourless. This was
followed by addition of urea, such that the TiC13: Urea molar ratio was 1:2. It was
stirred on a magnetic stirrer for 15 minutes.The resultant mixture was then evaporated
to dryness on a steam bath. The dry residue was transferred to a glass column and
heated in a horizontal muffle furnace at 400 °C, with continuous flow of nitrogen for 3
hours. The product was then cooled to ambient temperature and then homogenized to
obtain the final samples.
130

3. Carbon + TiO2
Mechanical mixing: C2 and TiO2 as mentioned above were mixed together
mechanically
4. In-situ preparation of 10% TiO2 R2/C2
Calculated quantity of TiC1 3 was taken in an evaporating dish, followed by the drop —
wise addition of 0.5 M 1-1NO3, till the colour changed from violet to colourless. This
was followed by the addition of urea, such that the TiCl3: Urea molar ratio was 1:2
and stirred for 15 minutes.
In a separate container, calculated amount of C2 was taken and 2 propanol was added
along with water for wetting. The contents from the evaporating dish were added to
the beaker and stirred with a magnetic stirrer for 15 minutes.
The resultant mixture was then evaporated to dryness on a steam bath. The dry
residue was transferred to a glass column and heated in a horizontal muffle furnace at
400°C, with continuous flow of nitrogen for 3hrs.The product was cooled to ambient
temperature and then homogenized to obtain the final samples.
5. In-situ preparation of 30% Ti02 R2/C2
Sample was prepared by the above insitu method, by taking calculated amount of
chemicals to get 30% TiO 2 R2/C2 .
6. In-situ preparation of 10% TiO2
TiC13, oxalic acid, urea were taken in the ratio 1:2:2 and prepared by the same insitu
method, using calculated amounts to get 10% anatase TiO2
131

7. Methylene blue solution of various concentrations were prepared. 0.200 g/L,
0 .025 g/L, and 0.012 g/L.
4.6.2 Photocatalytic Degradation of Methylene Blue
Comparative study of adsorption of dyes on the activated carbon
Optical density was found out of blank solutions of 200 mg/L solutions of congo red,
methylene blue and methyl orange. 0.100g of activated carbon was placed in the
solution of the three dyes and allowed to equilibrate for an hour at room temperature.
The solution was stirred at regular intervals. After an hour, it was centrifuged and the
clear aliquot was used to determine the optical density.
Comparative study of adsorption of methylene blue by C2 , T102, Ti02+C2 and
Ti02/C2.
10 mg each of the above catalysts were put in separate 250 ml conical flasks
containing 100m1 of 0.025mg/L methylene blue solution. The solution was kept in
sunlight and stirred at regular intervals.
At definite time intervals 10m1 of the solution was centrifuged and the clear
supernatant liquid was used to find the optical density. A graph of optical density v/s
time in minutes was plotted.
Comparative study of adsorption of methylene blue by the other Ti02/C catalysts
A similar procedure for analysis was adopted to make a comparative study of the
effect of percentage loading as well as in the case of a comparative study of anatase
and rutile forms of TiO2 supported on carbons by taking 0.12g/L methylene blue.
132

4.7 Results and Discussion
4.7.1 Comparative study of adsorption of dyes by C2
Activated carbon has the ability to adsorb dyes and thus used extensively in the dye
industry to treat dye effluents in the water. Fig 4.3 gives a comparative optical density
of congo red, methylene blue and methyl orange by activated carbon. It was observed
that the optical density decreased when carbon was added. This could be attributed to
the adsorption of the dye on the carbon, resulting in a lesser concentration in the
solution.
opti
cal
de
nsi
ty
■ Blank
■ Dye+ C
congo red methylene blue methyl orange
Fig 4.3 gives a comparative optical density of congo red, methylene blue and methyl
orange with and without activated carbons. Decrease in optical density gives a
measure of extent of adsorption.
The adsorption of dyes on to the carbon depends upon several factors such as
porosity, pH of solution, surface functional groups, nature of the dye, contact time
between the adsorbate and adsorbent and temperature.
133
C2 has a high surface area and pore volume as indicated in chapter 2. The porosity is
visible in the SEM images.
It is seen that the carbon used here showed significant adsorption of all the three dyes
tested.
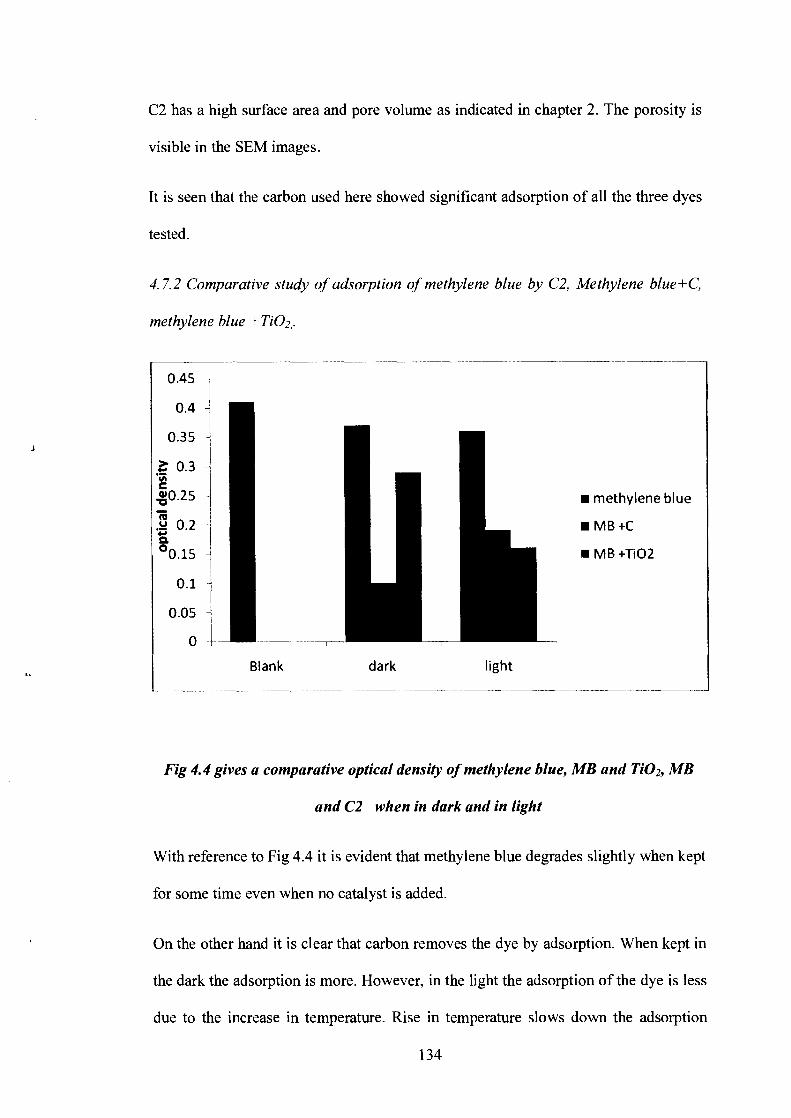
4.7.2 Comparative study of adsorption of methylene blue by C2, Methylene blue+C,
methylene blue +Ti02,.
Fig 4.4 gives a comparative optical density of methylene blue, MB and Ti02, MB
and C2 when in dark and in light
With reference to Fig 4.4 it is evident that methylene blue degrades slightly when kept
for some time even when no catalyst is added.
On the other hand it is clear that carbon removes the dye by adsorption. When kept in
the dark the adsorption is more. However, in the light the adsorption of the dye is less
due to the increase in temperature. Rise in temperature slows down the adsorption
134
0.4
0.35
0.3
0.25
0.2
0.15
0.1
0.05
Gi
To .47+ CL
0
—M—TiO2 IC
--*— TiO2 +C
—C
50 100 150 200
Time in min
0
0
process. Though C2 showed better adsorption in the dark, its efficiency decreases
when exposed to sunlight.
TiO2 removes the dye by photodegradation. The amount of dye that remains in the
solution is much less as can be seen by the optical density measurements as compared
to the measurements of the solution with carbon. Though, overall, the removal of
methylene blue due to adsorption by carbon in the dark, is much better than photo
degradation by Ti02.
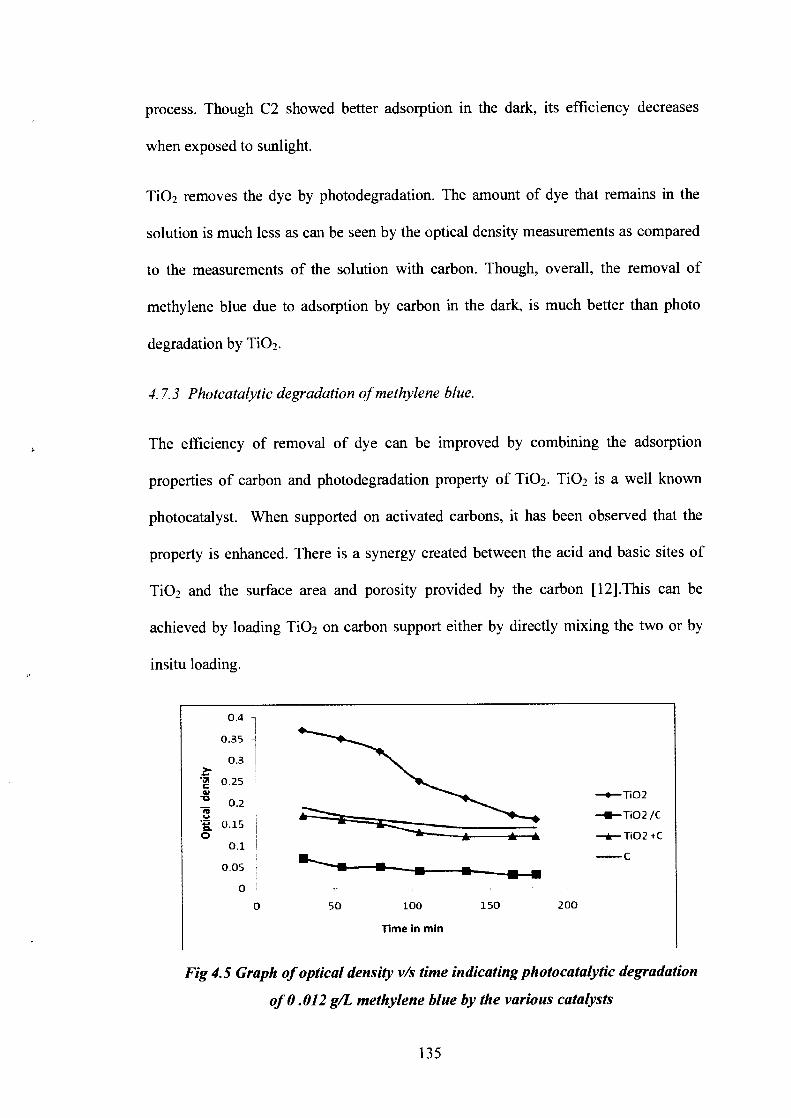
4.7.3 Photcatalytic degradation of methylene blue.
The efficiency of removal of dye can be improved by combining the adsorption
properties of carbon and photodegradation property of Ti02. TiO2 is a well known
photocatalyst. When supported on activated carbons, it has been observed that the
property is enhanced. There is a synergy created between the acid and basic sites of
TiO2 and the surface area and porosity provided by the carbon [12].This can be
achieved by loading TiO2 on carbon support either by directly mixing the two or by
insitu loading.
Fig 4.5 Graph of optical density v/s time indicating photocatalytic degradation
of 0.012 g/L methylene blue by the various catalysts
135

150 50 Ti 100 Time in min
0.16 -
0.14
0.12
7.01 0.1
-a _ 0.08 els
it 0.06 0
0.04
0.02
0
0
--0— 10%Ti02(A)/C
—M-10%Ti02(R)/C
As indicated by Fig 5.3It was found that the insitu preparation of C2/TiO2 showed
significantly better photocatalytic activity, followed by TiO2 + C2.
This could be the result of more dispersive loading of TiO 2 in the pores of carbon
during insitu preparation as compared to mechanical mixing. The large surface area
provides for more interaction of the dye with the catalyst.
4.7.4 Comparative study of anatase and rutile phase on the degradation of methylene
blue
Fig 4.6 Graph of optical density v/s time indicating photocatalytic degradation of
0.012g/L methylene blue by 10% TiO2A2/C2, 10% TiO2R2/C2.
The X-ray powder diffraction patterns (XRD) have been recorded on a Shimadzu
LabX -700 diffractometer, using Ni filtered CuKa radiation (-15406 A °) by step
scanning with a scan rate of 2 ° 20/min. The crystallite size was determined by
136
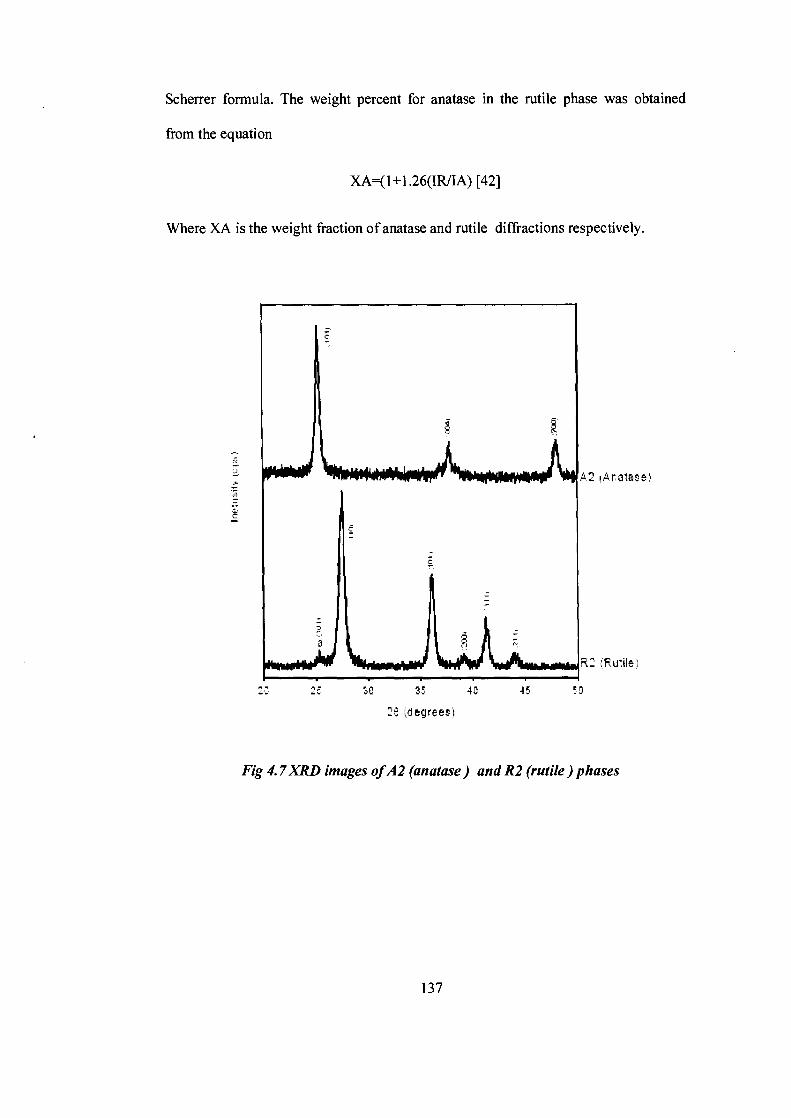
Scherrer formula. The weight percent for anatase in the rutile phase was obtained
from the equation
XA—(1+1.26(IR/IA) [42]
Where XA is the weight fraction of anatase and rutile diffractions respectively.
25 3C 3! 40
45
2e 'degrees
Fig 4.7 XRD images of A2 (anatase) and R2 (rutile) phases
137
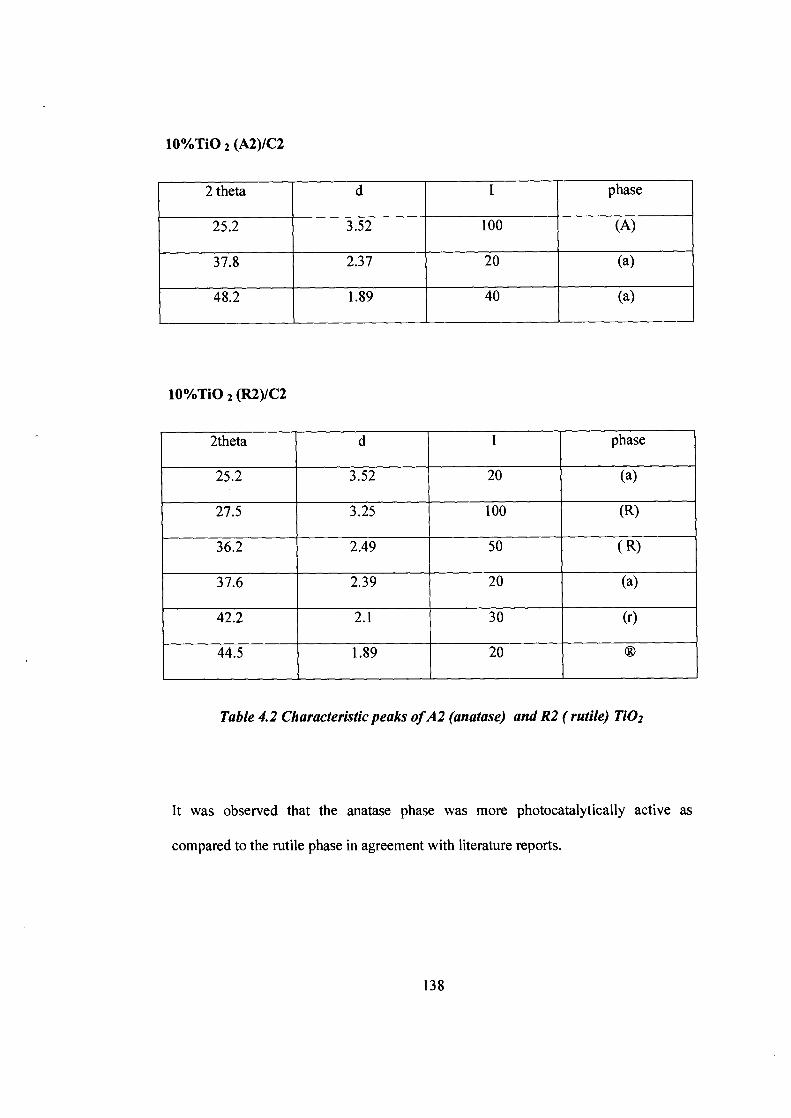
10%TiO 2 (A2)/C2
2 theta d I phase
25.2 3.52 100 (A)
37.8 2.37 20 (a)
48.2 1.89 40 (a)
10%Tio 2 (R2)/C2
2theta d I phase
25.2 3.52 20 (a)
27.5 3.25 100 (R)
36.2 2.49 50 ( R)
37.6 2.39 20 (a)
42.2 2.1 30 (r)
44.5 1.89 20
Table 4.2 Characteristic peaks of A2 (anatase) and R2 ( rutile) TiO2
It was observed that the anatase phase was more photocatalytically active as
compared to the rutile phase in agreement with literature reports.
138

4. 7. 5 Comparative study of percentage loading of TiO 2 on Carbon
1.6
1.4
1.2
1
0.8
0.6
0.4
0.2
0
":114tit:
opti
cal
den
sity
--0--10%Ti02/C
—11-30%Ti02/C
0 50 100 150 200
time in min
Fig 4.8 Graph of optical density v/s time indicating photocatalytic degradation of
methylene blue by , 10% TiO2R2/C2 and 30% TiO2R2/C2.
It was observed that 10% loading of TiO2 showed better results as compared to 30%.
This could be as a result of the blockage of pores in carbon by excess % of TiO2 The
pores are normally the conduits for passage of dye inside the carbon. Hence the
internal surface where TiO 2 is present may not be available.
4.7.6 Comparative study of Carbon and Silicon dioxide as supports for TiO2
Si02 is itself a catalyst and is also known to be a good support. Ti02/Si02 catalyst
have been studied reactions for various heterogeneous catalytic reactions such as
decomposition of NO 2, Friedel Crafts alkylation etc.
A comparative study of TiO 2/SiO2 and Ti02/C was done to study the photodegradation
of methylene blue.
139
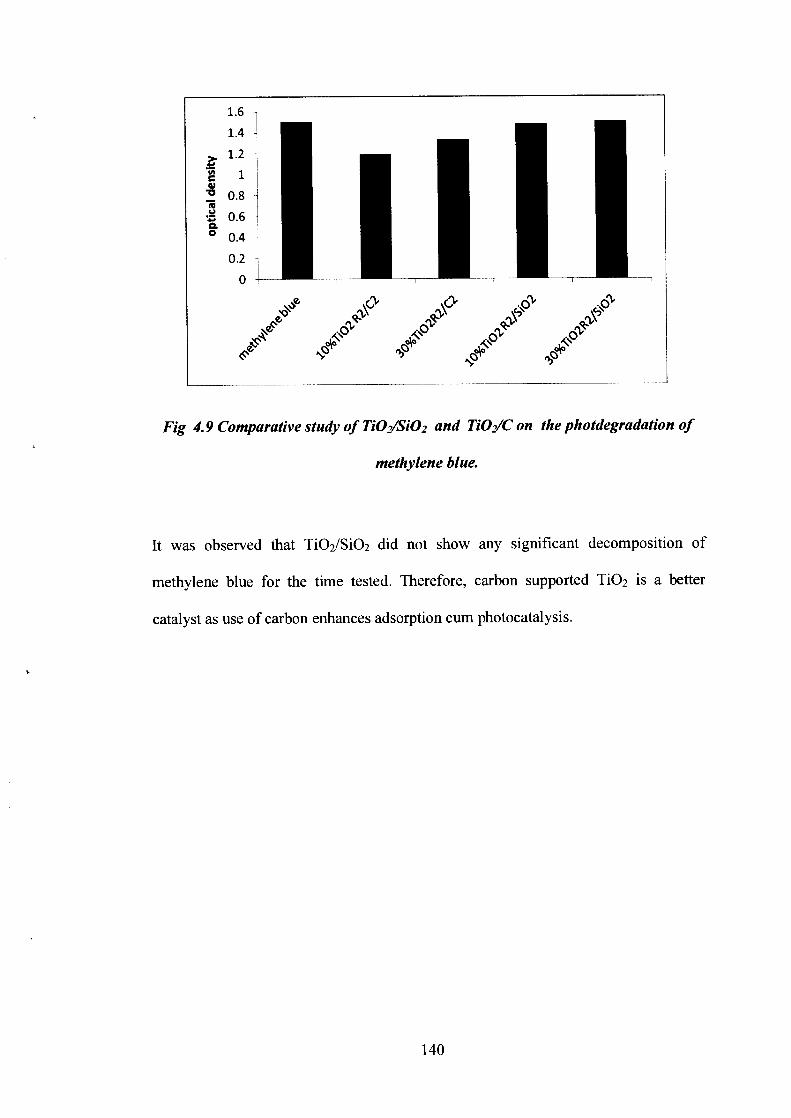
Fig 4.9 Comparative study of TiO2/SiO2 and Ti02/C on the photdegradation of
methylene blue.
It was observed that TiO 2/SiO2 did not show any significant decomposition of
methylene blue for the time tested. Therefore, carbon supported TiO2 is a better
catalyst as use of carbon enhances adsorption cum photocatalysis.
140

4.8 CONCLUSIONS
• TiO2 /C was used to test photocatalytic degradation of methylene blue dye. It
was found that the insitu preparation of TiO2 /C showed better photocatalytic
activity as compared to mechanically mixed sample Ti0 2 +C .
• C2 showed better adsorption of methylene blue in the dark but decreased in
the light. TiO2 /C showed better photodegradation of the dye in the light as
compared to carbon.
• Photocatalytic activity was also tested for the anatase and rutile phase of TiO2
It was observed that the carbon supported anatase phase gave better
photodegradation.
• C2 was a better support for TiO2 as compared to SiO2. Ti02/Si02 did not
show any significant decomposition of methylene blue.
• Effect of percentage loading of TiO2 on carbon was studied. It was observed
that 10% loading showed better photocatalytic activity as compared to 30%
loading.
141

REFERENCES
1. C. H. Ao, S. C. Lee, C. L. Mak, L.Y. Chan , Appl. Catal, B 42 (2003) 119.
2. K.T. Ranjit, B. Viswanathan, J. Photochem. Photobiol, A 180 (1997) 79.
3. www.ktf-split.hr/periodni/en/ti.htmlbk.
4. V.E. Henrich, P. A. Cox, 'The Surface Science of Metal Oxides'. Cambridge
Univ. Press, Cambridge. U.K, 1994.
5. A. L. Linsebigler, G. Lu, J T. Yates, Chem. Rev, 95 (1995) 735.
6. G. A. Tompsett, G.A. Bowmaker, R.P. Cooney, J. B. Metson, K.A. Rodgers, M.
A. Seakins, J. Raman, Spectosc., 26 (1995) 57.
7. A. Fahmi, C. Minot, Surf. Sci , 304 (1994) 343.
8. K. Shaw, P. Christenson and A. Hamnet, Electrochemica. Acta, 41 (1996) 719.
9. www.fis.unipr.it
10. http://www.gensnano.com/photocatalysis-mechanism.php
11. a) J. YU, X. Zhao, Q. Zhao, Thin Solid films, 379 (2000) 7.
b) J. Yu, X. Zhao, Q. Zhao, Mat. Chem. Phys, 69 (2001) 25.
12. S. Sato, J. Phys. Chem, 87 (1983) 3531.
13. K. T. Ranjit, B. Viswanathan, J. Photochem. Photobiol, A, 180 (1997) 215.
14. C. Wang, J.Y. Ying Chem. Mater, 11 (1999) 3113.
15. B. L. Bischoff, M.A. Anderson, Chem. Mater, 7 (1995) 1772.
16. P. Amal, J. P. R. Corrie, D. Lecierque, P.H.Mutin, A. Vioux, J. Mater. Chem, 6
(1996) 1925.
17. P. Arnal, J. P. R. Corrie, D. Leclerque, P. H. Mutin, A. Vioux, Chem. Mater, 9
(1997) 694.
142

18. E. Santacesaria, M. Tonello, G. Storti, R. C. Pace, S. J.Caira, J. Colloidal
Interface Sci, 111 (1986) 44.
19. G. Marci, V. Aug ugliaro, M. J. Lopez-Muoz, C. Martin, L. Palmisano, V.
Rives, M. Schiavello, R.J.D. Tilley and A.,. Venezia, J. Phys Chem, 105 (2001)
1026.
20. S.D. Park, Y.H. Cho, L.W. Kim and S.Kim, J. Solid State Chem, 146 (1999)
230.
21. A. Kato, Y. Takeshita, .Y. Katatae, Mater. Res. Soc. Symp. Proc, 155 (1989).13
22. N. Negishi, K. Takeuchi, T, Ibusuki, J. Mater. Sci, 33 (1998) 5789.
23. Y. Tanaka, Ceram Soc. Jpn, 106 (1998) 344.
24. E. Stathatos and P. Lianos, Langmuir, 16 (2000) 2398.
25. J. Livage, M. Henry, C. Sanchez, Progr. Solid State Chem, 18 (1998) 259, J.
Livage, Catal. Today, 41 (1998) 3.
26. A. R. Gandhe, J.B Fernandes, Catalysis Communications, 5 (2004) 89-94
27. C. Minero, F. Catozzo, E. Petizetti, Langmuir, 8 (1992) 481.
28. T. Ibusuki, K. Takeuichi, J. Mol Caltal, 88 (1994) 93.
29. T. Koretoh, Kogyozairyou, 45 (1997) 36.
30. M. Steigerwald, L. Bus, Acc. Chem. Res, 23 (1990) 183.
31. R. D. Gonzalez, T. Lopez, R. Gomez, Catal. Today 35 (1997) 293
32. G. M. Pajonk, Catal Today, 35 (1997) 319.
33. M. Schneider, A. Baiker, Catal Today, 35 (1997) 339.
34. R. W. Pekala, J Mater.Sci, 24 (1989) 3221.
35. C. Lin , J. A. Rittter, Carbon, 35 (1997) 1271.
36. F. J. Maldonado-Hodar, M. A. Ferro Garcia, J. Rivera-Utrilla, C. Moreno-
Castilla, Carbon 37 (1999) 1199.
143
37. G. W. Scherer, J. Am. Ceram. Soc, 73 (1990) 3.
38. M. J. Van Bammel, A. B. de Haan, J. Mater. Sc, 29 (1994) 943.
39. F. J. Maldonado-Hodar, C. Moreno-Castilla, J. Rivera-Utrilla, Applied
Catalysis, 203 (2000) 151-159
40. S. Nagaoka, Y. Harmasaki, S. Ishara, M. Nagata, K. Lio, C. Nagaarva, H. Ihara
J Mol Catal A ; Chemical, 177 (2002) 255-263.
41. H. Idriss, K. S. Kim, M. A. Barteau, Surf. Sci, 262 (1992) 113.
42. R. A. Spurr, H. Myers, Anal Chem, 29 (1957) 760.
144