Embed Size (px)
Citation preview
CHAPTER FIVE
DISCUSSION
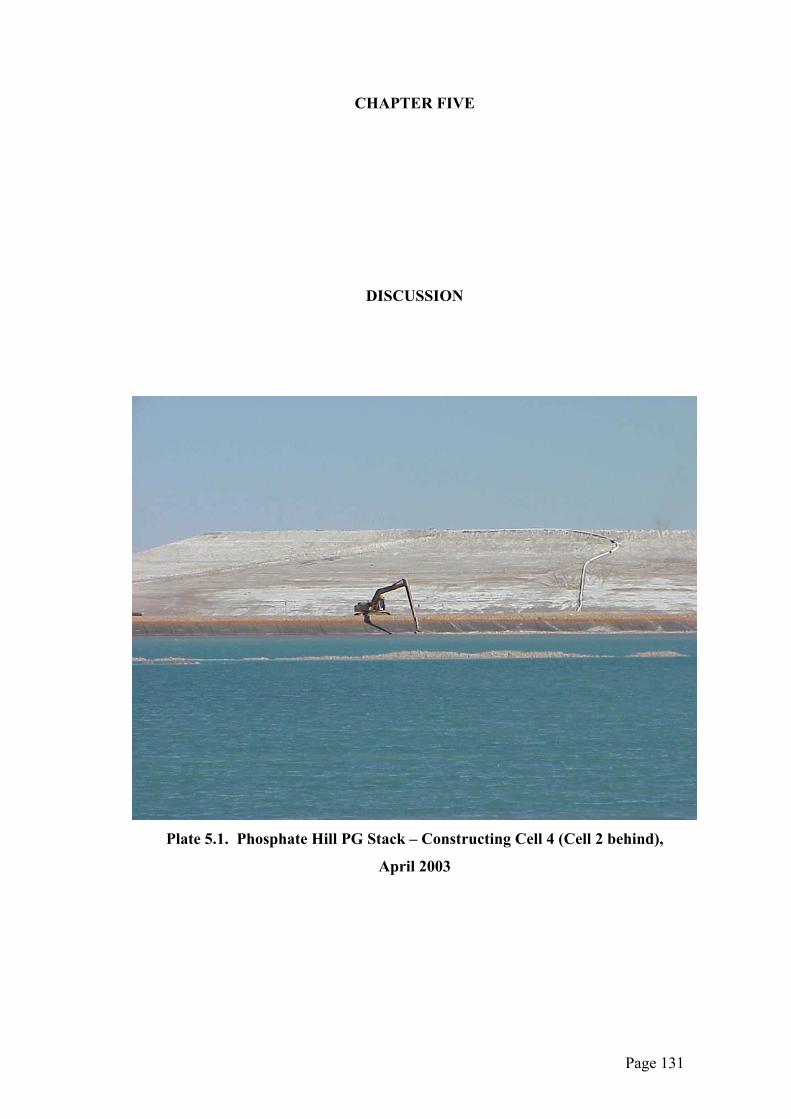
Plate 5.1. Phosphate Hill PG Stack – Constructing Cell 4 (Cell 2 behind),
April 2003
Page 131
5. DISCUSSION
5.1 Introduction
The WMC Fertilizers’ site at Phosphate Hill combines the locally mined phosphorite
ore with sulphuric acid produced in Mt Isa and Townsville to produce phosphoric acid
and phosphogypsum. The acid is then combined with ammonia (derived from natural
gas) to produce two kinds of ammonium phosphate fertilizer for local and international
markets. The by-product PG, the annual volume produced of which is approximately
twice that of the fertilizer itself, is stored on site in large stacks. Although there have
been many studies over the years looking at the parent phosphorite, and the fertilizer
product is very well quantified by the Company, little analytical work has been done on
the PG, its potential for other uses, or the possibility of alternative storage strategies.
There has also been no serious work undertaken to identify possible contaminants
derived from the stack that may become pollutants in the local groundwater system.
The primary focus of this study, defined by WMCF management, has been to analyse
the by-product (both liquid and solid components) and its leachate to create a base-line
for future study. The secondary aim has been to outline potential benefits and deterrents
to using the PG as mine backfill material.
The Phosphate Hill PG is initially produced in the form of metastable hemihydrate (HH
– CaSO4.0.5H2O). This is a direct result of the acidulation process utilised in the
phosphoric acid plant, where the apatite in the parent phosphorite ore is reacted with,
firstly, phosphoric and, secondly, sulphuric acids at temperatures of 98-100ºC to
produce phosphoric acid and gypsum. The phosphoric acid liquid is filtered from the
HH cake and the latter is transported via overland conveyor to the re-slurry tank where
it is converted into stable dihydrate (DH – CaSO4.2H2O) by the addition of recirculated
acid process water, which is then piped to the gypsum stack.
Both types of PG are contenders for in-pit disposal on site, the HH either conveyed or
trucked to the disposal site or the DH piped as a slurry or as rehandled dry material
sourced from existing stacks. Both types are known to contain relict acids and fluoride
compounds from the acidulation process and, for the DH, from the use of recycled
process water in the re-slurry tank. These contaminants include hydrofluoric acid (HF),
Page 132
fluorosilicic acid (H2SiF6) and the phosphoric acid (H3PO4) itself as well as silica
tetrafluoride (SiF4) and alkali fluorosilicate (Na2/K2/NaK SiF6), which forms scale in
the plant pipeworks. Additionally, small amounts of radionuclides are known to
concentrate in various areas throughout the process, all derived from the parent
phosphorite.
Although Ardaman 2000 reported on PG characterisation at Phosphate Hill, their report
was done on a very small number of samples during one sampling episode and focussed
primarily on the engineering aspects of the material as they apply to stack construction.
In addition, the samples were taken early in 2000, just after the plant had been
commissioned and during a period of instability within the operation when the many
variables within the manufacturing process were yet to be brought fully under control.
With a need for more information identified by the Company before further other
disposal, reuse and closure strategies could be fully examined this study was instigated
in early 2000.
The research was designed to physically and chemically characterise the PG in as much
detail as possible and then to study potential contaminants arising from using the PG as
mine backfill in the open-cut pits. To this end, sampling of hemihydrate and dihydrate
PG, slurry and leachate liquids was undertaken over an extended period in an attempt to
cover major variables such as seasonal change, different ore sources and blends, and
changes to the plant operating conditions around a shut-down. A discussion of the
results is found below.
5.2 Chemical and Physical Characteristics of PG
Table 5.1 below shows a comparison between some characteristics of naturally-
occurring gypsum, global average PG and PG produced at Phosphate Hill.
Page 133
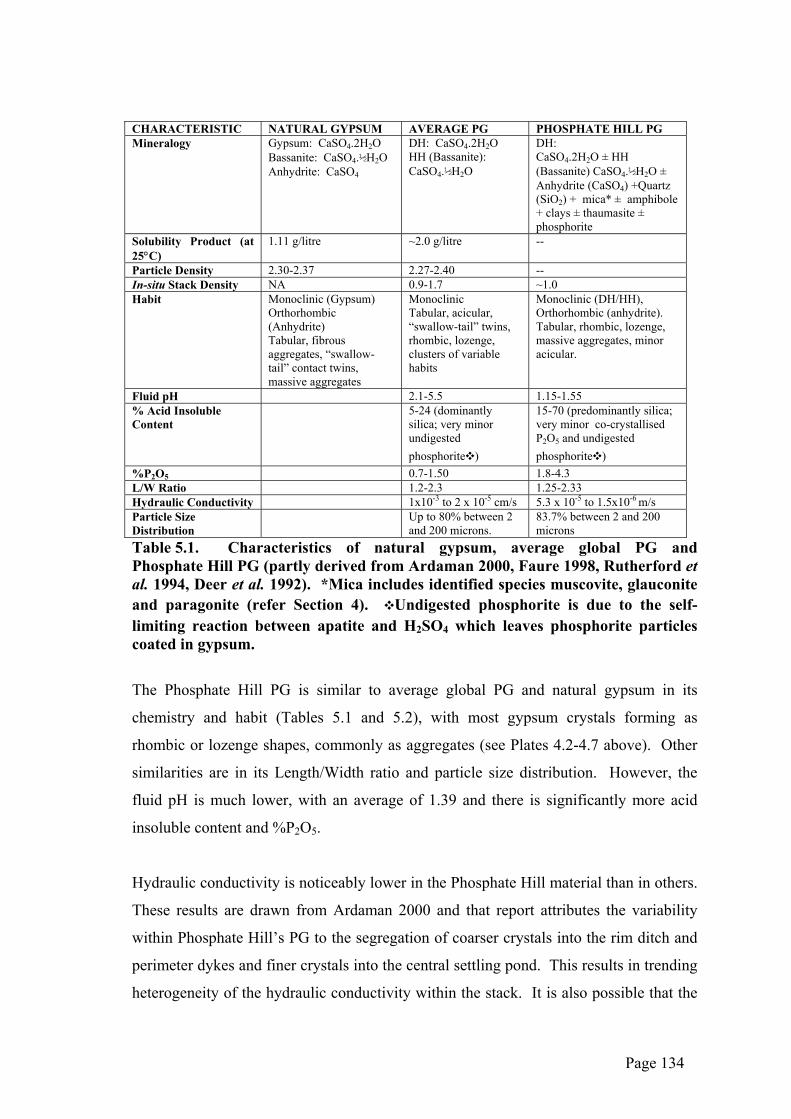
CHARACTERISTIC NATURAL GYPSUM AVERAGE PG PHOSPHATE HILL PG Mineralogy Gypsum: CaSO4.2H2O
Bassanite: CaSO4.½H2O Anhydrite: CaSO4
DH: CaSO4.2H2O HH (Bassanite): CaSO4.½H2O
DH: CaSO4.2H2O ± HH (Bassanite) CaSO4.½H2O ± Anhydrite (CaSO4) +Quartz (SiO2) + mica* ± amphibole + clays ± thaumasite ± phosphorite
Solubility Product (at 25°C)
1.11 g/litre ~2.0 g/litre --
Particle Density 2.30-2.37 2.27-2.40 -- In-situ Stack Density NA 0.9-1.7 ~1.0 Habit Monoclinic (Gypsum)
Orthorhombic (Anhydrite) Tabular, fibrous aggregates, “swallow-tail” contact twins, massive aggregates
Monoclinic Tabular, acicular, “swallow-tail” twins, rhombic, lozenge, clusters of variable habits
Monoclinic (DH/HH), Orthorhombic (anhydrite). Tabular, rhombic, lozenge, massive aggregates, minor acicular.
Fluid pH 2.1-5.5 1.15-1.55 % Acid Insoluble Content
5-24 (dominantly silica; very minor undigested phosphorite❖)
15-70 (predominantly silica; very minor co-crystallised P2O5 and undigested phosphorite❖)
%P2O5 0.7-1.50 1.8-4.3 L/W Ratio 1.2-2.3 1.25-2.33 Hydraulic Conductivity 1x10⁻³ to 2 x 10⁻⁵ cm/s 5.3 x 10⁻⁵ to 1.5x10⁻⁶ m/s Particle Size Distribution
Up to 80% between 2 and 200 microns.
83.7% between 2 and 200 microns
Table 5.1. Characteristics of natural gypsum, average global PG and Phosphate Hill PG (partly derived from Ardaman 2000, Faure 1998, Rutherford et al. 1994, Deer et al. 1992). *Mica includes identified species muscovite, glauconite and paragonite (refer Section 4). ❖Undigested phosphorite is due to the self-limiting reaction between apatite and H2SO4 which leaves phosphorite particles coated in gypsum.
The Phosphate Hill PG is similar to average global PG and natural gypsum in its
chemistry and habit (Tables 5.1 and 5.2), with most gypsum crystals forming as
rhombic or lozenge shapes, commonly as aggregates (see Plates 4.2-4.7 above). Other
similarities are in its Length/Width ratio and particle size distribution. However, the
fluid pH is much lower, with an average of 1.39 and there is significantly more acid
insoluble content and %P2O5.
Hydraulic conductivity is noticeably lower in the Phosphate Hill material than in others.
These results are drawn from Ardaman 2000 and that report attributes the variability
within Phosphate Hill’s PG to the segregation of coarser crystals into the rim ditch and
perimeter dykes and finer crystals into the central settling pond. This results in trending
heterogeneity of the hydraulic conductivity within the stack. It is also possible that the
Page 134
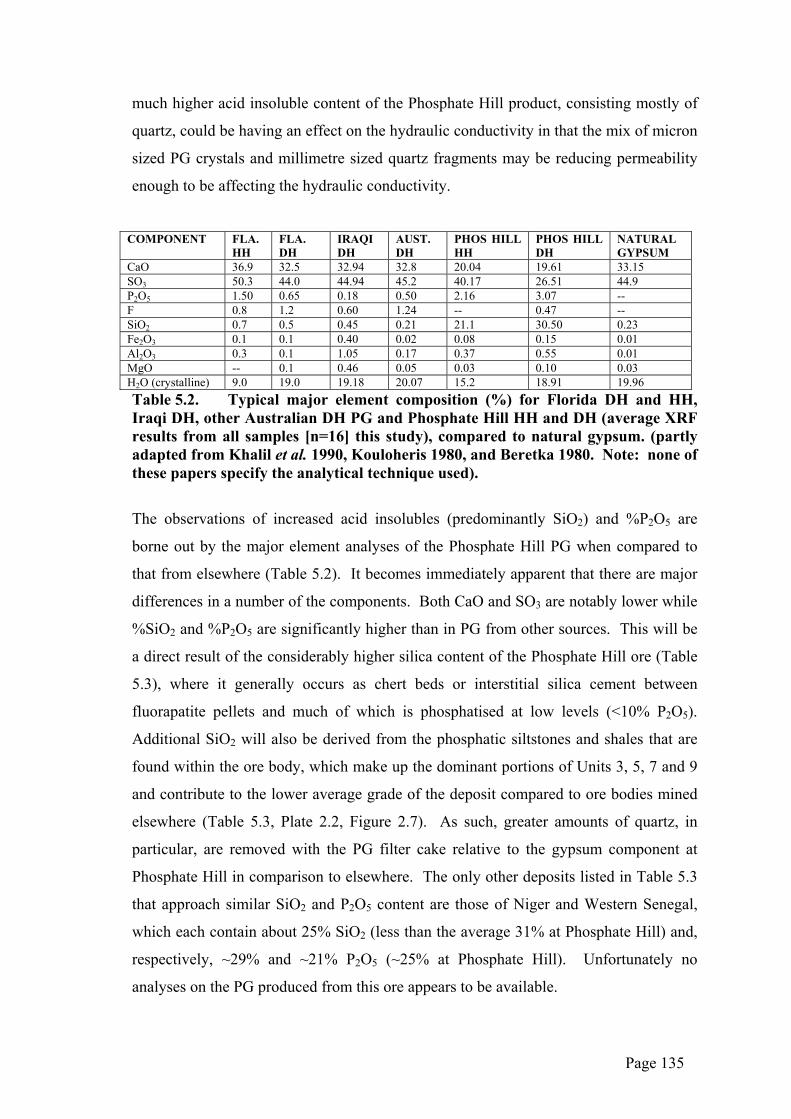
much higher acid insoluble content of the Phosphate Hill product, consisting mostly of
quartz, could be having an effect on the hydraulic conductivity in that the mix of micron
sized PG crystals and millimetre sized quartz fragments may be reducing permeability
enough to be affecting the hydraulic conductivity.
COMPONENT FLA.
HH FLA. DH
IRAQI DH
AUST. DH
PHOS HILL HH
PHOS HILL DH
NATURAL GYPSUM
CaO 36.9 32.5 32.94 32.8 20.04 19.61 33.15 SO3 50.3 44.0 44.94 45.2 40.17 26.51 44.9 P2O5 1.50 0.65 0.18 0.50 2.16 3.07 -- F 0.8 1.2 0.60 1.24 -- 0.47 -- SiO2 0.7 0.5 0.45 0.21 21.1 30.50 0.23 Fe2O3 0.1 0.1 0.40 0.02 0.08 0.15 0.01 Al2O3 0.3 0.1 1.05 0.17 0.37 0.55 0.01 MgO -- 0.1 0.46 0.05 0.03 0.10 0.03 H2O (crystalline) 9.0 19.0 19.18 20.07 15.2 18.91 19.96 Table 5.2. Typical major element composition (%) for Florida DH and HH, Iraqi DH, other Australian DH PG and Phosphate Hill HH and DH (average XRF results from all samples [n=16] this study), compared to natural gypsum. (partly adapted from Khalil et al. 1990, Kouloheris 1980, and Beretka 1980. Note: none of these papers specify the analytical technique used).
The observations of increased acid insolubles (predominantly SiO2) and %P2O5 are
borne out by the major element analyses of the Phosphate Hill PG when compared to
that from elsewhere (Table 5.2). It becomes immediately apparent that there are major
differences in a number of the components. Both CaO and SO3 are notably lower while
%SiO2 and %P2O5 are significantly higher than in PG from other sources. This will be
a direct result of the considerably higher silica content of the Phosphate Hill ore (Table
5.3), where it generally occurs as chert beds or interstitial silica cement between
fluorapatite pellets and much of which is phosphatised at low levels (<10% P2O5).
Additional SiO2 will also be derived from the phosphatic siltstones and shales that are
found within the ore body, which make up the dominant portions of Units 3, 5, 7 and 9
and contribute to the lower average grade of the deposit compared to ore bodies mined
elsewhere (Table 5.3, Plate 2.2, Figure 2.7). As such, greater amounts of quartz, in
particular, are removed with the PG filter cake relative to the gypsum component at
Phosphate Hill in comparison to elsewhere. The only other deposits listed in Table 5.3
that approach similar SiO2 and P2O5 content are those of Niger and Western Senegal,
which each contain about 25% SiO2 (less than the average 31% at Phosphate Hill) and,
respectively, ~29% and ~21% P2O5 (~25% at Phosphate Hill). Unfortunately no
analyses on the PG produced from this ore appears to be available.
Page 135
The majority of the P2O5 identified in the PG is in three forms: co-precipitated Ca-P
minerals, crystalline or pore bound H3PO4 and trace amounts of undigested phosphorite
(Ritchie pers. comm. 2004). Undigested rock content is assessed daily in the HH
filtercake by the WMCF laboratory and commonly occurs at around 0.3% of the total
mass of the filtercake, with a range of between 0.1% and 0.9%. This equates to over
94,000t of unreacted rock being sent to the gypsum stacks every year. Co-crystallised
phosphate minerals in the filtercake are also monitored and range from 0.4% to 0.9%,
with an average of 0.7% or just over 220,000t produced annually. Pore bound P2O5 is
also analysed in the HH and is found at slightly higher levels than the unreacted rock, at
around 0.4% (with a maximum of 2.6%), or around 126,000t annually. Initial reports
by Ardaman 2000 identified levels of acid insolubles, attributed to silica, and P2O5 in
the Phosphate Hill PG but no detailed analyses were reported and no comparisons were
made with PG produced elsewhere.
Page 136
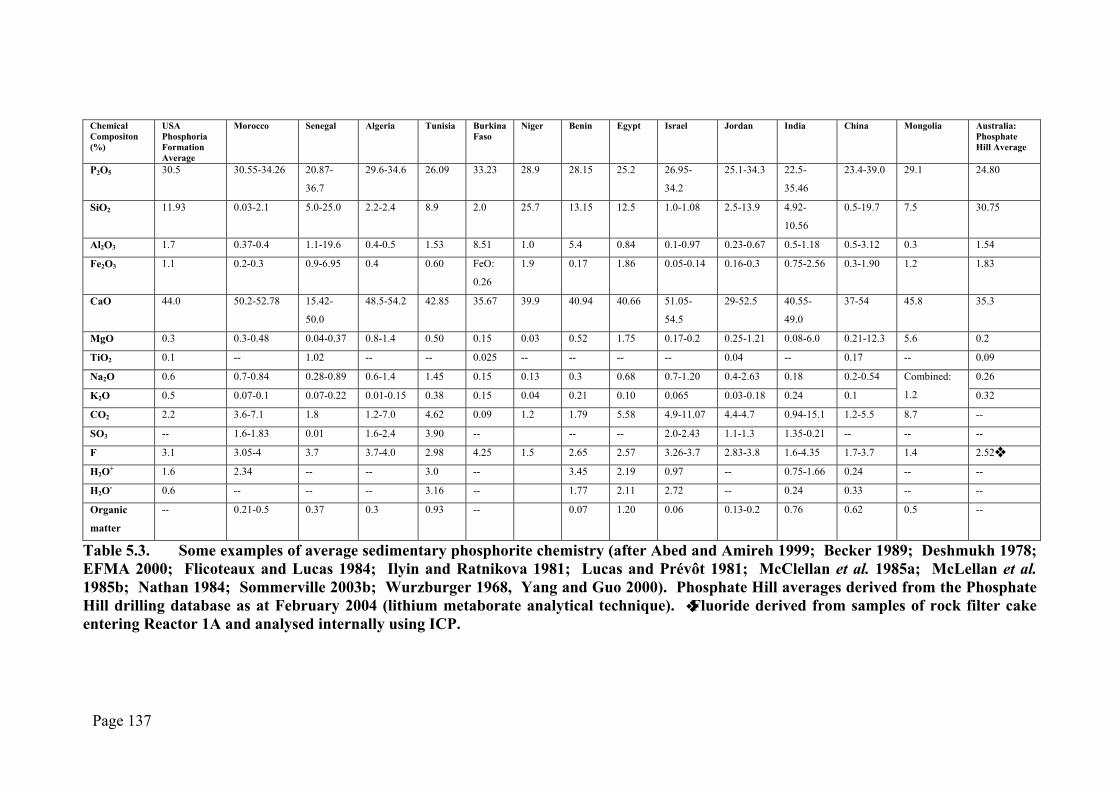
Chemical Compositon (%)
USA Phosphoria Formation Average
Morocco Senegal Algeria Tunisia BurkinaFaso
Niger Benin Egypt Israel Jordan India China Mongolia Australia: Phosphate Hill Average
P2O5 30.5 30.55-34.26 20.87-
36.7
29.6-34.6 26.09 33.23 28.9 28.15 25.2 26.95-
34.2
25.1-34.3 22.5-
35.46
23.4-39.0 29.1 24.80
SiO2 11.93 0.03-2.1 5.0-25.0 2.2-2.4 8.9 2.0 25.7 13.15 12.5 1.0-1.08 2.5-13.9 4.92-
10.56
0.5-19.7 7.5 30.75
Al2O3 1.7 0.37-0.4 1.1-19.6 0.4-0.5 1.53 8.51 1.0 5.4 0.84 0.1-0.97 0.23-0.67 0.5-1.18 0.5-3.12 0.3 1.54
Fe2O3 1.1 0.2-0.3 0.9-6.95 0.4 0.60 FeO: 1.9
0.26
0.17 1.86 0.05-0.14 0.16-0.3 0.75-2.56 0.3-1.90 1.2 1.83
CaO 44.0 50.2-52.78 15.42-
50.0
48.5-54.2 42.85 35.67 39.9 40.94 40.66 51.05-
54.5
29-52.5 40.55-
49.0
37-54 45.8 35.3
MgO 0.3 0.3-0.48 0.04-0.37 0.8-1.4 0.50 0.15 0.03 0.52 1.75 0.17-0.2 0.25-1.21 0.08-6.0 0.21-12.3 5.6 0.2
TiO2 0.1 -- 1.02 -- -- 0.025 -- -- -- -- 0.04 -- 0.17 -- 0.09
Na2O 0.6 0.7-0.84 0.28-0.89 0.6-1.4 1.45 0.15 0.13 0.3 0.68 0.7-1.20 0.4-2.63 0.18 0.2-0.54 0.26
K2O 0.5 0.07-0.1 0.07-0.22 0.01-0.15 0.38 0.15 0.04 0.21 0.10 0.065 0.03-0.18 0.24 0.1
Combined:
1.2 0.32
CO2 2.2 3.6-7.1 1.8 1.2-7.0 4.62 0.09 1.2 1.79 5.58 4.9-11.07 4.4-4.7 0.94-15.1 1.2-5.5 8.7 --
SO3 -- 1.6-1.83 0.01 1.6-2.4 3.90 -- -- -- 2.0-2.43 1.1-1.3 1.35-0.21 -- -- --
F 3.1 3.05-4 3.7 3.7-4.0 2.98 4.25 1.5 2.65 2.57 3.26-3.7 2.83-3.8 1.6-4.35 1.7-3.7 1.4 2.52❖
H2O+ 1.6 2.34 -- -- 3.0 -- 3.45 2.19 0.97 -- 0.75-1.66 0.24 -- --
H2O- 0.6 -- -- -- 3.16 -- 1.77 2.11 2.72 -- 0.24 0.33 -- --
Organic
matter
-- 0.21-0.5 0.37 0.3 0.93 -- 0.07 1.20 0.06 0.13-0.2 0.76 0.62 0.5 --
Table 5.3. Some examples of average sedimentary phosphorite chemistry (after Abed and Amireh 1999; Becker 1989; Deshmukh 1978; EFMA 2000; Flicoteaux and Lucas 1984; Ilyin and Ratnikova 1981; Lucas and Prévôt 1981; McClellan et al. 1985a; McLellan et al. 1985b; Nathan 1984; Sommerville 2003b; Wurzburger 1968, Yang and Guo 2000). Phosphate Hill averages derived from the Phosphate Hill drilling database as at February 2004 (lithium metaborate analytical technique). ❖ Fluoride derived from samples of rock filter cake entering Reactor 1A and analysed internally using ICP.
Page 137
Clays and other gangue minerals, such as those from the mica and amphibole groups,
have also been identified for the first time in the Phosphate Hill PG. These minerals
have not been specifically mentioned as occurring in relation to PG sourced from
elsewhere.
Minor amounts (<1%) of the following clays have been identified as part of the PG mix:
Smectite (0.5Ca,Na)0.7(Al,Mg,Fe)4[(Si,Al08O20](OH)4.nH2O
(0.5Ca,Na)0.7(Mg,Fe,Al,)6[(Si,Al)8O20](OH)4.nH2O
Zeolites: Clinoptilolite ((Na,K)6[Al6Si30O72].24H2O) and
Heulandite (Ca,Na2,K2)4[Al8Si28O72].24H2O
Palygorskite: Sepiolite (Mg4Si6O15(OH)2.6H2O)
At least some of these are likely to be derived from the shales and siltstones that form
part of the ore body. Cook and Armstrong (1972) identified kaolinite
(Al4[Si4O10](OH)8), illite (K1.5-1.0Al4[Si6.5-7.0Al1.5-1.0O20O20](OH)4), smectite and chlorite
((Mg,Fe2+,Fe3+,Mn,Al)12[(Si,Al)8O20](OH)16) as the dominant clay minerals in the ore
body, with traces of sepiolite, attapulgite (a second species of palygorskite
(Mg,Al)5(Si,Al)8O20(OH)2.8H2O)) and mixed-layer clays also present. Russell and
Trueman (1971) also identified members of the smectite sub-group montmorillonite in
the MCPM. These were believed to be part of the primary mineral assemblage laid
down during the original deposition of the ore body, little changed by alteration (Cook
and Armstrong 1972, Russell and Trueman 1971). More recent studies (Bongers 2003,
Mascini 2001) confirmed these results, stating that the major clay minerals were
kaolinite and smectite with Bongers (2003) suggesting that kaolinite is a primary clay
mineral and that smectite is derived from the weathering of primary apatite through the
sequence of:
apatite Ca4.9399Na0.061(PO4)2.816(CO3)0.137(SO4)0.056F0.994(OH)0.378
crandallite CaAl3(PO4)2(OH)5.H2O
smectite (0.5Ca,Na)0.7(Al,Mg,Fe)4[(Si,Al08O20](OH)4.nH2O or
(0.5Ca,Na)0.7(Mg,Fe,Al,)6[(Si,Al)8O20](OH)4.nH2O
Page 138
under changing pH conditions from alkaline to acid to alkaline and in the presence of
Al, H+ and SiO2.
The literature, and current studies, have not previously identified zeolites in the ore
(Hough 2004, Bongers 2003, Mascini 2001, Cook and Armstrong 1972, Russell and
Trueman 1971). The most likely alternate source for this material was initially thought
to be as relicts from the thickening process in the beneficiation plant. The washed,
crushed ore is mixed with water and thickeners (flocculants) before pumping into the
slurry tanks to await transport to the rock filter beds at the start of the acidulation
process in the phosphoric acid plant. However, closer examination of the constituents
of the flocculants used in the process has revealed that they are all anionic hydrocarbon
derivatives and, as such, cannot be the source of the zeolites (Abbott pers. comm. 2004).
As there is no other input into the crushing and acidulation system that might carry
these minerals, it must be concluded that, unless the XRD interpretation is incorrect, the
ore does, in fact, contain zeolites among its clay minerals, despite this group having
been previously unidentified. The two zeolites identified are the amongst the most
abundant of that group of minerals and are known as authigenic in sedimentary deposits
(Deer et al. 1992) so it is possible that they occur in the ore body.
Paragonite (Na2Al4[Si6Al2O20](OH,F)) was identified as the mica species in one sample
(PG005) with the others (7 samples) remaining unidentified. The latter are possibly
also paragonite or derived from the glauconite
((K,Ca,Na)~1.6(Fe3+,Al,Mg,Fe2+)4.0Si7.3Al0.7O20(OH)4) and “sericite” that have been
previously identified in the ore body (Hough 2003a, Russell and Trueman 1971). The
“sericite” (described by Deer et al. (1992) as either “muscovite or paragonite” or “less
well-characterized specimens which may deviate from … muscovite composition”)
occurs throughout the Inca Shale/MCPM/Lower Siltstone Member sequence in both
fresh and weathered rock and has been identified as predominantly muscovite (Hough
2004 pers. comm., Mascini 2001). Glauconite is most commonly found associated with
the MCPM, usually in the upper regions that have been exposed to greater weathering
(e.g. much of the upper half of Unit 1 is commonly green in colour due to high
glauconite content) but is also a significant part of the Unit 8 marker horizon which
contains brachiopods and glauconite on a thin bed of collophane mudstone (Figure 2.7)
(Hough 2003a). Muscovite has the standard composition of K2Al4[Si6Al2O20](OH,F)4,
Page 139
with many substitutions possible for K and Al (Deer et al. 1992). The substitution of Al
in the muscovite could be one source for the Cr, Ti and V identified in the trace element
composition of the PG (Table 5.4).
The identification of (unspecified) amphibole in the PG (Table 5.1) was an unexpected
development. A randomly selected sample bearing this mineral was subjected to an
independent analysis by the developers of the SIROQUANT program and the results
(Appendix 11) were very similar to those received from the Advanced Analytical
Laboratory at JCU, thus confirming the likely presence of this mineral. Although no
members of this mineral group have previously been identified in the ore, metamorphic
hornblende (magnesiohastingsite to hastingsite (NaCa2(Mg,Fe)4Fe3+[Si6Al2O22](OH)2))
is a component of the local Kalkadoon Granodiorite, a member of the Proterozoic I-type
and A-type granitoid intrusive suite of the Kalkadoon-Leichhardt Belt (Belousova et al.
2001, Wyborn et al. 1988, Wyborn and Page 1983). The partly recrystallised and
metamorphosed Kalkadoon Granodiorite, along with the metamorphosed sediments of
the Plum Mountain Gneiss (1.9Ga) and the Corella Formation (1.7Ga) into which it
intruded and which also contain hornblende ((Na,K)0-1Ca2(Mg,Fe2+,Fe3+,Al)5Si6-7.5Al2-
0.5O22(OH)2) (Rogers 2004 pers. comm.), now form the basement to the Cambrian aged,
transgressive marine basin that contains the ore sequence exposed at Phosphate Hill
(Rogers 1988, Wyborn and Page 1983). Original depositional conditions are believed
to be similar to those that exist in the area today, with low-lying hills of these basement
rocks slowly eroding in a semi-arid environment into a shallow, enclosed embayment
(Russell and Trueman 1971). This terrigenous input is believed to be responsible for
the discrete horizons of shale and siltstone found within the MCPM.
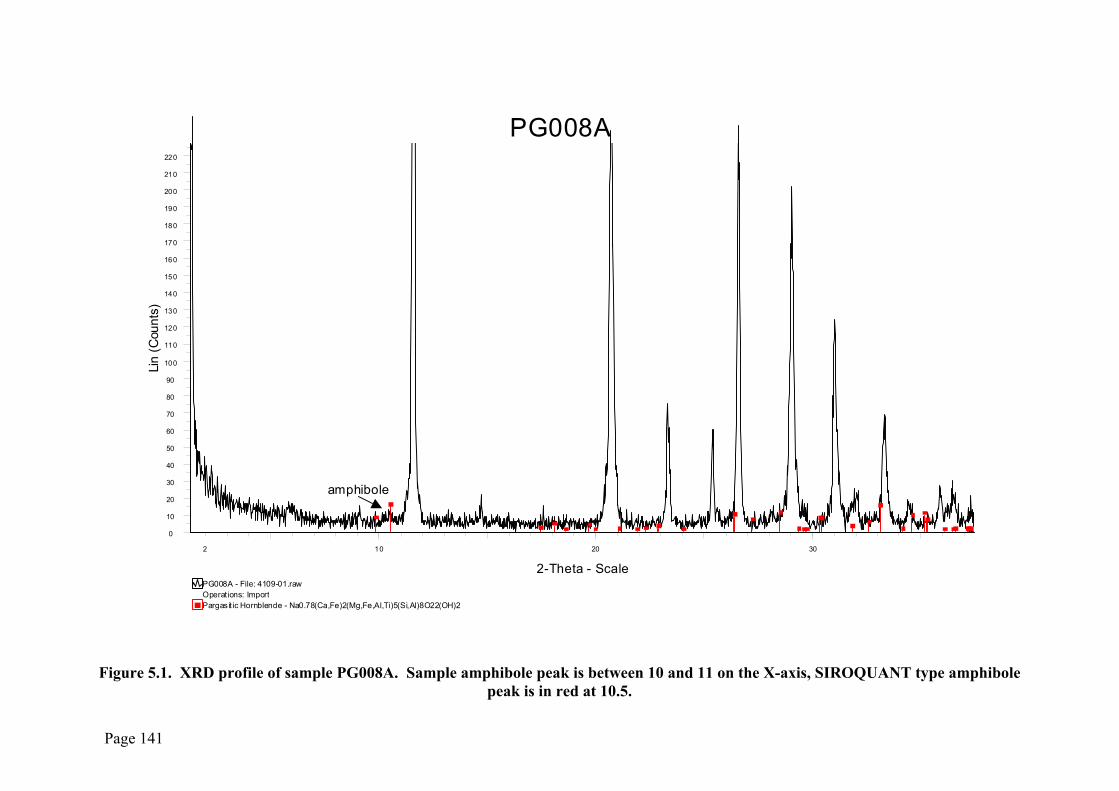
Figure 5.1 is an example of the XRD profile obtained from a sample containing
amphibole (PG008) overlain with the comparison data from the ICDD database. The
broad, diffuse profile is indicative of a very small and poorly crystalline amphibole
species (Klug and Alexander 1974) such as the metamorphic amphiboles seen at
Phosphate Hill. Because of this the mineral identification is unable to go beyond the
specification of the mineral family (in this case amphibole) due to the lack of reflections
from the crystals. The peak height bears no relation to the quantitative amounts present
in the sample; the SIROQUANT software takes into account the degree of crystallinity
of the actual mineral in the sample and the absorption of the x-rays by the different
Page 140
PG008A
Pargasit ic Hornblende - Na0.78(Ca,Fe)2(Mg,Fe,Al,Ti)5(Si,Al)8O22(OH)2Operations: ImportPG008A - File: 4109-01.raw
Lin
(Cou
nts)
0
10
20
30
40
50
60
70
80
90
100
110
120
130
140
150
160
170
180
190
200
210
220
2-Theta - Scale2 10 20 30
amphibole
Figure 5.1. XRD profile of sample PG008A. Sample amphibole peak is between 10 and 11 on the X-axis, SIROQUANT type amphibole
peak is in red at 10.5.
Page 141
elements in the mineral to provide the final information and thus the identification is not
entirely unambiguous (Ness pers. comm. 2004). However, the assignation of the
amphibole family to this profile is likely to be accurate as amphiboles routinely show
major reflections in the range of 8.9-8.2Å, such as is seen here (Ness pers. comm.
2004). It is likely that any amphiboles found in the PG are the result of concentration of
relict amphibole material retained in the ore from the original deposition of the ore
sequence and are, thus, most likely to be of the hornblende group. Microcline and
orthoclase feldspars ((K,Na)[AlSi3O8) are known to occur in the siltstones (Mascini
2001) and are also likely to have been sourced from the same granitoid/metamorphic
basement. However, the issue should be subjected to further research to ascertain the
provenance of the amphiboles.
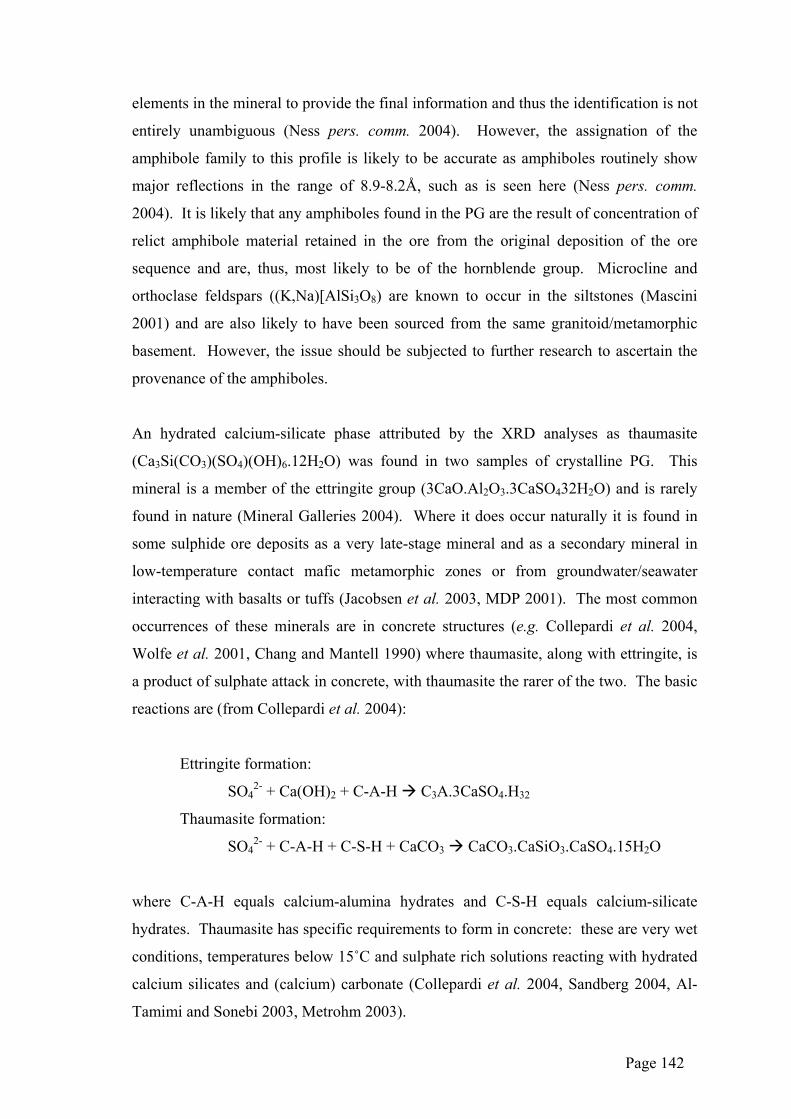
An hydrated calcium-silicate phase attributed by the XRD analyses as thaumasite
(Ca3Si(CO3)(SO4)(OH)6.12H2O) was found in two samples of crystalline PG. This
mineral is a member of the ettringite group (3CaO.Al2O3.3CaSO432H2O) and is rarely
found in nature (Mineral Galleries 2004). Where it does occur naturally it is found in
some sulphide ore deposits as a very late-stage mineral and as a secondary mineral in
low-temperature contact mafic metamorphic zones or from groundwater/seawater
interacting with basalts or tuffs (Jacobsen et al. 2003, MDP 2001). The most common
occurrences of these minerals are in concrete structures (e.g. Collepardi et al. 2004,
Wolfe et al. 2001, Chang and Mantell 1990) where thaumasite, along with ettringite, is
a product of sulphate attack in concrete, with thaumasite the rarer of the two. The basic
reactions are (from Collepardi et al. 2004):
Ettringite formation:
SO42- + Ca(OH)2 + C-A-H C3A.3CaSO4.H32
Thaumasite formation:
SO42- + C-A-H + C-S-H + CaCO3 CaCO3.CaSiO3.CaSO4.15H2O
where C-A-H equals calcium-alumina hydrates and C-S-H equals calcium-silicate
hydrates. Thaumasite has specific requirements to form in concrete: these are very wet
conditions, temperatures below 15˚C and sulphate rich solutions reacting with hydrated
calcium silicates and (calcium) carbonate (Collepardi et al. 2004, Sandberg 2004, Al-
Tamimi and Sonebi 2003, Metrohm 2003).
Page 142
If the XRD identification of this mineral is correct, it is difficult to see exactly how it
would occur at Phosphate Hill, although all of the components are available. The relict
acids contained within the mass of the PG, as well as any dissolution product from the
gypsum itself, would provide the sulphate-rich solutions required. Some of the clay
minerals identified (such as montmorillonite and heulandite) would be suitable hydrated
calcium silicates while others would be a source of hydrated calcium-aluminates. These
include heulandite again, chukrovite (Ca3(Ce,Y)Al2(SO4)F13.10H2O), which is known to
occur in PG systems (Kennedy et al. 1992) and the crandallite
((Ca,Sr)Al3(PO4)2(OH)5.H2O), that occurs in the ore (Hough 2004, Mascini 2001,
Russell and Trueman 1971).
The source of the calcium carbonate is more problematic. Carbonate minerals do occur
in the ore (calcite and dolomite) (Hough 2003, Mascini 2001) but would not be
expected to survive the acidulation process and none have been identified in the PG.
However, carbonate is part of the apatite chemistry at Phosphate Hill and might survive
into the PG mix so may provide the required source, although the acidulation process
would make this extremely unlikely. Even so, despite the chemical components
required for ettringite/thaumasite formation being present in some form, the physical
parameters are more difficult to obtain.
The PG stack is very wet during its construction but the fluids are initially warm and
will retain some heat until the exothermic conversion of hemihydrate to dihydrate
gypsum is complete. In addition, the material begins to drain of its excess fluids as
soon as it is removed from the sedimentation pond or the rim ditch. The samples were
taken in late August, at the end of winter, during which season temperatures can fall to
freezing point overnight, providing the low temperatures required. However, one of the
samples was taken from the emergency gypsum stockpiling area, where it had been
deposited during the previous December, while the other sample had been deposited in
mid-July, approximately six weeks before sampling. The emergency stack sampling
site is thus likely to have been almost completely dry by the onset of the coldest
temperatures, which tend to occur from mid-late June, due to the very low humidity,
windy conditions that start with the arrival of the dry season in late March/early April,
Page 143
making the required combination for ettringite formation of cold and wet extremely
unlikely for this sample.
The sample taken from the active stack may have been in a position to form thaumasite
in situ, as it was deposited in the middle of winter, but that removed from the
emergency stockpile was deposited in summer, when temperatures rarely fall below
20˚C. As such, it is unlikely that the mineral would have formed until some months
after original deposition of the PG. The fluid source then comes into consideration for
the reasons mentioned in the paragraph above. There was one rain event of 3mm
recorded in the cooler dry season months before sampling which may have provided
enough fluid input for the creation of this mineral. The only other sources of fluid
would be relict moisture retained in pore spaces in the PG below the surface few
millimetres of dried crust or input from the very infrequent dust control watering of the
area by the site water trucks.
The effect that the presence of this mineral is likely to have in the stack or in a
backfilled void is minimal. Although the ettringite group is associated with severe
damage to concrete structures such as bridge footings and buildings in damp localities
due to its expansion properties, it has been found in only 2 of 17 samples (11.8%) at a
volume of 1% of the total. As such, it is not expected to create any stability problems
within any projected PG storage facility, if in fact the identification is correct. XRD has
difficulty distinguishing minerals at such low volumes and the result could be a mis-
interpretation.
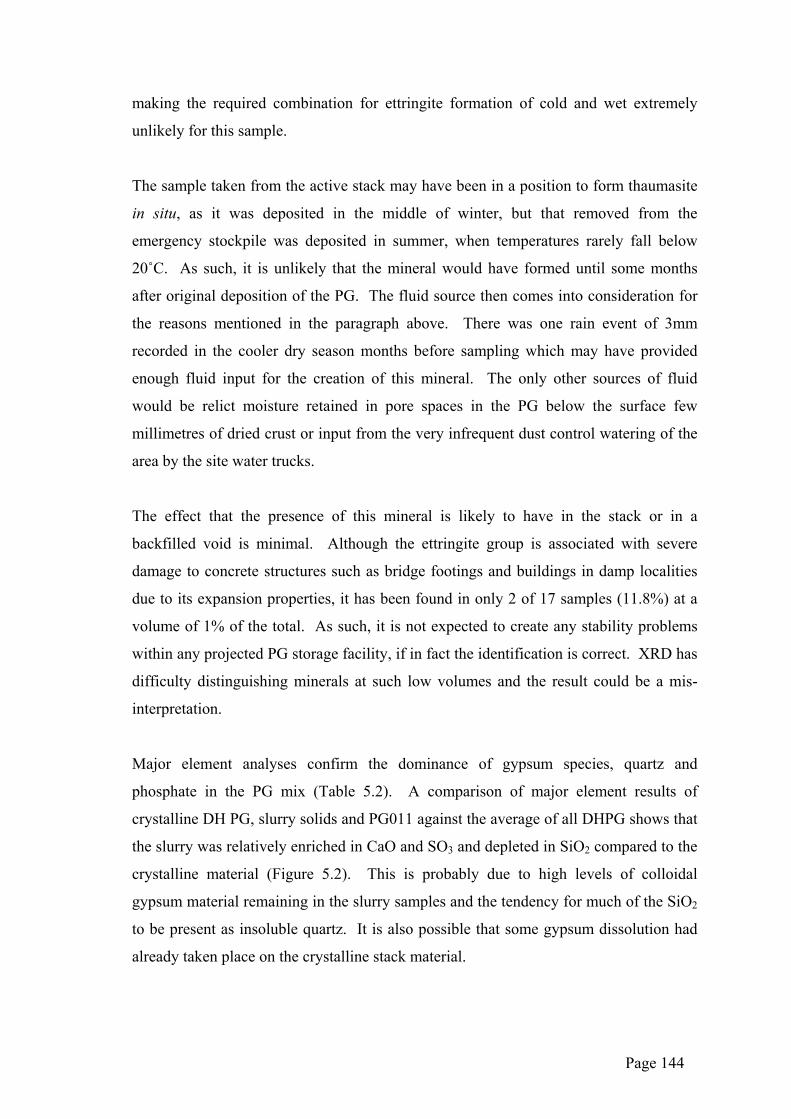
Major element analyses confirm the dominance of gypsum species, quartz and
phosphate in the PG mix (Table 5.2). A comparison of major element results of
crystalline DH PG, slurry solids and PG011 against the average of all DHPG shows that
the slurry was relatively enriched in CaO and SO3 and depleted in SiO2 compared to the
crystalline material (Figure 5.2). This is probably due to high levels of colloidal
gypsum material remaining in the slurry samples and the tendency for much of the SiO2
to be present as insoluble quartz. It is also possible that some gypsum dissolution had
already taken place on the crystalline stack material.
Page 144
Average Major Elements, All DH PG
0
5
10
15
20
25
30
35
40
SiO2 CaO P2O5 SO3Species
Wt %
(n =
16)
AllCrystalline
All Slurry
All DH
PG011
Figure 5.2 Comparison of major element results (XRF) in Phosphate Hill DH PG. Lilac = mean of all crystalline DH PG sampled; dark red = mean of all slurry solids; cream = mean of all crystalline and slurry solids; green = PG011 solids.
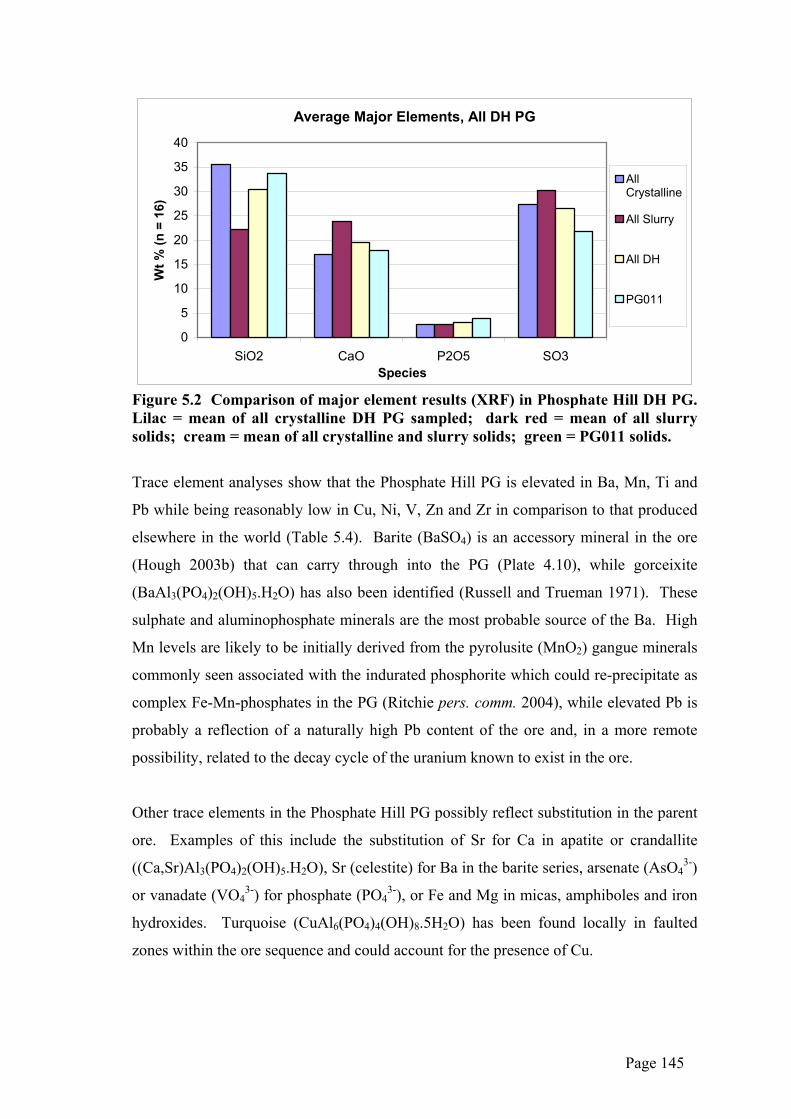
Trace element analyses show that the Phosphate Hill PG is elevated in Ba, Mn, Ti and
Pb while being reasonably low in Cu, Ni, V, Zn and Zr in comparison to that produced
elsewhere in the world (Table 5.4). Barite (BaSO4) is an accessory mineral in the ore
(Hough 2003b) that can carry through into the PG (Plate 4.10), while gorceixite
(BaAl3(PO4)2(OH)5.H2O) has also been identified (Russell and Trueman 1971). These
sulphate and aluminophosphate minerals are the most probable source of the Ba. High
Mn levels are likely to be initially derived from the pyrolusite (MnO2) gangue minerals
commonly seen associated with the indurated phosphorite which could re-precipitate as
complex Fe-Mn-phosphates in the PG (Ritchie pers. comm. 2004), while elevated Pb is
probably a reflection of a naturally high Pb content of the ore and, in a more remote
possibility, related to the decay cycle of the uranium known to exist in the ore.
Other trace elements in the Phosphate Hill PG possibly reflect substitution in the parent
ore. Examples of this include the substitution of Sr for Ca in apatite or crandallite
((Ca,Sr)Al3(PO4)2(OH)5.H2O), Sr (celestite) for Ba in the barite series, arsenate (AsO43-)
or vanadate (VO43-) for phosphate (PO4
3-), or Fe and Mg in micas, amphiboles and iron
hydroxides. Turquoise (CuAl6(PO4)4(OH)8.5H2O) has been found locally in faulted
zones within the ore sequence and could account for the presence of Cu.
Page 145
ELEMENT FLORIDA PG
IDAHO PG SOUTH AFRICA PG
TUNISIA PG PHOSPHATE HILL PG
Ag <1 1-11 As 40 <1-2 10.3 Au (µg/kg) 3-15 B 3 <10-30 Ba 7 20-140 140 321.7 Be 1 1-2 Br 1-2 Cd 7 9-28 40 Cl <100-300 Co 2 <1-1 8 8.6 Cr <10-70 21.3 Cu 8 10-42 103 6 43.4 Hg (µg/kg) <50 14000 Mn 15 <2-10 246.7 Mo 16 <1-2 5 Ni 2 3-15 13 15 6.3 Pb 1 3-7 18.8 Rb <10-20 Sb 100 0.3-0.8 Sc 7.8 Se 4-67 Sr 10 610-670 363.4 Th <1-1 Ti 179.3 U 6-13 32-71 V 19 10-40 17.8 Y 2 100-120 50 153.3 Zn 9 18-112 6 315 27.8 Zr 10 <10-110 185 9.6 Table 5.4. Trace elements in PG (ppm) produced from different rock phosphate sources (after Rutherford et al. 1994) compared to Phosphate Hill PG from this study.
Observations of the physical characteristics of the PG suggest that, like natural gypsum,
DH is the more stable of the two phosphogypsum forms in the ambient temperatures
and pressures experienced on site. It has already undergone most of the hydration
process from HH and tends to set as a tight crust with no apparent change in cluster size
rather than as loose clumps, inhibiting the flow of excess fluid through it. Dehydration
of the mineral in any time frame is unlikely to occur as it requires a minimum
temperature of ~70°C to begin the reconversion to HH and approximately 200°C to
reconvert to anhydrite, with the former being metastable, reverting to DH with the
addition of further fluid (Heer et al. 1992). These dissolution column observations
conform with known behaviour of the PG on the stack, where it forms a thin (2-3mm),
stable crust. The HH, in contrast, continues to convert to DH after deposition, forming
a material with a coarse-grained, sandy texture which allows rapid through-flow of
fluids excess to conversion requirements.
Page 146
The results also show that there is a distinct difference between the stability of freshly
deposited, wet DH and aged, dryer DH. This is reflected by the total amount of water
retained by the dissolution columns during the flushing process. The former (GN)
retained 30.6% of all water added to it whereas the latter (GO) only retained 16.7% of
the water (Table 4.23), indicating that the conversion process continues for some time
after the initial addition of acid process water to the HH in the PG re-slurry tank. There
is little difference in total water retention rates between the HH (28.6%) and the freshly
deposited DH (30.6%) (Table 4.23), again suggesting that the conversion process
between the two forms of gypsum may not be particularly rapid in the setting of a
disposal facility. This is confirmed by research that states an increase in mixing time
(such as occurs in the re-slurry tank) shortens the conversion time between HH and DH
while lack of movement in the HH will allow partial conversion to DH, coating the HH
crystals and slowing the conversion process (USAF 2004, Rashad et al. 2003, Becker
1989). The same DH coating process can be responsible for the presence of undigested
phosphorite particles in the PG as the particle can become coated in gypsum, stopping
the acidulation process before digestion is complete (Becker 1989). Additionally, it
should be noted that at the time of sampling both the slurry and the newly deposited DH
sample were warm to the touch and stayed so until despatched, often over an hour later,
indicating that the exothermic conversion reaction from HH to DH (USAF 2004, Becker
1997) was still occurring.
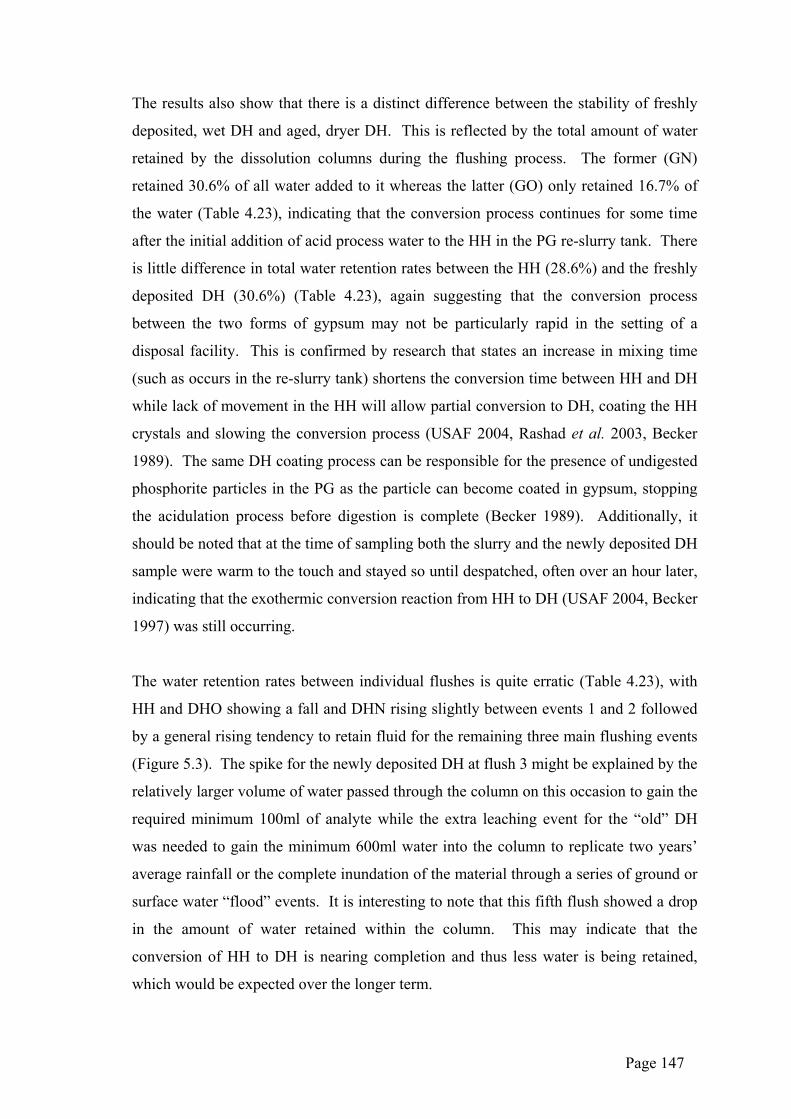
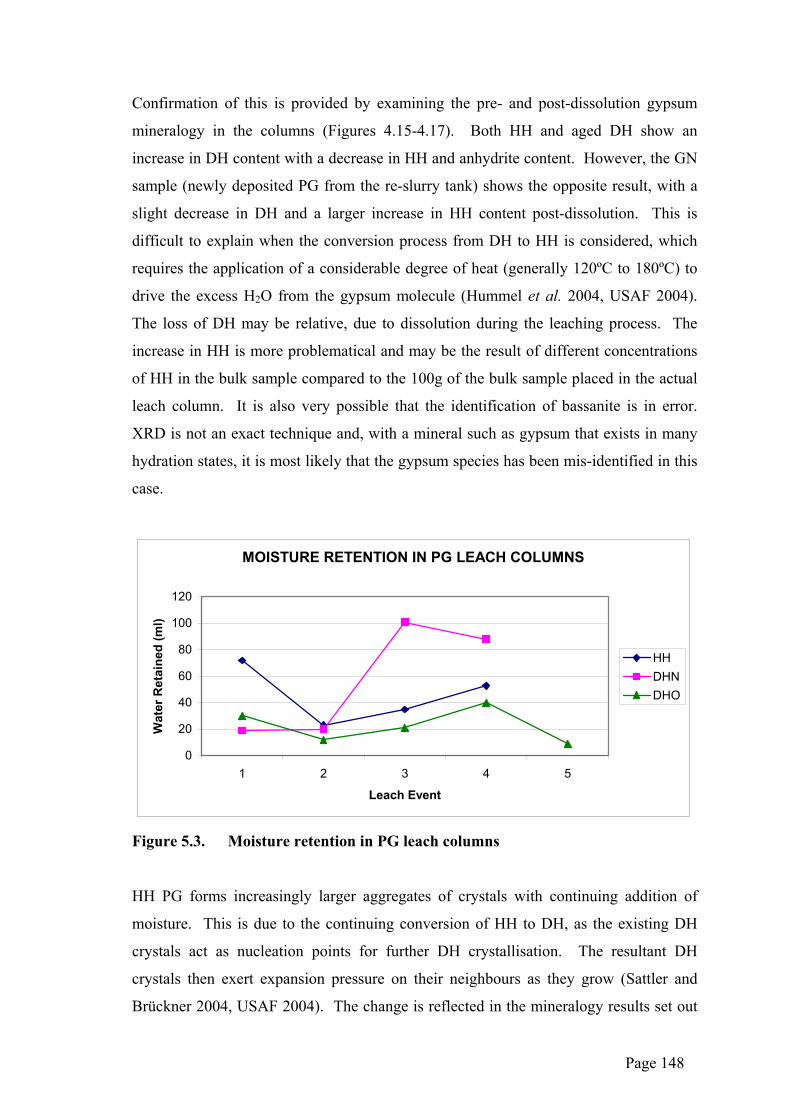
The water retention rates between individual flushes is quite erratic (Table 4.23), with
HH and DHO showing a fall and DHN rising slightly between events 1 and 2 followed
by a general rising tendency to retain fluid for the remaining three main flushing events
(Figure 5.3). The spike for the newly deposited DH at flush 3 might be explained by the
relatively larger volume of water passed through the column on this occasion to gain the
required minimum 100ml of analyte while the extra leaching event for the “old” DH
was needed to gain the minimum 600ml water into the column to replicate two years’
average rainfall or the complete inundation of the material through a series of ground or
surface water “flood” events. It is interesting to note that this fifth flush showed a drop
in the amount of water retained within the column. This may indicate that the
conversion of HH to DH is nearing completion and thus less water is being retained,
which would be expected over the longer term.
Page 147
Confirmation of this is provided by examining the pre- and post-dissolution gypsum
mineralogy in the columns (Figures 4.15-4.17). Both HH and aged DH show an
increase in DH content with a decrease in HH and anhydrite content. However, the GN
sample (newly deposited PG from the re-slurry tank) shows the opposite result, with a
slight decrease in DH and a larger increase in HH content post-dissolution. This is
difficult to explain when the conversion process from DH to HH is considered, which
requires the application of a considerable degree of heat (generally 120ºC to 180ºC) to
drive the excess H2O from the gypsum molecule (Hummel et al. 2004, USAF 2004).
The loss of DH may be relative, due to dissolution during the leaching process. The
increase in HH is more problematical and may be the result of different concentrations
of HH in the bulk sample compared to the 100g of the bulk sample placed in the actual
leach column. It is also very possible that the identification of bassanite is in error.
XRD is not an exact technique and, with a mineral such as gypsum that exists in many
hydration states, it is most likely that the gypsum species has been mis-identified in this
case.
MOISTURE RETENTION IN PG LEACH COLUMNS
0
20
40
60
80
100
120
1 2 3 4 5
Leach Event
Wat
er R
etai
ned
(ml)
HHDHNDHO
Figure 5.3. Moisture retention in PG leach columns
HH PG forms increasingly larger aggregates of crystals with continuing addition of
moisture. This is due to the continuing conversion of HH to DH, as the existing DH
crystals act as nucleation points for further DH crystallisation. The resultant DH
crystals then exert expansion pressure on their neighbours as they grow (Sattler and
Brückner 2004, USAF 2004). The change is reflected in the mineralogy results set out
Page 148
in Tables 4.17 and 4.20, with HH (Bassanite) forming 25% of the HH column sample
before flushing and only 2.3% afterwards. In comparison, the DH in the same sample
rose from 43% pre-dissolution to 65.6% post-dissolution. This tendency for the HH to
loosely clump may have implications for the volume of leachate expected to enter the
groundwater from any in-pit disposal area over time as the area might be expected to
become more porous and permeable with the increased clumping, allowing more fluid
through.
In contrast to the HH, both types of DH in the leach columns had no apparent increase
in particle size and an increasing tendency to set harder with every application of water.
Permeability and porosity would appear to decrease over the same period, as measured
by the expanding amount of time required to receive leachate from the two columns.
The extension in time was particularly noticeable at the third flush when the time
required to pass the water through the columns rose from 45-60 minutes to well over
three days. This suggests that DH would be a preferable material to utilise for backfill,
as consolidation would occur over time, minimising the amount of fluid that may be
able to work its way through the fill.
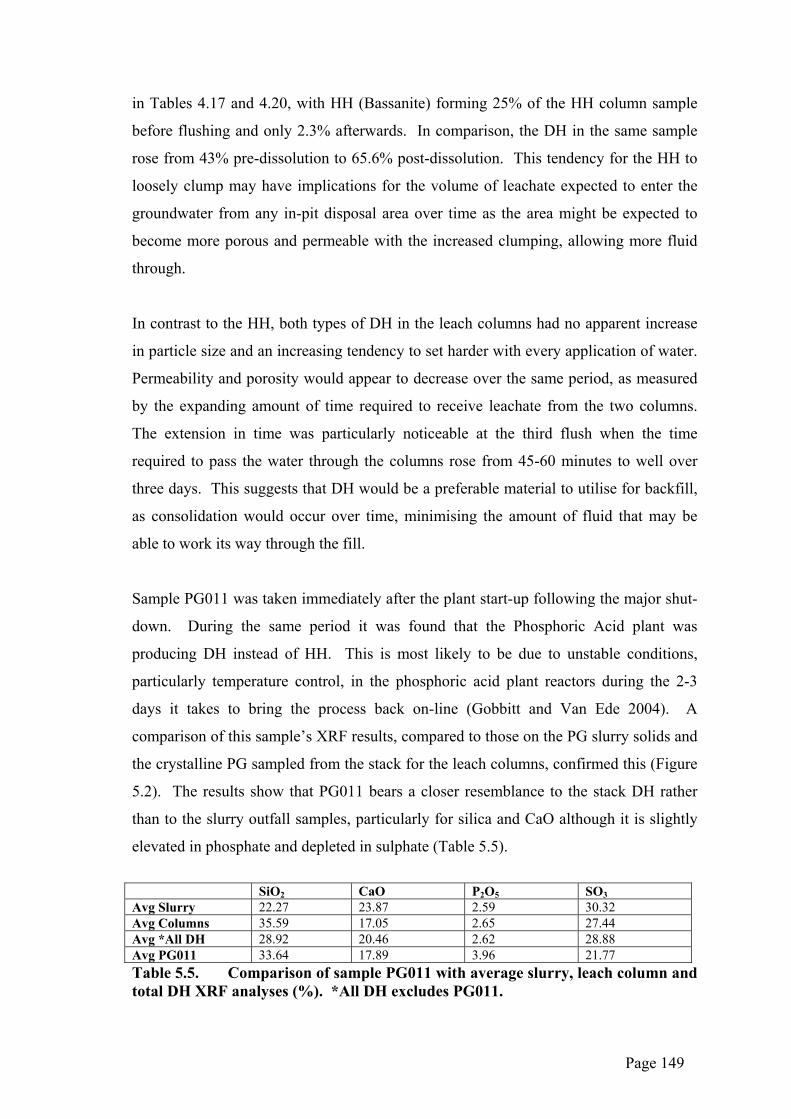
Sample PG011 was taken immediately after the plant start-up following the major shut-
down. During the same period it was found that the Phosphoric Acid plant was
producing DH instead of HH. This is most likely to be due to unstable conditions,
particularly temperature control, in the phosphoric acid plant reactors during the 2-3
days it takes to bring the process back on-line (Gobbitt and Van Ede 2004). A
comparison of this sample’s XRF results, compared to those on the PG slurry solids and
the crystalline PG sampled from the stack for the leach columns, confirmed this (Figure
5.2). The results show that PG011 bears a closer resemblance to the stack DH rather
than to the slurry outfall samples, particularly for silica and CaO although it is slightly
elevated in phosphate and depleted in sulphate (Table 5.5).
SiO2 CaO P2O5 SO3 Avg Slurry 22.27 23.87 2.59 30.32 Avg Columns 35.59 17.05 2.65 27.44 Avg *All DH 28.92 20.46 2.62 28.88 Avg PG011 33.64 17.89 3.96 21.77 Table 5.5. Comparison of sample PG011 with average slurry, leach column and total DH XRF analyses (%). *All DH excludes PG011.
Page 149
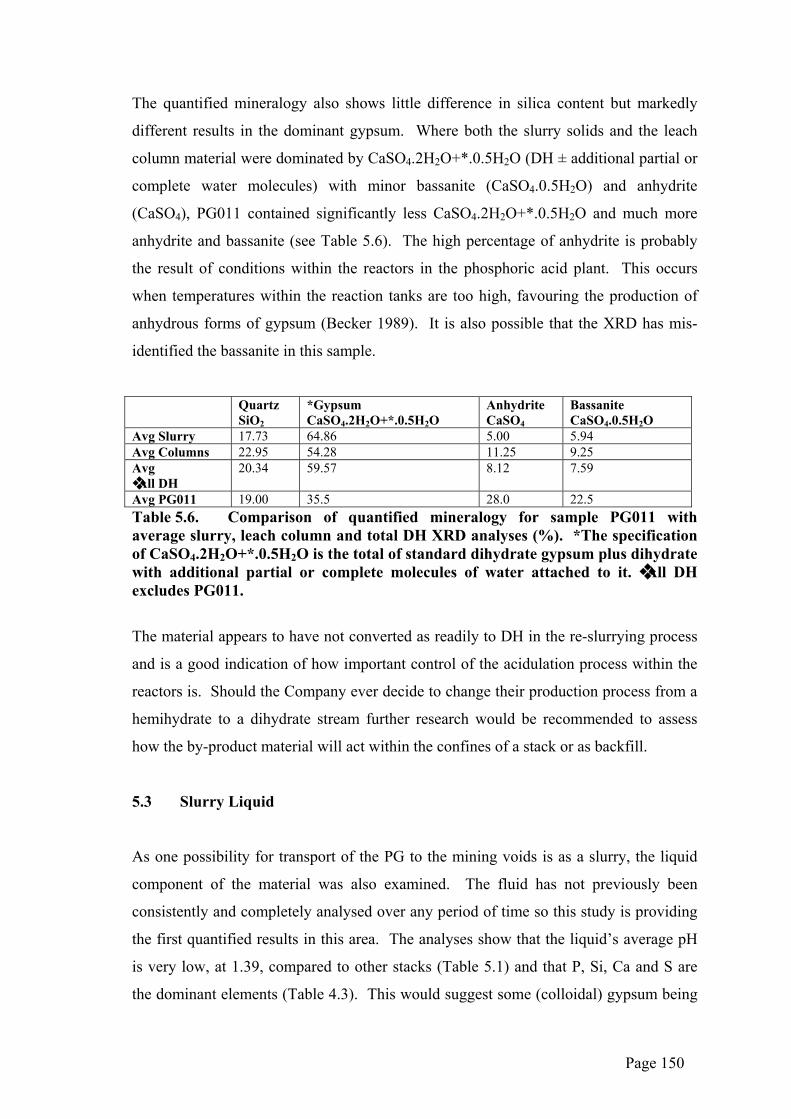
The quantified mineralogy also shows little difference in silica content but markedly
different results in the dominant gypsum. Where both the slurry solids and the leach
column material were dominated by CaSO4.2H2O+*.0.5H2O (DH ± additional partial or
complete water molecules) with minor bassanite (CaSO4.0.5H2O) and anhydrite
(CaSO4), PG011 contained significantly less CaSO4.2H2O+*.0.5H2O and much more
anhydrite and bassanite (see Table 5.6). The high percentage of anhydrite is probably
the result of conditions within the reactors in the phosphoric acid plant. This occurs
when temperatures within the reaction tanks are too high, favouring the production of
anhydrous forms of gypsum (Becker 1989). It is also possible that the XRD has mis-
identified the bassanite in this sample.
Quartz
SiO2 *Gypsum CaSO4.2H2O+*.0.5H2O
Anhydrite CaSO4
Bassanite CaSO4.0.5H2O
Avg Slurry 17.73 64.86 5.00 5.94 Avg Columns 22.95 54.28 11.25 9.25 Avg ❖ All DH
20.34 59.57 8.12 7.59
Avg PG011 19.00 35.5 28.0 22.5 Table 5.6. Comparison of quantified mineralogy for sample PG011 with average slurry, leach column and total DH XRD analyses (%). *The specification of CaSO4.2H2O+*.0.5H2O is the total of standard dihydrate gypsum plus dihydrate with additional partial or complete molecules of water attached to it. ❖ All DH excludes PG011.
The material appears to have not converted as readily to DH in the re-slurrying process
and is a good indication of how important control of the acidulation process within the
reactors is. Should the Company ever decide to change their production process from a
hemihydrate to a dihydrate stream further research would be recommended to assess
how the by-product material will act within the confines of a stack or as backfill.
5.3 Slurry Liquid
As one possibility for transport of the PG to the mining voids is as a slurry, the liquid
component of the material was also examined. The fluid has not previously been
consistently and completely analysed over any period of time so this study is providing
the first quantified results in this area. The analyses show that the liquid’s average pH
is very low, at 1.39, compared to other stacks (Table 5.1) and that P, Si, Ca and S are
the dominant elements (Table 4.3). This would suggest some (colloidal) gypsum being
Page 150
present as well as dissolution products from the parent phosphorite and relict H3PO4.
Trace elements are dominated by V, Ti, U and Cu, with Ni and Cr also strongly
represented (Table 4.4). Relative elemental abundances in liquid and solid phases are
discussed in section 5.4 and radionuclide trends within the slurry are discussed in
section 5.5.
5.4 Relative Elemental Abundance in PG Slurry
The elemental abundance graphs shown in Figures 4.1 and 4.2 show that, of the major
elements, Ca, S and Si are the most abundant in the solid phase. This result was
expected as Ca and S are components of the dominant gypsum phase (CaSO4.2H2O,
CaSO4.0.5H2O, CaSO4) with Si reflecting the quartz content. Although there appears to
be little difference between solid and liquid phase for P, this is deceptive, as the actual
amounts show 11,790ppm P in the solid phase and 8,471ppm P in the liquid phase.
The higher values associated with the solid phase will be due to the presence of a
mixture of co-precipitated calcium phosphate minerals, crystal or pore bound H3PO4
and traces of undigested phosphorite ore in the PG mix. The latter can comprise solely
of pelletal carbonate-fluorapatite (identified in Russell & Trueman 1971 as occurring at
Phosphate Hill with the following formula:
Ca4.939Na0.061(PO4)2.816(CO3)0.137(SO4)0.056F0.994(OH)0.378);
particles of the ore that contain the pellets cemented by quartz; or fragments of the
slightly phosphatised siltstone and chert that are common within the ore sequence. As
far as elemental partitioning partitioning is concerned, P would be expected to partition
most strongly into the liquid phase due to its high solubility. This is confirmed by
WMCF in-house analyses of the process water and recycled fluids used to re-slurry the
HH which show that it is dominated by H3PO4, H2SiF6 and HF acids with lesser
amounts of H2SO4 and the alkali fluorosilicates (Ritchie pers. comm. 2004).
Fe and Na have similar abundances in both phases, with the solid again being slightly
dominant (914ppm Fe in the solid, 538ppm in the liquid and 843ppm Na in the solid
and 709ppm in the liquid). Ti is the most abundant of the trace elements in the solid
Page 151
phase and is probably originally sourced from the micas and/or amphiboles. Ti is
known to replace the Al, Mg or Fe that normally occupies the Y position in the general
mica formula X2Y4-6Z8O20(OH,F)4 and can replace Mg, Fe2+, Al, Fe3+ in the C position
of the general amphibole formula (A0-1B2C5T8O22(OH,F) (Russell and Trueman 1971,
Deer et al. 1992) and may be here as a complex co-precipitate, as would be many of the
other ions (Ritchie pers. comm. 2004). Nb, Rb, Th and U, although analysed for in the
solid phase, were below detection limits and thus appear to prefer the liquid phase. Cd
and Sn were only analysed for in the liquid phase while Zn was only analysed for in the
solid, thus not providing information on relative abundances.
During the acidulation process F is known to form gases (e.g. HF, SiF4), liquids (e.g.
H2SiF6) (refer to section 2.4.3 for the conversion process) or solids (e.g. the K2SiF6
found in scale throughout the plant), all of which can also be found in the PG stacking
facility. The gaseous phases are exhaled to the atmosphere in the stack while the
H2SiF6 commonly reacts with heat and/or acid to form both HF and SiF4. This is
probably the main reason for seeing F only in the solid phase in the stack; in addition to
relict phosphorite, the alkali fluorosilicates form scale in the plant pipework and also
crystallise out in quiet pools in the drainage ditches at the base of the stack (confirmed
by XRF and ICPMS analyses undertaken by the WMCF on-site laboratory at Phosphate
Hill on crystals recovered from the drainage ditches and scale sampled from various
parts of the plant and the re-slurrying system), an observation that has been made in
other studies (e.g. Nifong 1998). An unstable calcium fluorosilicate (CaSiF6.2H2O) is
also found in the recycled fluids but tends to decompose to the more stable solid CaF2,
which is also found in the scale (Dziurdziak 2000).
A review of the literature available on PG has revealed that very little information is
available on the chemistry of PG slurry, either as a whole or in its liquid phase. The
majority of studies focus on the chemistry of the gypsum solids and their potential uses.
As such, this study appears to stand almost alone in defining the slurry liquid phase in
addition to the solids.
Page 152
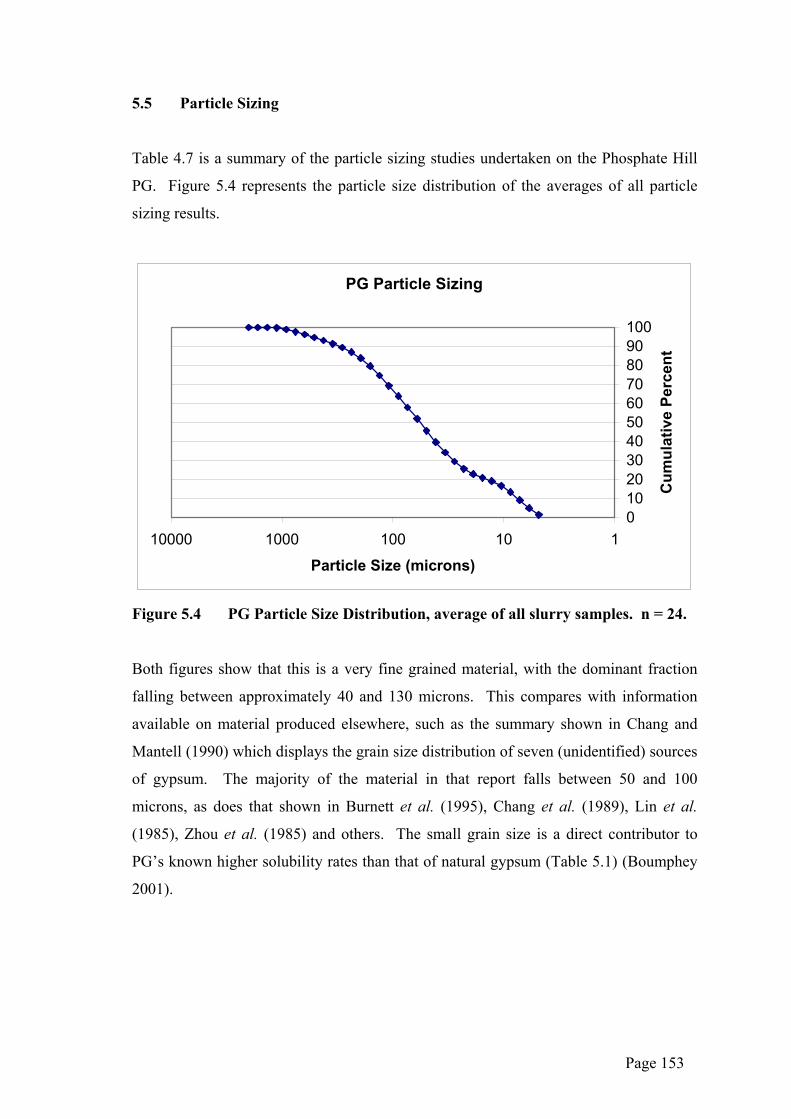
5.5 Particle Sizing
Table 4.7 is a summary of the particle sizing studies undertaken on the Phosphate Hill
PG. Figure 5.4 represents the particle size distribution of the averages of all particle
sizing results.
PG Particle Sizing
0102030405060708090100
110100100010000
Particle Size (microns)
Cum
ulat
ive
Perc
ent
Figure 5.4 PG Particle Size Distribution, average of all slurry samples. n = 24.
Both figures show that this is a very fine grained material, with the dominant fraction
falling between approximately 40 and 130 microns. This compares with information
available on material produced elsewhere, such as the summary shown in Chang and
Mantell (1990) which displays the grain size distribution of seven (unidentified) sources
of gypsum. The majority of the material in that report falls between 50 and 100
microns, as does that shown in Burnett et al. (1995), Chang et al. (1989), Lin et al.
(1985), Zhou et al. (1985) and others. The small grain size is a direct contributor to
PG’s known higher solubility rates than that of natural gypsum (Table 5.1) (Boumphey
2001).
Page 153
5.6 Seasonal Variation Within PG Slurry Solid and Liquid Chemistry
The results shown in Appendix 1 and section 4.1.4 show that the majority of the
samples fall within two standard deviations of the mean, which suggests reasonably
small variation within the PG over the 12 month/18 parcel cycle. Analyses of the slurry
liquid and solid phases confirm the trends (selected examples given in Figures 4.5, 4.8,
4.9). As such there is no seasonal trend apparent in the PG produced. However, trends
in plant performance are reflected in the results over the 12 months of sampling.
The results of poor plant performance on start-up after the major shut-down are
particularly evident in the quantified mineralogy graphs for gypsum species (Figures 4.4
and 4.7). The CaSO4 spike and corresponding CaSO4.2H2O trough in August 2001
(PG011A and B) in Figure 4.7 supports the observation at the time that the plant was
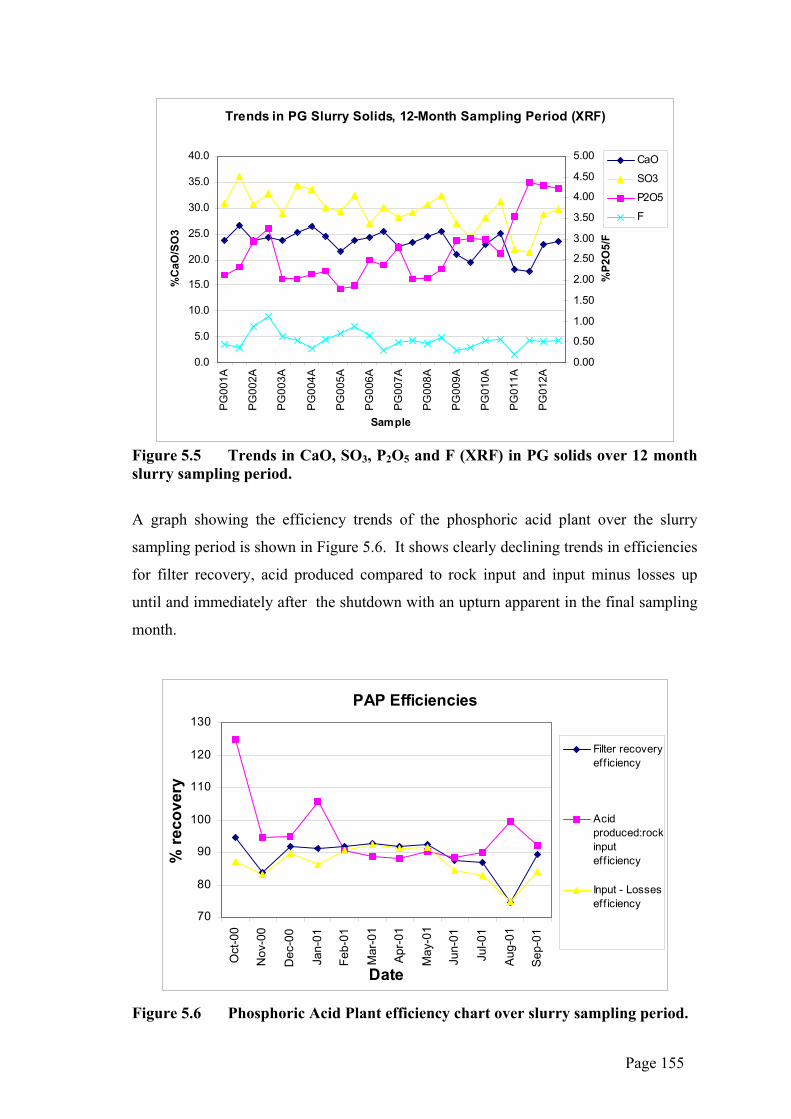
not producing almost pure HH as it should. There are clear trends in XRF results for
CaO, SO3 and F (declining) and P2O5 (increasing) (Figure 5.5). These results suggest
that, in the three months leading up to the shut-down and immediately on re-start, the
plant was not functioning at optimum levels. Instead, the declining volume of PG being
sent to the stack (reflected in the CaO, SO3 and F trends) was probably being
supplemented by a combination of increased H3PO4, co-crystallised P2O5, water soluble
P2O5 and relict undigested phosphorite. The latter occurs due to the self-limiting
process of the reaction between apatite and sulphuric acid, where the grain of the
mineral can become coated by gypsum, effectively stopping any further reaction taking
place.
Page 154
Trends in PG Slurry Solids, 12-Month Sampling Period (XRF)
0.0
5.0
10.0
15.0
20.0
25.0
30.0
35.0
40.0
PG00
1A
PG00
2A
PG00
3A
PG00
4A
PG00
5A
PG00
6A
PG00
7A
PG00
8A
PG00
9A
PG01
0A
PG01
1A
PG01
2A
Sample
%C
aO/S
O3
0.00
0.50
1.00
1.50
2.00
2.50
3.00
3.50
4.00
4.50
5.00
%P2
O5/
F
CaO
SO3
P2O5
F
Figure 5.5 Trends in CaO, SO3, P2O5 and F (XRF) in PG solids over 12 month slurry sampling period.
A graph showing the efficiency trends of the phosphoric acid plant over the slurry
sampling period is shown in Figure 5.6. It shows clearly declining trends in efficiencies
for filter recovery, acid produced compared to rock input and input minus losses up
until and immediately after the shutdown with an upturn apparent in the final sampling
month.
PAP Efficiencies
70
80
90
100
110
120
130
Oct
-00
Nov
-00
Dec
-00
Jan-
01
Feb-
01
Mar
-01
Apr-0
1
May
-01
Jun-
01
Jul-0
1
Aug-
01
Sep-
01
Date
% re
cove
ry
Filter recoveryeff iciency
Acidproduced:rockinputeff iciency
Input - Losseseff iciency
Figure 5.6 Phosphoric Acid Plant efficiency chart over slurry sampling period.
Page 155
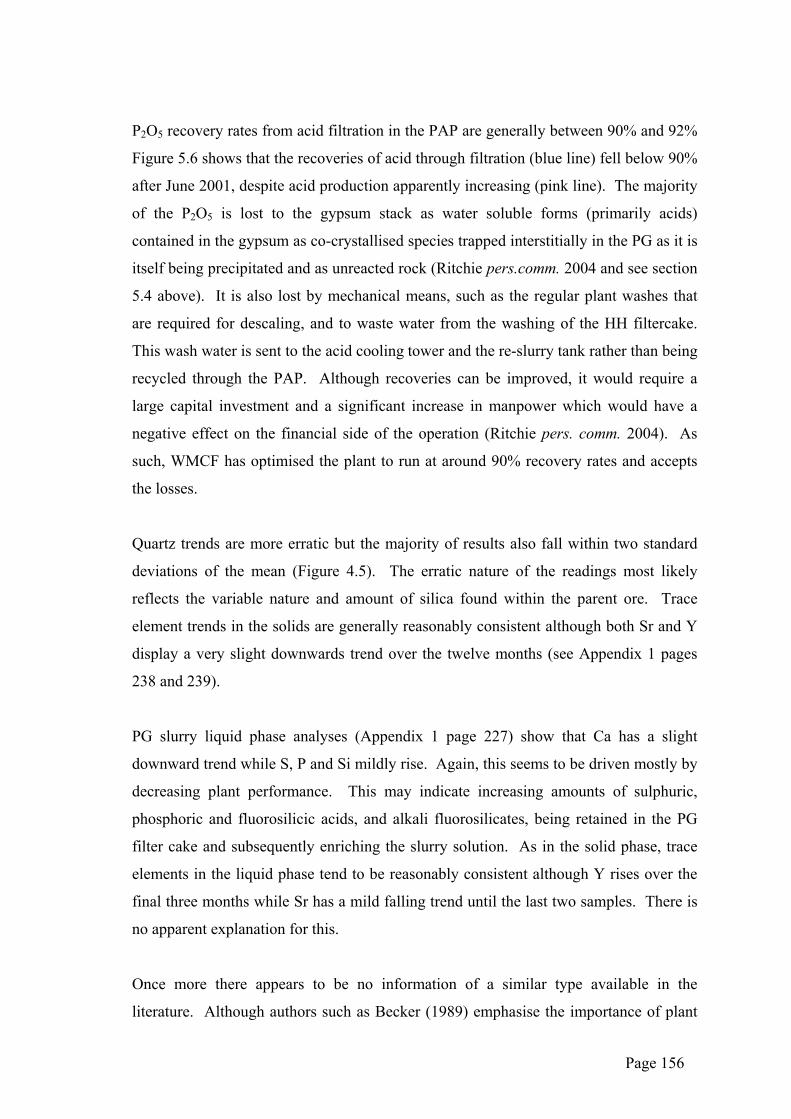
P2O5 recovery rates from acid filtration in the PAP are generally between 90% and 92%
Figure 5.6 shows that the recoveries of acid through filtration (blue line) fell below 90%
after June 2001, despite acid production apparently increasing (pink line). The majority
of the P2O5 is lost to the gypsum stack as water soluble forms (primarily acids)
contained in the gypsum as co-crystallised species trapped interstitially in the PG as it is
itself being precipitated and as unreacted rock (Ritchie pers.comm. 2004 and see section
5.4 above). It is also lost by mechanical means, such as the regular plant washes that
are required for descaling, and to waste water from the washing of the HH filtercake.
This wash water is sent to the acid cooling tower and the re-slurry tank rather than being
recycled through the PAP. Although recoveries can be improved, it would require a
large capital investment and a significant increase in manpower which would have a
negative effect on the financial side of the operation (Ritchie pers. comm. 2004). As
such, WMCF has optimised the plant to run at around 90% recovery rates and accepts
the losses.
Quartz trends are more erratic but the majority of results also fall within two standard
deviations of the mean (Figure 4.5). The erratic nature of the readings most likely
reflects the variable nature and amount of silica found within the parent ore. Trace
element trends in the solids are generally reasonably consistent although both Sr and Y
display a very slight downwards trend over the twelve months (see Appendix 1 pages
238 and 239).
PG slurry liquid phase analyses (Appendix 1 page 227) show that Ca has a slight
downward trend while S, P and Si mildly rise. Again, this seems to be driven mostly by
decreasing plant performance. This may indicate increasing amounts of sulphuric,
phosphoric and fluorosilicic acids, and alkali fluorosilicates, being retained in the PG
filter cake and subsequently enriching the slurry solution. As in the solid phase, trace
elements in the liquid phase tend to be reasonably consistent although Y rises over the
final three months while Sr has a mild falling trend until the last two samples. There is
no apparent explanation for this.
Once more there appears to be no information of a similar type available in the
literature. Although authors such as Becker (1989) emphasise the importance of plant
Page 156
settings and efficiency in optimising phosphoric acid production there are no other
examples which show how this optimisation can affect the quality of the PG.
5.7 Dissolution Column Results
The purpose of the dissolution column tests was to determine both the type of leachate
derived from different PG sources and what would happen to the column material itself
during the dissolution process. 100g samples of hemihydrate filtercake (HH)
(CaSO4.0.5H2O), newly deposited dihydrate (DHN) and aged dihydrate (estimated at
between three and six months old) (DHO) (both CaSO4.2H2O) were placed in columns
and subjected to the equivalent of two years’ annual rainfall in a manner simulating the
natural weather pattern at Phosphate Hill, where rain occurs during the wet season as
discrete, heavy rain events separated by periods of dry weather. The volume of water
was also sufficient to give some indication of how the material would react should it be
repeatedly submerged by groundwater or inundated by floods when used as backfill.
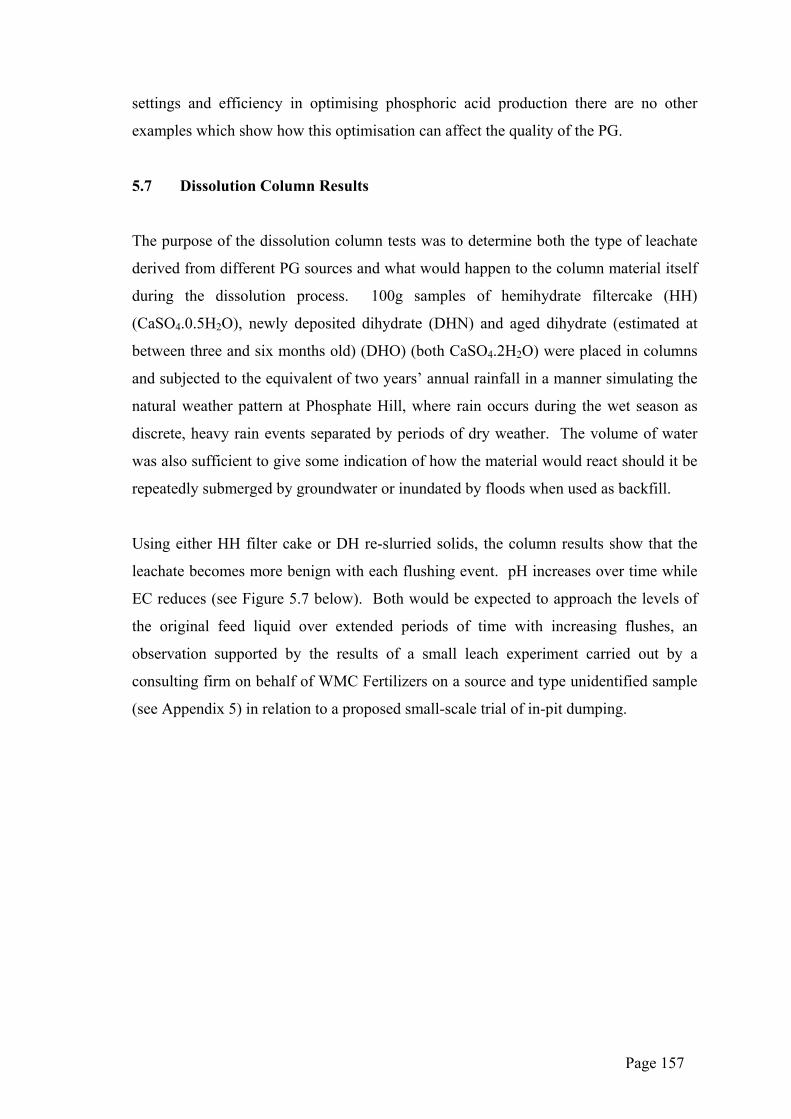
Using either HH filter cake or DH re-slurried solids, the column results show that the
leachate becomes more benign with each flushing event. pH increases over time while
EC reduces (see Figure 5.7 below). Both would be expected to approach the levels of
the original feed liquid over extended periods of time with increasing flushes, an
observation supported by the results of a small leach experiment carried out by a
consulting firm on behalf of WMC Fertilizers on a source and type unidentified sample
(see Appendix 5) in relation to a proposed small-scale trial of in-pit dumping.
Page 157
pH -v- EC TRENDS DURING LEACHING
0
2
4
6
8
10
12
14
16
18
Flush 1 Flush 2 Flush 3 Flush 4 Flush 5
Leaching Event
EC (m
S/cm
)
1.5
2
2.5
3
3.5
4
4.5
pH
HH Cond
DHNCond
DHOCond
HH pH
DHN pH
DHO pH
Figure 5.7. pH vs. EC trends during leaching period for HH and DH PG
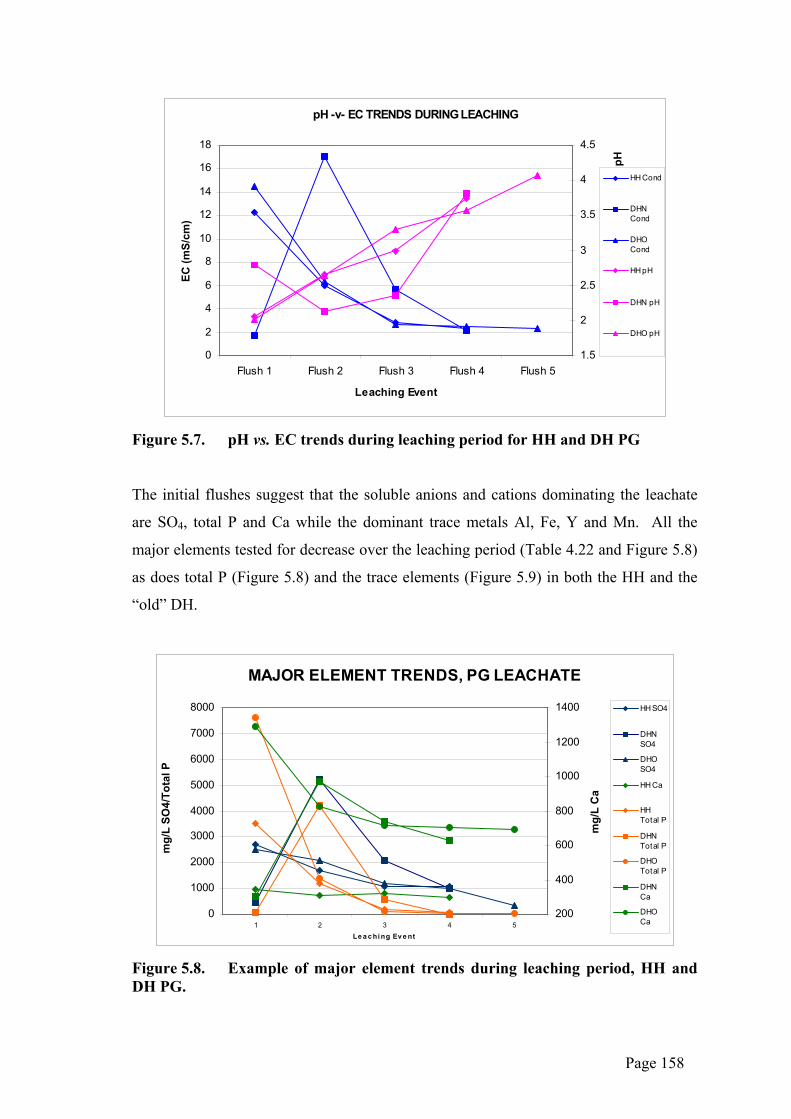
The initial flushes suggest that the soluble anions and cations dominating the leachate
are SO4, total P and Ca while the dominant trace metals Al, Fe, Y and Mn. All the
major elements tested for decrease over the leaching period (Table 4.22 and Figure 5.8)
as does total P (Figure 5.8) and the trace elements (Figure 5.9) in both the HH and the
“old” DH.
MAJOR ELEMENT TRENDS, PG LEACHATE
0
1000
2000
3000
4000
5000
6000
7000
8000
1 2 3 4 5Le a c hi ng Ev e nt
mg/
L SO
4/To
tal P
200
400
600
800
1000
1200
1400
mg/
L C
a
HH SO4
DHNSO4
DHOSO4
HH Ca
HHTotal P
DHNTotal P
DHOTotal P
DHNCa
DHOCa
Figure 5.8. Example of major element trends during leaching period, HH and DH PG.
Page 158
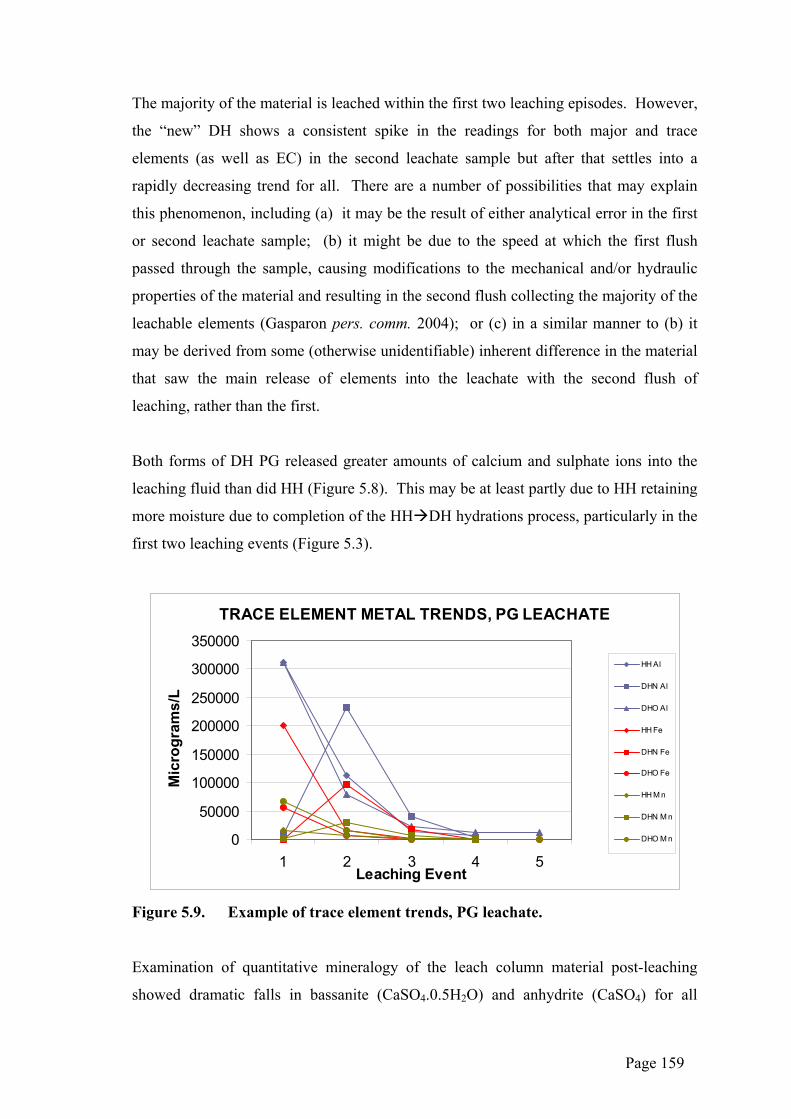
The majority of the material is leached within the first two leaching episodes. However,
the “new” DH shows a consistent spike in the readings for both major and trace
elements (as well as EC) in the second leachate sample but after that settles into a
rapidly decreasing trend for all. There are a number of possibilities that may explain
this phenomenon, including (a) it may be the result of either analytical error in the first
or second leachate sample; (b) it might be due to the speed at which the first flush
passed through the sample, causing modifications to the mechanical and/or hydraulic
properties of the material and resulting in the second flush collecting the majority of the
leachable elements (Gasparon pers. comm. 2004); or (c) in a similar manner to (b) it
may be derived from some (otherwise unidentifiable) inherent difference in the material
that saw the main release of elements into the leachate with the second flush of
leaching, rather than the first.
Both forms of DH PG released greater amounts of calcium and sulphate ions into the
leaching fluid than did HH (Figure 5.8). This may be at least partly due to HH retaining
more moisture due to completion of the HH DH hydrations process, particularly in the
first two leaching events (Figure 5.3).
TRACE ELEMENT METAL TRENDS, PG LEACHATE
0
50000
100000
150000
200000
250000
300000
350000
1 2 3 4 5Leaching Event
Mic
rogr
ams/
L
HH Al
DHN Al
DHO Al
HH Fe
DHN Fe
DHO Fe
HH M n
DHN M n
DHO M n
Figure 5.9. Example of trace element trends, PG leachate.
Examination of quantitative mineralogy of the leach column material post-leaching
showed dramatic falls in bassanite (CaSO4.0.5H2O) and anhydrite (CaSO4) for all
Page 159
columns (Table 4.21 and Figures 4.16 and 4.18). Dihydrate (CaSO4.2H2O) rose in both
the HH and the aged DH column but fell slightly in the newly deposited DH (as did all
other gypsum species in that column) (Table 4.21, Figure 4.17). Reaction of SiO2 to
leaching was variable, with a relative fall in the newly deposited DH and, negligibly, the
HH but a gain in the aged DH (Table 4.21, Figure 4.15). However, the XRF results for
the main elements (P2O5, SO3, CaO and SiO2) in Figure 4.19a and Table 4.22 show
slightly different results, with falls in P2O5 (probably through loss of relict phosphoric
acid) and SO3 and a rise in CaO for all samples, SiO2 again dropping in the newly-
deposited DH and rising for the other two columns. The leachate analyses show that the
dominant elements within the leachate are SO4 and Ca, along with Total P (Figure 5.8).
The changes from less-hydrated to fully hydrated species of gypsum during the course
of the leaching was expected as DH, the most stable of the hydrated species, is the end-
product of the addition of water to the more dehydrated species. The slight fall in DH
recorded in the newly-deposited DH column (a drop of 3.3%) may be the result of loss
of colloidal PG to the leachate fluid, slight dissolution of existing PG crystals due to
activation of the relict acids in the material by the input water (this DH had been
excavated from the rim ditch only a few minutes before sampling and was still very wet
with acid re-slurry water) or inaccuracies in measuring and/or mis-identification of the
material post-leaching.
The same column (newly-deposited DH) also recorded a slight post-leaching fall in
SiO2 in both XRF and XRD results, in contrast to the other two columns. The most
likely explanation for this is loss of some of the more soluble silica species to the
leachate. Figure 4.23 shows much higher levels of Si in the leachate during the first
flushing event, which tends to support the theory. Some soluble silicates are formed
during the acidulation process in the PAP, the most common of which are fluorosilicic
acid (H2SiF6), potassium fluorosilicate (K2SiF6) and sodium fluorosilicate (Na2SiF6).
The majority of these are discharged to the gypsum stack and this particular sample,
being fresh from the re-slurrying process and thus high in pore fluids, might be expected
to host relatively more soluble silicates than either the HH filtercake or the aged, dry
DH. The rise in SiO2 for the other two columns is probably a relative change as a result
of losses through dissolution of other species.
Page 160
The result of most concern is the post-leaching rise in CaO recorded by XRF in all the
gypsum columns (Table 4.22). With calcium and sulphate being recorded at similar
levels throughout the leaching process in all samples (Figures 4.24-4.26), enrichment of
CaO would not be expected to occur at the same time as depletion of SO3, as appears in
these results. Some additional sulphate may be removed through formation of H2SO4
with the addition of water to the columns but it is difficult to see how this could result in
relative enrichment levels of CaO of between 15.5% and 33.3%. This result appears to
almost certainly be the result of analytical error, incorrect calibration or contamination
but will require follow-up in the future if in-pit disposal trials were to go ahead.
Tables 4.17 and 4.19 show some unexpected results. These are the apparent enrichment
of Ti in all columns, Pb in both the HH and new DH columns and, in the latter column
only, of Sc and Sr. Apparent enrichment of both Ba and Cr was also recorded in the
aged DH column. There are a number of possible explanations for this result. The first
is that it is simple analytical error: this is certainly possible for the Sc (4ppm pre-
dissolution compared to 5ppm post-dissolution) and Sr (354ppm before compared to
367ppm after) results but less likely for others, such as Pb in the Gyp_N sample which
shows an increase of >100%, from 10ppm pre-dissolution to 21ppm post-dissolution.
A second possibility is that there was an interpretation error as the laboratory results
point out that the following overlaps can occur in the affected elements: Ce and Ti wth
Ba; V and La with Cr; As and Y with Pb; Ca with Sc; Co, Cu and Zr with Sr; Ba and
V with Ti and Sr or Ba with Zr. The third option is that the enrichment is relative rather
than an absolute. In this case, the actual physical amount of the element does not
actually change after leaching but its percentage of the volume of the remaining
material increases due to the loss of other elements (such as, for example, Mn or Ni).
Any or all of these factors may have played a part in producing the results and it is an
area that may require further work in the future.
5.8 Radionuclides
Radionuclides are a major source of concern with foreign PG, particularly radium and
radon. In 2000 WMCF commissioned the Australian Nuclear Science and Technology
Organisation (ANSTO) to examine a number of areas on the site for radioactivity.
Page 161
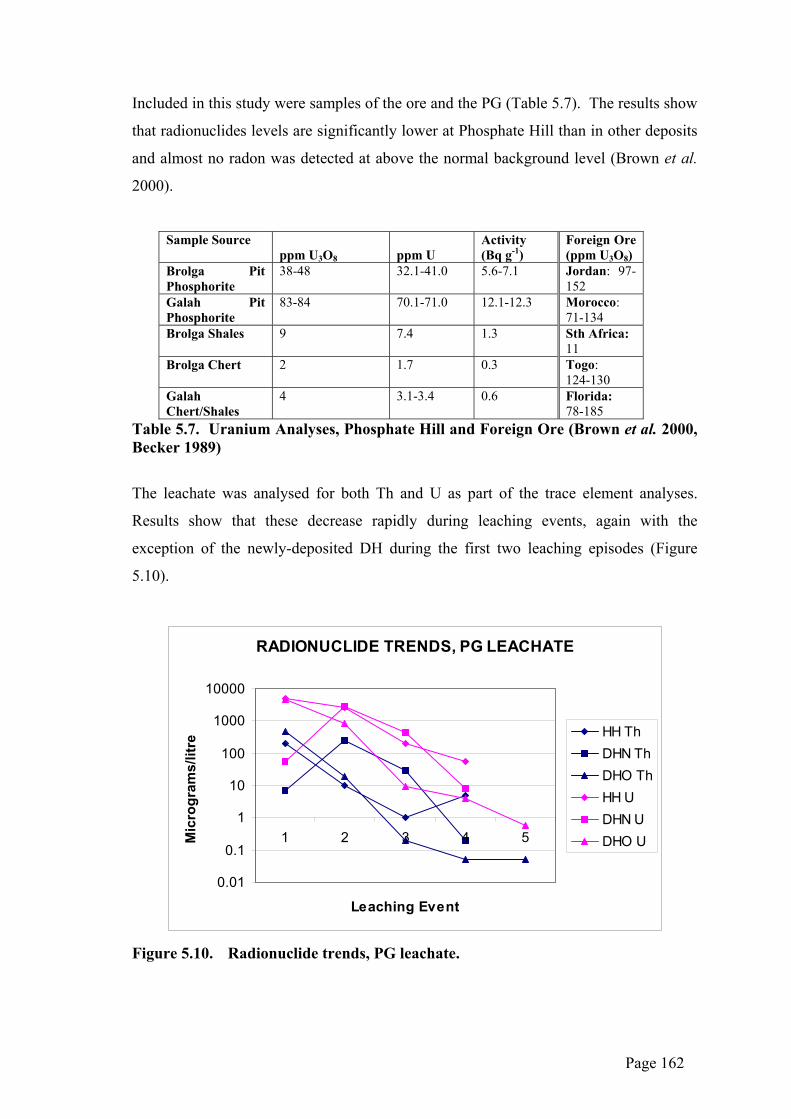
Included in this study were samples of the ore and the PG (Table 5.7). The results show
that radionuclides levels are significantly lower at Phosphate Hill than in other deposits
and almost no radon was detected at above the normal background level (Brown et al.
2000).
Sample Source
ppm U3O8
ppm U
Activity (Bq g-1)
Foreign Ore (ppm U3O8)
Brolga Pit Phosphorite
38-48 32.1-41.0 5.6-7.1 Jordan: 97-152
Galah Pit Phosphorite
83-84 70.1-71.0 12.1-12.3 Morocco: 71-134
Brolga Shales 9 7.4 1.3 Sth Africa: 11
Brolga Chert 2 1.7 0.3 Togo: 124-130
Galah Chert/Shales
4 3.1-3.4 0.6 Florida: 78-185
Table 5.7. Uranium Analyses, Phosphate Hill and Foreign Ore (Brown et al. 2000, Becker 1989)
The leachate was analysed for both Th and U as part of the trace element analyses.
Results show that these decrease rapidly during leaching events, again with the
exception of the newly-deposited DH during the first two leaching episodes (Figure
5.10).
RADIONUCLIDE TRENDS, PG LEACHATE
0.01
0.1
1
10
100
1000
10000
1 2 3 4 5
Leaching Event
Mic
rogr
ams/
litre
HH ThDHN ThDHO ThHH UDHN UDHO U
Figure 5.10. Radionuclide trends, PG leachate.
Page 162
Follow-up testing for specific radionuclides U-238, Po-210, Pb-210, Ra-226 and radon
in both phases of the PG slurry was undertaken in 2003 and the samples analysed by the
same team, and methods, at ANSTO as had been responsible for the initial study in
2000. These results show that there is little change in the levels of radionuclides in the
solid component (Figure 4.30). However, there is a dramatic rise in levels in the liquid
component, derived from the recirculated process water used in the re-slurry tank
(Figure 4.31). Discussions with the staff at ANSTO confirmed that the increase in
radionuclide levels in the liquid component was probably due to the recirculation of the
fluid through the stacking system, as this is known to act as a form of concentration for
these elements (Brown pers. comm. 2003). This is an issue that has not previously been
identified at Phosphate Hill and does not appear in the literature for other sites. It may
require further monitoring over the life of the WMCF operation to maintain
radionuclides at a safe level in the stack liquors.
Radon was detected in both the 2000 (0.6-1.4 Bq m-2 s-1) and 2003 (1.1 ± 0.2 Bq/kg/hr
or 0.03 picoCuries) studies. Rn-222 is a suspected human carcinogen with cumulative,
long-term indoor exposure, particularly when combined with the effects of tobacco
smoking (USEPA 1998). However, the very low levels at Phosphate Hill are not
expected to result in any health or environmental problems as the measurements are
well below the current USEPA action level of 148 Bq/m3 or 4 pCi/L-1 (USEPA 1998)
and the gas is able to disperse into the atmosphere. Other studies (e.g. Burnett and
Elzermann 2001, Nifong 1998) have suggested that PG stacks may in fact act as a sink
for this particular radionuclide (through the action of sorbtion by PG surfaces) and for
U-238 and Pb-210 (through complexing with sulphate and phosphate) rather than as a
source of pollution.
5.9 Potential for Use of PG as Mine Backfill
The primary purpose of this research project as defined by WMCF was to characterise
the PG solids and liquid to provide a base-line for future research on the material. The
secondary aim was to provide an initial determination on the potential to use the PG as
mine backfill. The current expected mine life at Phosphate Hill is in the vicinity of 30
years. Over that period a projected 60 million tonnes of ore will be extracted (at current
mining rates of approximately two million tonnes per year) after the removal of a
Page 163
significantly larger amount of overburden. This will leave voids ranging from three
metres to 60 metres deep over areas of several square kilometres. With PG being
produced at similar volumes it seems a logical step to utilise the voids as storage for
future PG production.
PG is currently being stored in above ground stacks (Plates 1.2, 2.1, 3.1, 4.1, 5.1) built
using the wet stacking, or pond-and-pile technique (Figure 2.18). The footprints of
these stacks cover many hectares and stack heights can reach over 25m (in the case of
Cells 1 and 2) or up to 70m (the planned final height of the currently active stack, Cell
4). Although the stacks are wet during construction, once they reach completion they
gradually dry out with excess fluid being gradually drained via underdrains into the
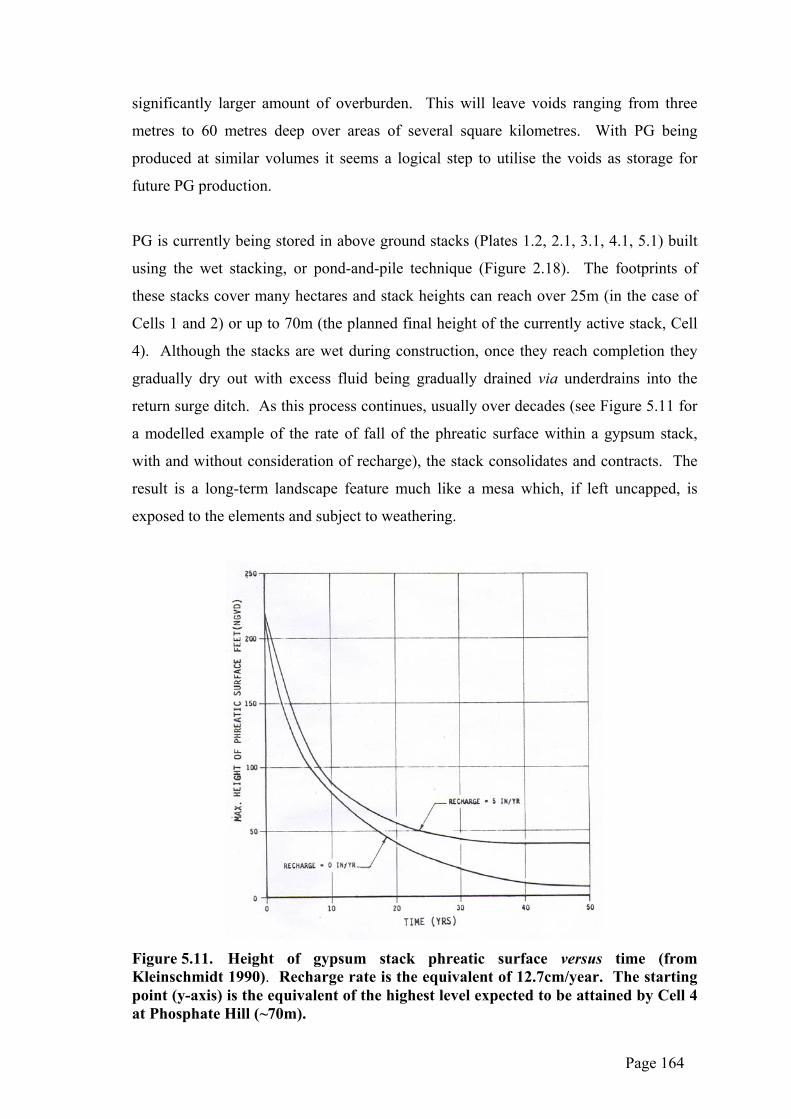
return surge ditch. As this process continues, usually over decades (see Figure 5.11 for
a modelled example of the rate of fall of the phreatic surface within a gypsum stack,
with and without consideration of recharge), the stack consolidates and contracts. The
result is a long-term landscape feature much like a mesa which, if left uncapped, is
exposed to the elements and subject to weathering.
Figure 5.11. Height of gypsum stack phreatic surface versus time (from Kleinschmidt 1990). Recharge rate is the equivalent of 12.7cm/year. The starting point (y-axis) is the equivalent of the highest level expected to be attained by Cell 4 at Phosphate Hill (~70m).
Page 164
Federal and state legislative requirements now oblige mining companies to put in place
decommissioning and closure strategies for all mine sites that meet the requirements of
government environmental organisations (Burke 2002). The WMCF closure and
rehabilitation strategy for the gypsum storage facilities (GSF) on site (Schultz 2003)
states two major objectives:
“To leave the site in a safe and stable condition that will not pose a threat to the people
or the environment…or…
“The closure and rehabilitation shall ensure that the facility will remain safe, stable and
aesthetically acceptable after closure.”
“Safe” is defined as “the contents retained within the facility after closure will not be
released in an uncontrolled manner, cannot pollute the surrounding environment and
cannot harm anyone in the proximity of the closed GSF”. “Stable” is defined as “all
earthen structures erode … closed facilities are deemed to be stable if they release
materials in a controlled manner”, with “controlled release” being defined as “release of
stored materials at rates below a level likely to cause [environmental health and safety]
impacts”. “Aesthetic” refers to the facility’s potential to mimic natural landforms.
There are many hazards associated with the weathering of a PG stack such as those that
currently exist at Phosphate Hill. Among them, a recent (July 2003) WMCF PG stack
closure workshop held to formulate strategies to meet the Company’s stack closure
strategy identified the following issues as being of the most importance:
• airborne pollution in the form of fine PG dust affecting local flora and fauna;
• acid effluent from the stack (whether derived from original stack fluids or leachate
after extreme rain events) percolating into the local surface and groundwater
systems; and
• severe erosion channels leading to potential slumping failure of large sections of the
stack.
Page 165
PG is very susceptible to erosion, particularly from the tropical intensity rain events that
occur during the wet season at Phosphate Hill (Burke 2002). However, most of the
erosion hazards can be either minimised or avoided by sufficient capping of the stacks,
with combinations of geofabric and topsoil, or Inca Shale, both having been suggested
(Burke 2002), although such a capping operation would be on a large-scale and could
exacerbate the problems of dust and erosion while it was being carried out. Capping of
some sort will be necessary as the raw DH in the stack is hostile to plant growth due to
its acid content and so direct vegetation of the surface to control erosion is not likely to
succeed in the foreseeable future (Burke 2002).
Concerns have existed since before operations began in 1999 about the potential escape
of contaminated fluids from the stacking area, especially in the long term (centuries) as
the integrity of the liner is not guaranteed over that time scale (Burke 2002). Slow
drainage of the fluids contained within the stack is expected to last for decades (refer to
Figure 5.11 above) and the local rainfall is not of sufficient volume to quickly leach any
stockpiled PG (unlike the conditions in Florida), especially when combined with the
high evaporation rates in the area, so the drainage and leaching of highly acidic fluids is
expected to continue for, possibly, centuries to come (Burke 2002).
Both Schultz 2003 and Burke 2002 outline research targets for WMCF in relation to
gypsum stack closure, amongst which is the examination of neutralising agents to be
placed either below the lining or between the PG and any capping material on any
future gypsum storage facilities to assist neutralisation of any leachate escaping from
the facility. The neutralising agents include the use of phosphatic sands drawn from
dried slimes dam tailing, crushed Inca Shale, crushed Lower Siltstone Member and low-
grade phosphate rock. Results of initial testing on the first three options suggest that the
phosphate sands are the best neutralising material available on site, with an assessed
capacity of 24kg H2SO4/tonne. However, both LSM and Inca Shale also held
neutralising capacity of 17/14 kg H2SO4/tonne respectively so any of these materials
will be suitable (Schultz 2002).
The use of in-pit disposal, however, would immediately negate two of the three major
hazards because the stacked PG would be no higher than natural land surface, largely
avoiding problems with erosion and airborne pollution. The only remaining
Page 166
consideration would be that of contaminated fluids from the PG entering the
surrounding ecosystems. This study assumes that the pit voids contain no other
material, are not lined or capped and that the PG fills the entire area up to the surface
level but does not project above it to minimise erosion.
The major problem associated with in-pit disposal of PG relates to the position of the
local aquifer, the Duchess Embayment Aquifer (DEA) (Figure 2.8), vis-a-vis that of the
voids exposed by mining. This aquifer, which provides all the water requirements of
the site, occupies the same geological strata as the ore body and its footwall (i.e. the
siliceous facies of the Beetle Creek Formation – see section 2.4). The standing water
level (SWL) is currently 30-35m below surface (at ~229mRL) and, although it will fall
significantly during the life of the mine, the SWL is expected to recover to its pre-
mining levels of between 234mRL and 235mRL in the long term (decades) after mining
and fertilizer production ceases.
A secondary consideration is the potential for complete inundation of the back-filled
pits by flood events. In 1974 Galah Pit was filled to a depth of several metres (Plate
5.2) after what is estimated to be a 1:2 year flood event of Kolar Creek (PPK 2000).
Although the pit voids are now bunded to a height sufficient to protect them from the
projections for a 1:100 year flood, inundation will inevitably occur when the bunds are
breached through erosion or other causes. Rainfall on its own is not considered to be of
major concern with in-pit disposal due to its relatively low annual levels in a high-
evaporation, arid environment. However, it may still have potential to mobilise leachate
within the PG fill through infiltration via ponding in low-lying areas of the surface
and/or through surface cracking developed during drying. For the purposes of this
study a worst-case scenario of complete or near-complete inundation of the backfill by
water from either the aquifer or a major flood event was assumed.
Page 167
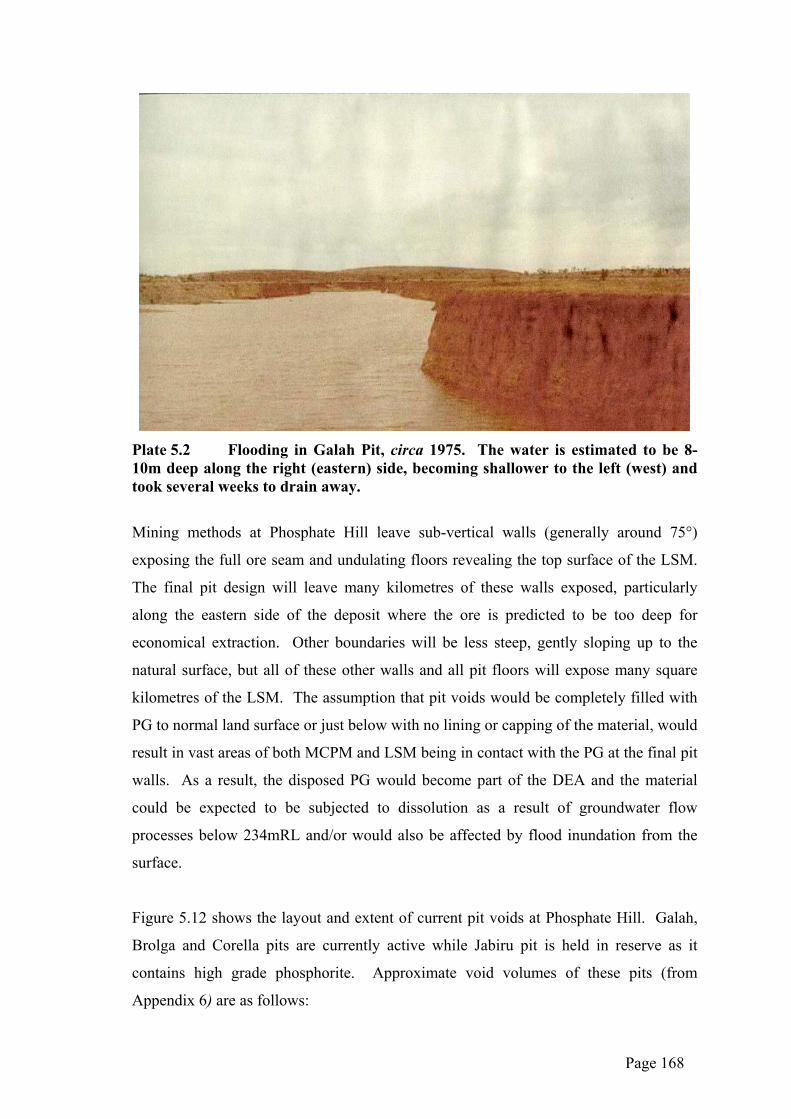
Plate 5.2 Flooding in Galah Pit, circa 1975. The water is estimated to be 8-10m deep along the right (eastern) side, becoming shallower to the left (west) and took several weeks to drain away.
Mining methods at Phosphate Hill leave sub-vertical walls (generally around 75°)
exposing the full ore seam and undulating floors revealing the top surface of the LSM.
The final pit design will leave many kilometres of these walls exposed, particularly
along the eastern side of the deposit where the ore is predicted to be too deep for
economical extraction. Other boundaries will be less steep, gently sloping up to the
natural surface, but all of these other walls and all pit floors will expose many square
kilometres of the LSM. The assumption that pit voids would be completely filled with
PG to normal land surface or just below with no lining or capping of the material, would
result in vast areas of both MCPM and LSM being in contact with the PG at the final pit
walls. As a result, the disposed PG would become part of the DEA and the material
could be expected to be subjected to dissolution as a result of groundwater flow
processes below 234mRL and/or would also be affected by flood inundation from the
surface.
Figure 5.12 shows the layout and extent of current pit voids at Phosphate Hill. Galah,
Brolga and Corella pits are currently active while Jabiru pit is held in reserve as it
contains high grade phosphorite. Approximate void volumes of these pits (from
Appendix 6) are as follows:
Page 168
1. Galah Pit 15,967,000m3
2. Brolga Pit 8,885,000m3
3. Corella Pit 2,883,000m3
4. Jabiru Pit 3,226,000m3
This provides a total void volume of 30,961,000m3 in which to potentially store PG,
considerably more than is currently held in the existing stacks (approximately
9,000,000m3). A fifth mining area, Magpie Pit, is scheduled for commencement in
2004, north-west of Corella. This will add a volume similar to that of the current
Brolga Pit. Of this total area, less than 10% is currently exposed to groundwater (Figure
5.12) but the area so exposed will increase with the expansion of the pits into deeper ore
zones.
Approximately 23,760,000m3 of overburden (Inca Shale with minor alluvium) has been
removed from the pit voids to expose the ore. Of that, ~16,038,000m3 is stored in waste
stockpiles located close to the source pits and the remainder (~7,722,000m3) is stored in
in-pit waste stockpiles (Figure 5.12). The waste material will remain where it is and
will be rehabilitated using engineering and seeding with local native vegetation to
reduce runoff. Use of in-pit storage for waste is due to a lack of available space inside
the current mine lease to expand existing storage facilities or construct new ones and
has reduced the volume potentially available for PG storage to around 23,240,000m3.
Negotiations are planned with local land-owners to obtain more land for overburden
stockpiles but the issue is not expected to reach a resolution in the short-medium-term
(<10 years).
Currently existing and planned expansions to the presently available gypsum stacks
have a capacity of about the same time frame (<10 years) so in-pit disposal will not
occur within that period. By the time that the negotiations for extra land are completed
and the current stacks are nearing capacity mining will have moved into the deeper
areas of the ore body that are currently submerged between Brolga and Corella pits
(Figures 5.12 and 5.13). Despite the lack of interaction with the current SWL, this
expansion and coalescing of the mines in the long term, followed by aquifer recovery
after pumping ceases, will result in significant areas of fill being flooded by
Page 169
groundwater. An example of this is shown in Figure 5.13 which is a north-south section
along 93200E showing areas that will be targeted for mining between 2010 and 2020.
The area will be dewatered and the final pit floor will follow the contours of the
footwall. Not only will this area be substantially affected by recovering groundwater
levels after current mining activities are scheduled for completion around 2030 (Figure
5.12) but PPK 2000 states that the area would be at risk of inundation during the course
of 1:10 or greater flood event.
Page 170
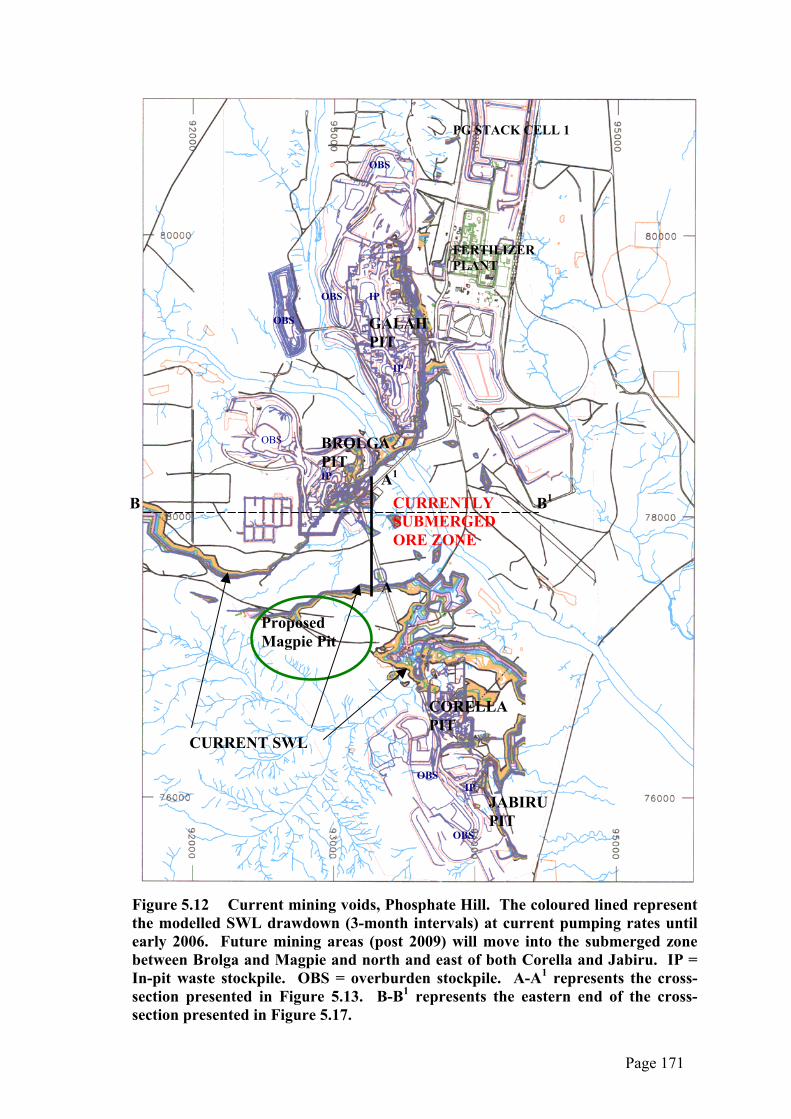
PG STACK CELL 1
OBS
FERTILIZER PLANT
IP OBS
GALAH PIT
OBS
IP
BROLGA PIT IP A1
OBS
B1 CURRENTLY SUBMERGED ORE ZONE
B
A
Proposed Magpie Pit
CORELLA PIT
CURRENT SWL
OBS IP
JABIRU PIT
OBS
Figure 5.12 Current mining voids, Phosphate Hill. The coloured lined represent the modelled SWL drawdown (3-month intervals) at current pumping rates until early 2006. Future mining areas (post 2009) will move into the submerged zone between Brolga and Magpie and north and east of both Corella and Jabiru. IP = In-pit waste stockpile. OBS = overburden stockpile. A-A1 represents the cross-section presented in Figure 5.13. B-B1 represents the eastern end of the cross-section presented in Figure 5.17.
Page 171
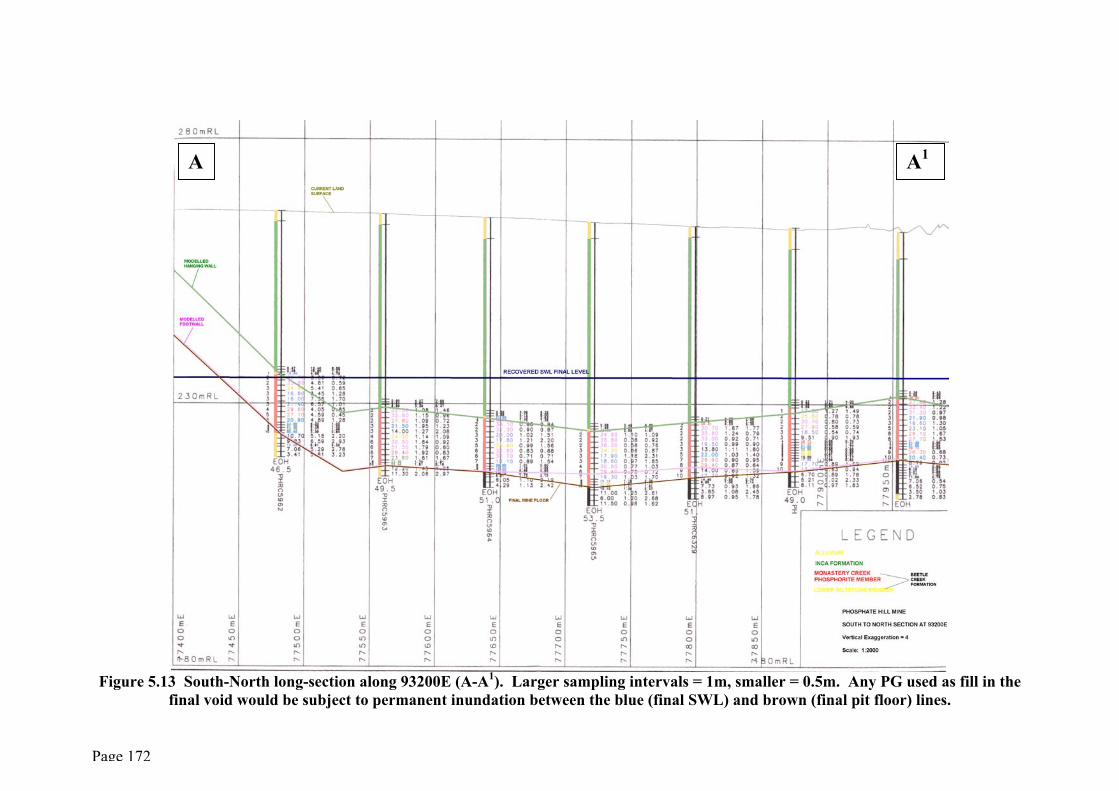
A1A
Figure 5.13 South-North long-section along 93200E (A-A1). Larger sampling intervals = 1m, smaller = 0.5m. Any PG used as fill in the final void would be subject to permanent inundation between the blue (final SWL) and brown (final pit floor) lines.
Page 172
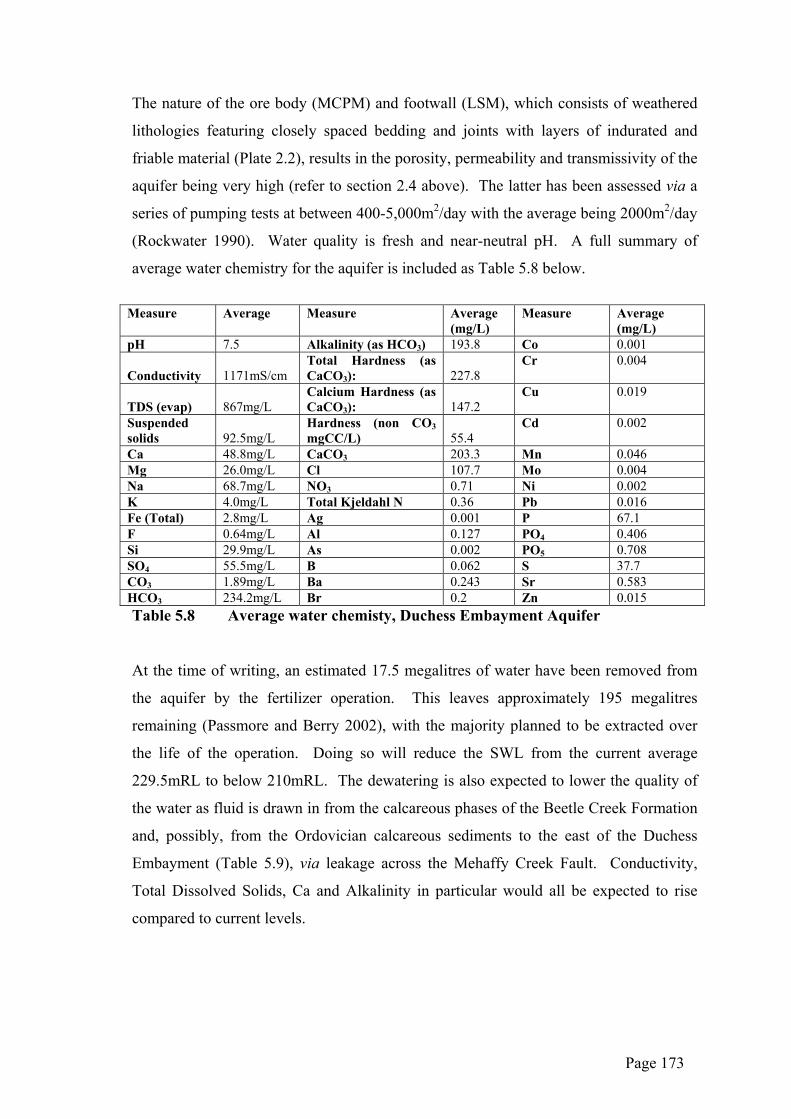
The nature of the ore body (MCPM) and footwall (LSM), which consists of weathered
lithologies featuring closely spaced bedding and joints with layers of indurated and
friable material (Plate 2.2), results in the porosity, permeability and transmissivity of the
aquifer being very high (refer to section 2.4 above). The latter has been assessed via a
series of pumping tests at between 400-5,000m2/day with the average being 2000m2/day
(Rockwater 1990). Water quality is fresh and near-neutral pH. A full summary of
average water chemistry for the aquifer is included as Table 5.8 below.
Measure Average Measure Average
(mg/L) Measure Average
(mg/L) pH 7.5 Alkalinity (as HCO3) 193.8 Co 0.001 Conductivity
1171mS/cm
Total Hardness (as CaCO3):
227.8
Cr 0.004
TDS (evap)
867mg/L
Calcium Hardness (as CaCO3):
147.2
Cu 0.019
Suspended solids
92.5mg/L
Hardness (non CO3 mgCC/L)
55.4
Cd 0.002
Ca 48.8mg/L CaCO3 203.3 Mn 0.046 Mg 26.0mg/L Cl 107.7 Mo 0.004 Na 68.7mg/L NO3 0.71 Ni 0.002 K 4.0mg/L Total Kjeldahl N 0.36 Pb 0.016 Fe (Total) 2.8mg/L Ag 0.001 P 67.1 F 0.64mg/L Al 0.127 PO4 0.406 Si 29.9mg/L As 0.002 PO5 0.708 SO4 55.5mg/L B 0.062 S 37.7 CO3 1.89mg/L Ba 0.243 Sr 0.583 HCO3 234.2mg/L Br 0.2 Zn 0.015 Table 5.8 Average water chemisty, Duchess Embayment Aquifer
At the time of writing, an estimated 17.5 megalitres of water have been removed from
the aquifer by the fertilizer operation. This leaves approximately 195 megalitres
remaining (Passmore and Berry 2002), with the majority planned to be extracted over
the life of the operation. Doing so will reduce the SWL from the current average
229.5mRL to below 210mRL. The dewatering is also expected to lower the quality of
the water as fluid is drawn in from the calcareous phases of the Beetle Creek Formation
and, possibly, from the Ordovician calcareous sediments to the east of the Duchess
Embayment (Table 5.9), via leakage across the Mehaffy Creek Fault. Conductivity,
Total Dissolved Solids, Ca and Alkalinity in particular would all be expected to rise
compared to current levels.
Page 173
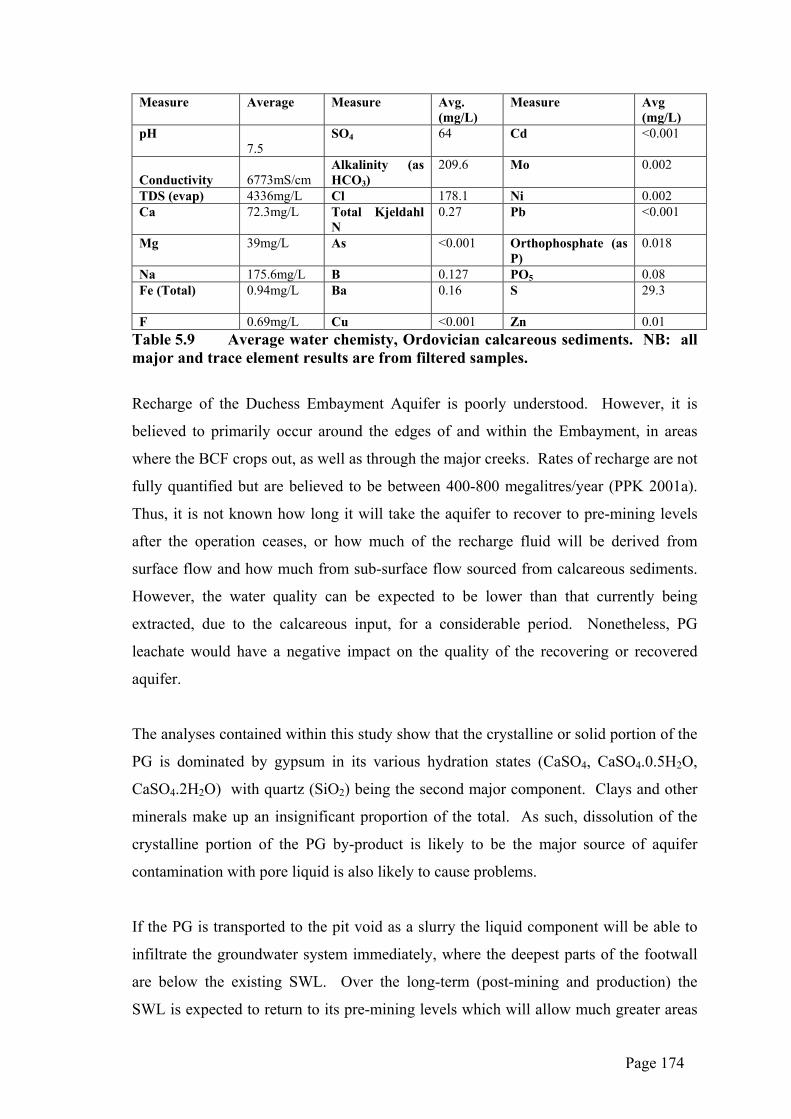
Measure Average Measure Avg. (mg/L)
Measure Avg (mg/L)
pH 7.5
SO4 64 Cd <0.001
Conductivity
6773mS/cm
Alkalinity (as HCO3)
209.6 Mo 0.002
TDS (evap) 4336mg/L Cl 178.1 Ni 0.002 Ca 72.3mg/L Total Kjeldahl
N 0.27 Pb <0.001
Mg 39mg/L As <0.001 Orthophosphate (as P)
0.018
Na 175.6mg/L B 0.127 PO5 0.08 Fe (Total) 0.94mg/L Ba 0.16 S 29.3
F 0.69mg/L Cu <0.001 Zn 0.01 Table 5.9 Average water chemisty, Ordovician calcareous sediments. NB: all major and trace element results are from filtered samples.
Recharge of the Duchess Embayment Aquifer is poorly understood. However, it is
believed to primarily occur around the edges of and within the Embayment, in areas
where the BCF crops out, as well as through the major creeks. Rates of recharge are not
fully quantified but are believed to be between 400-800 megalitres/year (PPK 2001a).
Thus, it is not known how long it will take the aquifer to recover to pre-mining levels
after the operation ceases, or how much of the recharge fluid will be derived from
surface flow and how much from sub-surface flow sourced from calcareous sediments.
However, the water quality can be expected to be lower than that currently being
extracted, due to the calcareous input, for a considerable period. Nonetheless, PG
leachate would have a negative impact on the quality of the recovering or recovered
aquifer.
The analyses contained within this study show that the crystalline or solid portion of the
PG is dominated by gypsum in its various hydration states (CaSO4, CaSO4.0.5H2O,
CaSO4.2H2O) with quartz (SiO2) being the second major component. Clays and other
minerals make up an insignificant proportion of the total. As such, dissolution of the
crystalline portion of the PG by-product is likely to be the major source of aquifer
contamination with pore liquid is also likely to cause problems.
If the PG is transported to the pit void as a slurry the liquid component will be able to
infiltrate the groundwater system immediately, where the deepest parts of the footwall
are below the existing SWL. Over the long-term (post-mining and production) the
SWL is expected to return to its pre-mining levels which will allow much greater areas
Page 174
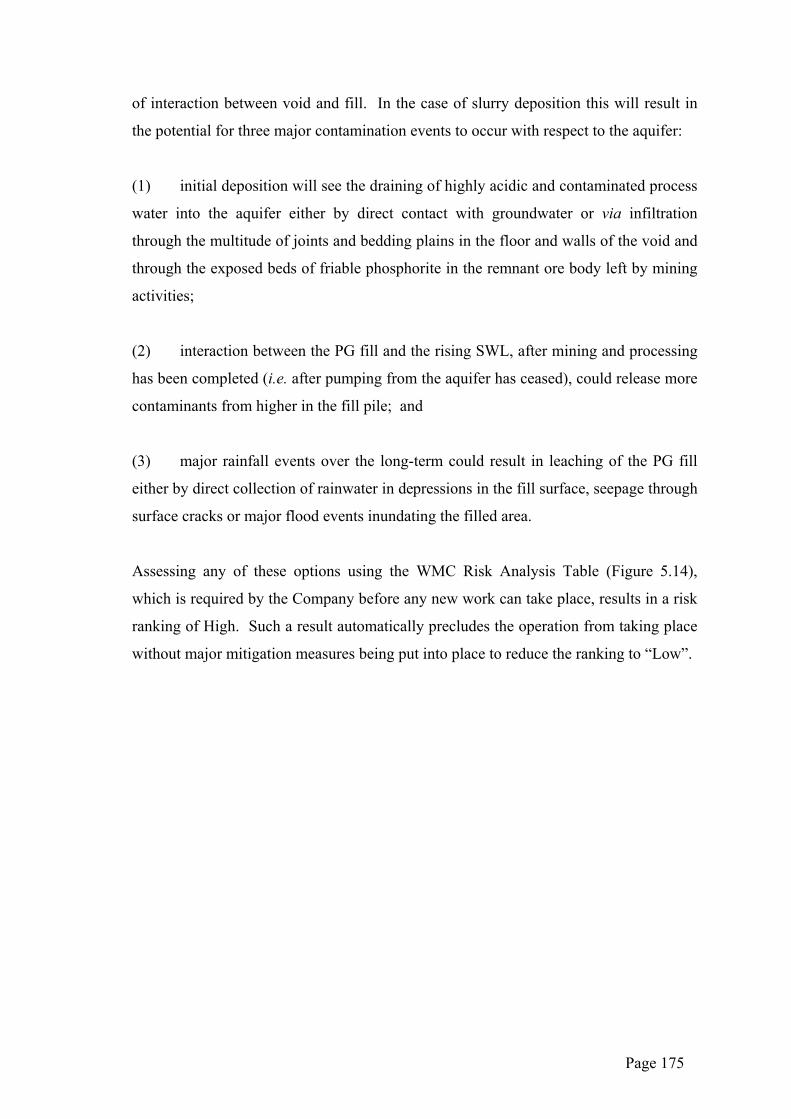
of interaction between void and fill. In the case of slurry deposition this will result in
the potential for three major contamination events to occur with respect to the aquifer:
(1) initial deposition will see the draining of highly acidic and contaminated process
water into the aquifer either by direct contact with groundwater or via infiltration
through the multitude of joints and bedding plains in the floor and walls of the void and
through the exposed beds of friable phosphorite in the remnant ore body left by mining
activities;
(2) interaction between the PG fill and the rising SWL, after mining and processing
has been completed (i.e. after pumping from the aquifer has ceased), could release more
contaminants from higher in the fill pile; and
(3) major rainfall events over the long-term could result in leaching of the PG fill
either by direct collection of rainwater in depressions in the fill surface, seepage through
surface cracks or major flood events inundating the filled area.
Assessing any of these options using the WMC Risk Analysis Table (Figure 5.14),
which is required by the Company before any new work can take place, results in a risk
ranking of High. Such a result automatically precludes the operation from taking place
without major mitigation measures being put into place to reduce the ranking to “Low”.
Page 175
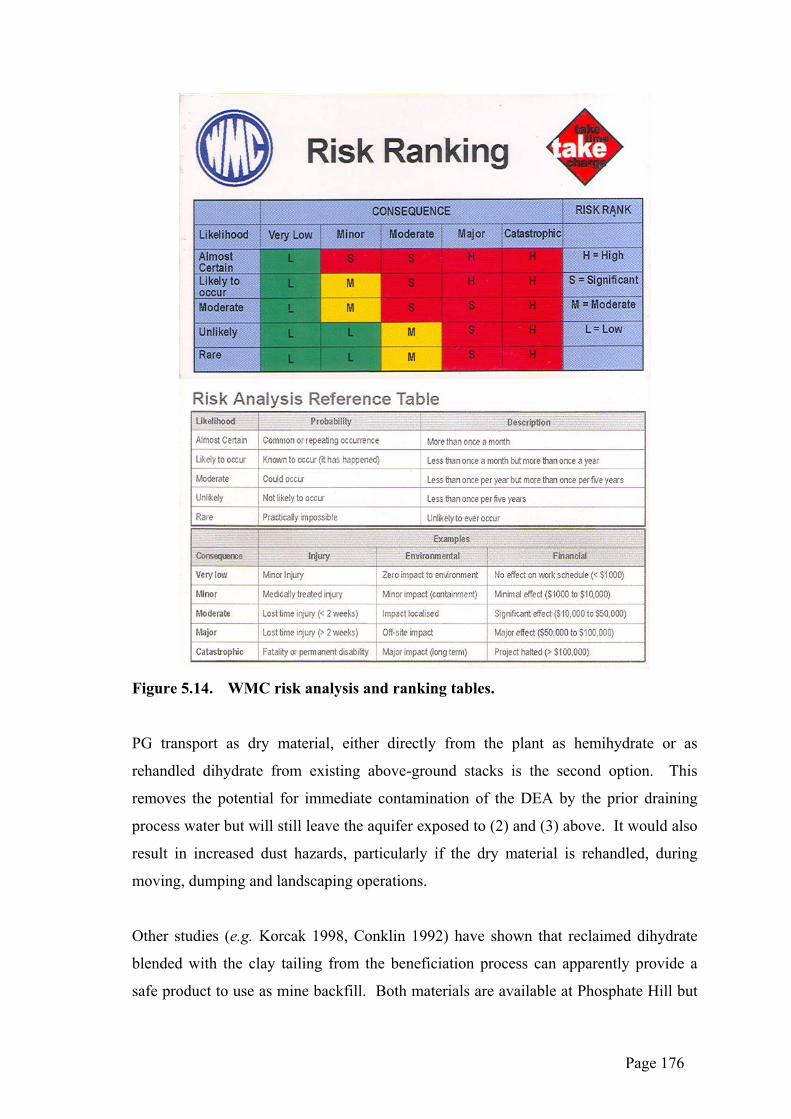
Figure 5.14. WMC risk analysis and ranking tables.
PG transport as dry material, either directly from the plant as hemihydrate or as
rehandled dihydrate from existing above-ground stacks is the second option. This
removes the potential for immediate contamination of the DEA by the prior draining
process water but will still leave the aquifer exposed to (2) and (3) above. It would also
result in increased dust hazards, particularly if the dry material is rehandled, during
moving, dumping and landscaping operations.
Other studies (e.g. Korcak 1998, Conklin 1992) have shown that reclaimed dihydrate
blended with the clay tailing from the beneficiation process can apparently provide a
safe product to use as mine backfill. Both materials are available at Phosphate Hill but
Page 176
the tailings are produced at much lower volumes than the PG and so it is doubtful that
there would be sufficient clays to blend with all of the PG. The studies also made no
mention of interaction of the fill material with water and thus did not discuss possible
sulphate contamination of groundwaters.
There are a number of studies available which purport to look at the interaction between
PG and groundwater (e.g. Burnett and Elzerman 2001, Nifong 1998, Rechcigl et al.
1998). However, they tend to concentrate on the potential pollution from radionuclides
and/or heavy metals contained within the PG which the Phosphate Hill results suggest
will not be a major issue at this site. Sulphate or acid contamination sourced from the
gypsum itself appears to be rarely considered, although Nifong and Harris (1993) have
results that suggest some sulphate contamination of the local groundwater has occurred
in the vicinity of roads used as trial sites for PG as road-base but the authors appear
ambivalent about stating the source of the sulphate.
It is known that gypsum is soluble in fresh water (equilibrium equation: CaSO4.2H2O
Ca2+ + SO42- + 2H2O), and that PG is more soluble than natural gypsum (Table 5.1)
(Anon 2004a, Boumphey 2001, Noble and Randall 1998). This is attributed to being
the result of the morphology and small size of the PG crystals and the impact of relict
free acids contained within the pore spaces (Boumphey 2001, Noble and Randall 1998).
The dissolution rate appears to be dependent on the rate at which fluid passed through
the material (and could thus remove the Ca and sulphate ions from their source) as well
as Eh and pH (Christiansen 2004, Boumphey 2001). Saturation levels begin in pure
water at >1000mg/L SO42- (Anon 2004a).
Much of the initial surface or groundwater that would interact with PG used as fill
would be absorbed by the PG, as demonstrated in the dissolution columns. In the long
term, those reactions would reach equilibrium but some dissolution would continue.
The columns also show that the majority of contaminants would be released in the first
few leaching events. On the scale of fill proposed here (>60 million tonnes) combined
with the seasonal nature of the rainfall and the high evaporation rates in the area those
initial leaching events could take decades or centuries to neutralise the PG.
Page 177
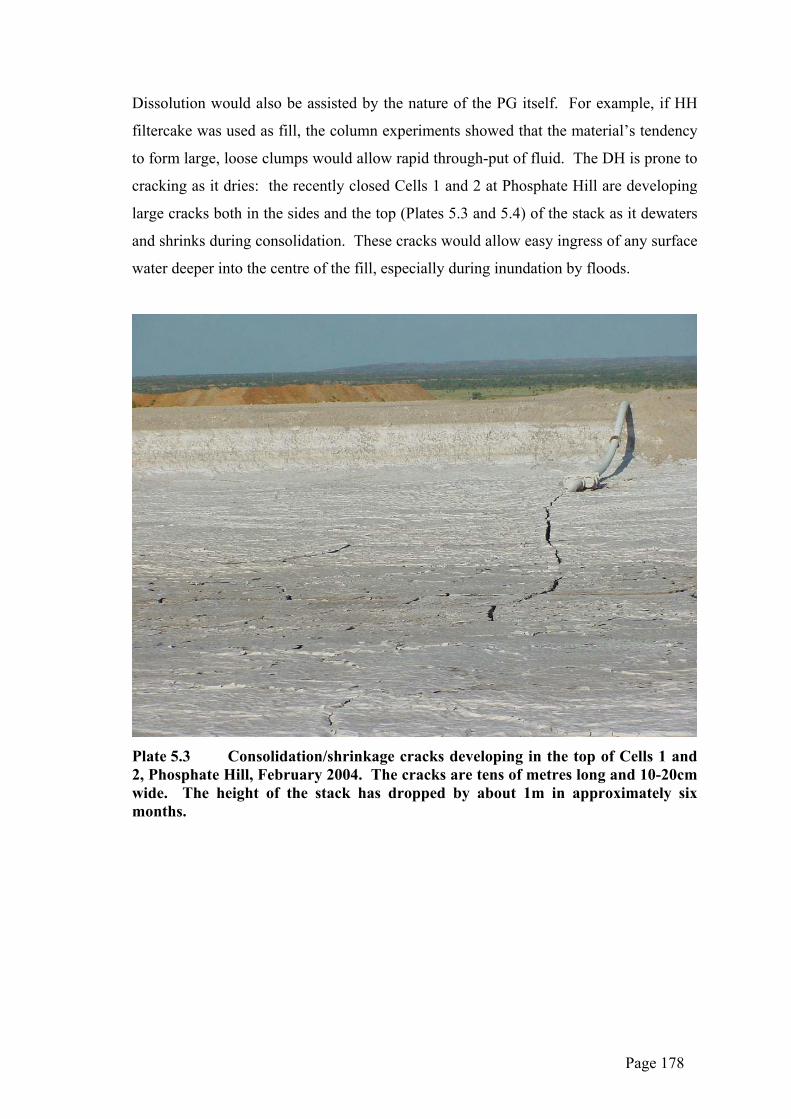
Dissolution would also be assisted by the nature of the PG itself. For example, if HH
filtercake was used as fill, the column experiments showed that the material’s tendency
to form large, loose clumps would allow rapid through-put of fluid. The DH is prone to
cracking as it dries: the recently closed Cells 1 and 2 at Phosphate Hill are developing
large cracks both in the sides and the top (Plates 5.3 and 5.4) of the stack as it dewaters
and shrinks during consolidation. These cracks would allow easy ingress of any surface
water deeper into the centre of the fill, especially during inundation by floods.
Plate 5.3 Consolidation/shrinkage cracks developing in the top of Cells 1 and 2, Phosphate Hill, February 2004. The cracks are tens of metres long and 10-20cm wide. The height of the stack has dropped by about 1m in approximately six months.
Page 178
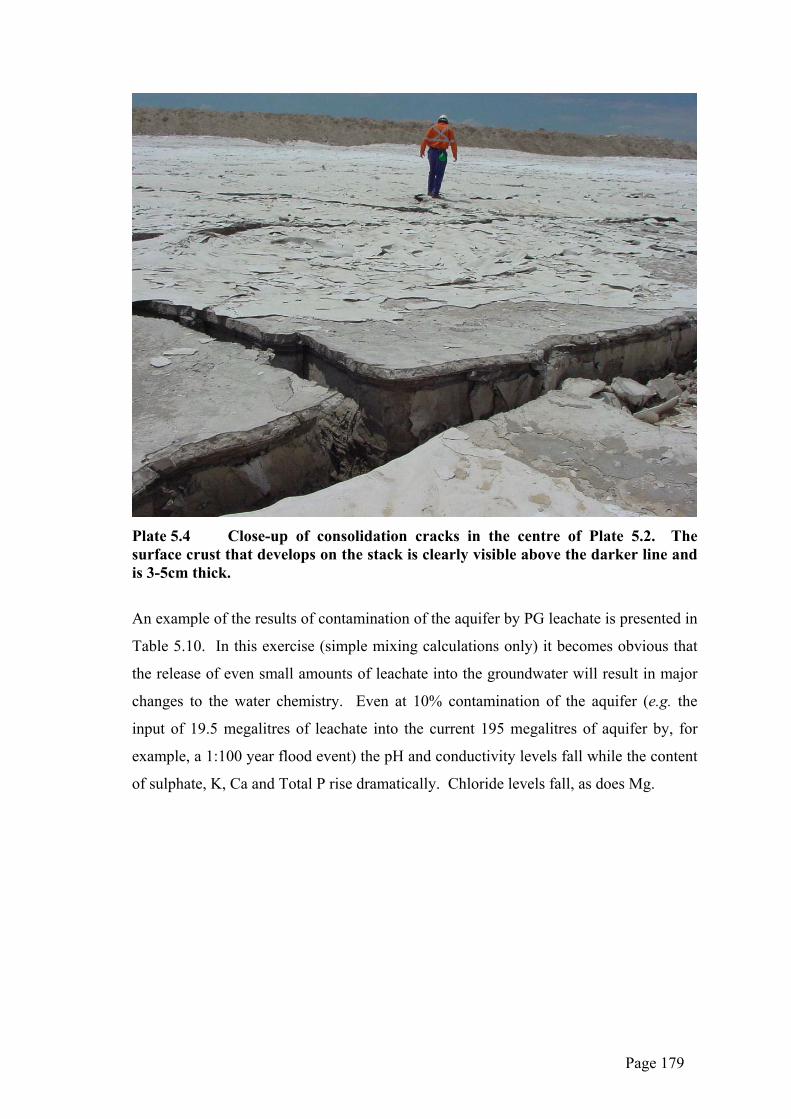
Plate 5.4 Close-up of consolidation cracks in the centre of Plate 5.2. The surface crust that develops on the stack is clearly visible above the darker line and is 3-5cm thick.
An example of the results of contamination of the aquifer by PG leachate is presented in
Table 5.10. In this exercise (simple mixing calculations only) it becomes obvious that
the release of even small amounts of leachate into the groundwater will result in major
changes to the water chemistry. Even at 10% contamination of the aquifer (e.g. the
input of 19.5 megalitres of leachate into the current 195 megalitres of aquifer by, for
example, a 1:100 year flood event) the pH and conductivity levels fall while the content
of sulphate, K, Ca and Total P rise dramatically. Chloride levels fall, as does Mg.
Page 179
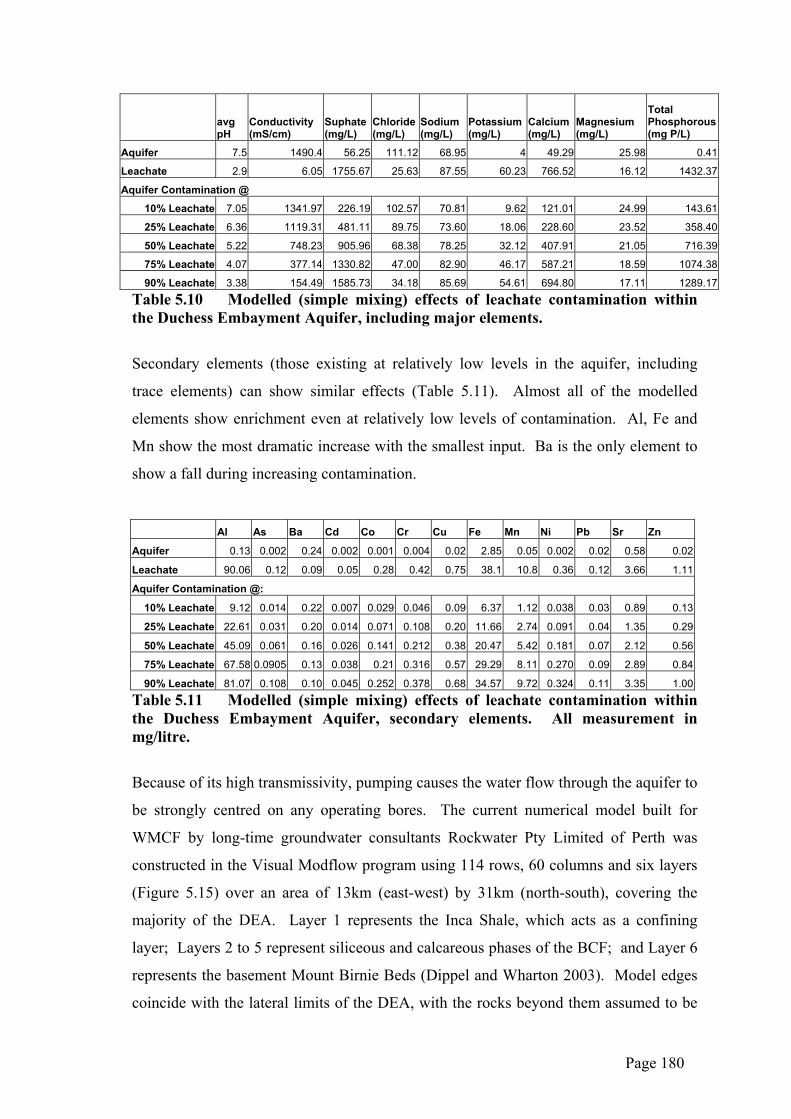
avg pH
Conductivity (mS/cm)
Suphate (mg/L)
Chloride (mg/L)
Sodium (mg/L)
Potassium (mg/L)
Calcium (mg/L)
Magnesium (mg/L)
Total Phosphorous (mg P/L)
Aquifer 7.5 1490.4 56.25 111.12 68.95 4 49.29 25.98 0.41
Leachate 2.9 6.05 1755.67 25.63 87.55 60.23 766.52 16.12 1432.37
Aquifer Contamination @
10% Leachate 7.05 1341.97 226.19 102.57 70.81 9.62 121.01 24.99 143.61
25% Leachate 6.36 1119.31 481.11 89.75 73.60 18.06 228.60 23.52 358.40
50% Leachate 5.22 748.23 905.96 68.38 78.25 32.12 407.91 21.05 716.39
75% Leachate 4.07 377.14 1330.82 47.00 82.90 46.17 587.21 18.59 1074.38
90% Leachate 3.38 154.49 1585.73 34.18 85.69 54.61 694.80 17.11 1289.17Table 5.10 Modelled (simple mixing) effects of leachate contamination within the Duchess Embayment Aquifer, including major elements.
Secondary elements (those existing at relatively low levels in the aquifer, including
trace elements) can show similar effects (Table 5.11). Almost all of the modelled
elements show enrichment even at relatively low levels of contamination. Al, Fe and
Mn show the most dramatic increase with the smallest input. Ba is the only element to
show a fall during increasing contamination.
Al As Ba Cd Co Cr Cu Fe Mn Ni Pb Sr Zn
Aquifer 0.13 0.002 0.24 0.002 0.001 0.004 0.02 2.85 0.05 0.002 0.02 0.58 0.02
Leachate 90.06 0.12 0.09 0.05 0.28 0.42 0.75 38.1 10.8 0.36 0.12 3.66 1.11
Aquifer Contamination @:
10% Leachate 9.12 0.014 0.22 0.007 0.029 0.046 0.09 6.37 1.12 0.038 0.03 0.89 0.13
25% Leachate 22.61 0.031 0.20 0.014 0.071 0.108 0.20 11.66 2.74 0.091 0.04 1.35 0.29
50% Leachate 45.09 0.061 0.16 0.026 0.141 0.212 0.38 20.47 5.42 0.181 0.07 2.12 0.56
75% Leachate 67.58 0.0905 0.13 0.038 0.21 0.316 0.57 29.29 8.11 0.270 0.09 2.89 0.84
90% Leachate 81.07 0.108 0.10 0.045 0.252 0.378 0.68 34.57 9.72 0.324 0.11 3.35 1.00Table 5.11 Modelled (simple mixing) effects of leachate contamination within the Duchess Embayment Aquifer, secondary elements. All measurement in mg/litre.
Because of its high transmissivity, pumping causes the water flow through the aquifer to
be strongly centred on any operating bores. The current numerical model built for
WMCF by long-time groundwater consultants Rockwater Pty Limited of Perth was
constructed in the Visual Modflow program using 114 rows, 60 columns and six layers
(Figure 5.15) over an area of 13km (east-west) by 31km (north-south), covering the
majority of the DEA. Layer 1 represents the Inca Shale, which acts as a confining
layer; Layers 2 to 5 represent siliceous and calcareous phases of the BCF; and Layer 6
represents the basement Mount Birnie Beds (Dippel and Wharton 2003). Model edges
coincide with the lateral limits of the DEA, with the rocks beyond them assumed to be
Page 180
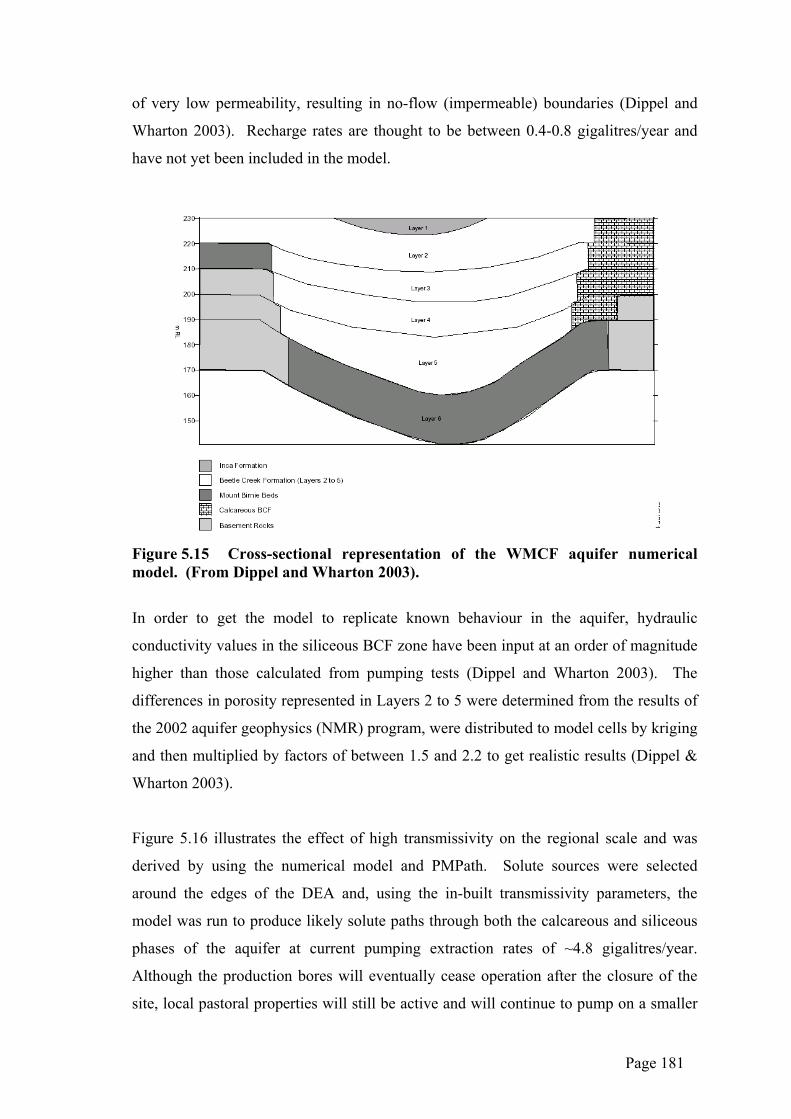
of very low permeability, resulting in no-flow (impermeable) boundaries (Dippel and
Wharton 2003). Recharge rates are thought to be between 0.4-0.8 gigalitres/year and
have not yet been included in the model.
Figure 5.15 Cross-sectional representation of the WMCF aquifer numerical model. (From Dippel and Wharton 2003).
In order to get the model to replicate known behaviour in the aquifer, hydraulic
conductivity values in the siliceous BCF zone have been input at an order of magnitude
higher than those calculated from pumping tests (Dippel and Wharton 2003). The
differences in porosity represented in Layers 2 to 5 were determined from the results of
the 2002 aquifer geophysics (NMR) program, were distributed to model cells by kriging
and then multiplied by factors of between 1.5 and 2.2 to get realistic results (Dippel &
Wharton 2003).
Figure 5.16 illustrates the effect of high transmissivity on the regional scale and was
derived by using the numerical model and PMPath. Solute sources were selected
around the edges of the DEA and, using the in-built transmissivity parameters, the
model was run to produce likely solute paths through both the calcareous and siliceous
phases of the aquifer at current pumping extraction rates of ~4.8 gigalitres/year.
Although the production bores will eventually cease operation after the closure of the
site, local pastoral properties will still be active and will continue to pump on a smaller
Page 181
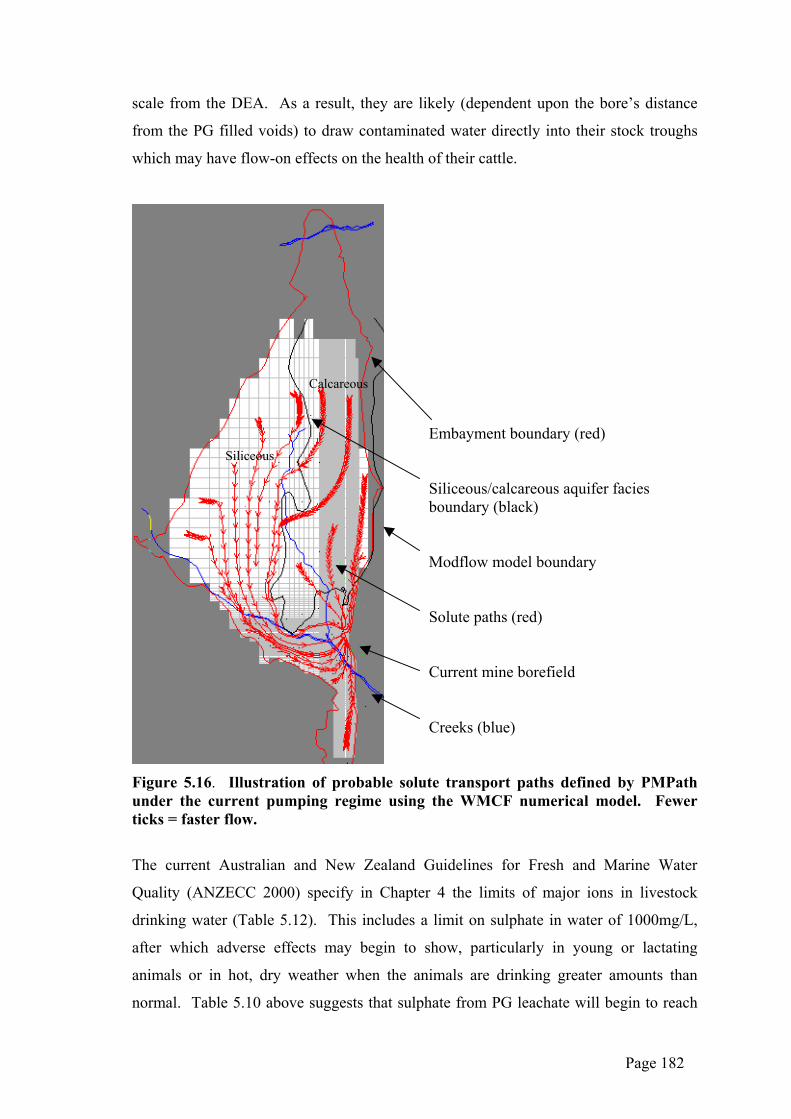
scale from the DEA. As a result, they are likely (dependent upon the bore’s distance
from the PG filled voids) to draw contaminated water directly into their stock troughs
which may have flow-on effects on the health of their cattle.
Calcareous
Embayment boundary (red) Siliceous/calcareous aquifer facies boundary (black) Modflow model boundary Solute paths (red) Current mine borefield Creeks (blue)
Siliceous
Figure 5.16. Illustration of probable solute transport paths defined by PMPath under the current pumping regime using the WMCF numerical model. Fewer ticks = faster flow.
The current Australian and New Zealand Guidelines for Fresh and Marine Water
Quality (ANZECC 2000) specify in Chapter 4 the limits of major ions in livestock
drinking water (Table 5.12). This includes a limit on sulphate in water of 1000mg/L,
after which adverse effects may begin to show, particularly in young or lactating
animals or in hot, dry weather when the animals are drinking greater amounts than
normal. Table 5.10 above suggests that sulphate from PG leachate will begin to reach
Page 182
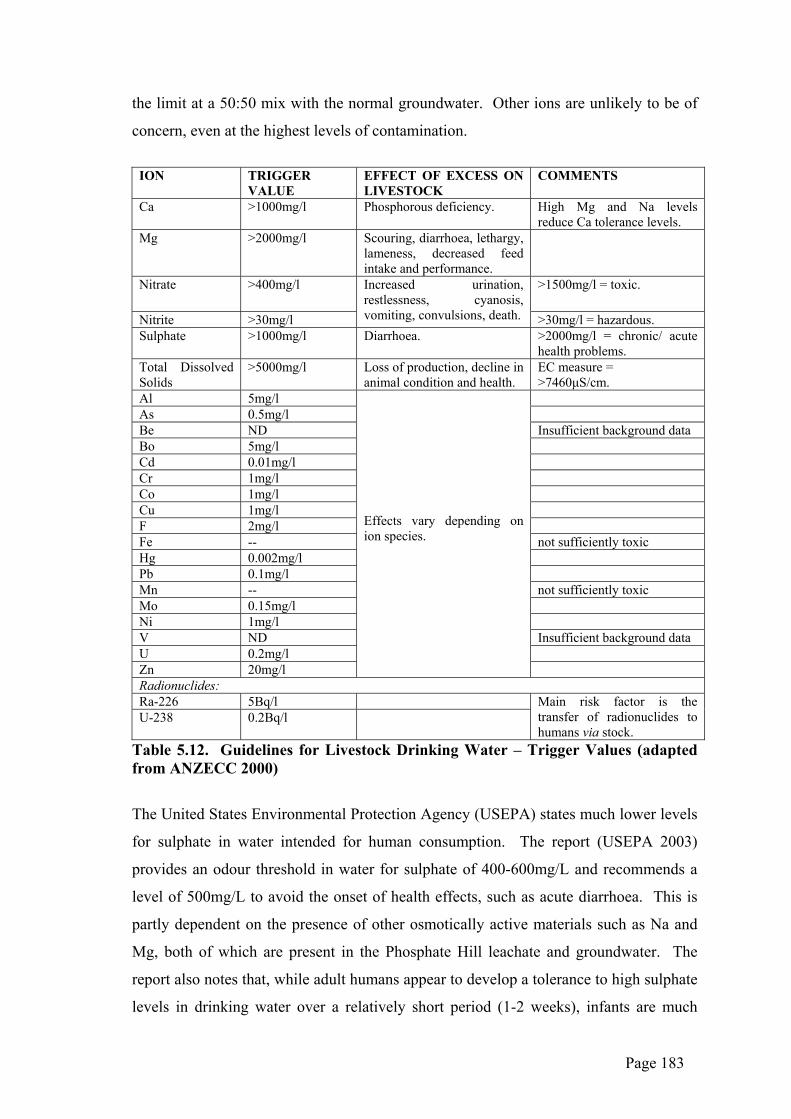
the limit at a 50:50 mix with the normal groundwater. Other ions are unlikely to be of
concern, even at the highest levels of contamination.
ION TRIGGER
VALUE EFFECT OF EXCESS ON LIVESTOCK
COMMENTS
Ca >1000mg/l Phosphorous deficiency. High Mg and Na levels reduce Ca tolerance levels.
Mg >2000mg/l Scouring, diarrhoea, lethargy, lameness, decreased feed intake and performance.
Nitrate >400mg/l >1500mg/l = toxic.
Nitrite >30mg/l
Increased urination, restlessness, cyanosis, vomiting, convulsions, death. >30mg/l = hazardous.
Sulphate >1000mg/l Diarrhoea. >2000mg/l = chronic/ acute health problems.
Total Dissolved Solids
>5000mg/l Loss of production, decline in animal condition and health.
EC measure = >7460µS/cm.
Al 5mg/l As 0.5mg/l Be ND Insufficient background data Bo 5mg/l Cd 0.01mg/l Cr 1mg/l Co 1mg/l Cu 1mg/l F 2mg/l Fe -- not sufficiently toxic Hg 0.002mg/l Pb 0.1mg/l Mn -- not sufficiently toxic Mo 0.15mg/l Ni 1mg/l V ND Insufficient background data U 0.2mg/l Zn 20mg/l
Effects vary depending on ion species.
Radionuclides: Ra-226 5Bq/l U-238 0.2Bq/l
Main risk factor is the transfer of radionuclides to humans via stock.
Table 5.12. Guidelines for Livestock Drinking Water – Trigger Values (adapted from ANZECC 2000)
The United States Environmental Protection Agency (USEPA) states much lower levels
for sulphate in water intended for human consumption. The report (USEPA 2003)
provides an odour threshold in water for sulphate of 400-600mg/L and recommends a
level of 500mg/L to avoid the onset of health effects, such as acute diarrhoea. This is
partly dependent on the presence of other osmotically active materials such as Na and
Mg, both of which are present in the Phosphate Hill leachate and groundwater. The
report also notes that, while adult humans appear to develop a tolerance to high sulphate
levels in drinking water over a relatively short period (1-2 weeks), infants are much
Page 183
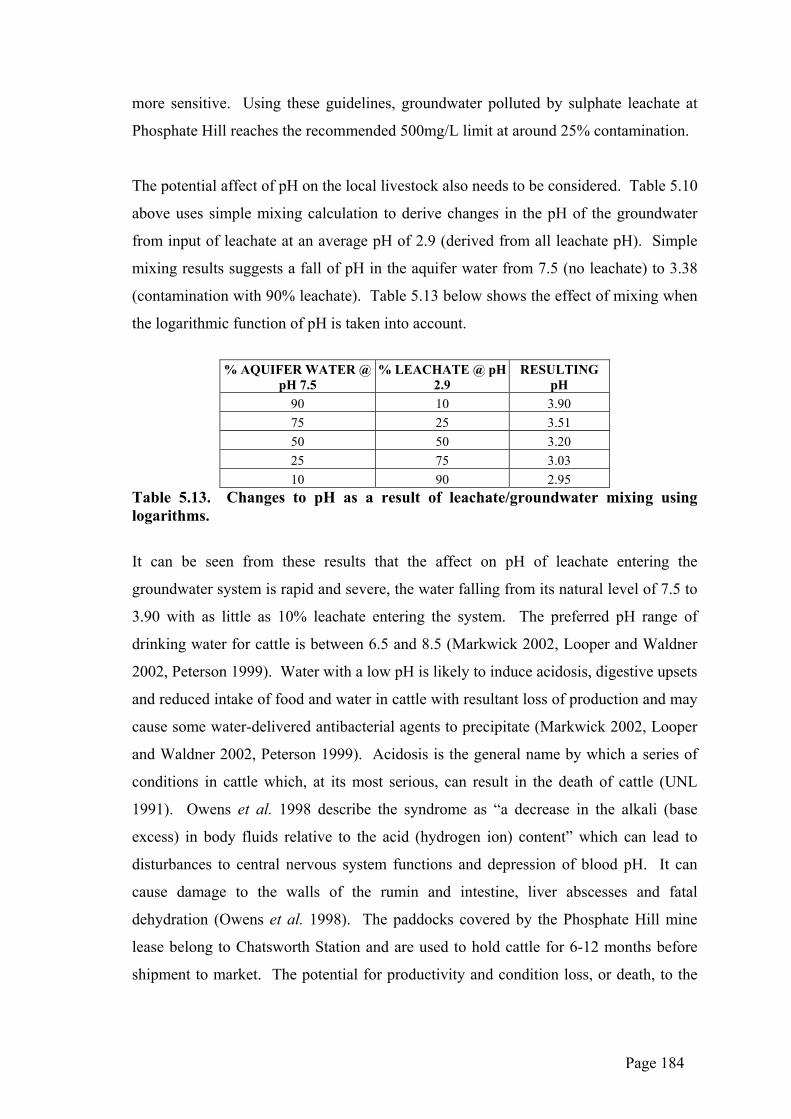
more sensitive. Using these guidelines, groundwater polluted by sulphate leachate at
Phosphate Hill reaches the recommended 500mg/L limit at around 25% contamination.
The potential affect of pH on the local livestock also needs to be considered. Table 5.10
above uses simple mixing calculation to derive changes in the pH of the groundwater
from input of leachate at an average pH of 2.9 (derived from all leachate pH). Simple
mixing results suggests a fall of pH in the aquifer water from 7.5 (no leachate) to 3.38
(contamination with 90% leachate). Table 5.13 below shows the effect of mixing when
the logarithmic function of pH is taken into account.
% AQUIFER WATER @
pH 7.5 % LEACHATE @ pH
2.9 RESULTING
pH 90 10 3.90 75 25 3.51 50 50 3.20 25 75 3.03 10 90 2.95
Table 5.13. Changes to pH as a result of leachate/groundwater mixing using logarithms.
It can be seen from these results that the affect on pH of leachate entering the
groundwater system is rapid and severe, the water falling from its natural level of 7.5 to
3.90 with as little as 10% leachate entering the system. The preferred pH range of
drinking water for cattle is between 6.5 and 8.5 (Markwick 2002, Looper and Waldner
2002, Peterson 1999). Water with a low pH is likely to induce acidosis, digestive upsets
and reduced intake of food and water in cattle with resultant loss of production and may
cause some water-delivered antibacterial agents to precipitate (Markwick 2002, Looper
and Waldner 2002, Peterson 1999). Acidosis is the general name by which a series of
conditions in cattle which, at its most serious, can result in the death of cattle (UNL
1991). Owens et al. 1998 describe the syndrome as “a decrease in the alkali (base
excess) in body fluids relative to the acid (hydrogen ion) content” which can lead to
disturbances to central nervous system functions and depression of blood pH. It can
cause damage to the walls of the rumin and intestine, liver abscesses and fatal
dehydration (Owens et al. 1998). The paddocks covered by the Phosphate Hill mine
lease belong to Chatsworth Station and are used to hold cattle for 6-12 months before
shipment to market. The potential for productivity and condition loss, or death, to the
Page 184
cattle from acid leachate entering the groundwater system in these paddocks must be
considered by WMCF in any unlined disposal system for the PG.
With phosphate forming a major part of the leachate the possibility of algal blooms
must be considered. Although the element is not toxic to animals unless at extremely
high levels, cyanobacteria (blue-green algae) flourish in water with elevated
phosphorous levels, especially where the element is present in reactive
(soluble/filterable) form (e.g. H2PO4-, PHO4
2-, PO43-) (Atkinson and Heggie 2004,
Murphy 2002). The majority of the phosphorous in the leachate has been assessed as
being of the reactive type (Appendix 7 page 314) and the simple mixing results shown
in Table 5.10 demonstrate a rapid elevation in phosphate levels at even a 10:90 mixing
ratio between (respectively) leachate and groundwater. As Sawyer 2004 and Murphy
2002 both state that concentrations of phosphate >0.1mg/l will result in algal blooms, it
would seem that very little leachate would be required to provide the nutrient levels
required for a potential algal bloom. This event would be most likely to occur during
summer, when still-water temperatures in tanks and troughs can easily reach the
temperature of 25°C that is optimum for blue-green algal blooms to develop (DLWC
2000a).
Occurrences of this type of bloom with fatal consequences to livestock have been
reported from farm water storage facilities from many places, including Australia
(DLWC 2000b). Not only does the presence of the blue-green algae cause problems
with the odour and taste of the water but they contain highly toxic compounds that can
affect the brain (neurotoxins) or liver (hepatotoxins), with as little as one litre of
strongly affected water needed to kill a 100kg calf (DLWC 2000b, Peterson 1999). The
most common toxic cyanobacteria genera associated with animal poisoning in Australia
are Microcystis, Anabaena and Nodularia, with Cylindrospermopsis also identified in
tropical and subtropical areas (ANZECC 2000). Microcystis and Anabaena are
associated with the hepatotoxin Microcystin, which causes weakness, vomiting,
diarrhoea and can result in blood collecting in the liver, causing circulatory shock and
death by liver failure (DLWC 2000b, ANCECC 2000). Anabaena and
Cylindrospermopsis produce neurotoxins known as Saxitoxins, which interfere with
message transmission between neurones, affecting muscle tissues and resulting in death
by paralysis and respiratory failure (ANZECC 2000, DLWC 2000b, Looper and
Page 185
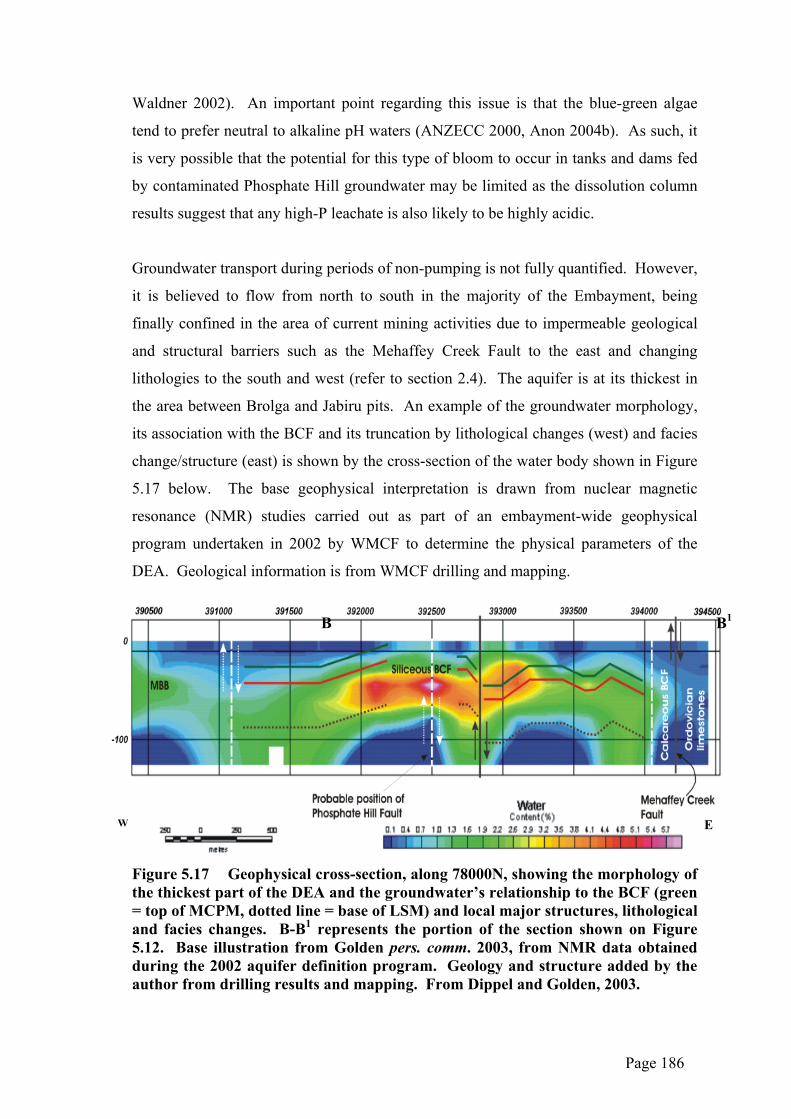
Waldner 2002). An important point regarding this issue is that the blue-green algae
tend to prefer neutral to alkaline pH waters (ANZECC 2000, Anon 2004b). As such, it
is very possible that the potential for this type of bloom to occur in tanks and dams fed
by contaminated Phosphate Hill groundwater may be limited as the dissolution column
results suggest that any high-P leachate is also likely to be highly acidic.
Groundwater transport during periods of non-pumping is not fully quantified. However,
it is believed to flow from north to south in the majority of the Embayment, being
finally confined in the area of current mining activities due to impermeable geological
and structural barriers such as the Mehaffey Creek Fault to the east and changing
lithologies to the south and west (refer to section 2.4). The aquifer is at its thickest in
the area between Brolga and Jabiru pits. An example of the groundwater morphology,
its association with the BCF and its truncation by lithological changes (west) and facies
change/structure (east) is shown by the cross-section of the water body shown in Figure
5.17 below. The base geophysical interpretation is drawn from nuclear magnetic
resonance (NMR) studies carried out as part of an embayment-wide geophysical
program undertaken in 2002 by WMCF to determine the physical parameters of the
DEA. Geological information is from WMCF drilling and mapping.
E W
B B1
Figure 5.17 Geophysical cross-section, along 78000N, showing the morphology of the thickest part of the DEA and the groundwater’s relationship to the BCF (green = top of MCPM, dotted line = base of LSM) and local major structures, lithological and facies changes. B-B1 represents the portion of the section shown on Figure 5.12. Base illustration from Golden pers. comm. 2003, from NMR data obtained during the 2002 aquifer definition program. Geology and structure added by the author from drilling results and mapping. From Dippel and Golden, 2003.
Page 186
The result of this movement would be a plume of contaminants emanating from the area
of PG storage and travelling into the deepest and thickest part of the aquifer between
Brolga and Jabiru. With the water effectively ponding in this area, although the
potential for larger scale pollution is prevented it is likely that the zone will act as a sink
for the contaminants. This would result in a body of highly polluted water developing
in an area very close to at least one currently existing pastoral bore (immediately east of
Jabiru).
When the result of the dissolution column experiments are considered, the
transmissivity within the aquifer would be expected to remain much the same if HH is
used as backfill, due to its loose, clumping nature. However, the consolidating nature of
DH may slow the movement of water through the DEA region by reducing porosity and
permeability through compaction and interlocking gypsum crystal growth in the area
that currently contains the majority of the water, making bores less productive as well as
possibly polluted. Comparisons of hydraulic conductivity for the two materials lend
some support to this theory, with the weathered, siliceous, fractured phosporites of the
DEA having an average result of 72m/day (Passmore and Berry 2002) and the PG
ranging from 0.13m/day (fine, silty DH) to 6.22m/day (medium-fine grained sandy DH
PG) (Ardaman 2000).
Remediation of such a zone could prove difficult. Methods utilised to treat groundwater
include bioremediation, air sparging, barriers, pump-and-treat and natural attenuation
(Davis 2001). Ex-situ treating such as pump-and-treat, are only effective if the source
of the contamination is also contained and also requires an acceptable method of
disposal for the treated material (Davis 2001). In-situ remediation , although often less
invasive than ex-situ, faces limitations in the effectiveness of monitoring, can be
restricted by the physical and chemical characteristics of the aquifer, may take too long
and may not be effective on the large scale (Christiansen 2004, Davis 2001). The
majority of common treatments, such as those mentioned above, appear to be mostly
designed for attenuating metals, non-aqueous phase and dense non-aqueous phase
liquids and thus is not applicable to the treatment of sulphate or acid contamination (EC
2004, Bowell 2000).
Page 187
The degree of success of any of these treatment methods when applied to sulphate
contamination is likely to be less than optimal, as sulphate, like calcium and sodium, is
difficult to treat (Bowell 2000). Successful smaller-scale mechanisms, such as reverse
osmosis, passing the contaminated fluid through a membrane or inducing the
precipitation of sulphate as insoluble salts or reduced sulphides, would not be practical
to use on the scale required at Phosphate Hill unless any leachate was contained and
treated before being released into the surface or subsurface water systems. Other
reports, such as Christiansen (2004), has shown that this sort of treatment can still leave
problems regarding the disposal of concentrated brines and/or be prohibitively
expensive to operate.
Bioremediation, such as that using sulphate reducing bacteria (commonly species of
Desulfotomaculum or Desulfovibrio) as organic electron donors in specific reactors or in
created wetland environments, may appear promising if the leachate can be passed
through the treatment systems or a natural equivalent, such as that seen in the Latrobe
Valley in Victoria (Mudd et al. 1999, Mudd et al. 1998). However, other studies have
suggested that they are not successful with highly acidic waters, such as that drained
from the gypsum stack (Picavet et al. 2003, Bowell 2000). This would require
neutralisation of the acid levels before treatment began, essentially creating a two-stage
process which would need to be maintained for decades, becoming labour and cost-
prohibitive (Christiansen 2004).
The majority of these problems can be alleviated by use of linings in the void but both
finding enough suitable material and developing the engineering required to achieve this
in the current pit voids would be very difficult. The area needing to be covered would
be in the tens of square kilometres on the void floors and on walls below the recovered
SWL. US guidelines on the construction and closure of PG stacks (USDSF 2004),
which are used as the basis for the Phosphate Hill operation, state that PG lining
material shall have:
“appropriate physical, chemical, and mechanical properties to prevent failure due to
physical contact with the phosphogypsum, process wastewater or leachate to which
they are exposed, climatic conditions, the stress of installation, and other applied
Page 188
stresses and hydraulic pressures which are anticipated during the operational and
closure period of the system.”
Liner stressors specified further in the guidelines include “the bottom of the liner system
..[not being].. subject to fluctuations of the ground water so as to adversely impact the
integrity of the liner system” and “designed to resist hydrostatic uplift if the liner is
located below the seasonal high ground water table”. Liners are to be composite,
consisting of a geomembrane liner underlain by at least 45cm of compacted soil with a
maximum hydraulic conductivity of 1 x 10⁻⁷cm/sec and/or overlain by at least 60cm of
compacted PG with a maximum hydraulic conductivity of 1 x 10⁻⁴cm/sec. The
requirement for the liners and groundwater to have minimal interaction is unlikely to be
achievable in the areas that will be available for in-pit storage at Phosphate Hill. For the
reasons explained earlier in this section.
Although these guidelines are followed in the construction of stack areas, it would
require a major engineering effort to follow them in preparing a pit void in the same
way. The only soil material available locally that is suitable is the surface alluvium,
which, although abundant, is highly variable in its quality and would require the
creation of borrow pits on almost the same scale as the mining operation to provide
enough material to line the pit floors. In addition, the pit floors are not flat but undulate
in a dome-and-basin morphology with amplitudes on the scale of tens of metres, with
parasitic folding and faulting complicating the patterns. Although they can be flattened,
the act of flattening would have to be followed by rolling to minimise presence of very
sharp, angular fragments of LSM, before lining and dumping could commence and
would be a major and complicated earth-moving operation in its own right with
substantial costs involved.
It is also difficult to assess the requirements of lining sub-vertical walls even in part, if
not completely, without semi-filling the void needed for the PG. Liner material such as
that already in place below the stacks (3mm high-density polyethylene) would not be
suitable for lining the open voids as both MCPM and LSM contain high levels of silica
(~35% and >80% respectively) and thus are both very hard and very sharp so the lining
material would not retain its integrity during the lining process.
Page 189
Another method of containing the risk of leachate would be to cap the material but not
line it. Capping can be done in a similar manner to lining, engineered to promote run-
off rather than infiltration and appropriate vegetation applied to stabilise the capping
and contain moisture. This would reduce the risk of inflow resulting in leachate flowing
into the aquifer. However, it would not prevent fluids in the PG from draining or stop
interactions between the groundwater and the backfill. In the long term it would not be
expected to retain its integrity due to normal weathering and erosion processes.
Bunding of the back-filled areas would also be required to prevent flood inundation but
the same erosion process would almost inevitably result in the bunds being breached at
some point.
Inclusion of neutralising material within the construction of mine fill could alleviate the
majority of the problems associated with acid pore fluid and leachate and would provide
the best opportunity to use PG as mine backfill. A layer-cake approach of interbedded
PG and calcareous material, whether low-grade ore or limestone, would provide a large
neutralising capability within the fill structure for any acid materials that escape the PG.
The major problems associated with this proposal come from two areas: sourcing the
calcareous component and traffic movement over the PG component during
construction.
Inca Limestone and calcareous MCPM both occur within the mining lease, with the
source closest to the current mining operations being south-east of Galah Pit (Figure
5.18). This particular area is very small and, although no studies have been done to
determine how much calcareous material is required to neutralise each tonne of PG, this
area alone would not provide sufficient material for the life of the operation.
Page 190
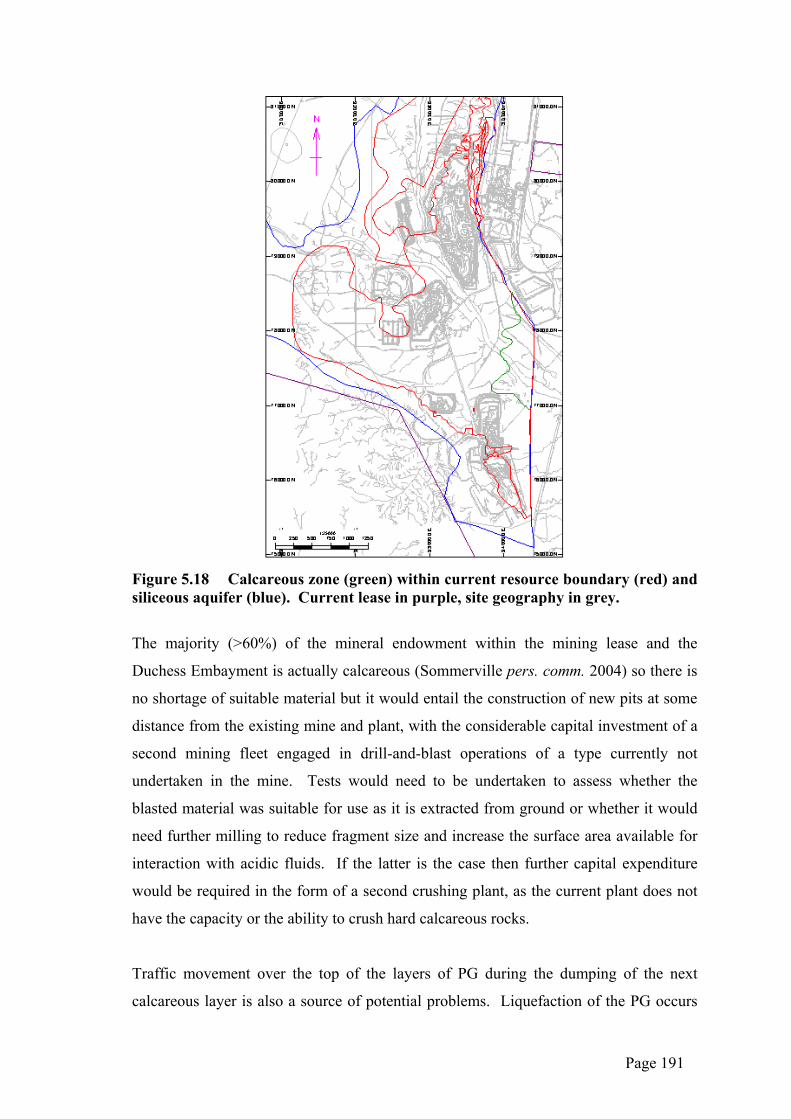
Figure 5.18 Calcareous zone (green) within current resource boundary (red) and siliceous aquifer (blue). Current lease in purple, site geography in grey.
The majority (>60%) of the mineral endowment within the mining lease and the
Duchess Embayment is actually calcareous (Sommerville pers. comm. 2004) so there is
no shortage of suitable material but it would entail the construction of new pits at some
distance from the existing mine and plant, with the considerable capital investment of a
second mining fleet engaged in drill-and-blast operations of a type currently not
undertaken in the mine. Tests would need to be undertaken to assess whether the
blasted material was suitable for use as it is extracted from ground or whether it would
need further milling to reduce fragment size and increase the surface area available for
interaction with acidic fluids. If the latter is the case then further capital expenditure
would be required in the form of a second crushing plant, as the current plant does not
have the capacity or the ability to crush hard calcareous rocks.
Traffic movement over the top of the layers of PG during the dumping of the next
calcareous layer is also a source of potential problems. Liquefaction of the PG occurs
Page 191
very easily with repeated movement over the same area, whether it be a person on foot,
a light vehicle or an excavator (see Plate 4.12 for an example), so a fleet of haul trucks
dumping limestone on a layer of PG is highly likely to become bogged. It might be
possible to back the trucks up to a dump point so that they are only running over
limestone but this would require the constant presence of a bulldozer and would
significantly slow the entire operation. However, it is an area that, along with defining
the neutralisation capacity of the local limestones, should be investigated more fully by
the Company before a final decision on in-pit dumping is made.
A final option would be to heat treat, or calcine, the PG to above 200°C before using as
backfill. This would drive off all fluids and return the PG to the stable pure anhydrite
(CaSO4) form in a monotropic reaction (Deer et al. 1992). To do this would require the
construction of a calcining plant and the rehandle of any existing PG destined for use as
fill as well as the processing of newly produced hemihydrate. The capital expenditure
required for this option makes it currently non-viable for this particular operation.
Other consideration that would need to be fully examined should the Company go ahead
with in-pit storage of PG involves access to the mining voids and the type of transport
of the material to the final holding area. WMCF Mining & Gypsum Department
regulations prohibit the interaction of mining fleets, restricting any working area to one
fleet only. This, combined with the volume of PG produced (360t/hour on average), the
requirement to bring in neutralising material and the need to, initially, completely
reconstruct (flatten) the floor of the dumping area to allow safe access for trucks would
mean that PG backfilling would not be able to commence until mining in a pit has been
completed. The nature of the ore body and the feed requirements of the fertilizer plant
means that mine planning is not a case of a smooth progression from one end of the ore
body to the other but rather the extraction of selected areas as required to meet
individual feed grades for products scheduled to be manufactured. This mining method
is unlikely to change over the life of the operation. As a result, it will be almost
impossible to find any areas of any size that will be available for PG backfilling before
the end of fertilizer manufacture. PG would thus need to be stored in stacks initially
and then rehandled into the voids at or near the end of the mining operation,
significantly increasing the costs involved in infrastructure, time and personnel.
Page 192
Infrastructure considerations may also play a severely limiting factor in using PG as
backfill. The filtercake is currently transported by conveyor from the PAP to the re-
slurry tank and the stack which suggests two alternatives for transporting the material to
the pit: either by conveyor or by a more traditional excavator/loader and truck fleet.
The conveyor may seem to be the logical alternative for transport, especially for HH
filtercake, but it poses practical problems that would be difficult to overcome. The
construction and maintenance of several kilometres of conveyor system to cover the
expected extent of the mining voids would be extremely expensive, especially as the
discharge point/s of the conveyor could not remain static for any length of time but
would have to move on an almost daily basis to allow for the spreading of the gypsum
and the construction of the fill in the required layer cake configuration. Although there
are systems available that have some movement capability these are not fully mobile or
designed to be the head of a constantly moving, 2-5km long overland conveyor system
and the development of such a system is likely to be cost-prohibitive.
The traditional excavator/loader and truck fleet offers more flexibility and is much
easier to obtain. However, there are problems associated with this method as well.
These primarily relate to the configuration of the fleet and the construction method used
for the fill. The excavator/loader and trucks would need to be large enough in both
capacity and number to either keep up with the production rates of the HH PG or to
maintain good re-handling rates from existing DH stockpiles. The trucks would need to
be fitted with non-standard tyres capable of travelling long haul distances at reasonable
speed without overheating. A bulldozer of an appropriate size would be required to
handle the construction of the actual in-pit storage area and this would need to be fitted
with “swampy” (wide-plate) tracks to minimise the possibility of bogging in the PG. As
mentioned earlier in this section, bogging of the trucks would be a probability that
would also be difficult to overcome. Corrosion of all the equipment is a problem with
the current gypsum handling fleet and could be expected to continue to be so for any
rehandle fleet, due to the acidity of the PG, which significantly increases maintenance
costs and shortens equipment life. All of these items can be dealt with but would
require a stringent economic review before implementation to assess the viability of the
fleet option.
Page 193
The layer-cake design of the fill would result in a third (ore, overburden and neutraliser)
mining fleet being required to transport the neutralising material to the fill site from its
excavation site. This fleet would operate under some of the same parameters required
for the gypsum haulage, in that it would need to be of sufficient capacity and size to
provide the neutralising material in the quantities required at the times required. It
would probably be possible to use the same trucks, set up for long haul distances, that
were being used for the gypsum haulage but a separate excavator and pit bulldozer
would be a necessity due to likely tramming distances of 5-10km, which tracked
machines are not intended to do on a regular basis due to massive increases in wear and
tear. A permanent drill-and-blast crew would also need to be on site and a separate
crushing plant constructed to handle the hard, calcareous neutralising rocks. All of
these requirements – manpower, infrastructure and equipment - add up to an economic
impact that would make the operation unviable in the long-term.
The concerns of local property owners and indigenous groups also need to be
considered when making a decision on the disposal method used for the PG. Although
the possible environmental effects associated with using the gypsum as backfill can be
alleviated by engineering, lining, capping and neutralising methods, the local
stakeholders may not be easily placated to the thought of using such a material in any
position where it may interact with the aquifer. Recent WMCF experience with the
stakeholders, many of whom have been poorly treated in the past by mining companies,
regarding the planned dewatering operations has seen the latter delayed through
objections lodged and subsequent legal processes implemented by the stakeholders,
often due to philosophical rather than practical considerations. WMCF’s policy of
transparent dealings within and outside the Company in regard to such issues would
result in the chemical characteristics of the PG and its leachate becoming known to the
stakeholders and it is difficult to see that they would be willing to accept in-pit disposal
under any circumstances.
A final factor for consideration in the idea of using PG as backfill has arisen since this
thesis was first submitted. As a result of the concerns expressed by the local
landholders about the dewatering of the aquifer WMCF has now agreed to leave voids
in the completed mines to assist in the speedy recharge of the aquifer. As a result, no
area is likely to be able to be filled from wall to wall but instead any fill used will need
Page 194
to be placed as a stack, or stockpile. This will not only vastly decrease the area
available for backfilling but will considerably increase the amount of surface area
exposed to interaction with rain or floodwaters and will negate most of the benefits of
erosion minimisation gained by using PG as backfill. It would also require the
construction of lined ditches around the fill area and the installation of recycling or
treatment options for any fluids drained from the backfill. This would, in effect, lead to
the construction of in-pit PG stacks very similar to those currently existing. This, when
combined with the engineering challenges of such an action and the difficulties of
physically transporting and handling the material, is likely to see in-pit disposal
dismissed by the Company as both environmentally inappropriate and uneconomic
when compared to continuing the current process of constructing lined stacks on flat
ground at surface level close to existing fluid recycling systems.
Although the idea of using the PG as backfill in the mine is very attractive there are
many environmental, economic, political and practical concerns involved with using
this material. Because of the risk of contamination to the local aquifer and the
engineering difficulties associated with trying to mitigate that risk it is unlikely that this
option will be viable for this site.
5.10 SUMMARY
This study has produced important base-line information that was previously
unavailable on the PG produced at Phosphate Hill. It has quantified the physical and
chemical characteristics of the PG and in doing so revealed that the Phosphate Hill
material is, consistently, significantly different from that produced elsewhere in the
world from similar marine phosphorite deposits and using similar wet-processing
methods. This is mainly due to the high levels of silica contained within the large acid-
insoluble content of the PG and the elevated P2O5 content but also includes the presence
of acids, clays, mica and amphibole minerals which are not identified elsewhere.
Other major findings include the propensity for certain radionuclides to concentrate
within the recycled stack liquid. This has not been commented on elsewhere in the
literature based on PG stacks elsewhere in the world and, although the Phosphate Hill
material is relatively low in radionuclides, it may pose a long-term hazard for the
Page 195
Phosphate Hill operations if the recycling is to continue. Long-term monitoring of the
stack liquors will probably be needed to further define this problem.
As identified at other sites, seasonal or feed source changes are not a factor on the make
up of the PG, although plant efficiency definitely is. A change in the parameters of the
phosphoric acid plant can result in major changes to the PG material being produced. If
these changes remain unidentified they have the capability to impact on the long-term
stability of the stack.
Dissolution column results were as expected. The major contaminants likely to be
derived from PG are sulphate, phosphate and acid. The effect of relict acids, fluorine
compounds and radionuclides appears to reduce rapidly whereas sulphate derived from
gypsum dissolution is likely to be a much longer-term issue. Most of the existing
literature does not identify sulphate contamination as a major problem, instead
focussing on radionuclides.
Using PG as backfill in the mine voids does not appear to be a viable option without a
considerable input of capital. Although it would solve some long-term problems
associated with above-ground stacking, particularly in the areas of erosion and potential
slumping failure, it creates larger problems. These are the result of the high
transmissivity of the local aquifer, which will allow any drained fluids or leachate
derived from the PG fill to quickly permeate and contaminate the aquifer. As the
aquifer is self-contained, over the long-term any contamination is likely to build up in
the southern part of the Embayment, leading to a source of highly-polluted
groundwater. Remediation, especially of sulphate or acid contamination, is likely to be
very difficult to effectively treat. Although many of the potential contamination issues
can be circumvented, practical engineering, in the areas of material transport and fill
methods, also places very great constraints on the use of PG as backfill, leading to
serious commercial draw-backs to this disposal option. The concerns of local
stakeholders, including the pastoral lease holders and indigenous groups, is yet another
area that is likely to be resistant to the idea of backfilling with PG. The combination of
all of these factors is such that it is highly unlikely that the Company will proceed with
the option of in-pit disposal for the PG.
Page 196
![[PPT]The Cell Cyclemrspbiology.wikispaces.com/file/view/The+Cell+Cycle... · Web viewThe Cell Cycle copyright cmassengale Five Phases of the Cell Cycle G 1 - primary growth phase](https://img.dokumen.tips/doc/110x75/5aa6232f7f8b9a7c1a8e554f/pptthe-cell-cellcycleweb-viewthe-cell-cycle-copyright-cmassengale-five-phases.jpg)