Embed Size (px)
Citation preview
Prosperity is when the prices of
things that you sell are rising
inflation is when the prices of
things that you buy are rising
Recession is when other people are
unemployed depression is when
you are unemployed
mdashAnonymous
Economic Fluctuations Unemployment
and Inflation
C H A P T E R 8
C H A P T E R F O C U S
What is a business cycle How much economic instability has the United States experienced
Why do economies experience unemployment Are some types of unemployment worse than others
What do economists mean by full employment How is full employment related to the natural rate of unemployment
How are anticipated and unanticipated inflation dif-ferent What are some of the dangers that accompany inflation
A s we have already discussed macroeconomics is about growth of income and fluctuations in that
growth The primary objectives of macroeconomic policy are to help promote rapid and stable
growth a high level of employment and stability in the general level of prices These goals are gen-
erally considered desirable However there is sometimes controversy about how they can best be
achieved As we proceed we will analyze both economic growth and stability in detail and consider how both
of these objectives can be attained
The performance of the economy influences our job opportunities income levels and quality of life Thus
key indicators of economic performance such as growth of real GDP the rate of unemployment and the infla-
tion rate are closely watched by investors politicians and the media This chapter will focus on how several key
economic indicators are derived and explain how changes in these measures influence our lives
Swings in the Economic Pendulum
During the last hundred years the annual growth rate of real GDP in the United States has
averaged approximately 3 percent But there have also been considerable fluctuations in
year-to-year growth During the Great Depression of the 1930s economic growth plunged
Real GDP declined by 75 percent or more each year from 1930 to 1932 In 1933 it was
almost 30 percent less than it was in 1929 The 1929 level of real GDP was not reached
again until 1939 World War II was characterized by a rapid expansion of GDP which was
followed by a decline after the war Real GDP did not reach its 1944 level again until 1953
although the output of consumer goods did increase significantly in the years immediately
following the war
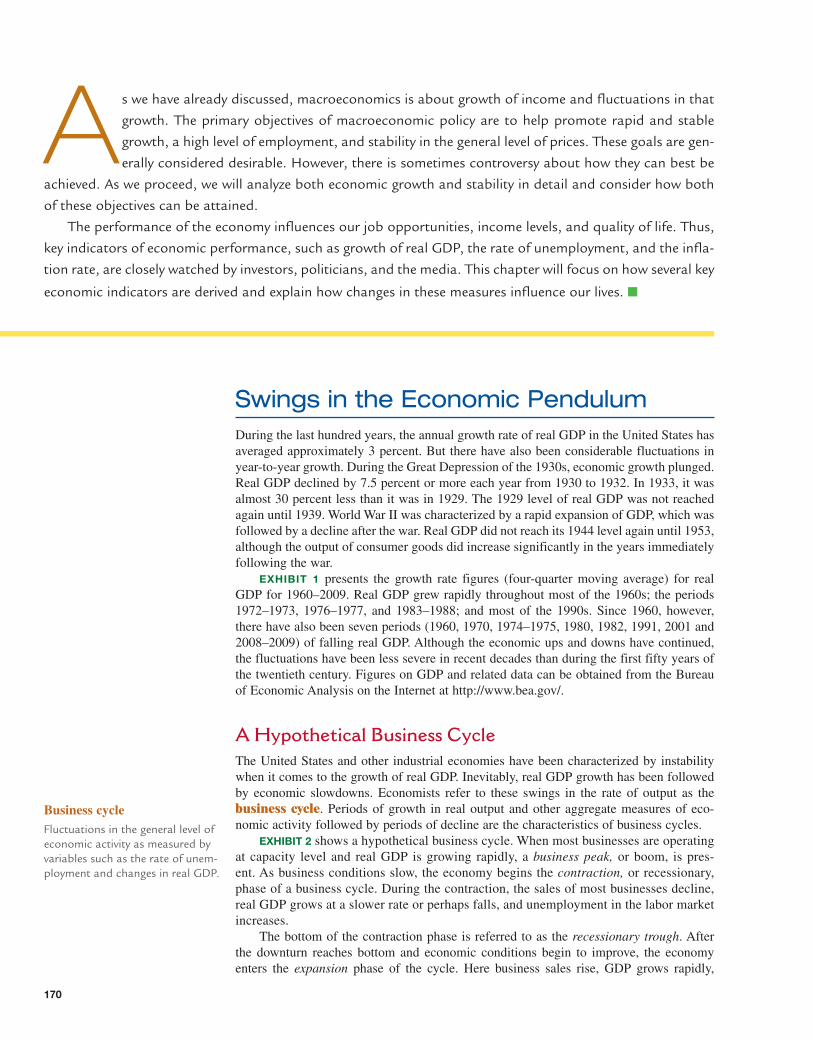
EXHIBIT 1 presents the growth rate figures (four-quarter moving average) for real
GDP for 1960ndash2009 Real GDP grew rapidly throughout most of the 1960s the periods
1972ndash1973 1976ndash1977 and 1983ndash1988 and most of the 1990s Since 1960 however
there have also been seven periods (1960 1970 1974ndash1975 1980 1982 1991 2001 and
2008 ndash2009) of falling real GDP Although the economic ups and downs have continued
the fluctuations have been less severe in recent decades than during the first fifty years of
the twentieth century Figures on GDP and related data can be obtained from the Bureau
of Economic Analysis on the Internet at httpwwwbeagov
A Hypothetical Business CycleThe United States and other industrial economies have been characterized by instability
when it comes to the growth of real GDP Inevitably real GDP growth has been followed
by economic slowdowns Economists refer to these swings in the rate of output as the
business cycle Periods of growth in real output and other aggregate measures of eco-
nomic activity followed by periods of decline are the characteristics of business cycles
EXHIBIT 2 shows a hypothetical business cycle When most businesses are operating
at capacity level and real GDP is growing rapidly a business peak or boom is pres-
ent As business conditions slow the economy begins the contraction or recessionary
phase of a business cycle During the contraction the sales of most businesses decline
real GDP grows at a slower rate or perhaps falls and unemployment in the labor market
increases
The bottom of the contraction phase is referred to as the recessionary trough After
the downturn reaches bottom and economic conditions begin to improve the economy
enters the expansion phase of the cycle Here business sales rise GDP grows rapidly
Business cycleFluctuations in the general level of economic activity as measured by variables such as the rate of unem-ployment and changes in real GDP
170
C H A P T E R 8 Economic Fluctuations Unemployment and Inflation 171
and the rate of unemployment declines Eventually the expansion blossoms into another
business peak The peak however inevitably ends and turns into a contraction beginning
the cycle anew
The term recession is widely used to describe conditions during the contraction and
recessionary trough phases of the business cycle This is a period during which real GDP
declines Often a recession is defined as a decline in real GDP for two or more consecu-
tive quarters1 When a recession is prolonged and has a sharp decline in economic activity
it is called a depression
RecessionA downturn in economic activity characterized by declining real GDP and rising unemployment In an effort to be more precise many economists define a recession as two consecutive quarters in which there is a decline in real GDP
DepressionA prolonged and very severe recession
E X H I B I T 1
Instability in the Growth of Real GDP 1960-2009
Although real GDP in the United States fluctuates substantially periods of positive growth outweigh the periods of declining real GDP Since 1960 the US growth rate of real GDP has averaged approximately 3 percent annually Economists refer to periods of declining real GDP as recessions The recessionary periods are shaded
Source Economic Report of the President (Washington DC Government Printing Office various issues)
1See Geoffrey H Moore ldquoRecessionsrdquo in The Fortune Encyclopedia of Economics ed David R Henderson (New York Time
Warner Inc 1993) for additional information on recessions in the United States This publication is also available online at
httpwwweconliborg
ndash4
ndash2
0
2
4
6
8
10
1960 1965 1970 1975 1980 1985 1990 1995Year
2000 2005 2009
Ann
ual r
ate
of g
row
th in
rea
l GD
P
Long-rungrowth rate
(approx 3)
During economic expansions construction and investment are increasing In contrast recessions are characterized by plant closings and high unemployment
Jim
Str
atfo
rdB
loom
berg
New
sLa
ndov
Spe
ncer
Pla
ttG
etty
Im
ages
172 P A R T 3 Core Macroeconomics
In one important respect the term business cycle is misleading The word cycle is often
used to describe events of similar time length that occur regularly like the seasons of the
year for example As Exhibit 1 illustrates this is not the case with the business cycle The
expansions and contractions last varying lengths of time and the swings differ in terms of
their magnitude For example the recessions of 1961 1982 and 1990 were followed by
eight years or more of uninterrupted growth of output In contrast the recession of 1980
was followed by an expansion that lasted only twelve months The expansionary phase
following the recessions of 1970 and 1974ndash1975 fell between these two extremes Clearly
the duration of real-world expansions and contractions is varied and unpredictable
How can we know where an economy is in the business cycle Of course changes in
real GDP will tell us However these numbers are available only quarterly and it usually
takes four to six weeks after the quarter is over before reliable figures are released Various
measures that are available monthly or more often can provide clues For example auto
sales new housing starts new factory orders and even the stock market will generally
increase during an expansion and decline when the economy dips into a recession As a
result these indicators are monitored carefully
Economic Fluctuations
and the Labor Market
Fluctuations in real GDP influence the demand for labor and employment In our modern
world people are busy with jobs household work school and other activities EXHIBIT 3
illustrates how economists classify these activities in relation to the civilian labor force
defined as the number of people aged sixteen years and over who are either employed or
seeking employment The noninstitutional civilian adult population is divided into two
broad categories (1) people not in the labor force and (2) people in the labor force There
are various reasons why people arenrsquot in the labor force Some are retired Others are
working in their own households or attending school Still others are not working because
they are ill or disabled Although many of these people are quite busy their activities
lie outside the market labor force
As Exhibit 3 shows unemployed workers who are seeking work are included in
the labor force along with employed workers The labor force participation rate is the
number of people in the civilian labor force (including both those who are employed and
those who are unemployed) as a percentage of the civilian population sixteen years of age
Civilian labor forceThe number of people sixteen years of age and over who are either employed or unem-ployed To be classified as unemployed a person must be looking for a job
UnemployedThe term used to describe a person not currently employed who is either (1) actively seek-ing employment or (2) waiting to begin or return to a job
Labor force participation rateThe number of people in the civilian labor force sixteen years of age or over who are either employed or actively seeking employment as a percentage of the total civilian population sixteen years of age and over
Rea
l GD
P
Time
Businesspeak
Contraction
Exp
ansi
on
Recessionarytrough
Businesspeak
Trend line
E X H I B I T 2
The Business Cycle
In the past ups and downs have often characterized aggregate business activity Despite these fluctuations there has been an upward trend in real GDP in the United States and other industrial nationsDuring economic expansions construction and investment are increasing In contrast recessions are characterized by plant closings and high unemployment
C H A P T E R 8 Economic Fluctuations Unemployment and Inflation 173
and over In May 2009 the population (sixteen years of age and over) of the United States
was 2355 million 1551 million of whom were in the labor force Thus the US labor
force participation rate was 659 percent (1551 million divided by 2355 million)
The labor force participation rate varies substantially across countries For example in
2008 the labor force participation rate of fifteen- to sixty-four-year-olds was 753 percent
in the United States 788 percent in Canada and 802 percent in Sweden In contrast the
labor force participation rate was only 622 percent in Mexico and 630 percent in Italy
The percentage of married women in the labor force is generally smaller in countries like
Italy and Mexico that have low labor force participation rates
In the United States one of the most interesting labor force developments in
recent decades is the dramatic increase in the labor force participation rate of women
EXHIBIT 4 illustrates this point In 2008 595 percent of adult women worked outside the
home up from 327 percent in 1948 Married women accounted for most of this increase
More than half of all married women now are in the labor force compared to only 20 percent
immediately following World War II While the labor force participation of women rose the
rate for men fell In 2008 the labor force participation rate of men was 730 percent down
from 833 percent in 1960 and 866 percent in 1948 Clearly the composition of workforce
participation within the family has changed substantially during the past six decades
The unemployment rate is a key barometer of conditions in the aggregate labor
market This not withstanding the term is often misunderstood It is important to note
that unemployment is different from not working As we previously discussed there are
several reasonsmdashincluding household work school attendance retirement and illness or
disabilitymdashwhy a person may be neither employed nor looking for a job These people
though not employed are not counted as unemployed
Unemployment rateThe percentage of people in the labor force who are unem-ployed Mathematically it is equal to the number of people unemployed divided by the number of people in the labor force
E X H I B I T 3
Population Employment and Unemployment May 2009
The accompanying diagram illustrates the alternative participation-status categories for the adult population Data are measured in millions except those expressed as percentages
Source httpwwwblsgov
Civilian population16 and over
Not in thelabor force
Civilianlabor force
Employed
Household workersStudentsRetireesDisabled
EmployeesSelf-employed
workers
UnemployedNew entrantsReentrantsLost last jobQuit last jobLaid off
Noninstitutional civilian population (age 16 and over) Not in labor force Total civilian labor force Employed UnemployedLabor force participation rateEmploymentpopulation ratioUnemployment rate
NUMBER OF
PERSONS MAY 2009
2355 80415511406
145 659 597 94
174 P A R T 3 Core Macroeconomics
Moreover only people employed or unemployed are counted as part of the labor
force Part-time as well as full-time workers are counted as employed members of the
labor force The rate of unemployment is the number of people unemployed expressed as a
percentage of the labor force In May 2009 the rate of unemployment in the United States
was 94 percent (145 million out of a labor force of 1551 million) (See the accompany-
ing Measures of Economic Activity feature for information on how the Bureau of Labor
Statistics derives the unemployment rate)
Deriving the Unemployment Rate
Each month the Bureau of Labor Statistics (BLS) contacts a sample of 50000 households that reflects the population characteristics of the United States Specially trained interviewers pose identical questions designed to determine whether each of the approximately 90000 adults in these households is employed unemployed or not in the labor force People aged sixteen years and over are considered employed if they (1) worked at all (even as little as 1 hour) for pay or profit during the survey week (2) worked 15 hours or more without pay in a family-operated enterprise during the survey week or (3) have a job at which they did not work during the survey week because of illness vacation industrial disputes bad weather time off or personal reasons People are considered unemployed if they (1) do not have a job (2) are available for work and (3) have actively looked for work during the past four weeks Looking for work may involve any of the following activities (1) registering at a public or private employment office (2) meeting with prospective employers (3) checking with friends or relatives (4) placing or answering advertisements (5) writing letters of application or (6) being in a union or on a professional register In addition those not working
are classified as unemployed if they are either waiting to start a new job within thirty days or waiting to be recalled from a layoff The BLS uses its survey data to calculate the unemployment rate and other employment-related statistics each month States use the BLS survey and employment figures from industries covered by unemployment insurance to construct state and area employment statistics These labor market figures are published by the US Department of Labor in the Monthly Labor Review and on the Internet at httpwwwblsgov
MEASURES OF ECONOMIC ACTIVITY
Joel
Ste
tten
heim
CO
RB
IS
19901975
WomenMen
866833
0
20
40
60
80
100
779 764
2008
730
327 377
463
575
1948 1960 1990
595
200819751948 1960
Labo
r fo
rce
part
icip
atio
n ra
te
Source httpwwwblsgov
E X H I B I T 4
Labor Force Participation Rate of Men and Women 1948ndash2008
As the chart illustrates the labor force participation rate for women has been steadily increasing for several decades while the rate for men has been declining
C H A P T E R 8 Economic Fluctuations Unemployment and Inflation 175
In addition to the rate of unemployment many economists also use the employmentpopulation ratiomdashthe number of people employed expressed as a percentage of the
population sixteen years old and overmdashto monitor labor market conditions This ratio will
tend to rise during an expansion and fall during a recession Both the number of people
employed and the population aged sixteen and over are well defined and readily measur-
able Their measurement does not require a subjective judgment as to whether a person is
actually ldquoavailable for workrdquo or ldquoactively seeking employmentrdquo Thus some believe that
the employmentpopulation ratio is a more objective measure of job market conditions
than the rate of unemployment The employmentpopulation ratio was 597 percent in
May 2009 The accompanying Thumbnail Sketch shows the formulas that are used to
calculate the major indicators of labor market conditions
Dynamic Change and Reasons for UnemploymentIn a dynamic world where information is scarce and people are free to choose among
jobs some unemployment is inevitable As new products are introduced and new technolo-
gies developed some firms are expanding while others are contracting Similarly some
firms will be starting operations while others will be going out of business This process
results in the creation of new jobs and the disappearance of old ones At the same time
some potential workers will be switching from school or other nonwork activities to the
labor force while others are retiring or taking a leave from the labor force Furthermore
workers are mobile At any point in time some will voluntarily quit and search for better
opportunities Although some unemployment will always be present there is a positive
side to the unemploymentndashjob search process it makes it possible for individuals to better
match their skills and preferences with the job requirements of employers Better-matched
employees and employers increase both productivity and earnings
Unemployment may occur for reasons other than the loss of a job however For
example people often experience periods of unemployment as they enter and reenter
the labor force The Department of Labor lists five reasons why workers may experi-
ence unemployment EXHIBIT 5 shows the share of unemployed workers in each of
these five categories in May 2009 Interestingly 66 percent of the unemployed work-
ers were first-time entrants into the labor force 218 percent were reentering the labor
force after exiting it to obtain additional schooling do household work or for other
reasons Therefore 284 percent of the unemployed workersmdashover one-quartermdashwere
unemployed because they were entering or reentering the labor force About one out of
every sixteen unemployed workers (62 percent) quit their job People laid off and wait-
ing to return to their previous positions contributed 126 percent to the total Workers
dismissed from their job accounted for about one-half (528 percent) of the total number
of unemployed workers
Young workers often switch jobs and move between schooling and the labor force
as they search for a career path that best fits their abilities and preferences As the result
of this job switching the unemployment rate of younger workers is substantially higher
than that of more established workers As EXHIBIT 6 shows the unemployment rate of
workers twenty to twenty-four years of age in May 2009 was nearly twice the rate for
their counterparts aged twenty-five years and over Further the unemployment rate for
Employmentpopulation ratioThe number of people sixteen years of age and over employed as civilians divided by the total civilian population sixteen years of age and over The ratio is expressed as a percentage
Formulas for Key Labor Market Indicators
1 Labor force Employed Unemployed2 Labor force participation rate Number in labor force
Population (aged 16 and over)
3 Unemployment rate Number unemployedNumber in labor force
4 Employmentpopulation ratio Number employedPopulation (aged 16 and over)
T H U M B N A I L S K E T C H
176 P A R T 3 Core Macroeconomics
teenagers was approximately three times the rate for those twenty-five years and older
The unemployment rates for men were higher than women for all age groups
Three Types of Unemployment
Although some unemployment is consistent with economic efficiency this is not always
the case Abnormally high rates of unemployment generally reflect weak demand
conditions for labor counterproductive policies andor the inability or lack of incentive
on the part of potential workers and potential employers to arrive at mutually advan-
tageous agreements To clarify matters economists divide unemployment into three
categories frictional structural and cyclical Let us take a closer look at each of these
three classifications
Frictional UnemploymentUnemployment that is caused by constant changes in the labor market is called frictional unemployment It occurs because (1) employers are not fully aware of all available
Frictional unemploymentUnemployment due to constant changes in the economy that prevent qualified unemployed workers from being immedi-ately matched up with existing job openings It results from imperfect information and search activities related to suit-ably matching employees with employers
Source httpwwwblsgov
Newentrants(66)
Reentrants(218)
Onlayoff
(126)
Dismissedfrom previous jobs
(528)
Job leavers(62)
E X H I B I T 5
Composition of the Unemployed by Reason
This chart indicates the various reasons that people were unem-ployed in May 2009 About one-half (528 percent) of the people unemployed were dismissed from their last job More than one-quarter (284 percent) of the unemployed workers were either new entrants or reentrants into the labor force
GROUP
Total all workersMen Total Ages 16ndash19 Ages 20ndash24 Ages 25 and overWomen Total Ages 16ndash19 Ages 20ndash24 Ages 25 and over
941052671759080
18612270
CIVILIAN RATE OF UNEMPLOYMENT MAY 2009(PERCENTAGE)
Source httpwwwblsgov
E X H I B I T 6
The Unemployment Rate by Age and Gender May 2009
C H A P T E R 8 Economic Fluctuations Unemployment and Inflation 177
workers and their job qualifications and (2) available workers are not fully aware of the
jobs being offered by employers In other words the main cause of frictional unemploy-
ment is imperfect information
For example an employer looking for a new worker seldom hires the first applicant
who walks into the employment office The employer wants to find the ldquobest availablerdquo
worker to fill the opening It is costly to hire workers who perform poorly It is sometimes
even costly to terminate their employment So employers searchmdashthey expend time and
resources screening applicants in an effort to find the best-qualified workers who are will-
ing to accept their wage and employment conditions
Similarly job seekers search for their best option among the potential alternatives
They make telephone calls search newspaper ads and Internet sites submit to job inter-
views use employment services and so on The pursuit of personal gainmdashlanding jobs
that are more attractive than the current options they facemdashmotivates job seekers to engage
in job search activities
However as a job seeker finds out about more and more potential job opportunities
it becomes less likely that additional searching will uncover a more attractive option
Therefore the marginal benefit derived from a job search declines with the time spent
searching for a job because it becomes less likely that it will lead to a better position The
marginal cost of a job search rises as a more lengthy search leads to the discovery of more
attractive job opprtunities
As the marginal benefit of the job search declines and the marginal costs rise eventu-
ally a rational job seeker will conclude that additional search is no longer worth the cost
He or she will then accept the best alternative available at that point However this process
will take time and during this time the job seeker is contributing to the frictional unem-
ployment of the economy
It is important to note that even though frictional unemployment is a side effect
the job search process typically leads to improved economic efficiency and a higher real
income for employees (see the accompanying Myths of Economics feature)
Changes that affect the costs and benefits of a job search influence the level of
unemployment The Internet has had an interesting effect on the job search process
Increasingly both employers and employees are using Internet sites as a means of
communicating with each other Employers provide information about job openings in
various skill and occupational categories and employees supply information about their
education skills and experience This electronic job search process reduces information
costs and makes it possible for both employers and employees to consider quickly a wide
range of alternatives As this method of employment search becomes more widespread it
will tend to shorten the job search process and improve the matches between employers
and employees As a result frictional unemployment might be lower in the future
On the other hand a change that makes it cheaper to reject available opportunities
and continue searching for jobs will increase the level of unemployment For example
an increase in unemployment benefits would make it less costly to continue looking for a
preferred job As a result job seekers will expand the length of their search time and the
unemployment rate will rise
Structural UnemploymentIn the case of structural unemployment changes in the basic characteristics of the
economy prevent the ldquomatching uprdquo of available jobs with available workers It is not
always easy to distinguish between frictional and structural unemployment In each case
job openings and potential workers searching for jobs are both present The crucial differ-
ence between the two is that with frictional unemployment workers possess the necessary
skills to fill the job openings with structural unemployment they do not Essentially the
primary skills of a structurally unemployed worker have been rendered obsolete by chang-
ing market conditions and technology Realistically the structurally unemployed worker
faces the prospect of either a career change or prolonged unemployment For older work-
ers in particular these are bleak alternatives
Structural unemploymentUnemployment due to the structural characteristics of the economy that make it difficult for job seekers to find employ-ment and for employers to hire workers Although job openings are available they generally require skills many unemployed workers do not have
178 P A R T 3 Core Macroeconomics
There are many causes of structural unemployment The introduction of new prod-
ucts and production technologies can substantially alter the relative demand for workers
with various skills Changes of this type can affect the job opportunities of even highly
skilled workers particularly if their skills are not easily transferable to other industries and
occupations The ldquocomputer revolutionrdquo has dramatically changed the job opportunities of
many workers The alternatives available to workers with the skills required to operate and
maintain high-tech equipment have improved substantially while the prospects of those
without such skills have in some cases deteriorated drastically
Shifts in public-sector priorities can also cause structural unemployment For example
environmental regulations designed to improve air quality led to a reduction in the demand
for coal during the 1990s As a result many coal miners in West Virginia Kentucky and
other coal-mining states lost their jobs Unfortunately the skills of many of the job losers
were ill-suited for employment in expanding industries Structural unemployment was the
result
Institutional factors can also make it difficult for some workers to find jobs For
example minimum-wage legislation may push the wages of low-skilled workers above
their productivity levels and thereby severely retard the job opportunities available to them
High unemployment benefits reduce the opportunity cost of unemployment and may also
lead to higher levels of structural unemployment See Applications in Economics for a
suggested policy alternative that would reduce the adverse unintended consequences of the
current unemployment benefit system
ldquoUnemployment would not exist if the
economy were operating efficientlyrdquo
Nobody likes unemployment Certainly an extended period of unemployment can be a very painful experience Looking for a job however performs an important labor market function It leads to improved matches between workersrsquo skills and employersrsquo job requirements
Job searchers are ldquoshoppingrdquomdashthey are searching for information about the job opportunity that best fits their skills earning capabilities and preferences Similarly employers shop when they are seeking labor services They too acquire information about available workers that will help them select employees whose skills and preferences match the demands of the job
This shopping results in some unemployment but it also provides both employees and employers with information that will help them make better choices If the resources of an economy are going to be used effectively the skills of workers must be matched well with the jobs of employers Waste will result if for example a person with high-level computer skills ends up working as a janitor while someone else with minimal computer skills is employed as a computer programmer Moreover as workers try to find jobs for which their skills are well suited they achieve higher wage rates and the economy is able to generate a larger output
Perhaps thinking about the housing market will help you better understand why search time can be both beneficial and productive Like the employment market the housing market is characterized by imperfect information and dynamic change New housing structures are built older structures depreciate and are torn down Families move from one community to another In this dynamic world it makes sense for renters to shop around from time to time to find the housing quality price and location that best fit their preferences and budgets Similarly landlords search among renters seeking to rent their accommodations to those who value them most highly As a result of this shopping housing vacancies inevitably occur But does this mean the housing market is inefficient No It is the result of imperfect information and the search for a more efficient match on the part of both landlords and renters
Of course some types of unemployment particularly cyclical unemployment are indicative of inefficiency However this is not the case with frictional unemployment The job searching (as well as the frictional unemployment that accompanies it) helps both job seekers and employers make better choices and it leads to a more efficient match of applicants with job openings than would otherwise be possible It is perfectly consistent with economic efficiency
MYTHS OF ECONOMICS
C H A P T E R 8 Economic Fluctuations Unemployment and Inflation 179
Cyclical UnemploymentWhen there is a general downturn in business activity cyclical unemployment arises
Because fewer goods are being produced fewer workers are required to produce them
Employers lay off workers and cut back employment
An unexpected fall in the general level of demand for goods and services will cause
cyclical unemployment to rise In a world of imperfect information adjustments to
unexpected declines in demand are often painful for people When the demand for labor
declines workers will at first not know whether they are being laid off because their
employer is experiencing lower demand or if the reduction in demand is widespread
throughout the economy Similarly they will not immediately know whether their poor
current employment opportunities are temporary or long-term If a reduction in demand is
limited to only a few employers the dismissed workers will generally be able to find jobs
with other employers in a short period of time The situation is different however when
there is a general decline in demand Many employers will lay off workers and few other
employers will be hiring Under these circumstances workersrsquo search efforts will be less
fruitful and the duration of their unemployment abnormally long Unemployment of this
type is referred to as cyclical unemployment As we proceed we will consider the causes
of cyclical unemployment and analyze how it might be reduced
Cyclical unemploymentUnemployment due to reces-sionary business conditions and inadequate labor demand
Would Personal Savings Accounts
Reduce the Rate of Unemployment
Under the current unemployment insurance system workers and their employers are required to pay taxes on wages and salaries which are used to finance benefits for unemployed workers covered by the program Typically the benefits replace about 50 percent of a workerrsquos prior pretax earn-ings for up to twenty-six weeks During recent recessions Congress has extended benefits for an additional thirteen weeks In Europe however unemployment benefits are even higher and people are permitted to draw the benefits for longer time periodsmdashoften two or three years
Unfortunately unemployment programs have an unin-tended secondary effect They increase the unemployment rate The benefits make it less costly for an unemployed worker to turn down available jobs and continue searching while receiving the payments They also reduce the incen-tive of the unemployed to switch occupations or move to another location in order to find employment As a result workers stay unemployed longer and the overall unemploy-ment rate is higher than it would be otherwise In fact empirical evidence indicates that there is a spike in the number of unemployed workers obtaining employment just prior to and immediately after their unemployment benefits are exhausted The persistently higher unemploy-ment rates in Europe (see Exhibit 8) where the benefits are more generous also indicate that the program pushes the
unemployment rate upward perhaps by as much as 2 or 3 percentage points
To deal with this problem Lawrence Brunner and Stephen Colarelli have proposed that a system of personal savings accounts be substituted for the current system1 Instead of paying a payroll taxemployees and their employ-ers would make equivalent payments into an unemployment personal savings account owned by the employee Workers could then access the funds in their accounts during peri-ods of unemployment Upon retirement any funds remain-ing in the account would be available to the worker and in case of death unused funds would be passed along to the workerrsquos heirs Because this system would mean that workers would be using their own funds rather than the gov-ernmentrsquos during periods of unemployment the approach would eliminate the perverse incentive structure caused by the current system
Question for Thought
1 Would the proposed reform increase the incentive to search for and accept employment rather than undergo lengthy periods of unemployment Why or why not Can you think of problems this system would create compared with the current system
1Lawrence Brunner and Stephen M Colarelli ldquoIndividual Unemployment Accountsrdquo
Independent Review 8 (Spring 2004) 569ndash85
APPLICATIONS IN ECONOMICS
180 P A R T 3 Core Macroeconomics
Employment Fluctuationsmdash
The Historical Record
Employment and output are closely linked over the business cycle If we are going to pro-
duce more goods and services we must either increase the number of workers or increase
the output per worker Although productivity or output per worker is the primary source
of long-term economic growth it changes slowly from year to year Consequently rapid
increases in output such as those that occur during a strong business expansion generally
require an increase in employment As a result output and employment tend to be posi-
tively related Conversely there is an inverse relationship between growth of output and
the rate of unemployment
The empirical evidence is consistent with this view As EXHIBIT 7 shows the unem-
ployment rate generally increases during a recession (indicated by shading) and declines
during periods of expansion in output During the recession of 1960ndash1961 the rate of
unemployment rose to approximately 7 percent In contrast it declined throughout the
economic boom of the 1960s only to rise again during the recession of 1970 During the
recession of 1974ndash1975 the unemployment rate jumped to more than 9 percent Similarly
it soared to nearly 11 percent during the severe recession of 1982 and to over 9 percent
during the 2008ndash2009 recession Conversely it declined substantially during the expan-
sions of 1983ndash1989 1992ndash2000 and 2002ndash2006
Full Employment and the Natural Rate of UnemploymentFull employment a term widely used by economists and public officials alike does not
mean zero unemployment As we have noted in a world of imperfect information both
employees and employers will ldquoshoprdquo before they agree to accept a job or hire a new
Full employmentThe level of employment that results from the efficient use of the labor force taking into account the normal (natural) rate of unemployment due to information costs dynamic changes and the structural conditions of the economy For the United States full employ-ment is thought to exist when approximately 95 percent of the labor force is employed
E X H I B I T 7
The Unemployment Rate 1960ndash2009
Here we illustrate the rate of unemployment during the 1960ndash2009 period As expected the unemploy-ment rate rose rapidly during each of the seven recessions (The shaded years indicate recessions) In con-trast soon after each recession ended the unemployment rate began to decline as the economy moved to an expansionary phase of the business cycle Also note that the actual rate of unemployment was substan-tially greater than the natural rate during and immediately following each recession
Source httpwwwblsgov and Robert J Gordon Macroeconomics (Boston Addison-Wesley 2009)
1960 1965 1970 1975 1980
Year
1985 1990 1995
2
0
4
6
8
10
12
Per
cent
age
of th
el a
bor
forc
e un
empl
oyed
Natural rate ofunemployment
Actual rate ofunemployment
2000 2005 2009
C H A P T E R 8 Economic Fluctuations Unemployment and Inflation 181
worker Much of this shopping is efficient because it leads to better matches between the
skills of employees and the skills employers need Some unemployment is therefore neces-
sary for a dynamic labor market to operate efficiently Consequently economists define full employment as the level of employment that results when the rate of unemployment is ldquonormalrdquo considering both frictional and structural factors In the United States full
employment is currently believed to be approximately 95 percent of the labor force or
perhaps just slightly above this figure
Closely related to the concept of full employment is the natural rate of unemploy-ment the amount of unemployment reflected by job shopping and imperfect information
The natural rate of unemployment is not a temporary high or low it is a rate that is sustainable Economists sometimes refer to it as the unemployment rate accompanying the economyrsquos ldquomaximum sustainablerdquo rate of output When unemployment is at its
natural rate full employment is present and the economy is achieving the highest rate of
output that it can sustain
The natural rate of unemployment however is not fixed It is affected by the struc-
ture of the labor force and by changes in public policy Over time changes in the demo-
graphic composition of the labor force will influence the natural rate The natural rate of
unemployment increases when youthful workers expand as a proportion of the workforce
Because youthful workers change jobs and move in and out of the labor force often they
experience high rates of unemployment (see Exhibit 6) Therefore the overall rate of
unemployment is pushed upward as they become a larger share of the labor force This is
what happened during the 1960s and 1970s In 1960 youthful workers (ages sixteen to
twenty-four) constituted only 16 percent of the labor force But as the postwar baby boom
generation entered the labor market youthful workers as a share of the labor force rose
dramatically By 1980 one out of every four workers was in the youthful-worker group-
ing In contrast prime-age workers (over age twenty-five) declined from 84 percent of the
US workforce in 1960 to only 75 percent in 1980 As a result of these demographic
changes studies indicate that the natural rate of unemployment rose from approximately
5 percent in the late 1950s to more than 6 percent in the mid-1980s
Since the late 1980s the situation has reversed The natural rate of unemployment has
declined as the baby boomers moved into their prime working years and youthful workers
shrank as a share of the labor force Today most researchers estimate that the natural rate
is once again about 5 percent or perhaps even a little lower
Public policy also affects the natural rate of unemployment When public policy makes
it more costly to employ workers andor less costly for people to remain unemployed it
increases the natural rate of unemployment The economies of France Germany Italy
and Spain illustrate this point Labor markets in these four countries are characterized by
generous unemployment benefits and regulations that both increase the cost of dismissing
workers and mandate uniform wages nationwide Regulations of this type reduce the flex-
ibility of labor markets and make it more costly to hire and employ workers Persistently
high rates of unemployment will result as can be seen in EXHIBIT 8 The unemployment
rates of the countries with highly regulated labor markets were substantially higher during
the last decade than the comparable figures for the United States Japan and the United
Kingdom where labor markets are less regulated High unemployment rates over lengthy
time periods are indicative of structural rather than cyclical factors
The relationship between the actual unemployment rate and the natural unemploy-
ment rate for the United States over the last four decades can be observed in Exhibit 7
Note that the actual unemployment rate fluctuates around the natural rate in response to
cyclical economic conditions The actual rate generally rises above the natural rate dur-
ing a recession and falls below the natural rate when the economy is in the midst of an
economic boom For example the actual rate of unemployment was substantially above
the natural rate during the recessions of 1974ndash1975 1982 and 2008ndash2009 The reverse
was true during the latter stages of the lengthy expansions of the 1960s 1980s 1990s and
2000s As we proceed we will often compare the actual and natural rates of unemploy-
ment In a very real sense macroeconomics studies why the actual and natural rates differ
and attempts to discern the factors that cause the natural rate to change over time
Natural rate of unemploymentThe ldquonormalrdquo unemployment rate due to frictional and structural conditions in labor markets It is the unemploy-ment rate that occurs when the economy is operating at a sustainable rate of output The current natural rate of unem-ployment in the United States is thought to be approximately 5 percent
182 P A R T 3 Core Macroeconomics
Actual and Potential GDP
If an economy is going to realize its potential full employment is essential When the
actual rate of unemployment exceeds the natural rate the actual output of the economy
will fall below its potential Potential output does not represent the absolute maximum
level of production that could for example be generated in wartime or other situations
during which the level of aggregate demand is abnormally high Rather it is the rate that
would be expected under more normal circumstances
Potential output can therefore be thought of as the maximum sustainable output
level consistent with the full employment of resources currently available in the economy
To estimate the economyrsquos potential output level we need to look at three factors the size
of the labor force the quality (productivity) of labor and the natural rate of unemploy-
ment Because these factors cannot be estimated with certainty some variation exists in the
estimated values of the potential rate of output
EXHIBIT 9 shows the relationship between the actual and potential output of the
United States since 1960 The relationship between actual and potential GDP reflects
the business cycle Note the similarity of the actual real GDP data of Exhibit 9 and the
hypothetical data of an idealized business cycle of Exhibit 2 Although the actual data of
Exhibit 9 are irregular compared to the hypothetical data periods of expansion and eco-
nomic boom followed by contraction and recession are clearly observable During the
boom phase actual output expands rapidly and may temporarily exceed the economyrsquos
long-run potential In contrast recessions are characterized by an actual real GDP that is
less than its potential As we proceed we will focus on how we can achieve maximum
potential output while minimizing economic instability
The Effects of Inflation
Inflation is a sustained increase in the general level of prices When inflation is on the rise
it costs more to purchase a typical bundle of goods and services Of course even when
the general level of prices is stable some prices will be rising and others will be falling
During a period of inflation however the impact of the rising prices will outweigh the
impact of falling prices Because of the higher prices (on average) a dollar will purchase
Potential outputThe level of output that can be achieved and sustained in the future given the size of the labor force its expected pro-ductivity and the natural rate of unemployment consistent with the efficient operation of the labor market Actual output can differ from the economyrsquos potential output
Source httpwwwoecdorg
Percentage
Spain
France
Germany
Italy
United Kingdom
United States
Japan 46
50
53
84
86
104
85
2001501005000
E X H I B I T 8
Average Unemployment Rate for Major Economies 1999ndash2008
C H A P T E R 8 Economic Fluctuations Unemployment and Inflation 183
less than it did previously Inflation therefore can also be defined as a decline in the value
(the purchasing power) of money
How do we determine whether prices are generally rising or falling Essentially we
answered that question in the preceding chapter when we indicated how a price index is
constructed When the general level of prices is rising the price index will also rise In
turn the annual rate of inflation is merely the year-to-year change in an index of the gen-
eral level of prices The consumer price index (CPI) and the GDP deflator are the price
indexes most widely used to measure the inflation rate in the United States As discussed
earlier these two measures of the rate of inflation tend to follow a similar path
Itrsquos important to note that inflation affects the prices of things we sell as well as the
prices of goods we buy Both resource and product prices are influenced by inflation
Before we become too upset about inflation ldquorobbing us of the purchasing power of our
paychecksrdquo we need to realize that inflation influences the size of those paychecks For
example the weekly earnings of employees would not have risen at a sharp annual rate
of 7 percent during the 1970s if the rate of inflation hadnrsquot increased rapidly during the
period too Wages are also a price Inflation raises both prices and wages
How rapidly has the general level of prices risen in the United States Using the
annual rate of change in the CPI EXHIBIT 10 shows the US inflation rate since the
mid-1950s During the 1950s and into the mid-1960s the annual inflation rate was gener-
ally low The average inflation rate during the 1956ndash1965 period for example was just
16 percent Beginning in the latter half of the 1960s however inflation began to accel-
erate upward jumping to 12 percent or more during 1974 1979 and 1980 During the
1973ndash1981 period the inflation rate averaged 92 percent Price increases moderated again
in the mid-1980s and the inflation rate averaged 31 percent during the period 1983ndash2009
Additional details on inflation and related measures can be obtained on the Internet at
httpwwwblsgov
The rate of inflation varies widely among countries EXHIBIT 11 provides data on
the annual inflation rates during 2002ndash2008 for Canada Germany Singapore the United
Kingdom and the United Statesmdashfive countries with low rates of inflation The annual
inflation rates of these countries were generally less than 4 percent during this period
E X H I B I T 9
The Actual and Potential GDP
Here we illustrate both the actual and potential GDP Note the gap between the actual and potential GDP during recessions
01960 1965 1970 1975 1980 1985
Year
1990 1995 2000 2005 2010
2000
4000
6000
8000
10000
12000
14000
PotentialGDP
ActualGDP
1982Recession
1974ndash1975Recession1970
Recession1960Recession
1990ndash1991Recession
1980RecessionR
eal G
DP
(bi
llion
s of
200
0 do
llars
)
2001Recession
2008ndash2009Recession
184 P A R T 3 Core Macroeconomics
moreover the year-to-year variations in inflation were relatively smallmdashtypically no more
than 1 or 2 percent
Exhibit 11 also presents parallel inflation rate data for five high-inflation countries
Romania Russia Turkey Uruguay and Venezuela In contrast with the low-inflation
countries the inflation rate of the high-inflation countries was not only higher but it also
varied substantially more from one year to another For example consider the data for
E X H I B I T 1 0
The Inflation Rate 1956ndash2009
Here we present the annual rate of inflation since 1956 Between 1956 and 1965 prices increased at an annual rate of only 16 percent In contrast the inflation rate averaged 92 percent during the 1973ndash1981 era reaching double-digit rates in several years Since 1982 the rate of inflation has been lower (the average annual rate was 31 percent during the period 1983ndash2009) and more stable
5
0
ndash5
10
15
19601956 1965 1970 1975 1980 1985 1990
Year
1995 2000 2005 2010
1973ndash1981 averageinflation rate = 92
1983ndash2009 averageinflation rate = 31
1956ndash1965 averageinflation rate = 16
Source httpwwwblsgov Also see Economic Report of the President (Washington DC Government Printing Office published annually)
COUNTRY 2002
2314
ndash041316
225158451140224
2003
27 10 05 14 23
153137253194311
2004
18 18 17 13 27
119109 86 92217
2005
22 19 05 20 34
90127 82 47160
2006
20 18 10 23 32
66 97 96 64137
2007
21 23 21 23 29
48 90 88 81187
2008
24 28 65 36 38
78141104 79304
LOW INFLATION
Canada Germany Singapore United Kingdom United States
HIGH INFLATION
Romania Russia Turkey Uruguay Venezuela
Source International Monetary Fund httpwwwimforg
E X H I B I T 1 1
Variations in the Annual Inflation Rates of Selected Countries 2002ndash2008
C H A P T E R 8 Economic Fluctuations Unemployment and Inflation 185
Venezuela The inflation rate in Venezuela jumped from 224 in 2002 to 311 in 2003 It
then receded to 137 by 2006 and rose again to reach 304 in 2008 The other countries in
the high-inflation group also experienced wide fluctuations in their annual rates of infla-
tion The data of Exhibit 11 reflect a general pattern High rates of inflation are almost always associated with substantial year-to-year swings in the inflation rate
Unanticipated and Anticipated InflationBefore we examine the effects of inflation it is important that we distinguish between
unanticipated and anticipated inflation Unanticipated inflation is an increase in the
price level that comes as a surprise at least to most individuals For example suppose
that based on the recent past most people anticipate an inflation rate of 3 percent If
the actual inflation rate turns out to be 10 percent it will catch people off guard When the
inflation rate is high and variable it will be virtually impossible for people to anticipate
it accurately
Anticipated inflation on the other hand is a change in the price level that is widely
expected Decision makers are generally able to anticipate slow steady rates of inflationmdash
like those in Canada Germany Singapore the United Kingdom and the United States
during the period 2002ndash2008mdashwith a high degree of accuracy When the general level of
prices is more stable this will exert a positive impact on real output and the level of pros-
perity The experience of the United States illustrates this point During the 1983ndash2008
period US inflation was low and relatively stable This period was characterized by
strong growth and only seventeen months of recession In contrast when the inflation
rate was high and variable during the 1970s the United States experienced two recessions
(1974ndash1975 and 1979ndash1980) and sluggish growth of real GDP
Why Does Inflation Adversely Affect the EconomyPeople will not be able to predict high and variable rates of inflation There are three major
reasons why such rates will adversely affect GDP and the overall health of the economy
1 HIGH AND VARIABLE INFLATION REDUCES INVESTMENT Unanticipated infla-
tion alters the outcomes of long-term projects such as the purchase of a machine or an
investment in a business it will increase the risks and retard the level of such productive
activities For example when the price level rises 15 percent one year and 40 percent the
next year and then increases again by 20 percent the following year no one knows what
to expect Unanticipated changes of even 5 percent or 10 percent in the rate of inflation
can often turn an otherwise profitable project into a personal economic disaster Given the
uncertainty that it creates many decision makers will simply forgo capital investments and
other transactions involving long-term commitments when the rate of inflation is highly
variable and therefore unpredictable As a result mutually advantageous gains from trade
will be lost and the efficiency of markets reduced
2 INFLATION DISTORTS THE INFORMATION DELIVERED BY PRICES Prices com-
municate important information concerning the relative scarcity of goods and resources
Some prices can be easily and regularly changed But this will not be true for others
particularly those set by long-term contracts For example time delays will occur before
the prices accompanying rental lease agreements items sold in catalogs mortgage inter-
est rates and collective bargaining contracts can be changed Because some prices will
respond quickly to inflation whereas others will change more slowly an unanticipated
change in the rate of inflation will change relative prices as well as the general price level The distorted relative prices will be a less reliable indicator of relative scarcity As a result
of these unreliable price signals producers and resource suppliers will often make choices
that they will later regret and the allocation of resources will be less efficient than it would
have been if the general level of prices had been more stable
Unanticipated inflationAn increase in the general level of prices that was not expected by most decision makers
Anticipated inflationAn increase in the general level of prices that was expected by most decision makers
186 P A R T 3 Core Macroeconomics
3 HIGH AND VARIABLE INFLATION RESULTS IN LESS PRODUCTIVE USE OF
RESOURCES Failing to anticipate accurately the inflation rate can have a substantial
effect on onersquos wealth Because of this when the inflation rate is high people will spend
more of their time and money trying to predict and cope with the future rate of inflation
These are resources that could have been used to produce goods and services demanded
by the marketplace For example managers will spend more time coping with frequent
price changes and less time improving production methods and products Speculative
market practices will occur as people try to outguess one another about the future direction
of prices As a result funds will flow into speculative-type investments instead of more
productive ones that increase output
What Causes InflationWe need to acquire some additional tools of analysis before we can answer in detail the
question of what causes inflation However at this point we can list two particular causes
First economists emphasize the link between aggregate demand and supply If aggregate
demand rises more rapidly than supply prices will rise Second nearly all economists
believe that a rapid expansion in a nationrsquos stock of money causes inflation The old say-
ing is that prices will rise because ldquothere is too much money chasing too few goodsrdquo The
hyperinflation experienced by South American countries and more recently by Russia and
several other countries of the former Soviet Union has mainly been the result of monetary
expansion Once we develop additional knowledge about the operation of our economy
we will consider this issue in more detail
In this chapter we looked at business cycles and how they affect employment and how inflation both anticipated and unanticipated affects output In the next chapter we will begin to develop a macroeconomic model that will help us better understand the factors that influence these indicators of economic performance
L o o k i n g a h e a d
During the past century real GDP in the United
States has grown at an average annual rate of
approximately 3 percent Cyclical movements in
real GDP have accompanied this growth of output
The four phases of the business cycle are expan-sion peak (or boom) contraction and recession A
recession is defined as two back-to-back quarters of
declining real GDP If a recession is quite severe it
is called a depression
There are three types of unemployment
(1) frictional unemployment (2) structural
unemployment and (3) cyclical unemployment
In a world of imperfect information and dynamic
change some unemployment is inevitable
Full employment is the employment level consistent
with the economyrsquos natural rate of unemployment
Both full employment and the natural rate of
unemployment are associated with the economyrsquos
maximum sustainable rate of output
Potential output is the maximum sustainable output
level consistent with the economyrsquos resource base
and current institutional arrangements
Inflation is an increase in the general level of prices
It is important to distinguish between anticipated
K E Y P O I N T S
A s we have already discussed macroeconomics is about growth of income and fluctuations in that
growth The primary objectives of macroeconomic policy are to help promote rapid and stable
growth a high level of employment and stability in the general level of prices These goals are gen-
erally considered desirable However there is sometimes controversy about how they can best be
achieved As we proceed we will analyze both economic growth and stability in detail and consider how both
of these objectives can be attained
The performance of the economy influences our job opportunities income levels and quality of life Thus
key indicators of economic performance such as growth of real GDP the rate of unemployment and the infla-
tion rate are closely watched by investors politicians and the media This chapter will focus on how several key
economic indicators are derived and explain how changes in these measures influence our lives
Swings in the Economic Pendulum
During the last hundred years the annual growth rate of real GDP in the United States has
averaged approximately 3 percent But there have also been considerable fluctuations in
year-to-year growth During the Great Depression of the 1930s economic growth plunged
Real GDP declined by 75 percent or more each year from 1930 to 1932 In 1933 it was
almost 30 percent less than it was in 1929 The 1929 level of real GDP was not reached
again until 1939 World War II was characterized by a rapid expansion of GDP which was
followed by a decline after the war Real GDP did not reach its 1944 level again until 1953
although the output of consumer goods did increase significantly in the years immediately
following the war
EXHIBIT 1 presents the growth rate figures (four-quarter moving average) for real
GDP for 1960ndash2009 Real GDP grew rapidly throughout most of the 1960s the periods
1972ndash1973 1976ndash1977 and 1983ndash1988 and most of the 1990s Since 1960 however
there have also been seven periods (1960 1970 1974ndash1975 1980 1982 1991 2001 and
2008 ndash2009) of falling real GDP Although the economic ups and downs have continued
the fluctuations have been less severe in recent decades than during the first fifty years of
the twentieth century Figures on GDP and related data can be obtained from the Bureau
of Economic Analysis on the Internet at httpwwwbeagov
A Hypothetical Business CycleThe United States and other industrial economies have been characterized by instability
when it comes to the growth of real GDP Inevitably real GDP growth has been followed
by economic slowdowns Economists refer to these swings in the rate of output as the
business cycle Periods of growth in real output and other aggregate measures of eco-
nomic activity followed by periods of decline are the characteristics of business cycles
EXHIBIT 2 shows a hypothetical business cycle When most businesses are operating
at capacity level and real GDP is growing rapidly a business peak or boom is pres-
ent As business conditions slow the economy begins the contraction or recessionary
phase of a business cycle During the contraction the sales of most businesses decline
real GDP grows at a slower rate or perhaps falls and unemployment in the labor market
increases
The bottom of the contraction phase is referred to as the recessionary trough After
the downturn reaches bottom and economic conditions begin to improve the economy
enters the expansion phase of the cycle Here business sales rise GDP grows rapidly
Business cycleFluctuations in the general level of economic activity as measured by variables such as the rate of unem-ployment and changes in real GDP
170
C H A P T E R 8 Economic Fluctuations Unemployment and Inflation 171
and the rate of unemployment declines Eventually the expansion blossoms into another
business peak The peak however inevitably ends and turns into a contraction beginning
the cycle anew
The term recession is widely used to describe conditions during the contraction and
recessionary trough phases of the business cycle This is a period during which real GDP
declines Often a recession is defined as a decline in real GDP for two or more consecu-
tive quarters1 When a recession is prolonged and has a sharp decline in economic activity
it is called a depression
RecessionA downturn in economic activity characterized by declining real GDP and rising unemployment In an effort to be more precise many economists define a recession as two consecutive quarters in which there is a decline in real GDP
DepressionA prolonged and very severe recession
E X H I B I T 1
Instability in the Growth of Real GDP 1960-2009
Although real GDP in the United States fluctuates substantially periods of positive growth outweigh the periods of declining real GDP Since 1960 the US growth rate of real GDP has averaged approximately 3 percent annually Economists refer to periods of declining real GDP as recessions The recessionary periods are shaded
Source Economic Report of the President (Washington DC Government Printing Office various issues)
1See Geoffrey H Moore ldquoRecessionsrdquo in The Fortune Encyclopedia of Economics ed David R Henderson (New York Time
Warner Inc 1993) for additional information on recessions in the United States This publication is also available online at
httpwwweconliborg
ndash4
ndash2
0
2
4
6
8
10
1960 1965 1970 1975 1980 1985 1990 1995Year
2000 2005 2009
Ann
ual r
ate
of g
row
th in
rea
l GD
P
Long-rungrowth rate
(approx 3)
During economic expansions construction and investment are increasing In contrast recessions are characterized by plant closings and high unemployment
Jim
Str
atfo
rdB
loom
berg
New
sLa
ndov
Spe
ncer
Pla
ttG
etty
Im
ages
172 P A R T 3 Core Macroeconomics
In one important respect the term business cycle is misleading The word cycle is often
used to describe events of similar time length that occur regularly like the seasons of the
year for example As Exhibit 1 illustrates this is not the case with the business cycle The
expansions and contractions last varying lengths of time and the swings differ in terms of
their magnitude For example the recessions of 1961 1982 and 1990 were followed by
eight years or more of uninterrupted growth of output In contrast the recession of 1980
was followed by an expansion that lasted only twelve months The expansionary phase
following the recessions of 1970 and 1974ndash1975 fell between these two extremes Clearly
the duration of real-world expansions and contractions is varied and unpredictable
How can we know where an economy is in the business cycle Of course changes in
real GDP will tell us However these numbers are available only quarterly and it usually
takes four to six weeks after the quarter is over before reliable figures are released Various
measures that are available monthly or more often can provide clues For example auto
sales new housing starts new factory orders and even the stock market will generally
increase during an expansion and decline when the economy dips into a recession As a
result these indicators are monitored carefully
Economic Fluctuations
and the Labor Market
Fluctuations in real GDP influence the demand for labor and employment In our modern
world people are busy with jobs household work school and other activities EXHIBIT 3
illustrates how economists classify these activities in relation to the civilian labor force
defined as the number of people aged sixteen years and over who are either employed or
seeking employment The noninstitutional civilian adult population is divided into two
broad categories (1) people not in the labor force and (2) people in the labor force There
are various reasons why people arenrsquot in the labor force Some are retired Others are
working in their own households or attending school Still others are not working because
they are ill or disabled Although many of these people are quite busy their activities
lie outside the market labor force
As Exhibit 3 shows unemployed workers who are seeking work are included in
the labor force along with employed workers The labor force participation rate is the
number of people in the civilian labor force (including both those who are employed and
those who are unemployed) as a percentage of the civilian population sixteen years of age
Civilian labor forceThe number of people sixteen years of age and over who are either employed or unem-ployed To be classified as unemployed a person must be looking for a job
UnemployedThe term used to describe a person not currently employed who is either (1) actively seek-ing employment or (2) waiting to begin or return to a job
Labor force participation rateThe number of people in the civilian labor force sixteen years of age or over who are either employed or actively seeking employment as a percentage of the total civilian population sixteen years of age and over
Rea
l GD
P
Time
Businesspeak
Contraction
Exp
ansi
on
Recessionarytrough
Businesspeak
Trend line
E X H I B I T 2
The Business Cycle
In the past ups and downs have often characterized aggregate business activity Despite these fluctuations there has been an upward trend in real GDP in the United States and other industrial nationsDuring economic expansions construction and investment are increasing In contrast recessions are characterized by plant closings and high unemployment
C H A P T E R 8 Economic Fluctuations Unemployment and Inflation 173
and over In May 2009 the population (sixteen years of age and over) of the United States
was 2355 million 1551 million of whom were in the labor force Thus the US labor
force participation rate was 659 percent (1551 million divided by 2355 million)
The labor force participation rate varies substantially across countries For example in
2008 the labor force participation rate of fifteen- to sixty-four-year-olds was 753 percent
in the United States 788 percent in Canada and 802 percent in Sweden In contrast the
labor force participation rate was only 622 percent in Mexico and 630 percent in Italy
The percentage of married women in the labor force is generally smaller in countries like
Italy and Mexico that have low labor force participation rates
In the United States one of the most interesting labor force developments in
recent decades is the dramatic increase in the labor force participation rate of women
EXHIBIT 4 illustrates this point In 2008 595 percent of adult women worked outside the
home up from 327 percent in 1948 Married women accounted for most of this increase
More than half of all married women now are in the labor force compared to only 20 percent
immediately following World War II While the labor force participation of women rose the
rate for men fell In 2008 the labor force participation rate of men was 730 percent down
from 833 percent in 1960 and 866 percent in 1948 Clearly the composition of workforce
participation within the family has changed substantially during the past six decades
The unemployment rate is a key barometer of conditions in the aggregate labor
market This not withstanding the term is often misunderstood It is important to note
that unemployment is different from not working As we previously discussed there are
several reasonsmdashincluding household work school attendance retirement and illness or
disabilitymdashwhy a person may be neither employed nor looking for a job These people
though not employed are not counted as unemployed
Unemployment rateThe percentage of people in the labor force who are unem-ployed Mathematically it is equal to the number of people unemployed divided by the number of people in the labor force
E X H I B I T 3
Population Employment and Unemployment May 2009
The accompanying diagram illustrates the alternative participation-status categories for the adult population Data are measured in millions except those expressed as percentages
Source httpwwwblsgov
Civilian population16 and over
Not in thelabor force
Civilianlabor force
Employed
Household workersStudentsRetireesDisabled
EmployeesSelf-employed
workers
UnemployedNew entrantsReentrantsLost last jobQuit last jobLaid off
Noninstitutional civilian population (age 16 and over) Not in labor force Total civilian labor force Employed UnemployedLabor force participation rateEmploymentpopulation ratioUnemployment rate
NUMBER OF
PERSONS MAY 2009
2355 80415511406
145 659 597 94
174 P A R T 3 Core Macroeconomics
Moreover only people employed or unemployed are counted as part of the labor
force Part-time as well as full-time workers are counted as employed members of the
labor force The rate of unemployment is the number of people unemployed expressed as a
percentage of the labor force In May 2009 the rate of unemployment in the United States
was 94 percent (145 million out of a labor force of 1551 million) (See the accompany-
ing Measures of Economic Activity feature for information on how the Bureau of Labor
Statistics derives the unemployment rate)
Deriving the Unemployment Rate
Each month the Bureau of Labor Statistics (BLS) contacts a sample of 50000 households that reflects the population characteristics of the United States Specially trained interviewers pose identical questions designed to determine whether each of the approximately 90000 adults in these households is employed unemployed or not in the labor force People aged sixteen years and over are considered employed if they (1) worked at all (even as little as 1 hour) for pay or profit during the survey week (2) worked 15 hours or more without pay in a family-operated enterprise during the survey week or (3) have a job at which they did not work during the survey week because of illness vacation industrial disputes bad weather time off or personal reasons People are considered unemployed if they (1) do not have a job (2) are available for work and (3) have actively looked for work during the past four weeks Looking for work may involve any of the following activities (1) registering at a public or private employment office (2) meeting with prospective employers (3) checking with friends or relatives (4) placing or answering advertisements (5) writing letters of application or (6) being in a union or on a professional register In addition those not working
are classified as unemployed if they are either waiting to start a new job within thirty days or waiting to be recalled from a layoff The BLS uses its survey data to calculate the unemployment rate and other employment-related statistics each month States use the BLS survey and employment figures from industries covered by unemployment insurance to construct state and area employment statistics These labor market figures are published by the US Department of Labor in the Monthly Labor Review and on the Internet at httpwwwblsgov
MEASURES OF ECONOMIC ACTIVITY
Joel
Ste
tten
heim
CO
RB
IS
19901975
WomenMen
866833
0
20
40
60
80
100
779 764
2008
730
327 377
463
575
1948 1960 1990
595
200819751948 1960
Labo
r fo
rce
part
icip
atio
n ra
te
Source httpwwwblsgov
E X H I B I T 4
Labor Force Participation Rate of Men and Women 1948ndash2008
As the chart illustrates the labor force participation rate for women has been steadily increasing for several decades while the rate for men has been declining
C H A P T E R 8 Economic Fluctuations Unemployment and Inflation 175
In addition to the rate of unemployment many economists also use the employmentpopulation ratiomdashthe number of people employed expressed as a percentage of the
population sixteen years old and overmdashto monitor labor market conditions This ratio will
tend to rise during an expansion and fall during a recession Both the number of people
employed and the population aged sixteen and over are well defined and readily measur-
able Their measurement does not require a subjective judgment as to whether a person is
actually ldquoavailable for workrdquo or ldquoactively seeking employmentrdquo Thus some believe that
the employmentpopulation ratio is a more objective measure of job market conditions
than the rate of unemployment The employmentpopulation ratio was 597 percent in
May 2009 The accompanying Thumbnail Sketch shows the formulas that are used to
calculate the major indicators of labor market conditions
Dynamic Change and Reasons for UnemploymentIn a dynamic world where information is scarce and people are free to choose among
jobs some unemployment is inevitable As new products are introduced and new technolo-
gies developed some firms are expanding while others are contracting Similarly some
firms will be starting operations while others will be going out of business This process
results in the creation of new jobs and the disappearance of old ones At the same time
some potential workers will be switching from school or other nonwork activities to the
labor force while others are retiring or taking a leave from the labor force Furthermore
workers are mobile At any point in time some will voluntarily quit and search for better
opportunities Although some unemployment will always be present there is a positive
side to the unemploymentndashjob search process it makes it possible for individuals to better
match their skills and preferences with the job requirements of employers Better-matched
employees and employers increase both productivity and earnings
Unemployment may occur for reasons other than the loss of a job however For
example people often experience periods of unemployment as they enter and reenter
the labor force The Department of Labor lists five reasons why workers may experi-
ence unemployment EXHIBIT 5 shows the share of unemployed workers in each of
these five categories in May 2009 Interestingly 66 percent of the unemployed work-
ers were first-time entrants into the labor force 218 percent were reentering the labor
force after exiting it to obtain additional schooling do household work or for other
reasons Therefore 284 percent of the unemployed workersmdashover one-quartermdashwere
unemployed because they were entering or reentering the labor force About one out of
every sixteen unemployed workers (62 percent) quit their job People laid off and wait-
ing to return to their previous positions contributed 126 percent to the total Workers
dismissed from their job accounted for about one-half (528 percent) of the total number
of unemployed workers
Young workers often switch jobs and move between schooling and the labor force
as they search for a career path that best fits their abilities and preferences As the result
of this job switching the unemployment rate of younger workers is substantially higher
than that of more established workers As EXHIBIT 6 shows the unemployment rate of
workers twenty to twenty-four years of age in May 2009 was nearly twice the rate for
their counterparts aged twenty-five years and over Further the unemployment rate for
Employmentpopulation ratioThe number of people sixteen years of age and over employed as civilians divided by the total civilian population sixteen years of age and over The ratio is expressed as a percentage
Formulas for Key Labor Market Indicators
1 Labor force Employed Unemployed2 Labor force participation rate Number in labor force
Population (aged 16 and over)
3 Unemployment rate Number unemployedNumber in labor force
4 Employmentpopulation ratio Number employedPopulation (aged 16 and over)
T H U M B N A I L S K E T C H
176 P A R T 3 Core Macroeconomics
teenagers was approximately three times the rate for those twenty-five years and older
The unemployment rates for men were higher than women for all age groups
Three Types of Unemployment
Although some unemployment is consistent with economic efficiency this is not always
the case Abnormally high rates of unemployment generally reflect weak demand
conditions for labor counterproductive policies andor the inability or lack of incentive
on the part of potential workers and potential employers to arrive at mutually advan-
tageous agreements To clarify matters economists divide unemployment into three
categories frictional structural and cyclical Let us take a closer look at each of these
three classifications
Frictional UnemploymentUnemployment that is caused by constant changes in the labor market is called frictional unemployment It occurs because (1) employers are not fully aware of all available
Frictional unemploymentUnemployment due to constant changes in the economy that prevent qualified unemployed workers from being immedi-ately matched up with existing job openings It results from imperfect information and search activities related to suit-ably matching employees with employers
Source httpwwwblsgov
Newentrants(66)
Reentrants(218)
Onlayoff
(126)
Dismissedfrom previous jobs
(528)
Job leavers(62)
E X H I B I T 5
Composition of the Unemployed by Reason
This chart indicates the various reasons that people were unem-ployed in May 2009 About one-half (528 percent) of the people unemployed were dismissed from their last job More than one-quarter (284 percent) of the unemployed workers were either new entrants or reentrants into the labor force
GROUP
Total all workersMen Total Ages 16ndash19 Ages 20ndash24 Ages 25 and overWomen Total Ages 16ndash19 Ages 20ndash24 Ages 25 and over
941052671759080
18612270
CIVILIAN RATE OF UNEMPLOYMENT MAY 2009(PERCENTAGE)
Source httpwwwblsgov
E X H I B I T 6
The Unemployment Rate by Age and Gender May 2009
C H A P T E R 8 Economic Fluctuations Unemployment and Inflation 177
workers and their job qualifications and (2) available workers are not fully aware of the
jobs being offered by employers In other words the main cause of frictional unemploy-
ment is imperfect information
For example an employer looking for a new worker seldom hires the first applicant
who walks into the employment office The employer wants to find the ldquobest availablerdquo
worker to fill the opening It is costly to hire workers who perform poorly It is sometimes
even costly to terminate their employment So employers searchmdashthey expend time and
resources screening applicants in an effort to find the best-qualified workers who are will-
ing to accept their wage and employment conditions
Similarly job seekers search for their best option among the potential alternatives
They make telephone calls search newspaper ads and Internet sites submit to job inter-
views use employment services and so on The pursuit of personal gainmdashlanding jobs
that are more attractive than the current options they facemdashmotivates job seekers to engage
in job search activities
However as a job seeker finds out about more and more potential job opportunities
it becomes less likely that additional searching will uncover a more attractive option
Therefore the marginal benefit derived from a job search declines with the time spent
searching for a job because it becomes less likely that it will lead to a better position The
marginal cost of a job search rises as a more lengthy search leads to the discovery of more
attractive job opprtunities
As the marginal benefit of the job search declines and the marginal costs rise eventu-
ally a rational job seeker will conclude that additional search is no longer worth the cost
He or she will then accept the best alternative available at that point However this process
will take time and during this time the job seeker is contributing to the frictional unem-
ployment of the economy
It is important to note that even though frictional unemployment is a side effect
the job search process typically leads to improved economic efficiency and a higher real
income for employees (see the accompanying Myths of Economics feature)
Changes that affect the costs and benefits of a job search influence the level of
unemployment The Internet has had an interesting effect on the job search process
Increasingly both employers and employees are using Internet sites as a means of
communicating with each other Employers provide information about job openings in
various skill and occupational categories and employees supply information about their
education skills and experience This electronic job search process reduces information
costs and makes it possible for both employers and employees to consider quickly a wide
range of alternatives As this method of employment search becomes more widespread it
will tend to shorten the job search process and improve the matches between employers
and employees As a result frictional unemployment might be lower in the future
On the other hand a change that makes it cheaper to reject available opportunities
and continue searching for jobs will increase the level of unemployment For example
an increase in unemployment benefits would make it less costly to continue looking for a
preferred job As a result job seekers will expand the length of their search time and the
unemployment rate will rise
Structural UnemploymentIn the case of structural unemployment changes in the basic characteristics of the
economy prevent the ldquomatching uprdquo of available jobs with available workers It is not
always easy to distinguish between frictional and structural unemployment In each case
job openings and potential workers searching for jobs are both present The crucial differ-
ence between the two is that with frictional unemployment workers possess the necessary
skills to fill the job openings with structural unemployment they do not Essentially the
primary skills of a structurally unemployed worker have been rendered obsolete by chang-
ing market conditions and technology Realistically the structurally unemployed worker
faces the prospect of either a career change or prolonged unemployment For older work-
ers in particular these are bleak alternatives
Structural unemploymentUnemployment due to the structural characteristics of the economy that make it difficult for job seekers to find employ-ment and for employers to hire workers Although job openings are available they generally require skills many unemployed workers do not have
178 P A R T 3 Core Macroeconomics
There are many causes of structural unemployment The introduction of new prod-
ucts and production technologies can substantially alter the relative demand for workers
with various skills Changes of this type can affect the job opportunities of even highly
skilled workers particularly if their skills are not easily transferable to other industries and
occupations The ldquocomputer revolutionrdquo has dramatically changed the job opportunities of
many workers The alternatives available to workers with the skills required to operate and
maintain high-tech equipment have improved substantially while the prospects of those
without such skills have in some cases deteriorated drastically
Shifts in public-sector priorities can also cause structural unemployment For example
environmental regulations designed to improve air quality led to a reduction in the demand
for coal during the 1990s As a result many coal miners in West Virginia Kentucky and
other coal-mining states lost their jobs Unfortunately the skills of many of the job losers
were ill-suited for employment in expanding industries Structural unemployment was the
result
Institutional factors can also make it difficult for some workers to find jobs For
example minimum-wage legislation may push the wages of low-skilled workers above
their productivity levels and thereby severely retard the job opportunities available to them
High unemployment benefits reduce the opportunity cost of unemployment and may also
lead to higher levels of structural unemployment See Applications in Economics for a
suggested policy alternative that would reduce the adverse unintended consequences of the
current unemployment benefit system
ldquoUnemployment would not exist if the
economy were operating efficientlyrdquo
Nobody likes unemployment Certainly an extended period of unemployment can be a very painful experience Looking for a job however performs an important labor market function It leads to improved matches between workersrsquo skills and employersrsquo job requirements
Job searchers are ldquoshoppingrdquomdashthey are searching for information about the job opportunity that best fits their skills earning capabilities and preferences Similarly employers shop when they are seeking labor services They too acquire information about available workers that will help them select employees whose skills and preferences match the demands of the job
This shopping results in some unemployment but it also provides both employees and employers with information that will help them make better choices If the resources of an economy are going to be used effectively the skills of workers must be matched well with the jobs of employers Waste will result if for example a person with high-level computer skills ends up working as a janitor while someone else with minimal computer skills is employed as a computer programmer Moreover as workers try to find jobs for which their skills are well suited they achieve higher wage rates and the economy is able to generate a larger output
Perhaps thinking about the housing market will help you better understand why search time can be both beneficial and productive Like the employment market the housing market is characterized by imperfect information and dynamic change New housing structures are built older structures depreciate and are torn down Families move from one community to another In this dynamic world it makes sense for renters to shop around from time to time to find the housing quality price and location that best fit their preferences and budgets Similarly landlords search among renters seeking to rent their accommodations to those who value them most highly As a result of this shopping housing vacancies inevitably occur But does this mean the housing market is inefficient No It is the result of imperfect information and the search for a more efficient match on the part of both landlords and renters
Of course some types of unemployment particularly cyclical unemployment are indicative of inefficiency However this is not the case with frictional unemployment The job searching (as well as the frictional unemployment that accompanies it) helps both job seekers and employers make better choices and it leads to a more efficient match of applicants with job openings than would otherwise be possible It is perfectly consistent with economic efficiency
MYTHS OF ECONOMICS
C H A P T E R 8 Economic Fluctuations Unemployment and Inflation 179
Cyclical UnemploymentWhen there is a general downturn in business activity cyclical unemployment arises
Because fewer goods are being produced fewer workers are required to produce them
Employers lay off workers and cut back employment
An unexpected fall in the general level of demand for goods and services will cause
cyclical unemployment to rise In a world of imperfect information adjustments to
unexpected declines in demand are often painful for people When the demand for labor
declines workers will at first not know whether they are being laid off because their
employer is experiencing lower demand or if the reduction in demand is widespread
throughout the economy Similarly they will not immediately know whether their poor
current employment opportunities are temporary or long-term If a reduction in demand is
limited to only a few employers the dismissed workers will generally be able to find jobs
with other employers in a short period of time The situation is different however when
there is a general decline in demand Many employers will lay off workers and few other
employers will be hiring Under these circumstances workersrsquo search efforts will be less
fruitful and the duration of their unemployment abnormally long Unemployment of this
type is referred to as cyclical unemployment As we proceed we will consider the causes
of cyclical unemployment and analyze how it might be reduced
Cyclical unemploymentUnemployment due to reces-sionary business conditions and inadequate labor demand
Would Personal Savings Accounts
Reduce the Rate of Unemployment
Under the current unemployment insurance system workers and their employers are required to pay taxes on wages and salaries which are used to finance benefits for unemployed workers covered by the program Typically the benefits replace about 50 percent of a workerrsquos prior pretax earn-ings for up to twenty-six weeks During recent recessions Congress has extended benefits for an additional thirteen weeks In Europe however unemployment benefits are even higher and people are permitted to draw the benefits for longer time periodsmdashoften two or three years
Unfortunately unemployment programs have an unin-tended secondary effect They increase the unemployment rate The benefits make it less costly for an unemployed worker to turn down available jobs and continue searching while receiving the payments They also reduce the incen-tive of the unemployed to switch occupations or move to another location in order to find employment As a result workers stay unemployed longer and the overall unemploy-ment rate is higher than it would be otherwise In fact empirical evidence indicates that there is a spike in the number of unemployed workers obtaining employment just prior to and immediately after their unemployment benefits are exhausted The persistently higher unemploy-ment rates in Europe (see Exhibit 8) where the benefits are more generous also indicate that the program pushes the
unemployment rate upward perhaps by as much as 2 or 3 percentage points
To deal with this problem Lawrence Brunner and Stephen Colarelli have proposed that a system of personal savings accounts be substituted for the current system1 Instead of paying a payroll taxemployees and their employ-ers would make equivalent payments into an unemployment personal savings account owned by the employee Workers could then access the funds in their accounts during peri-ods of unemployment Upon retirement any funds remain-ing in the account would be available to the worker and in case of death unused funds would be passed along to the workerrsquos heirs Because this system would mean that workers would be using their own funds rather than the gov-ernmentrsquos during periods of unemployment the approach would eliminate the perverse incentive structure caused by the current system
Question for Thought
1 Would the proposed reform increase the incentive to search for and accept employment rather than undergo lengthy periods of unemployment Why or why not Can you think of problems this system would create compared with the current system
1Lawrence Brunner and Stephen M Colarelli ldquoIndividual Unemployment Accountsrdquo
Independent Review 8 (Spring 2004) 569ndash85
APPLICATIONS IN ECONOMICS
180 P A R T 3 Core Macroeconomics
Employment Fluctuationsmdash
The Historical Record
Employment and output are closely linked over the business cycle If we are going to pro-
duce more goods and services we must either increase the number of workers or increase
the output per worker Although productivity or output per worker is the primary source
of long-term economic growth it changes slowly from year to year Consequently rapid
increases in output such as those that occur during a strong business expansion generally
require an increase in employment As a result output and employment tend to be posi-
tively related Conversely there is an inverse relationship between growth of output and
the rate of unemployment
The empirical evidence is consistent with this view As EXHIBIT 7 shows the unem-
ployment rate generally increases during a recession (indicated by shading) and declines
during periods of expansion in output During the recession of 1960ndash1961 the rate of
unemployment rose to approximately 7 percent In contrast it declined throughout the
economic boom of the 1960s only to rise again during the recession of 1970 During the
recession of 1974ndash1975 the unemployment rate jumped to more than 9 percent Similarly
it soared to nearly 11 percent during the severe recession of 1982 and to over 9 percent
during the 2008ndash2009 recession Conversely it declined substantially during the expan-
sions of 1983ndash1989 1992ndash2000 and 2002ndash2006
Full Employment and the Natural Rate of UnemploymentFull employment a term widely used by economists and public officials alike does not
mean zero unemployment As we have noted in a world of imperfect information both
employees and employers will ldquoshoprdquo before they agree to accept a job or hire a new
Full employmentThe level of employment that results from the efficient use of the labor force taking into account the normal (natural) rate of unemployment due to information costs dynamic changes and the structural conditions of the economy For the United States full employ-ment is thought to exist when approximately 95 percent of the labor force is employed
E X H I B I T 7
The Unemployment Rate 1960ndash2009
Here we illustrate the rate of unemployment during the 1960ndash2009 period As expected the unemploy-ment rate rose rapidly during each of the seven recessions (The shaded years indicate recessions) In con-trast soon after each recession ended the unemployment rate began to decline as the economy moved to an expansionary phase of the business cycle Also note that the actual rate of unemployment was substan-tially greater than the natural rate during and immediately following each recession
Source httpwwwblsgov and Robert J Gordon Macroeconomics (Boston Addison-Wesley 2009)
1960 1965 1970 1975 1980
Year
1985 1990 1995
2
0
4
6
8
10
12
Per
cent
age
of th
el a
bor
forc
e un
empl
oyed
Natural rate ofunemployment
Actual rate ofunemployment
2000 2005 2009
C H A P T E R 8 Economic Fluctuations Unemployment and Inflation 181
worker Much of this shopping is efficient because it leads to better matches between the
skills of employees and the skills employers need Some unemployment is therefore neces-
sary for a dynamic labor market to operate efficiently Consequently economists define full employment as the level of employment that results when the rate of unemployment is ldquonormalrdquo considering both frictional and structural factors In the United States full
employment is currently believed to be approximately 95 percent of the labor force or
perhaps just slightly above this figure
Closely related to the concept of full employment is the natural rate of unemploy-ment the amount of unemployment reflected by job shopping and imperfect information
The natural rate of unemployment is not a temporary high or low it is a rate that is sustainable Economists sometimes refer to it as the unemployment rate accompanying the economyrsquos ldquomaximum sustainablerdquo rate of output When unemployment is at its
natural rate full employment is present and the economy is achieving the highest rate of
output that it can sustain
The natural rate of unemployment however is not fixed It is affected by the struc-
ture of the labor force and by changes in public policy Over time changes in the demo-
graphic composition of the labor force will influence the natural rate The natural rate of
unemployment increases when youthful workers expand as a proportion of the workforce
Because youthful workers change jobs and move in and out of the labor force often they
experience high rates of unemployment (see Exhibit 6) Therefore the overall rate of
unemployment is pushed upward as they become a larger share of the labor force This is
what happened during the 1960s and 1970s In 1960 youthful workers (ages sixteen to
twenty-four) constituted only 16 percent of the labor force But as the postwar baby boom
generation entered the labor market youthful workers as a share of the labor force rose
dramatically By 1980 one out of every four workers was in the youthful-worker group-
ing In contrast prime-age workers (over age twenty-five) declined from 84 percent of the
US workforce in 1960 to only 75 percent in 1980 As a result of these demographic
changes studies indicate that the natural rate of unemployment rose from approximately
5 percent in the late 1950s to more than 6 percent in the mid-1980s
Since the late 1980s the situation has reversed The natural rate of unemployment has
declined as the baby boomers moved into their prime working years and youthful workers
shrank as a share of the labor force Today most researchers estimate that the natural rate
is once again about 5 percent or perhaps even a little lower
Public policy also affects the natural rate of unemployment When public policy makes
it more costly to employ workers andor less costly for people to remain unemployed it
increases the natural rate of unemployment The economies of France Germany Italy
and Spain illustrate this point Labor markets in these four countries are characterized by
generous unemployment benefits and regulations that both increase the cost of dismissing
workers and mandate uniform wages nationwide Regulations of this type reduce the flex-
ibility of labor markets and make it more costly to hire and employ workers Persistently
high rates of unemployment will result as can be seen in EXHIBIT 8 The unemployment
rates of the countries with highly regulated labor markets were substantially higher during
the last decade than the comparable figures for the United States Japan and the United
Kingdom where labor markets are less regulated High unemployment rates over lengthy
time periods are indicative of structural rather than cyclical factors
The relationship between the actual unemployment rate and the natural unemploy-
ment rate for the United States over the last four decades can be observed in Exhibit 7
Note that the actual unemployment rate fluctuates around the natural rate in response to
cyclical economic conditions The actual rate generally rises above the natural rate dur-
ing a recession and falls below the natural rate when the economy is in the midst of an
economic boom For example the actual rate of unemployment was substantially above
the natural rate during the recessions of 1974ndash1975 1982 and 2008ndash2009 The reverse
was true during the latter stages of the lengthy expansions of the 1960s 1980s 1990s and
2000s As we proceed we will often compare the actual and natural rates of unemploy-
ment In a very real sense macroeconomics studies why the actual and natural rates differ
and attempts to discern the factors that cause the natural rate to change over time
Natural rate of unemploymentThe ldquonormalrdquo unemployment rate due to frictional and structural conditions in labor markets It is the unemploy-ment rate that occurs when the economy is operating at a sustainable rate of output The current natural rate of unem-ployment in the United States is thought to be approximately 5 percent
182 P A R T 3 Core Macroeconomics
Actual and Potential GDP
If an economy is going to realize its potential full employment is essential When the
actual rate of unemployment exceeds the natural rate the actual output of the economy
will fall below its potential Potential output does not represent the absolute maximum
level of production that could for example be generated in wartime or other situations
during which the level of aggregate demand is abnormally high Rather it is the rate that
would be expected under more normal circumstances
Potential output can therefore be thought of as the maximum sustainable output
level consistent with the full employment of resources currently available in the economy
To estimate the economyrsquos potential output level we need to look at three factors the size
of the labor force the quality (productivity) of labor and the natural rate of unemploy-
ment Because these factors cannot be estimated with certainty some variation exists in the
estimated values of the potential rate of output
EXHIBIT 9 shows the relationship between the actual and potential output of the
United States since 1960 The relationship between actual and potential GDP reflects
the business cycle Note the similarity of the actual real GDP data of Exhibit 9 and the
hypothetical data of an idealized business cycle of Exhibit 2 Although the actual data of
Exhibit 9 are irregular compared to the hypothetical data periods of expansion and eco-
nomic boom followed by contraction and recession are clearly observable During the
boom phase actual output expands rapidly and may temporarily exceed the economyrsquos
long-run potential In contrast recessions are characterized by an actual real GDP that is
less than its potential As we proceed we will focus on how we can achieve maximum
potential output while minimizing economic instability
The Effects of Inflation
Inflation is a sustained increase in the general level of prices When inflation is on the rise
it costs more to purchase a typical bundle of goods and services Of course even when
the general level of prices is stable some prices will be rising and others will be falling
During a period of inflation however the impact of the rising prices will outweigh the
impact of falling prices Because of the higher prices (on average) a dollar will purchase
Potential outputThe level of output that can be achieved and sustained in the future given the size of the labor force its expected pro-ductivity and the natural rate of unemployment consistent with the efficient operation of the labor market Actual output can differ from the economyrsquos potential output
Source httpwwwoecdorg
Percentage
Spain
France
Germany
Italy
United Kingdom
United States
Japan 46
50
53
84
86
104
85
2001501005000
E X H I B I T 8
Average Unemployment Rate for Major Economies 1999ndash2008
C H A P T E R 8 Economic Fluctuations Unemployment and Inflation 183
less than it did previously Inflation therefore can also be defined as a decline in the value
(the purchasing power) of money
How do we determine whether prices are generally rising or falling Essentially we
answered that question in the preceding chapter when we indicated how a price index is
constructed When the general level of prices is rising the price index will also rise In
turn the annual rate of inflation is merely the year-to-year change in an index of the gen-
eral level of prices The consumer price index (CPI) and the GDP deflator are the price
indexes most widely used to measure the inflation rate in the United States As discussed
earlier these two measures of the rate of inflation tend to follow a similar path
Itrsquos important to note that inflation affects the prices of things we sell as well as the
prices of goods we buy Both resource and product prices are influenced by inflation
Before we become too upset about inflation ldquorobbing us of the purchasing power of our
paychecksrdquo we need to realize that inflation influences the size of those paychecks For
example the weekly earnings of employees would not have risen at a sharp annual rate
of 7 percent during the 1970s if the rate of inflation hadnrsquot increased rapidly during the
period too Wages are also a price Inflation raises both prices and wages
How rapidly has the general level of prices risen in the United States Using the
annual rate of change in the CPI EXHIBIT 10 shows the US inflation rate since the
mid-1950s During the 1950s and into the mid-1960s the annual inflation rate was gener-
ally low The average inflation rate during the 1956ndash1965 period for example was just
16 percent Beginning in the latter half of the 1960s however inflation began to accel-
erate upward jumping to 12 percent or more during 1974 1979 and 1980 During the
1973ndash1981 period the inflation rate averaged 92 percent Price increases moderated again
in the mid-1980s and the inflation rate averaged 31 percent during the period 1983ndash2009
Additional details on inflation and related measures can be obtained on the Internet at
httpwwwblsgov
The rate of inflation varies widely among countries EXHIBIT 11 provides data on
the annual inflation rates during 2002ndash2008 for Canada Germany Singapore the United
Kingdom and the United Statesmdashfive countries with low rates of inflation The annual
inflation rates of these countries were generally less than 4 percent during this period
E X H I B I T 9
The Actual and Potential GDP
Here we illustrate both the actual and potential GDP Note the gap between the actual and potential GDP during recessions
01960 1965 1970 1975 1980 1985
Year
1990 1995 2000 2005 2010
2000
4000
6000
8000
10000
12000
14000
PotentialGDP
ActualGDP
1982Recession
1974ndash1975Recession1970
Recession1960Recession
1990ndash1991Recession
1980RecessionR
eal G
DP
(bi
llion
s of
200
0 do
llars
)
2001Recession
2008ndash2009Recession
184 P A R T 3 Core Macroeconomics
moreover the year-to-year variations in inflation were relatively smallmdashtypically no more
than 1 or 2 percent
Exhibit 11 also presents parallel inflation rate data for five high-inflation countries
Romania Russia Turkey Uruguay and Venezuela In contrast with the low-inflation
countries the inflation rate of the high-inflation countries was not only higher but it also
varied substantially more from one year to another For example consider the data for
E X H I B I T 1 0
The Inflation Rate 1956ndash2009
Here we present the annual rate of inflation since 1956 Between 1956 and 1965 prices increased at an annual rate of only 16 percent In contrast the inflation rate averaged 92 percent during the 1973ndash1981 era reaching double-digit rates in several years Since 1982 the rate of inflation has been lower (the average annual rate was 31 percent during the period 1983ndash2009) and more stable
5
0
ndash5
10
15
19601956 1965 1970 1975 1980 1985 1990
Year
1995 2000 2005 2010
1973ndash1981 averageinflation rate = 92
1983ndash2009 averageinflation rate = 31
1956ndash1965 averageinflation rate = 16
Source httpwwwblsgov Also see Economic Report of the President (Washington DC Government Printing Office published annually)
COUNTRY 2002
2314
ndash041316
225158451140224
2003
27 10 05 14 23
153137253194311
2004
18 18 17 13 27
119109 86 92217
2005
22 19 05 20 34
90127 82 47160
2006
20 18 10 23 32
66 97 96 64137
2007
21 23 21 23 29
48 90 88 81187
2008
24 28 65 36 38
78141104 79304
LOW INFLATION
Canada Germany Singapore United Kingdom United States
HIGH INFLATION
Romania Russia Turkey Uruguay Venezuela
Source International Monetary Fund httpwwwimforg
E X H I B I T 1 1
Variations in the Annual Inflation Rates of Selected Countries 2002ndash2008
C H A P T E R 8 Economic Fluctuations Unemployment and Inflation 185
Venezuela The inflation rate in Venezuela jumped from 224 in 2002 to 311 in 2003 It
then receded to 137 by 2006 and rose again to reach 304 in 2008 The other countries in
the high-inflation group also experienced wide fluctuations in their annual rates of infla-
tion The data of Exhibit 11 reflect a general pattern High rates of inflation are almost always associated with substantial year-to-year swings in the inflation rate
Unanticipated and Anticipated InflationBefore we examine the effects of inflation it is important that we distinguish between
unanticipated and anticipated inflation Unanticipated inflation is an increase in the
price level that comes as a surprise at least to most individuals For example suppose
that based on the recent past most people anticipate an inflation rate of 3 percent If
the actual inflation rate turns out to be 10 percent it will catch people off guard When the
inflation rate is high and variable it will be virtually impossible for people to anticipate
it accurately
Anticipated inflation on the other hand is a change in the price level that is widely
expected Decision makers are generally able to anticipate slow steady rates of inflationmdash
like those in Canada Germany Singapore the United Kingdom and the United States
during the period 2002ndash2008mdashwith a high degree of accuracy When the general level of
prices is more stable this will exert a positive impact on real output and the level of pros-
perity The experience of the United States illustrates this point During the 1983ndash2008
period US inflation was low and relatively stable This period was characterized by
strong growth and only seventeen months of recession In contrast when the inflation
rate was high and variable during the 1970s the United States experienced two recessions
(1974ndash1975 and 1979ndash1980) and sluggish growth of real GDP
Why Does Inflation Adversely Affect the EconomyPeople will not be able to predict high and variable rates of inflation There are three major
reasons why such rates will adversely affect GDP and the overall health of the economy
1 HIGH AND VARIABLE INFLATION REDUCES INVESTMENT Unanticipated infla-
tion alters the outcomes of long-term projects such as the purchase of a machine or an
investment in a business it will increase the risks and retard the level of such productive
activities For example when the price level rises 15 percent one year and 40 percent the
next year and then increases again by 20 percent the following year no one knows what
to expect Unanticipated changes of even 5 percent or 10 percent in the rate of inflation
can often turn an otherwise profitable project into a personal economic disaster Given the
uncertainty that it creates many decision makers will simply forgo capital investments and
other transactions involving long-term commitments when the rate of inflation is highly
variable and therefore unpredictable As a result mutually advantageous gains from trade
will be lost and the efficiency of markets reduced
2 INFLATION DISTORTS THE INFORMATION DELIVERED BY PRICES Prices com-
municate important information concerning the relative scarcity of goods and resources
Some prices can be easily and regularly changed But this will not be true for others
particularly those set by long-term contracts For example time delays will occur before
the prices accompanying rental lease agreements items sold in catalogs mortgage inter-
est rates and collective bargaining contracts can be changed Because some prices will
respond quickly to inflation whereas others will change more slowly an unanticipated
change in the rate of inflation will change relative prices as well as the general price level The distorted relative prices will be a less reliable indicator of relative scarcity As a result
of these unreliable price signals producers and resource suppliers will often make choices
that they will later regret and the allocation of resources will be less efficient than it would
have been if the general level of prices had been more stable
Unanticipated inflationAn increase in the general level of prices that was not expected by most decision makers
Anticipated inflationAn increase in the general level of prices that was expected by most decision makers
186 P A R T 3 Core Macroeconomics
3 HIGH AND VARIABLE INFLATION RESULTS IN LESS PRODUCTIVE USE OF
RESOURCES Failing to anticipate accurately the inflation rate can have a substantial
effect on onersquos wealth Because of this when the inflation rate is high people will spend
more of their time and money trying to predict and cope with the future rate of inflation
These are resources that could have been used to produce goods and services demanded
by the marketplace For example managers will spend more time coping with frequent
price changes and less time improving production methods and products Speculative
market practices will occur as people try to outguess one another about the future direction
of prices As a result funds will flow into speculative-type investments instead of more
productive ones that increase output
What Causes InflationWe need to acquire some additional tools of analysis before we can answer in detail the
question of what causes inflation However at this point we can list two particular causes
First economists emphasize the link between aggregate demand and supply If aggregate
demand rises more rapidly than supply prices will rise Second nearly all economists
believe that a rapid expansion in a nationrsquos stock of money causes inflation The old say-
ing is that prices will rise because ldquothere is too much money chasing too few goodsrdquo The
hyperinflation experienced by South American countries and more recently by Russia and
several other countries of the former Soviet Union has mainly been the result of monetary
expansion Once we develop additional knowledge about the operation of our economy
we will consider this issue in more detail
In this chapter we looked at business cycles and how they affect employment and how inflation both anticipated and unanticipated affects output In the next chapter we will begin to develop a macroeconomic model that will help us better understand the factors that influence these indicators of economic performance
L o o k i n g a h e a d
During the past century real GDP in the United
States has grown at an average annual rate of
approximately 3 percent Cyclical movements in
real GDP have accompanied this growth of output
The four phases of the business cycle are expan-sion peak (or boom) contraction and recession A
recession is defined as two back-to-back quarters of
declining real GDP If a recession is quite severe it
is called a depression
There are three types of unemployment
(1) frictional unemployment (2) structural
unemployment and (3) cyclical unemployment
In a world of imperfect information and dynamic
change some unemployment is inevitable
Full employment is the employment level consistent
with the economyrsquos natural rate of unemployment
Both full employment and the natural rate of
unemployment are associated with the economyrsquos
maximum sustainable rate of output
Potential output is the maximum sustainable output
level consistent with the economyrsquos resource base
and current institutional arrangements
Inflation is an increase in the general level of prices
It is important to distinguish between anticipated
K E Y P O I N T S
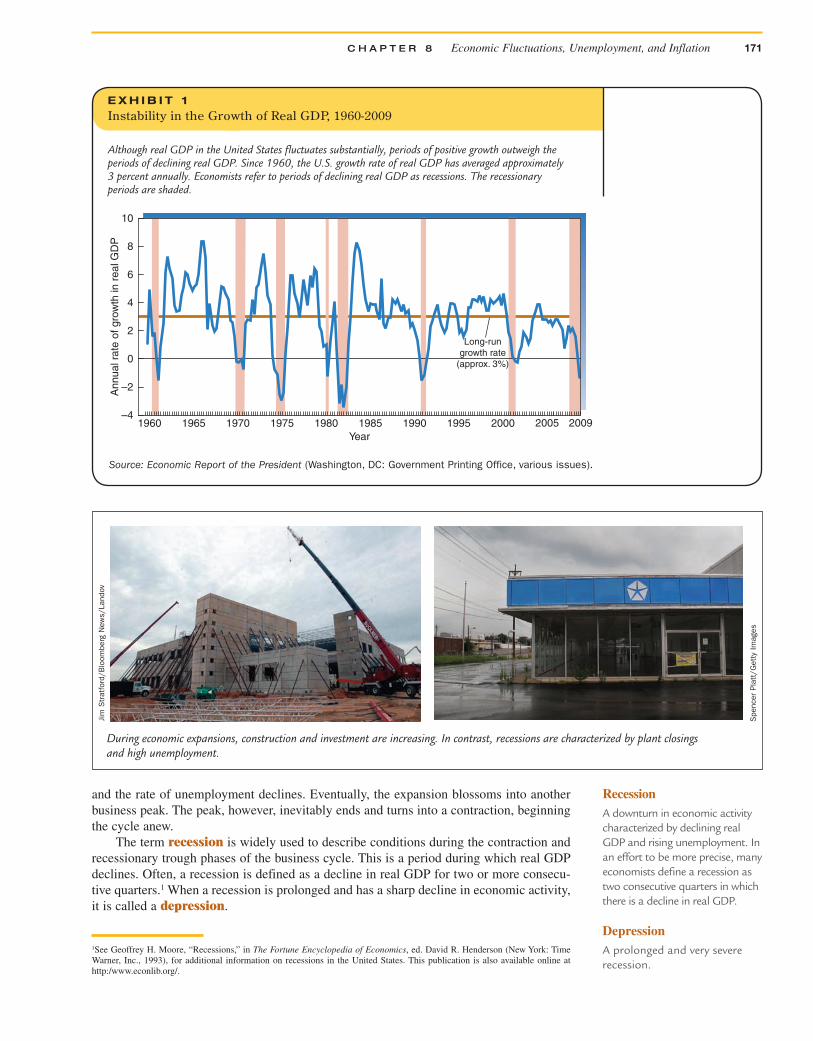
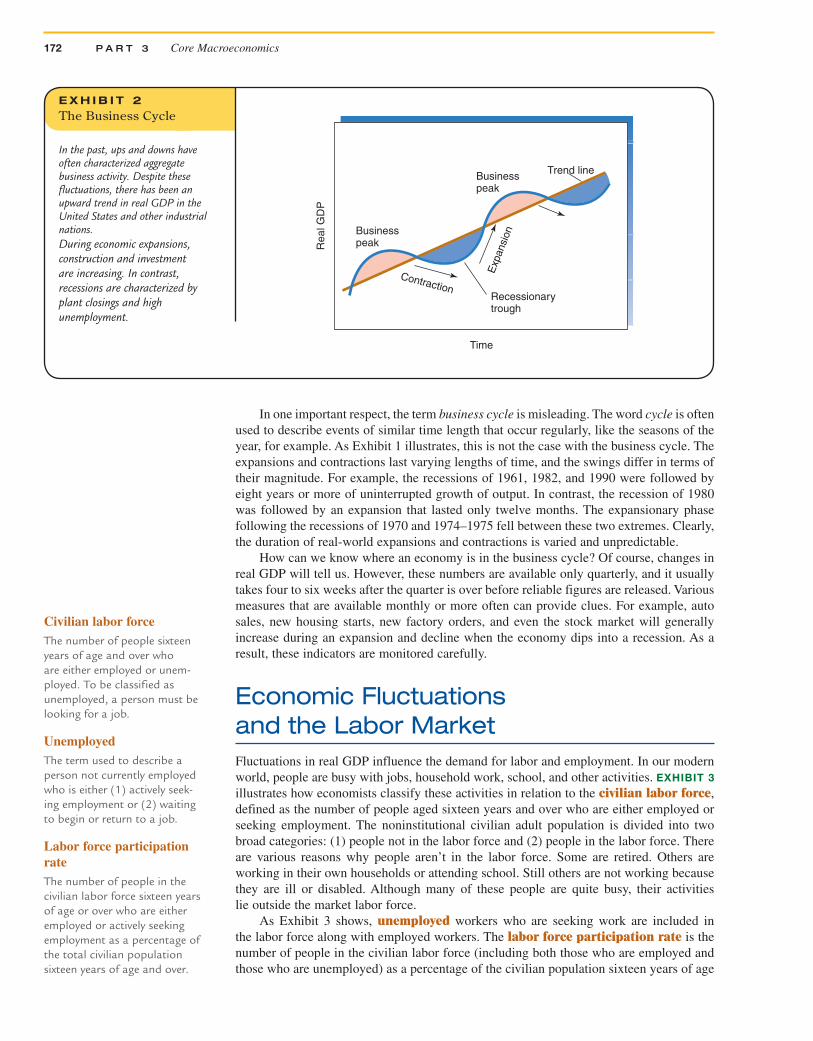
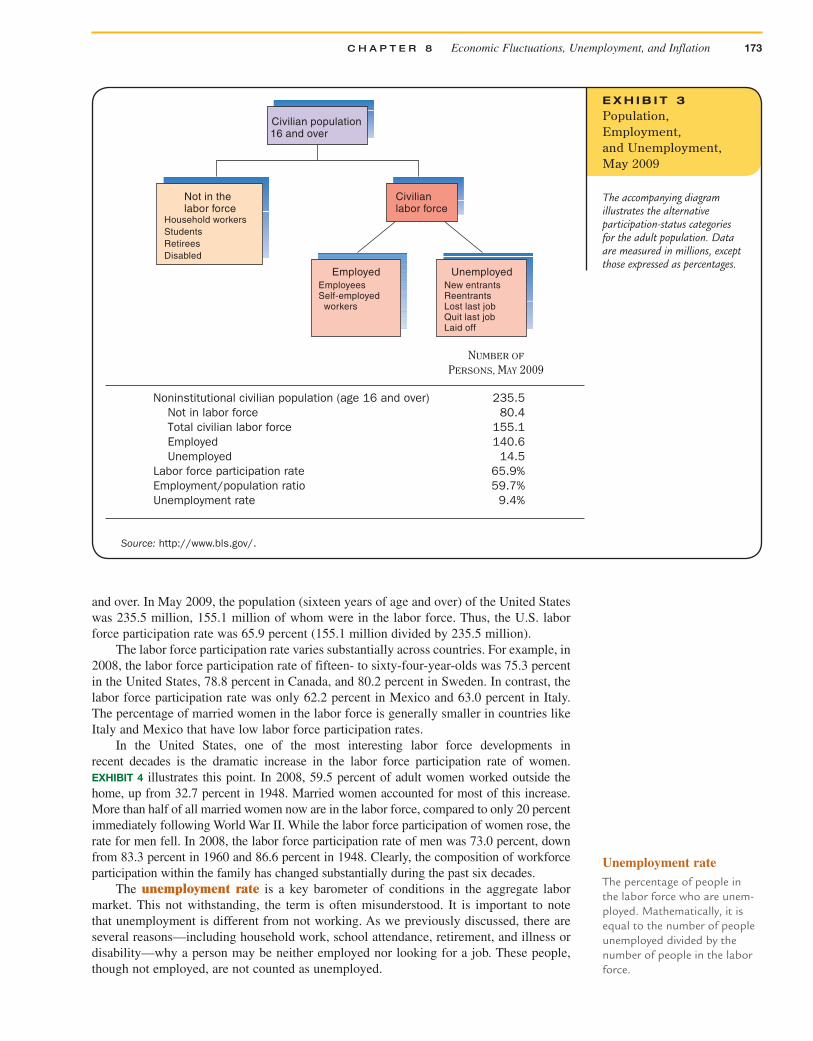
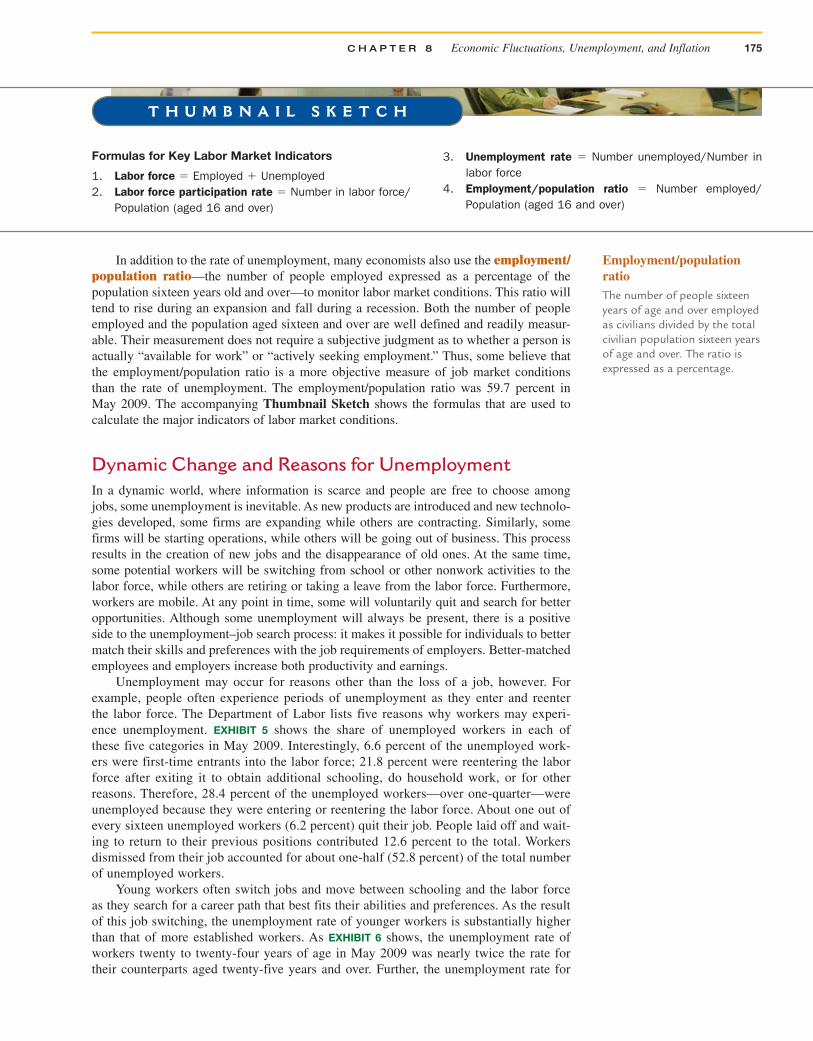
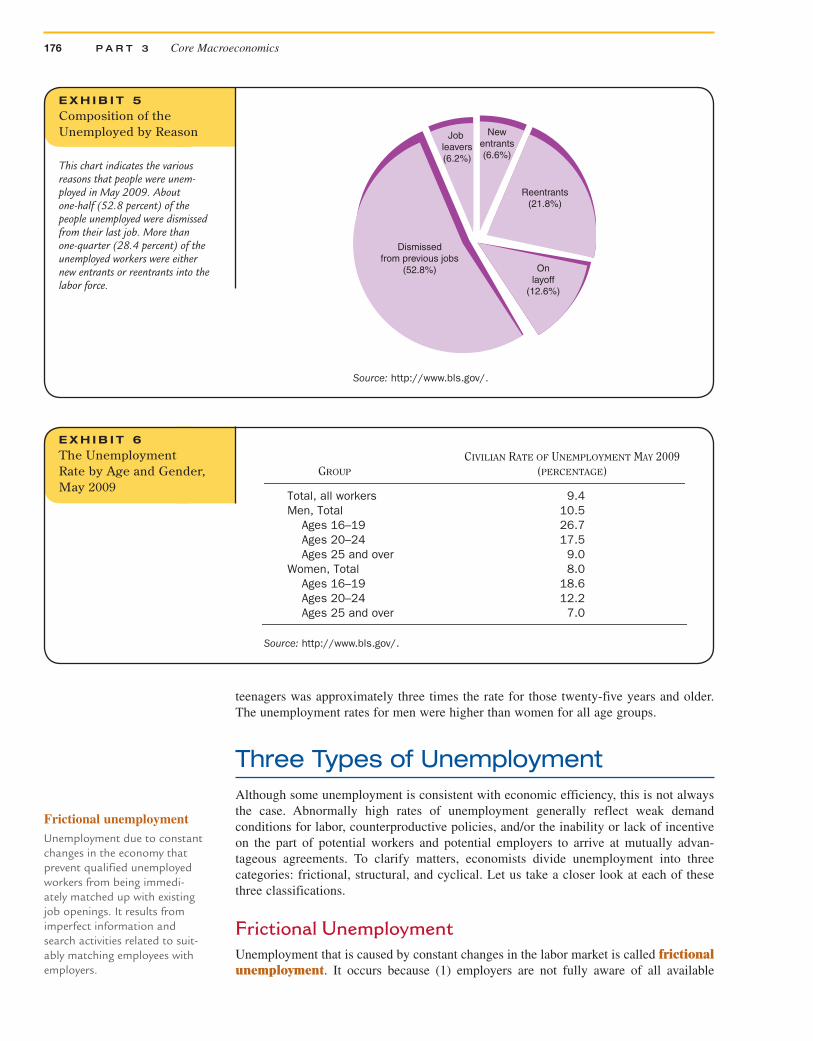
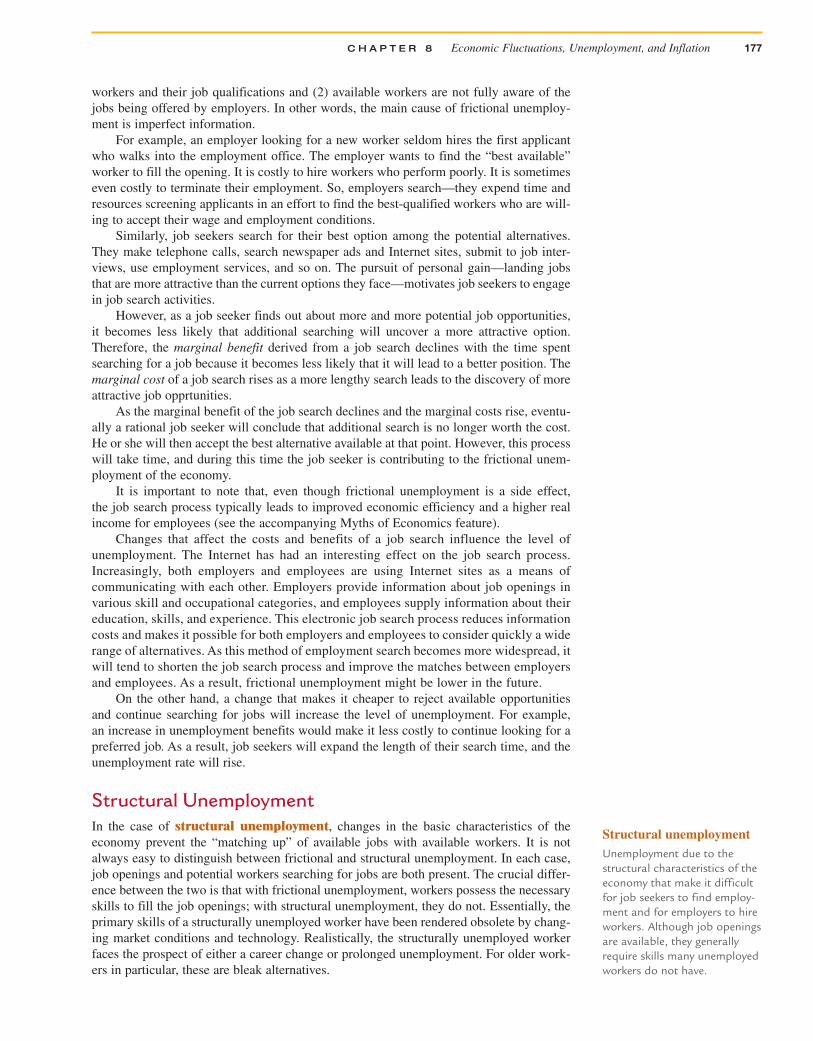
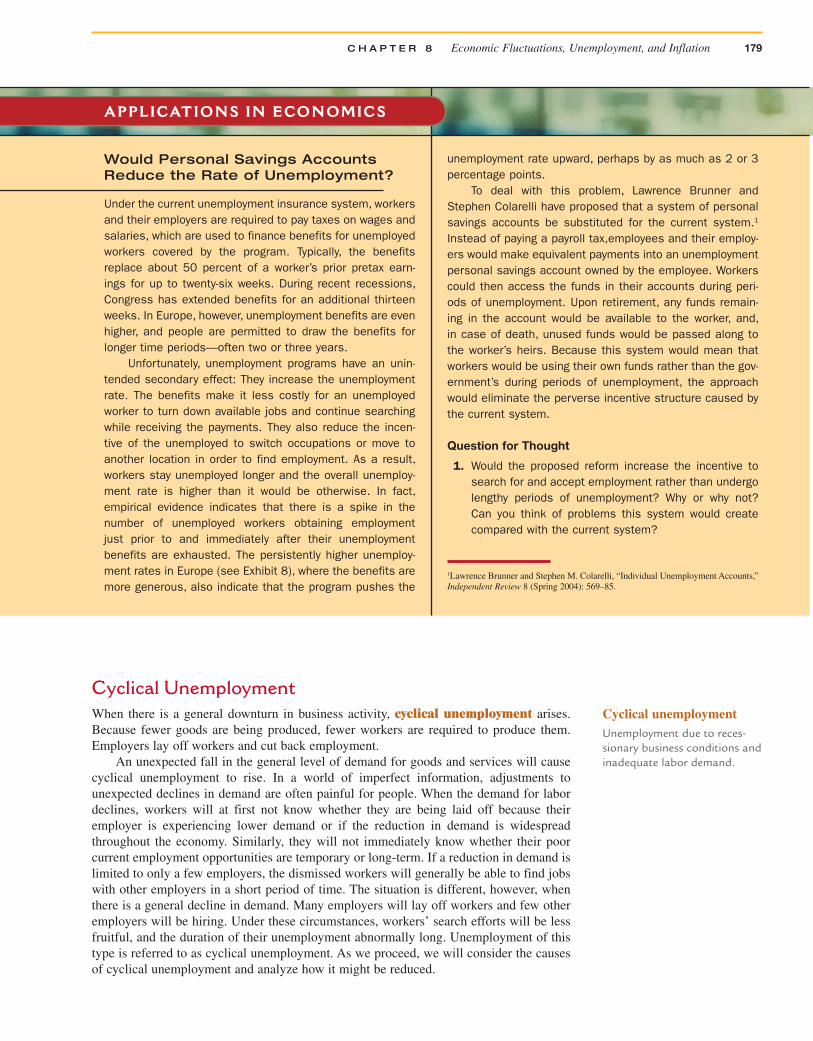
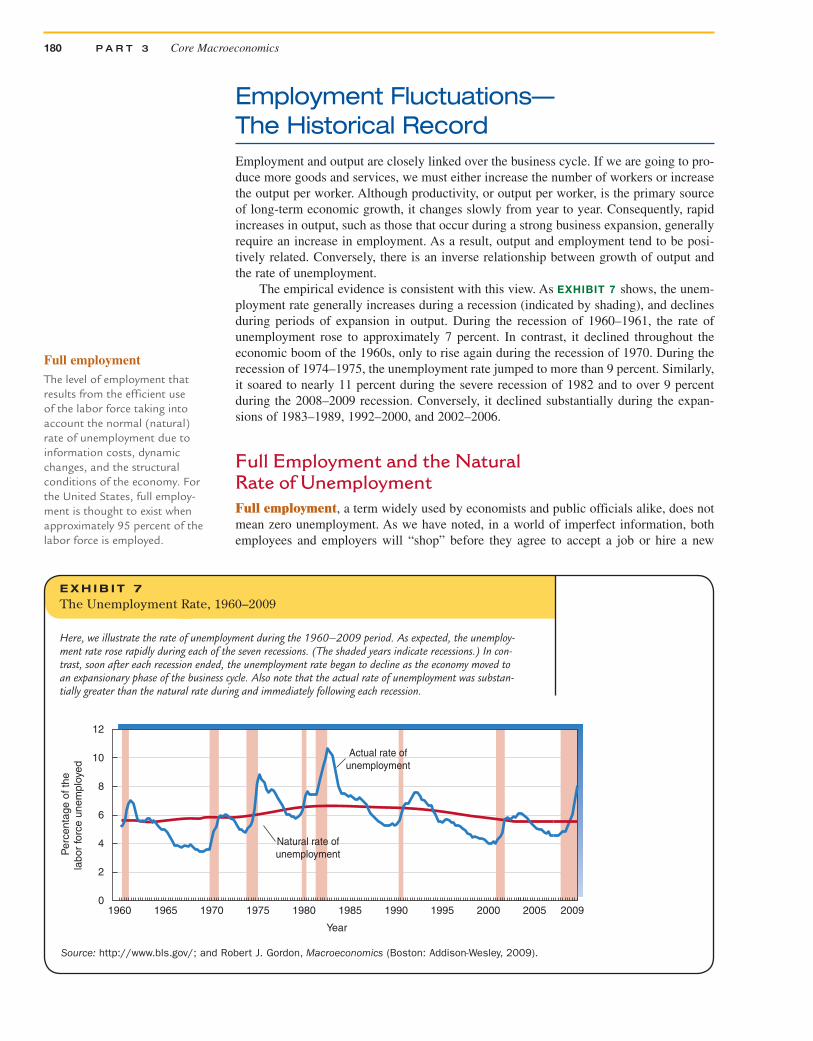
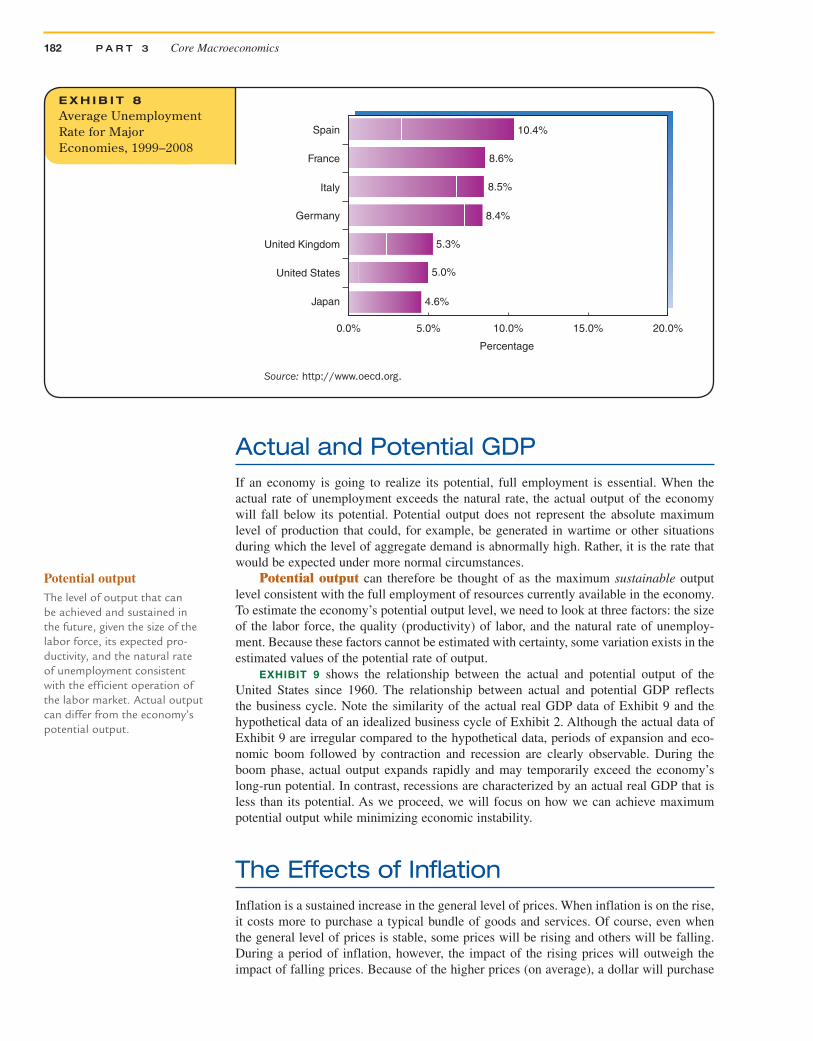
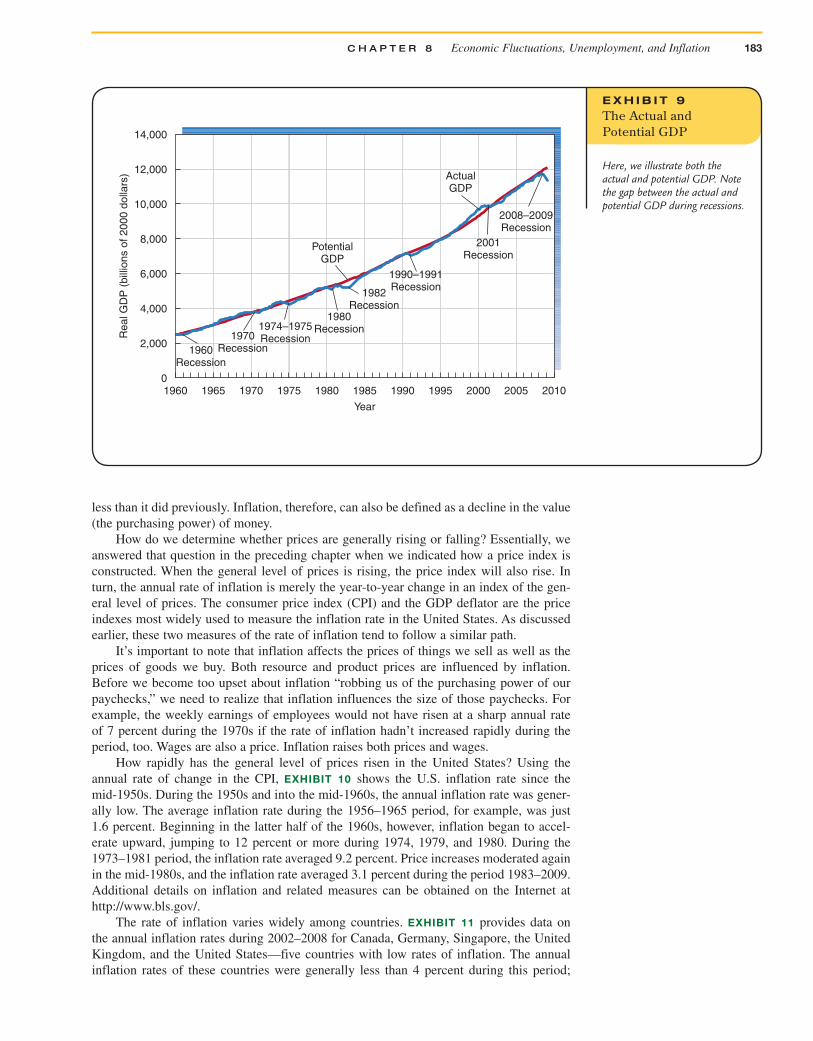
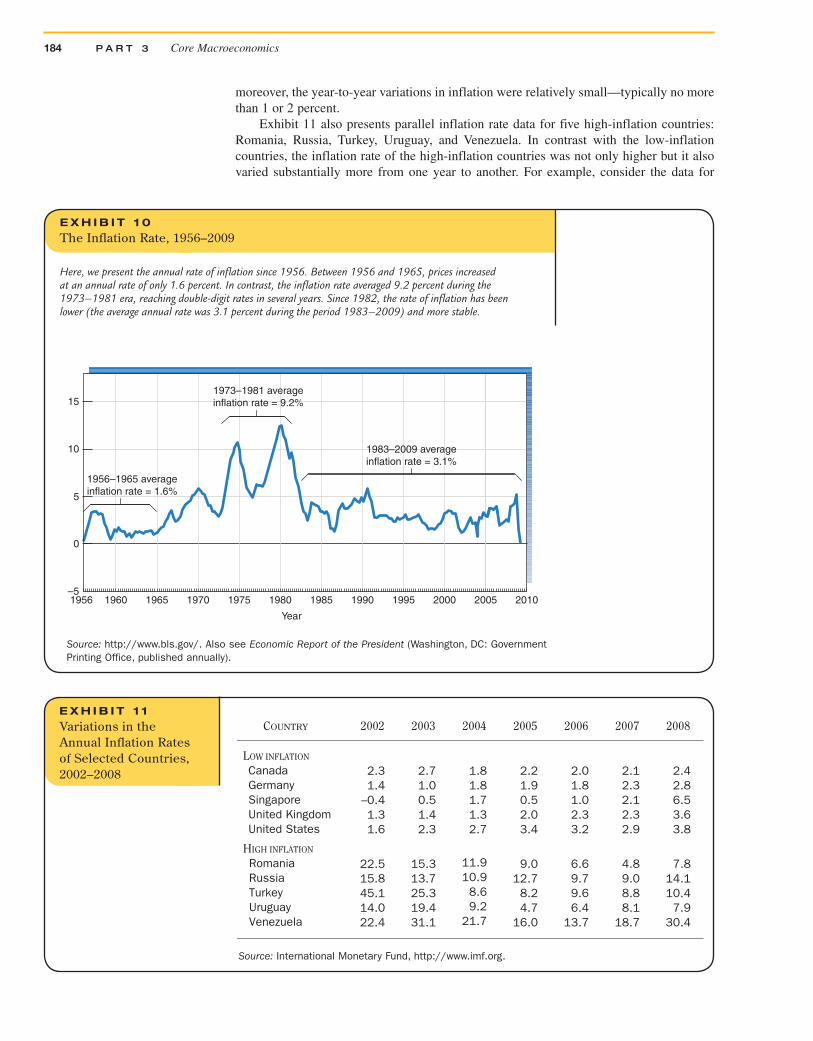