Embed Size (px)
Citation preview

101Indigenous Peoples’ food systems & well-being
Chapter 7
Gwich’in traditional food and health in Tetlit Zheh,
Northwest Territories, Canada: phase II
v Harriet V. KuHnlein1 v lauren Goodman1 v oliVier receVeur2
v dina SpiGelSKi1 v nelida duran3
v Gail G. HarriSon3 v Bill eraSmuS1 , 4 v tetlit ZHeH community5

Indigenous Peoples’ food systems & well-being | Case studies | Gwich’in102
1
centre for indigenous
peoples’ nutrition and
environment (cine)
and School of dietetics
and Human nutrition,
mcGill university,
montreal, Quebec,
canada
2
department of nutrition,
university of montreal,
montreal, Quebec,
canada
3
School of public Health,
university of california,
los angeles, california,
united States of america
4
dene nation and
assembly of First nations,
yellowknife and ottawa,
canada
5
the community of
tetlit Zheh,
northwest territories,
canada
Key words > Indigenous Peoples,
traditional food, Gwich’in, Dene Nation, First Nations,
Northwest Territories, food security
Photographic section >> X
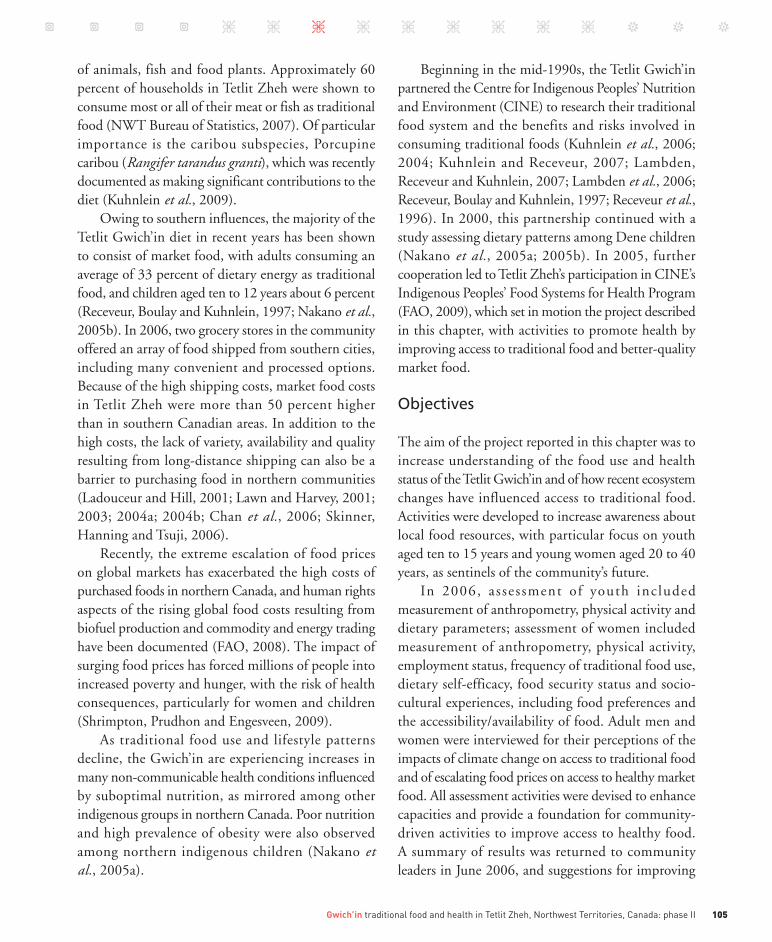
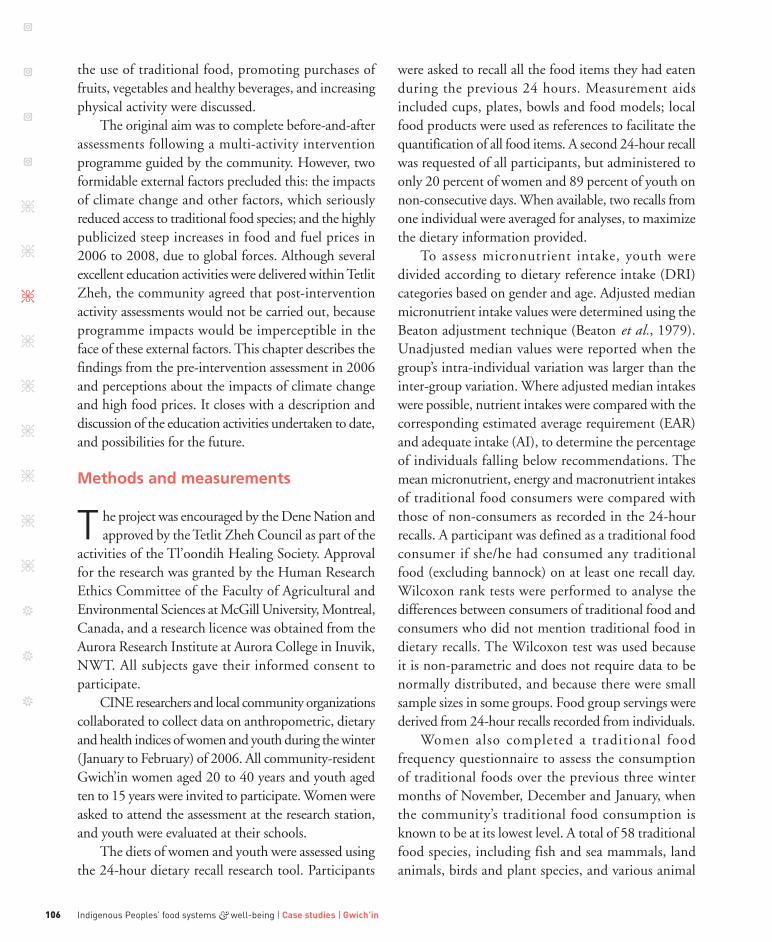
Northwest Territories
Canada
Data from ESRI Global GIS, 2006.Walter Hitschfield
Geographic Information Centre, McGill University Library.
Tetlit Zheh
Tsiigehtchic
AklavikInuvik
Figure 7.1
GwiCh’in nationtetlit Zheh, northwest territories

103Gwich’in traditional food and health in Tetlit Zheh, Northwest Territories, Canada: phase II
abstract
the First nations Gwich’in community of tetlit Zheh in the northwest territories of canada has been undergoing a nutrition transition. Studies conducted in the mid-1990s indicated that the majority of the Gwich’in diet consisted of store-bought (market) food, a high proportion of which was calorie-rich but nutrient-poor. as part of the indigenous peoples’ Food Systems for Health program, tetlit Zheh agreed to participate in activities to increase the consumption of traditional (local) food and healthier market food.
pre-intervention assessment was carried out in winter (February to march) 2006 among youth aged ten to 15 years and young women aged 20 to 40 years. compared with the overall canadian population, data indicated a similar proportion of overweight/obese youth, but a greater proportion of overweight/obese women. compared with overall canadian youth, tetlit Zheh youth spent similar amounts of their leisure time with television or computers. the majority of women were assessed as moderately active, and youth reported having participated in a wide range of physical activities throughout the year.
the most important traditional food species consumed by youth and women were caribou, moose and whitefish. the majority of both youth and women consumed at least one traditional food item regularly. post-intervention activity assessments were not conducted because external forces precluded the documentation of behaviour and food consumption change.
climate change and other factors that reduced access to traditional food species, and a sharp increase in market food and fuel prices (2008) were important challenges.
Introduction
Similar to many other indigenous groups worldwide, the Dene and Métis of northern Canada have witnessed many diverse changes in their recent history. among the most dramatic have been transformations in their ecosystem, food
use and lifestyle as they strive for a balance between traditional and modern practices. Before colonial contact, the Dene relied solely on traditional foods harvested from their local environment. Since the turn of the twentieth century, the overwhelming influence of the south has resulted in increased reliance on commercial market foods for Dene/Métis communities (Kuhnlein and Receveur, 1996; Receveur, Boulay and Kuhnlein, 1997; Kuhnlein et al., 2004; nakano et al., 2005a; 2005b).
this nutrition transition has been marked by a well-documented loss of dietary quality among the Dene, as many market foods of relatively poor nutritional value are replacing nutrient-dense traditional foods (Receveur, Boulay and Kuhnlein, 1997; Kuhnlein et al., 2004; nakano et al., 2005a; 2005b). Lifestyle patterns have also been interrupted, as many traditional methods of trapping, hunting and fishing are becoming less common. these rapid cultural changes have led to declining health status (Kuhnlein et al., 2004). a sharp increase of many non-communicable diseases, including obesity, diabetes and cardiovascular disease, has emerged as a public health concern, with prevalence now disproportionately high among Canadian indigenous Peoples compared with the national population (health
“through harvesting traditional foods
you practise your cultureand live your heritage.”
Gwich’in community member

Indigenous Peoples’ food systems & well-being | Case studies | Gwich’in104
Canada, 2001; 2003; Statistics Canada, 2003; First nations Regional Longitudinal health Survey, First nations Centre, 2005).
at the same time, special concern has been expressed about climate change and its many effects on the quality of the local environment. in addition, elders have been concerned about a decrease in transmission to youth of traditional knowledge about the environment and how to use it effectively. Climate change has exacerbated the nutrition transition for arctic peoples because it has a direct impact on the availability of local traditional food species. in 2004, the Canadian Government expressed the need for research on how climate change affects the sustainability, health, safety and food security of northern communities (natural Resources Canada, 2004). Qualitative research among inuit residing in nunavik and Labrador documented potential direct and indirect climate-related health impacts. inuit perceptions of climate-related health impacts were consistent with the intergovernmental Panel on Climate Change Fourth assessment Report and the arctic Climate impact assessment, with additional insight into the negative impact of decreased access to traditional food on social and cultural values (Furgal and Seguin, 2006), and the need for coping and adaptation strategies. however, there has been little documentation on the impact of climate change and the adaptation to it by western arctic indigenous Peoples. Guyot et al. (2006) reported observations in two Yukon First nations that demonstrated changes in water levels and species availability and the need to adopt new traditional food harvest strategies.
as the Dene continue to undergo cultural transformation, a balanced diet based on both traditional foods and healthy market foods will be important for supporting health. Lifestyles that incorporate physical activity also make significant contributions to well-being. taking a proactive stance, the Dene have called for research to improve understanding of environmental change and to combat the negative effects of acculturation. this chapter addresses data, discussions and conclusions from the Gwich’in community of tetlit Zheh of the Dene nation.
Context
totalling approximately 5 000 people, the Gwich’in First nations live in communities across the northern interior of alaska in the United States of america, and the northwest territories (nwt) and northern Yukon in Canada. the Gwich’in community of tetlit Zheh (Fort McPherson) is located in the Gwich’in Settlement area (Figure 7.1 on p. 102), which is on the east bank of the Peel River and in the Richardson Mountain range. Via the Dempster highway, the community is accessible year round, apart from during the spring ice break-up and autumn freeze-up on the Peel and Mackenzie Rivers. about 800 people reside in tetlit Zheh, and the majority are of indigenous descent. Community members continue to speak their traditional Gwich’in language dialect as well as English. the income of community residents has been documented as low, with an average family income of CaD 61 348 and 28.6 percent of households living on less than CaD 25 000 a year (nwt Bureau of Statistics, 2007). By contrast, during the same period, average family income in nwt – a region with high costs of living – was CaD 101 622, with 14.3 percent of families living on less than CaD 25 000. the Canadian average family income in 2007 was CaD 88 300.1
the Dene national office and the assembly of First nations Regional office are located in Yellowknife, nwt. the annual Dene national assembly convenes Dene First nations from the five regions of the Dene nation: akaitcho, Dehcho, Gwich’in, Sahtu and tlicho. Concerns arising from land-use, resources, lifestyle and health issues have been addressed at annual assemblies.
as did all Dene, the Gwich’in traditionally led a nomadic subsistence lifestyle of hunting, fishing and gathering, which started to change in the mid-nineteenth century when a trading post was established. Small communities began to emerge, and the Gwich’in population settled year round in the 1960s. the Gwich’in retain extensive knowledge of their traditional food system, which consists of 75 to 100 species
1 www.statcan.gc.ca/tables-tableaux/sum-som/l01/ind01/l3_3868_2812-eng.htm?hili_famil21.
105Gwich’in traditional food and health in Tetlit Zheh, Northwest Territories, Canada: phase II
of animals, fish and food plants. approximately 60 percent of households in tetlit Zheh were shown to consume most or all of their meat or fish as traditional food (nwt Bureau of Statistics, 2007). of particular importance is the caribou subspecies, Porcupine caribou (Rangifer tarandus granti), which was recently documented as making significant contributions to the diet (Kuhnlein et al., 2009).
owing to southern influences, the majority of the tetlit Gwich’in diet in recent years has been shown to consist of market food, with adults consuming an average of 33 percent of dietary energy as traditional food, and children aged ten to 12 years about 6 percent (Receveur, Boulay and Kuhnlein, 1997; nakano et al., 2005b). in 2006, two grocery stores in the community offered an array of food shipped from southern cities, including many convenient and processed options. Because of the high shipping costs, market food costs in tetlit Zheh were more than 50 percent higher than in southern Canadian areas. in addition to the high costs, the lack of variety, availability and quality resulting from long-distance shipping can also be a barrier to purchasing food in northern communities (Ladouceur and hill, 2001; Lawn and harvey, 2001; 2003; 2004a; 2004b; Chan et al., 2006; Skinner, hanning and tsuji, 2006).
Recently, the extreme escalation of food prices on global markets has exacerbated the high costs of purchased foods in northern Canada, and human rights aspects of the rising global food costs resulting from biofuel production and commodity and energy trading have been documented (Fao, 2008). the impact of surging food prices has forced millions of people into increased poverty and hunger, with the risk of health consequences, particularly for women and children (Shrimpton, Prudhon and Engesveen, 2009).
as traditional food use and lifestyle patterns decline, the Gwich’in are experiencing increases in many non-communicable health conditions influenced by suboptimal nutrition, as mirrored among other indigenous groups in northern Canada. Poor nutrition and high prevalence of obesity were also observed among northern indigenous children (nakano et al., 2005a).
Beginning in the mid-1990s, the tetlit Gwich’in partnered the Centre for indigenous Peoples’ nutrition and Environment (CinE) to research their traditional food system and the benefits and risks involved in consuming traditional foods (Kuhnlein et al., 2006; 2004; Kuhnlein and Receveur, 2007; Lambden, Receveur and Kuhnlein, 2007; Lambden et al., 2006; Receveur, Boulay and Kuhnlein, 1997; Receveur et al., 1996). in 2000, this partnership continued with a study assessing dietary patterns among Dene children (nakano et al., 2005a; 2005b). in 2005, further cooperation led to tetlit Zheh’s participation in CinE’s indigenous Peoples’ Food Systems for health Program (Fao, 2009), which set in motion the project described in this chapter, with activities to promote health by improving access to traditional food and better-quality market food.
Objectives
the aim of the project reported in this chapter was to increase understanding of the food use and health status of the tetlit Gwich’in and of how recent ecosystem changes have influenced access to traditional food. activities were developed to increase awareness about local food resources, with particular focus on youth aged ten to 15 years and young women aged 20 to 40 years, as sentinels of the community’s future.
in 2006, assessment of youth included measurement of anthropometry, physical activity and dietary parameters; assessment of women included measurement of anthropometry, physical activity, employment status, frequency of traditional food use, dietary self-efficacy, food security status and socio-cultural experiences, including food preferences and the accessibility/availability of food. adult men and women were interviewed for their perceptions of the impacts of climate change on access to traditional food and of escalating food prices on access to healthy market food. all assessment activities were devised to enhance capacities and provide a foundation for community-driven activities to improve access to healthy food. a summary of results was returned to community leaders in June 2006, and suggestions for improving
Indigenous Peoples’ food systems & well-being | Case studies | Gwich’in106
the use of traditional food, promoting purchases of fruits, vegetables and healthy beverages, and increasing physical activity were discussed.
the original aim was to complete before-and-after assessments following a multi-activity intervention programme guided by the community. however, two formidable external factors precluded this: the impacts of climate change and other factors, which seriously reduced access to traditional food species; and the highly publicized steep increases in food and fuel prices in 2006 to 2008, due to global forces. although several excellent education activities were delivered within tetlit Zheh, the community agreed that post-intervention activity assessments would not be carried out, because programme impacts would be imperceptible in the face of these external factors. this chapter describes the findings from the pre-intervention assessment in 2006 and perceptions about the impacts of climate change and high food prices. it closes with a description and discussion of the education activities undertaken to date, and possibilities for the future.
Methods and measurements
t he project was encouraged by the Dene nation and approved by the tetlit Zheh Council as part of the
activities of the tl’oondih healing Society. approval for the research was granted by the human Research Ethics Committee of the Faculty of agricultural and Environmental Sciences at McGill University, Montreal, Canada, and a research licence was obtained from the aurora Research institute at aurora College in inuvik, nwt. all subjects gave their informed consent to participate.
CinE researchers and local community organizations collaborated to collect data on anthropometric, dietary and health indices of women and youth during the winter (January to February) of 2006. all community-resident Gwich’in women aged 20 to 40 years and youth aged ten to 15 years were invited to participate. women were asked to attend the assessment at the research station, and youth were evaluated at their schools.
the diets of women and youth were assessed using the 24-hour dietary recall research tool. Participants
were asked to recall all the food items they had eaten during the previous 24 hours. Measurement aids included cups, plates, bowls and food models; local food products were used as references to facilitate the quantification of all food items. a second 24-hour recall was requested of all participants, but administered to only 20 percent of women and 89 percent of youth on non-consecutive days. when available, two recalls from one individual were averaged for analyses, to maximize the dietary information provided.
to assess micronutrient intake, youth were divided according to dietary reference intake (DRi) categories based on gender and age. adjusted median micronutrient intake values were determined using the Beaton adjustment technique (Beaton et al., 1979). Unadjusted median values were reported when the group’s intra-individual variation was larger than the inter-group variation. where adjusted median intakes were possible, nutrient intakes were compared with the corresponding estimated average requirement (EaR) and adequate intake (ai), to determine the percentage of individuals falling below recommendations. the mean micronutrient, energy and macronutrient intakes of traditional food consumers were compared with those of non-consumers as recorded in the 24-hour recalls. a participant was defined as a traditional food consumer if she/he had consumed any traditional food (excluding bannock) on at least one recall day. wilcoxon rank tests were performed to analyse the differences between consumers of traditional food and consumers who did not mention traditional food in dietary recalls. the wilcoxon test was used because it is non-parametric and does not require data to be normally distributed, and because there were small sample sizes in some groups. Food group servings were derived from 24-hour recalls recorded from individuals.
women also completed a traditional food frequency questionnaire to assess the consumption of traditional foods over the previous three winter months of november, December and January, when the community’s traditional food consumption is known to be at its lowest level. a total of 58 traditional food species, including fish and sea mammals, land animals, birds and plant species, and various animal
107Gwich’in traditional food and health in Tetlit Zheh, Northwest Territories, Canada: phase II
parts and organs, were included. the questionnaire asked participants to report the number of days each week that they had consumed the various traditional food items over the three months.
Different methods were used to assess the physical activity status of participating women and youth. women’s physical activity was measured with a modified version of the international Physical activity Questionnaire (iPaQ, 2001; Craig et al., 2003). Participants were asked to report the number of days in the last seven in which they had spent at least ten minutes being vigorously active, moderately active, walking and being sedentary, and how many minutes in one day they would spend on each of these activities. Based on these patterns, women were categorized into three levels of physical activity. Youth completed a physical activity questionnaire designed to capture their levels of activity and their television/video game/internet habits (adams et al., 2005). types of activity and frequencies were recorded.
anthropometric and clinical measurements included height, weight, waist circumference, blood pressure and body composition. appropriate cut-offs were determined for body mass index (BMi), waist circumference, percentage of body fat and blood pressure of women and youth. all measurements were conducted by a trained staff member. height was measured using a portable height rod with a horizontal headboard attachment; participants removed their shoes and stood as tall and straight as possible, keeping their heads level and their shoulders and upper arms relaxed at their sides. height was measured at the maximum point of inhalation, repeated three times to a precision of 0.1 cm.
waist circumference was taken with a flexible tape measure after participants had removed loose and bulky clothing. Clothes pins secured their shirts for access to the abdominal area. Participants stood straight with their arms relaxed at their sides and their feet together. the measuring tape was looped around the participant’s waist at the midpoint between the hip and the bottom of the rib cage. three consecutive measures were taken at the end of normal exhalations, and recorded with a precision of 0.1 cm.
Both weight and body composition were measured with a tanita Bioelectrical impedance Scale. Bulky clothing, shoes and socks were removed and a clothing reference weight of 0.5 kg was entered for each subject and automatically subtracted to provide the body weight. Gender, age, height and a standard build reference were entered for subsequent body composition calculations.
Blood pressure was measured as mmhg with a mercury sphygmomanometer and stethoscope, after ensuring participants were relaxed. outer and tight-fitting clothing around the arm was removed by the participant, and an appropriately sized cuff was wrapped around the upper arm. three measurements were taken one minute apart, and recorded to the nearest 1 mmhg. as part of the clinical measures, a short (ten-item) questionnaire was used to create a five-point scale of women’s self-perceived health status.
CinE researchers developed a socio-cultural questionnaire for gathering women’s views on the general use, accessibility, advantages, preferences and health benefits of traditional and market foods. the food security status of participating women and their households was evaluated with the Food Security Survey Module designed by the United States Department of agriculture (USDa) for the Food Mail Project (Bickel et al., 2000; Lawn and harvey, 2003). this 18-item questionnaire evaluates households’ food security situation for the previous 12 months. By combining a ten-item scale to measure the experiences of adults in the household and an eight-item scale for children under 18 years of age, the questionnaire provides a single measurement of overall food security. Correlations between women’s food security status and frequency of traditional food use and the access score derived from the socio-cultural questionnaires were evaluated.
interviews on perceptions of the impacts of climate change on access to traditional and market foods were conducted with men and women from Dene First nations communities attending the 38th Dene national assembly held in Fort McPherson in July 2008, and in Yellowknife, nwt, the following month. the interviews used 15 open- and closed-ended questions
Indigenous Peoples’ food systems & well-being | Case studies | Gwich’in108
to explore whether individuals had enough traditional food, whether healthy foods could be purchased, and respondents’ perceptions of how climate change and climate variation affected the use of traditional foods and people’s health.
CanDat (Godin London inc., 2007) was used to assign nutrient values to all foods from the 24-hour recall data. nutrient values for traditional foods were derived from a traditional arctic food database created from laboratory analyses conducted over several years
at CinE (appavoo, Kubow and Kuhnlein, 1991; Kuhnlein et al., 1994; 2002; 2006; Kuhnlein, 2001; Morrison and Kuhnlein, 1993).
there were no missing nutrient values in the foods included in the analyses. anthropometric, clinical and interview data were analysed using SaS version 9.0 (SaS institute inc., 2003). a p-value of ≤ 0.05 was considered significant. interview responses on traditional food access and climate change were summarized and tabulated.
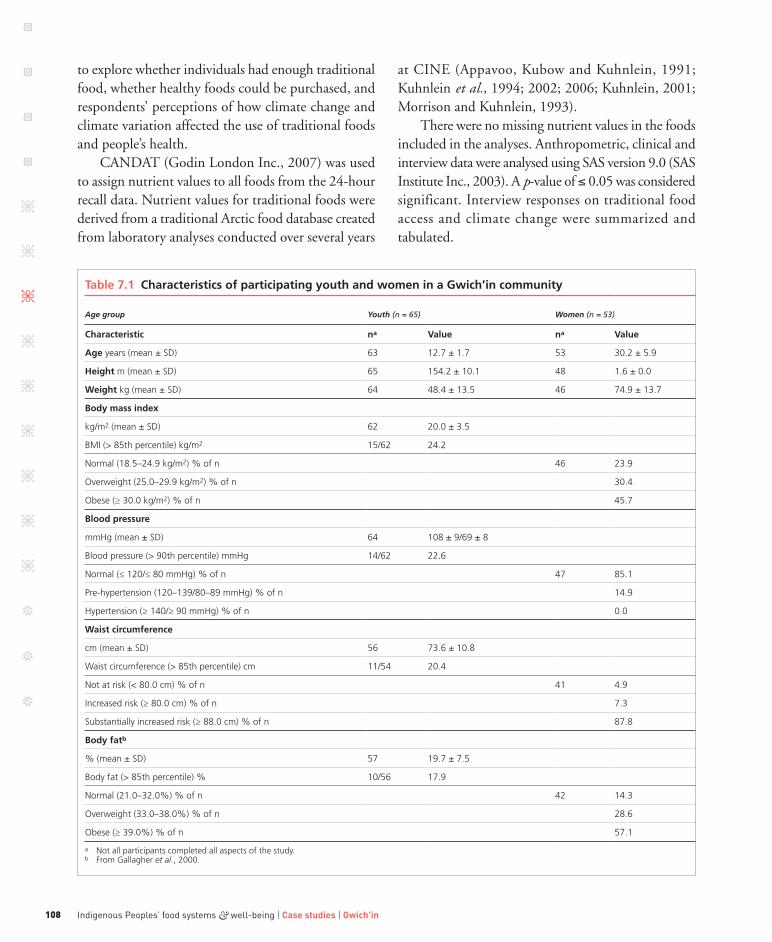
Table 7.1 Characteristics of participating youth and women in a Gwich’in community
Age group Youth (n = 65) Women (n = 53)
Characteristic na Value na Value
Age years (mean ± Sd) 63 12.7 ± 1.7 53 30.2 ± 5.9
Height m (mean ± Sd) 65 154.2 ± 10.1 48 1.6 ± 0.0
Weight kg (mean ± Sd) 64 48.4 ± 13.5 46 74.9 ± 13.7
Body mass index
kg/m2 (mean ± Sd) 62 20.0 ± 3.5
Bmi (> 85th percentile) kg/m2 15/62 24.2
normal (18.5–24.9 kg/m2) % of n 46 23.9
overweight (25.0–29.9 kg/m2) % of n 30.4
obese (≥ 30.0 kg/m2) % of n 45.7
Blood pressure
mmHg (mean ± Sd) 64 108 ± 9/69 ± 8
Blood pressure (> 90th percentile) mmHg 14/62 22.6
normal (≤ 120/≤ 80 mmHg) % of n 47 85.1
pre-hypertension (120–139/80–89 mmHg) % of n 14.9
Hypertension (≥ 140/≥ 90 mmHg) % of n 0.0
Waist circumference
cm (mean ± Sd) 56 73.6 ± 10.8
Waist circumference (> 85th percentile) cm 11/54 20.4
not at risk (< 80.0 cm) % of n 41 4.9
increased risk (≥ 80.0 cm) % of n 7.3
Substantially increased risk (≥ 88.0 cm) % of n 87.8
Body fatb
% (mean ± Sd) 57 19.7 ± 7.5
Body fat (> 85th percentile) % 10/56 17.9
normal (21.0–32.0%) % of n 42 14.3
overweight (33.0–38.0%) % of n 28.6
obese (≥ 39.0%) % of n 57.1
a not all participants completed all aspects of the study.b From Gallagher et al., 2000.

109Gwich’in traditional food and health in Tetlit Zheh, Northwest Territories, Canada: phase II
Findings
description of participants table 7.1 describes the youth and women participating in the study. households ranged in size from one to eight people, with an average of four. on average, only one person in each household was employed, either full- or part-time (data not shown). the mean ages were 13 years for youth and 30 years for women. of the youth measured, 23 percent had systolic or diastolic pressure at or above the 90th percentile, according to the blood pressure reference percentiles for children based on height-for-gender and -age (national high Blood Pressure Education Program working Group on high Blood Pressure in Children and adolescents, 2004). according to the five-point self-perceived health status score, the majority of women (68 percent) described their general health as very good or good, and 26 percent as fair or poor. Eighty-five percent of women were found to have normal blood pressure, defined as systolic pressure ≤ 120 mmhg and diastolic pressure ≤ 80 mmhg (heart and Stroke Foundation of Canada, 2008).
Anthropometry
according to BMi-for-age growth charts, 24 percent of youth were above the 85th percentile, the cut-off for overweight or obesity according to the Centers for Disease Control and Prevention (CDC, 2000; ogden et al., 2002): 20 and 18 percent of youth were above the 85th percentile for waist circumference and body fat, respectively (Fernandez et al., 2004; McCarthy et al., 2006). Based on BMi and percentage body fat, 46 and 57 percent of women, respectively, were considered obese; according to measures of waist circumference, 88 percent were at a substantially increased risk of obesity-related health complications (Gallagher et al., 2000; who, 2000). in 2002/2003, BMi data for Canada showed that 32 percent of First nations women were overweight and 40 percent obese (First nations Regional Longitudinal health Survey, First nations Centre, 2005), compared with data for the overall population in 2005, which
showed 29 percent of adult women overweight and 23 percent obese (Statistics Canada, 2006). in the Canadian Community health Survey, 41 percent of aboriginal youth aged two to 17 years were overweight (21 percent) or obese (20 percent) (Shields, 2005), compared with 29 percent of overall Canadian youth aged 12 to 17 years in 2004 (Shields, 2006).
Physical activity
Youth’s physical activity and use of television, internet and video games were assessed. thirty-nine percent reported watching two to three television programmes on schooldays. on Saturdays, watching television or movies for part of the morning (43 percent) or afternoon (52 percent) (two hours or less) was the most common activity. Playing video/computer games or surfing the internet were less popular, with 68 and 49 percent of youth reporting that they would not do these on Saturday morning or afternoon, respectively. For comparison, young people aged 12 to 17 years in Canada in 2004 spent an average of ten hours each week watching tV. adding the time spent on computers or playing video games increased the total to 20 hours a week in front of a screen (Statistics Canada, 2008).
a wide range of physical activities were reported by youth in tetlit Zheh. the most popular in summer were bicycling (reported by 98 percent), swimming (90 percent) and soccer (80 percent). During the snow-covered school year, youth reported skidooing (97 percent), sledding (84 percent), hockey (70 percent), soccer (87 percent), basketball (81 percent) and hunting (70 percent). according to the seven-day physical activity recall, walking outside was the most frequent activity, with an average of six days per week. not including activities in gym class, walking and jogging were the most frequent activities, with an average frequency of four days per week. in comparison, in 1994, 71 percent of children (aged eight to 12 years) in the Mohawk community of Kahnawake, Quebec, Canada, took part in physical activity for at least 30 minutes a day (adams et al., 2005), and 36 percent watched less than two hours of television a day.
Indigenous Peoples’ food systems & well-being | Case studies | Gwich’in110
Research has shown that the recalls of youth as young as grade 5 can be sufficiently reliable and valid for the assessment of physical activity (Sallis et al., 1993). Physical activity of the youth in tetlit Zheh was considered as falling within recommendations, as television viewing of two hours or less per day is within recommended levels for youth (american academy of Pediatrics, 2001), and physical activity of at least 30 minutes a day is considered adequate (CDC, 2004).
women’s physical activity was assessed using the standardized iPaQ. walking is an important physical activity for Gwich’in women, and therefore influences how comparison standards are used. if Gwich’in data include walking, the majority of women aged 20 to 40 years (60 percent) were considered moderately active, with 25 percent having low physical activity and 15 percent being very physically active. this is compared with data from the 2004/2005 Canadian
Community health Survey, which estimated that 52 percent of Canadian women (20 years and older) were inactive during their leisure time and 48 percent were moderately active (including walking) or more active (Canadian Fitness and Lifestyle Research institute, 2005). when walking is not considered in the calculation, 33 percent of women in tetlit Zheh met the United States recommendations of 30 to 60 minutes of moderate to vigorous activity on five days a week (Physical activity Guidelines advisory Committee, 2008).
Dietary intake
Dietary nutrients were examined using 24-hour recalls with youth and women, and the frequency of traditional food consumption was captured in a food frequency questionnaire with women. to identify
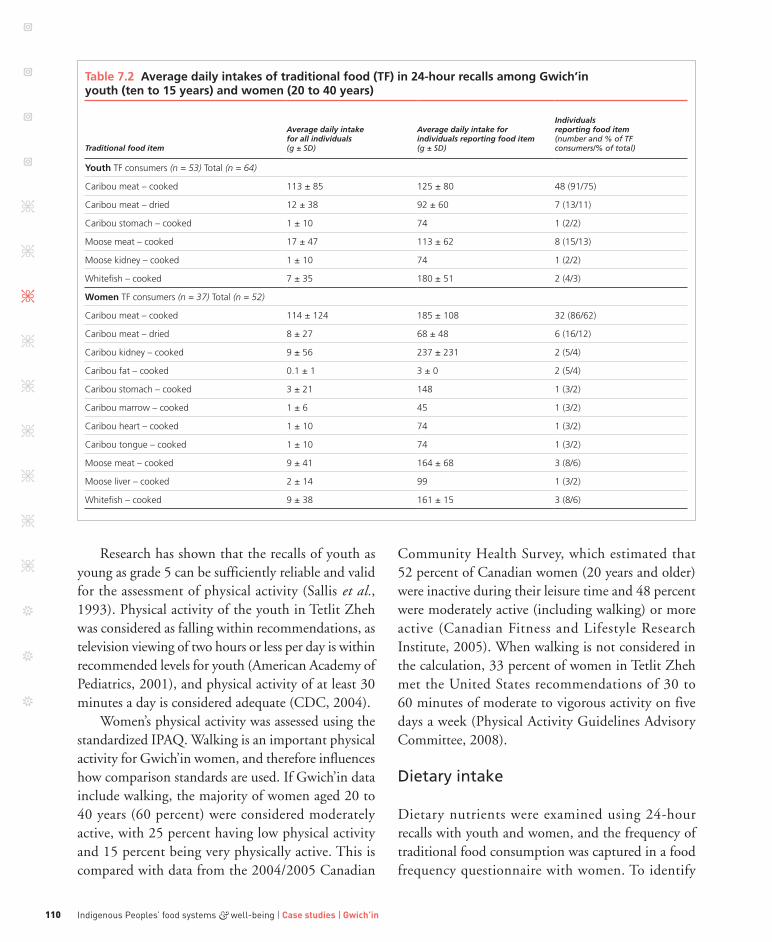
Table 7.2 Average daily intakes of traditional food (TF) in 24-hour recalls among Gwich’in youth (ten to 15 years) and women (20 to 40 years)
Traditional food item
Average daily intake for all individuals (g ± SD)
Average daily intake for individuals reporting food item (g ± SD)
Individuals reporting food item (number and % of TF consumers/% of total)
Youth tF consumers (n = 53) total (n = 64)
caribou meat – cooked 113 ± 85 125 ± 80 48 (91/75)
caribou meat – dried 12 ± 38 92 ± 60 7 (13/11)
caribou stomach – cooked 1 ± 10 74 1 (2/2)
moose meat – cooked 17 ± 47 113 ± 62 8 (15/13)
moose kidney – cooked 1 ± 10 74 1 (2/2)
Whitefish – cooked 7 ± 35 180 ± 51 2 (4/3)
Women tF consumers (n = 37) total (n = 52)
caribou meat – cooked 114 ± 124 185 ± 108 32 (86/62)
caribou meat – dried 8 ± 27 68 ± 48 6 (16/12)
caribou kidney – cooked 9 ± 56 237 ± 231 2 (5/4)
caribou fat – cooked 0.1 ± 1 3 ± 0 2 (5/4)
caribou stomach – cooked 3 ± 21 148 1 (3/2)
caribou marrow – cooked 1 ± 6 45 1 (3/2)
caribou heart – cooked 1 ± 10 74 1 (3/2)
caribou tongue – cooked 1 ± 10 74 1 (3/2)
moose meat – cooked 9 ± 41 164 ± 68 3 (8/6)
moose liver – cooked 2 ± 14 99 1 (3/2)
Whitefish – cooked 9 ± 38 161 ± 15 3 (8/6)
111Gwich’in traditional food and health in Tetlit Zheh, Northwest Territories, Canada: phase II
potential underreporting, each participant’s total energy, weight (kg) and height (m) were used in the Goldberg cut-off method, which compares participants’ daily mean reported energy intakes with the intakes for a sedentary lifestyle recommended by Fao, the world health organization (who) and the United nations organization (Uno). the energy intake (Ei)-to-basal metabolic rate (BMR) ratio x 1.5 was used as a cut-off for determining inadequate estimation of energy intake based on existing methodology (Goldberg et al., 1991; Gibson, 2005). Energy intakes as recorded by 24-hour recalls for women were below the levels representative of habitual intake (means of 7 472 ± 3 490 kJ and 7 052 ± 4 385 kJ). as portion sizes of traditional food were substantial, often in excess of 100 g/day, it was estimated that underreporting was most likely due to beverage additives and purchased sweets and snacks. Research suggests that Goldberg cut-off values based on adults may overestimate the extent of dietary misreporting when applied to youth (Kersting et al., 1998). therefore, estimation of intakes was assessed for youth (using median intakes), and mean intakes for both youth and women were used for comparison of consumers and non-consumers of traditional food.
Traditional food consumption
table 7.2 shows the average daily intakes (g) of traditional foods consumed by youth and women as reported in 24-hour recalls. of the 64 youth with recalls, 53 reported at least one traditional food item, and of the 52 women, 37 did. the most important traditional species consumed by youth during the winter season assessed were caribou, moose and whitefish. traditional food frequencies reported by women also emphasized the importance of traditional meats (caribou and moose) and fish. there were no significant differences in traditional food intakes between boys and girls (not shown). table 7.2 gives the percentages of individuals reporting a specific item among traditional food consumers and among all respondents with recalls.
Macronutrients
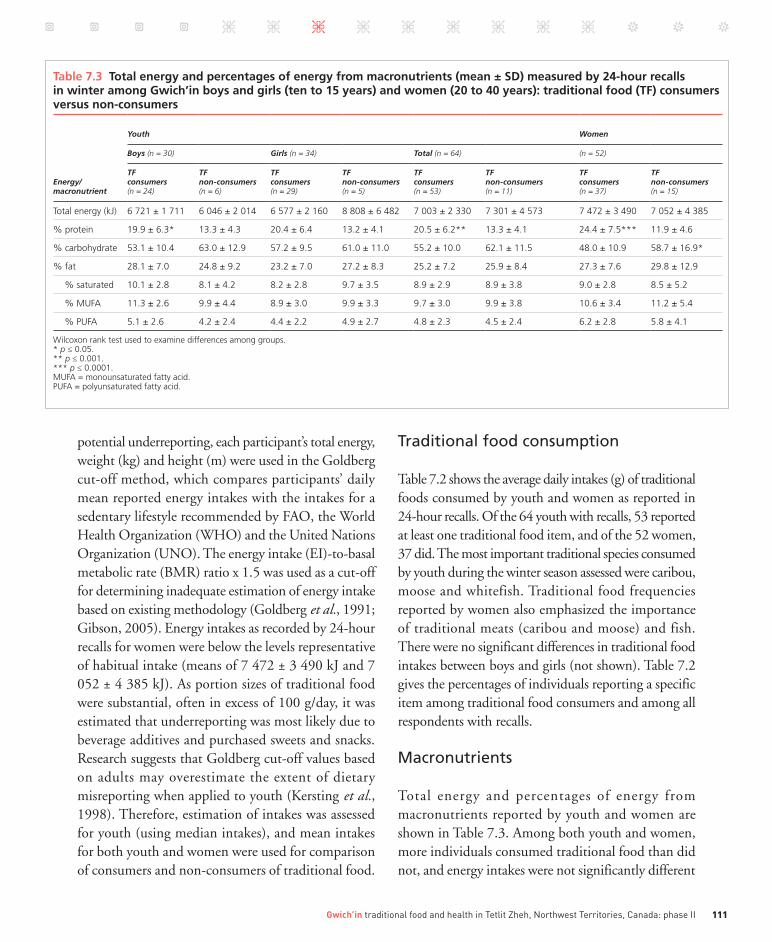
total energy and percentages of energy from macronutrients reported by youth and women are shown in table 7.3. among both youth and women, more individuals consumed traditional food than did not, and energy intakes were not significantly different
Table 7.3 Total energy and percentages of energy from macronutrients (mean ± SD) measured by 24-hour recalls in winter among Gwich’in boys and girls (ten to 15 years) and women (20 to 40 years): traditional food (TF) consumers versus non-consumers
Youth Women
Boys (n = 30) Girls (n = 34) Total (n = 64) (n = 52)
Energy/ macronutrient
TF consumers (n = 24)
TF non-consumers (n = 6)
TF consumers (n = 29)
TF non-consumers (n = 5)
TF consumers (n = 53)
TF non-consumers (n = 11)
TF consumers (n = 37)
TF non-consumers (n = 15)
total energy (kJ) 6 721 ± 1 711 6 046 ± 2 014 6 577 ± 2 160 8 808 ± 6 482 7 003 ± 2 330 7 301 ± 4 573 7 472 ± 3 490 7 052 ± 4 385
% protein 19.9 ± 6.3* 13.3 ± 4.3 20.4 ± 6.4 13.2 ± 4.1 20.5 ± 6.2** 13.3 ± 4.1 24.4 ± 7.5*** 11.9 ± 4.6
% carbohydrate 53.1 ± 10.4 63.0 ± 12.9 57.2 ± 9.5 61.0 ± 11.0 55.2 ± 10.0 62.1 ± 11.5 48.0 ± 10.9 58.7 ± 16.9*
% fat 28.1 ± 7.0 24.8 ± 9.2 23.2 ± 7.0 27.2 ± 8.3 25.2 ± 7.2 25.9 ± 8.4 27.3 ± 7.6 29.8 ± 12.9
% saturated 10.1 ± 2.8 8.1 ± 4.2 8.2 ± 2.8 9.7 ± 3.5 8.9 ± 2.9 8.9 ± 3.8 9.0 ± 2.8 8.5 ± 5.2
% muFa 11.3 ± 2.6 9.9 ± 4.4 8.9 ± 3.0 9.9 ± 3.3 9.7 ± 3.0 9.9 ± 3.8 10.6 ± 3.4 11.2 ± 5.4
% puFa 5.1 ± 2.6 4.2 ± 2.4 4.4 ± 2.2 4.9 ± 2.7 4.8 ± 2.3 4.5 ± 2.4 6.2 ± 2.8 5.8 ± 4.1
Wilcoxon rank test used to examine differences among groups. * p ≤ 0.05.** p ≤ 0.001.*** p ≤ 0.0001.muFa = monounsaturated fatty acid. puFa = polyunsaturated fatty acid.
Indigenous Peoples’ food systems & well-being | Case studies | Gwich’in112
across categories. More protein, as a percentage of total diet, was consumed by the traditional food consumers among both youth (boys and total youth) and women. Similar amounts of total fat and carbohydrate were consumed by youth who consumed traditional food and those who did not, but among women the percentage of energy from carbohydrate appears higher among non-consumers. these data corroborate similar findings reported earlier, although the ages of participants differed and the sample sizes were larger for adults (Kuhnlein and Receveur, 2007).
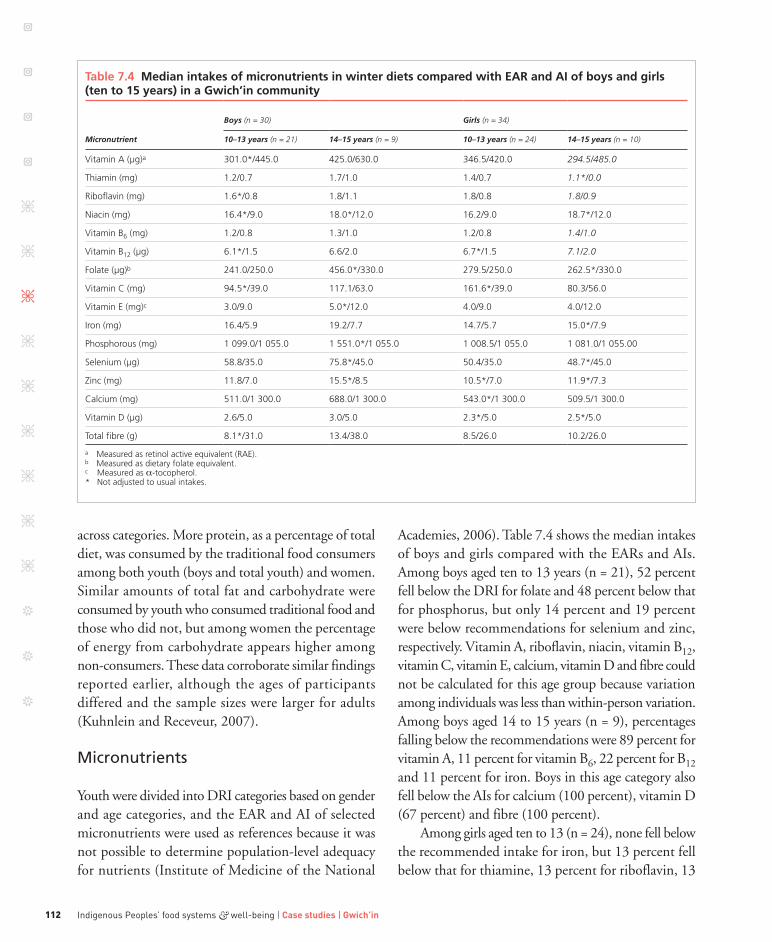
Micronutrients
Youth were divided into DRi categories based on gender and age categories, and the EaR and ai of selected micronutrients were used as references because it was not possible to determine population-level adequacy for nutrients (institute of Medicine of the national
academies, 2006). table 7.4 shows the median intakes of boys and girls compared with the EaRs and ais. among boys aged ten to 13 years (n = 21), 52 percent fell below the DRi for folate and 48 percent below that for phosphorus, but only 14 percent and 19 percent were below recommendations for selenium and zinc, respectively. Vitamin a, riboflavin, niacin, vitamin B12, vitamin C, vitamin E, calcium, vitamin D and fibre could not be calculated for this age group because variation among individuals was less than within-person variation. among boys aged 14 to 15 years (n = 9), percentages falling below the recommendations were 89 percent for vitamin a, 11 percent for vitamin B6, 22 percent for B12 and 11 percent for iron. Boys in this age category also fell below the ais for calcium (100 percent), vitamin D (67 percent) and fibre (100 percent).
among girls aged ten to 13 (n = 24), none fell below the recommended intake for iron, but 13 percent fell below that for thiamine, 13 percent for riboflavin, 13
Table 7.4 Median intakes of micronutrients in winter diets compared with EAR and AI of boys and girls (ten to 15 years) in a Gwich’in community
Boys (n = 30) Girls (n = 34)
Micronutrient 10–13 years (n = 21) 14–15 years (n = 9) 10–13 years (n = 24) 14–15 years (n = 10)
Vitamin a (µg)a 301.0*/445.0 425.0/630.0 346.5/420.0 294.5/485.0
thiamin (mg) 1.2/0.7 1.7/1.0 1.4/0.7 1.1*/0.0
riboflavin (mg) 1.6*/0.8 1.8/1.1 1.8/0.8 1.8/0.9
niacin (mg) 16.4*/9.0 18.0*/12.0 16.2/9.0 18.7*/12.0
Vitamin B6 (mg) 1.2/0.8 1.3/1.0 1.2/0.8 1.4/1.0
Vitamin B12 (µg) 6.1*/1.5 6.6/2.0 6.7*/1.5 7.1/2.0
Folate (µg)b 241.0/250.0 456.0*/330.0 279.5/250.0 262.5*/330.0
Vitamin c (mg) 94.5*/39.0 117.1/63.0 161.6*/39.0 80.3/56.0
Vitamin e (mg)c 3.0/9.0 5.0*/12.0 4.0/9.0 4.0/12.0
iron (mg) 16.4/5.9 19.2/7.7 14.7/5.7 15.0*/7.9
phosphorous (mg) 1 099.0/1 055.0 1 551.0*/1 055.0 1 008.5/1 055.0 1 081.0/1 055.00
Selenium (µg) 58.8/35.0 75.8*/45.0 50.4/35.0 48.7*/45.0
Zinc (mg) 11.8/7.0 15.5*/8.5 10.5*/7.0 11.9*/7.3
calcium (mg) 511.0/1 300.0 688.0/1 300.0 543.0*/1 300.0 509.5/1 300.0
Vitamin d (µg) 2.6/5.0 3.0/5.0 2.3*/5.0 2.5*/5.0
total fibre (g) 8.1*/31.0 13.4/38.0 8.5/26.0 10.2/26.0
a measured as retinol active equivalent (rae).b measured as dietary folate equivalent.c measured as α-tocopherol.* not adjusted to usual intakes.
113Gwich’in traditional food and health in Tetlit Zheh, Northwest Territories, Canada: phase II
percent for niacin, 21 percent for vitamin B6, 46 percent for folate, 96 percent for vitamin E, 58 percent for phosphorus, 17 percent for selenium and 100 percent for fibre. among girls aged 14 to 15 years (n = 10), 80 percent fell below the EaR for vitamin a, 20 percent for riboflavin, 20 percent for vitamin B12, 40 percent for vitamin C and 50 percent for phosphorus. Girls also fell below the ais for calcium (90 percent) and fibre (100 percent).
Despite apparent underreporting by women, most women in the sample were obviously consuming adequate amounts of thiamin, vitamin B12, iron, phosphorus, selenium and zinc, undoubtedly owing to the large portions of traditional food animal protein reported (not shown).
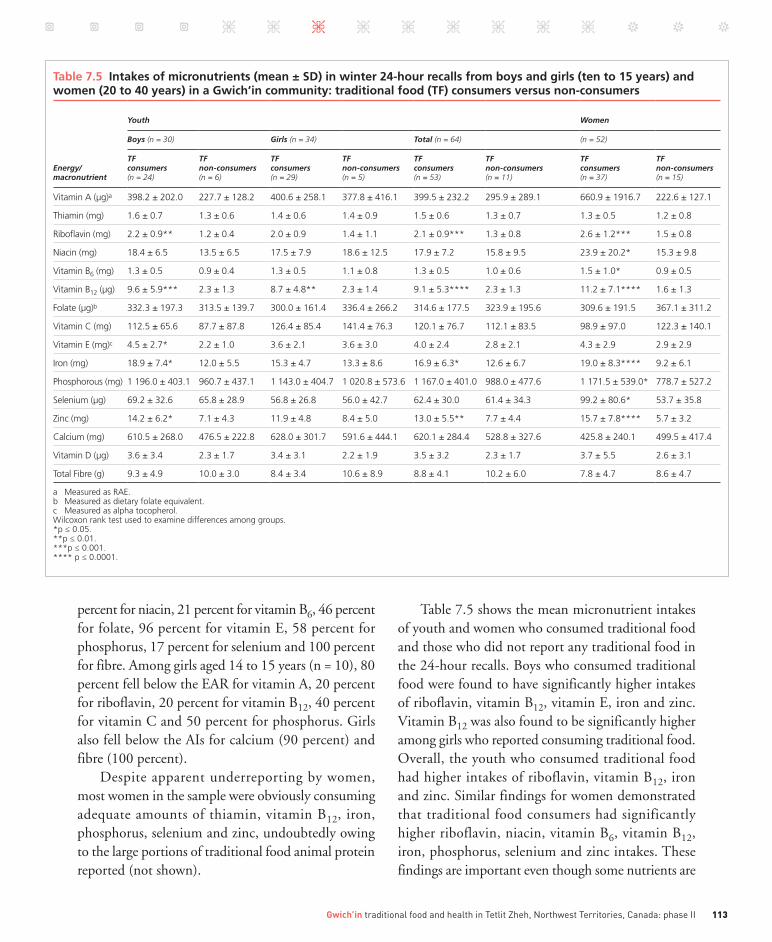
table 7.5 shows the mean micronutrient intakes of youth and women who consumed traditional food and those who did not report any traditional food in the 24-hour recalls. Boys who consumed traditional food were found to have significantly higher intakes of riboflavin, vitamin B12, vitamin E, iron and zinc. Vitamin B12 was also found to be significantly higher among girls who reported consuming traditional food. overall, the youth who consumed traditional food had higher intakes of riboflavin, vitamin B12, iron and zinc. Similar findings for women demonstrated that traditional food consumers had significantly higher riboflavin, niacin, vitamin B6, vitamin B12, iron, phosphorus, selenium and zinc intakes. these findings are important even though some nutrients are
Table 7.5 Intakes of micronutrients (mean ± SD) in winter 24-hour recalls from boys and girls (ten to 15 years) and women (20 to 40 years) in a Gwich’in community: traditional food (TF) consumers versus non-consumers
Youth Women
Boys (n = 30) Girls (n = 34) Total (n = 64) (n = 52)
Energy/ macronutrient
TF consumers (n = 24)
TF non-consumers (n = 6)
TF consumers (n = 29)
TF non-consumers (n = 5)
TF consumers (n = 53)
TF non-consumers (n = 11)
TF consumers (n = 37)
TF non-consumers (n = 15)
Vitamin a (µg)a 398.2 ± 202.0 227.7 ± 128.2 400.6 ± 258.1 377.8 ± 416.1 399.5 ± 232.2 295.9 ± 289.1 660.9 ± 1916.7 222.6 ± 127.1
thiamin (mg) 1.6 ± 0.7 1.3 ± 0.6 1.4 ± 0.6 1.4 ± 0.9 1.5 ± 0.6 1.3 ± 0.7 1.3 ± 0.5 1.2 ± 0.8
riboflavin (mg) 2.2 ± 0.9** 1.2 ± 0.4 2.0 ± 0.9 1.4 ± 1.1 2.1 ± 0.9*** 1.3 ± 0.8 2.6 ± 1.2*** 1.5 ± 0.8
niacin (mg) 18.4 ± 6.5 13.5 ± 6.5 17.5 ± 7.9 18.6 ± 12.5 17.9 ± 7.2 15.8 ± 9.5 23.9 ± 20.2* 15.3 ± 9.8
Vitamin B6 (mg) 1.3 ± 0.5 0.9 ± 0.4 1.3 ± 0.5 1.1 ± 0.8 1.3 ± 0.5 1.0 ± 0.6 1.5 ± 1.0* 0.9 ± 0.5
Vitamin B12 (µg) 9.6 ± 5.9*** 2.3 ± 1.3 8.7 ± 4.8** 2.3 ± 1.4 9.1 ± 5.3**** 2.3 ± 1.3 11.2 ± 7.1**** 1.6 ± 1.3
Folate (µg)b 332.3 ± 197.3 313.5 ± 139.7 300.0 ± 161.4 336.4 ± 266.2 314.6 ± 177.5 323.9 ± 195.6 309.6 ± 191.5 367.1 ± 311.2
Vitamin c (mg) 112.5 ± 65.6 87.7 ± 87.8 126.4 ± 85.4 141.4 ± 76.3 120.1 ± 76.7 112.1 ± 83.5 98.9 ± 97.0 122.3 ± 140.1
Vitamin e (mg)c 4.5 ± 2.7* 2.2 ± 1.0 3.6 ± 2.1 3.6 ± 3.0 4.0 ± 2.4 2.8 ± 2.1 4.3 ± 2.9 2.9 ± 2.9
iron (mg) 18.9 ± 7.4* 12.0 ± 5.5 15.3 ± 4.7 13.3 ± 8.6 16.9 ± 6.3* 12.6 ± 6.7 19.0 ± 8.3**** 9.2 ± 6.1
phosphorous (mg) 1 196.0 ± 403.1 960.7 ± 437.1 1 143.0 ± 404.7 1 020.8 ± 573.6 1 167.0 ± 401.0 988.0 ± 477.6 1 171.5 ± 539.0* 778.7 ± 527.2
Selenium (µg) 69.2 ± 32.6 65.8 ± 28.9 56.8 ± 26.8 56.0 ± 42.7 62.4 ± 30.0 61.4 ± 34.3 99.2 ± 80.6* 53.7 ± 35.8
Zinc (mg) 14.2 ± 6.2* 7.1 ± 4.3 11.9 ± 4.8 8.4 ± 5.0 13.0 ± 5.5** 7.7 ± 4.4 15.7 ± 7.8**** 5.7 ± 3.2
calcium (mg) 610.5 ± 268.0 476.5 ± 222.8 628.0 ± 301.7 591.6 ± 444.1 620.1 ± 284.4 528.8 ± 327.6 425.8 ± 240.1 499.5 ± 417.4
Vitamin d (µg) 3.6 ± 3.4 2.3 ± 1.7 3.4 ± 3.1 2.2 ± 1.9 3.5 ± 3.2 2.3 ± 1.7 3.7 ± 5.5 2.6 ± 3.1
total Fibre (g) 9.3 ± 4.9 10.0 ± 3.0 8.4 ± 3.4 10.6 ± 8.9 8.8 ± 4.1 10.2 ± 6.0 7.8 ± 4.7 8.6 ± 4.7
a measured as rae.b measured as dietary folate equivalent.c measured as alpha tocopherol.Wilcoxon rank test used to examine differences among groups.*p ≤ 0.05.**p ≤ 0.01.***p ≤ 0.001.**** p ≤ 0.0001.

Indigenous Peoples’ food systems & well-being | Case studies | Gwich’in114
not being consumed in sufficient amounts. the animal food portion of the diet, primarily as traditional food, is the major contributor of many of these nutrients. Earlier results with Dene/Métis and Yukon youth aged ten to 12 years (n = 98) showed similar patterns of nutrient intake among consumers and non-consumers of traditional food (nakano et al., 2005b). Dene/Métis adults (n = 1 007) from all regions also showed similar patterns, except that non-consumers had higher intakes of energy, carbohydrate, total fat, saturated fat, vitamins D and E and several minerals (Kuhnlein et al., 2004).
Food group servings
table 7.6 shows the mean numbers of food group servings derived from the 24-hour recalls reported by youth and women, and compares these with Canadian Food Guide recommendations. Youth had fewer than the recommended number of servings of both fruits and vegetables, and milk and alternatives. when youth and women who consume traditional food were compared with those who do not the only significant difference was that non-consumers were found to consume fewer servings of meat and alternatives.
as noted in table 7.2, 82 percent of youth reported consuming a minimum of one item of traditional food
in the 24-hour recalls. Caribou was the most frequent food item consumed, with moose and whitefish also being popular. traditional food consumers consumed an average of 154 g of traditional food daily, or 2.1 servings according to Canada’s Food Guide for First nations, inuit and Métis (health Canada, 2007). Results from the traditional food frequency questionnaire showed that women consumed a total of 30 different traditional food species and 81 different traditional food parts during the three-month reporting period. Caribou (Rangifer tarandus), whitefish (Coregonus sp., Prosopium sp.), Labrador tea (Ledum groenlandicum), loche (Lota lota) and cranberries (Vaccinium sp.) were particularly prominent in the diet, being consumed by the largest percentages of women.
Selected sweet, salty and fat-rich dessert market foods consumed by youth and women accounted for a large amount of energy in the recalls; table 7.7 shows the average numbers of mentions per person and the average serving sizes. For example, women consumed up to 36 oz of sweetened drinks, 48 oz of pop and four servings of sweet desserts within the recall period. Similar findings for Dene youth were demonstrated earlier, with more than 50 percent of market food energy coming from these kinds of food (nakano et al., 2005b).
Table 7.6 Food group servings (mean ± SD) in winter 24-hour recalls of youth (ten to 15 years) and women (20 to 40 years) in a Gwich’in community compared with recommendations
Food group Recommended servings TF consumers TF non-consumers Total
Youth (n = 53) (n = 11) (n = 64)
Fruits and vegetables 5–8 2.6 ± 1.9 2.6 ± 1.6 2.6 ± 1.8
Grain products 4–7 4.7 ± 2.7 4.7 ± 3.0 4.7 ± 2.7
milk and alternatives 2–4 0.9 ± 0.7 0.7 ± 0.5 0.9 ± 0.7
meat and alternatives 1–2 3.6 ± 1.8* 1.8 ± 1.5* 3.3 ± 1.9
Women (n = 37) (n = 15) (n = 53)
Fruits and vegetables 7–8 1.7 ± 1.8 2.2 ± 2.5 1.8 ± 2.0
Grain products 6–7 4.4 ± 3.1 4.7 ± 4.7 4.4 ± 3.6
milk and alternatives 2 0.5 ± 0.5 0.5 ± 0.5 0.5 ± 0.5
meat and alternatives 2 5.4 ± 4.1* 2.2 ± 2.0* 4.4 ± 3.9
recommendations from canada’s Food Guide to Healthy eating for First nations, inuit and métis. Wilcoxon rank test used to examine differences among groups. * p ≤ 0.01.tF = traditional food.
115Gwich’in traditional food and health in Tetlit Zheh, Northwest Territories, Canada: phase II
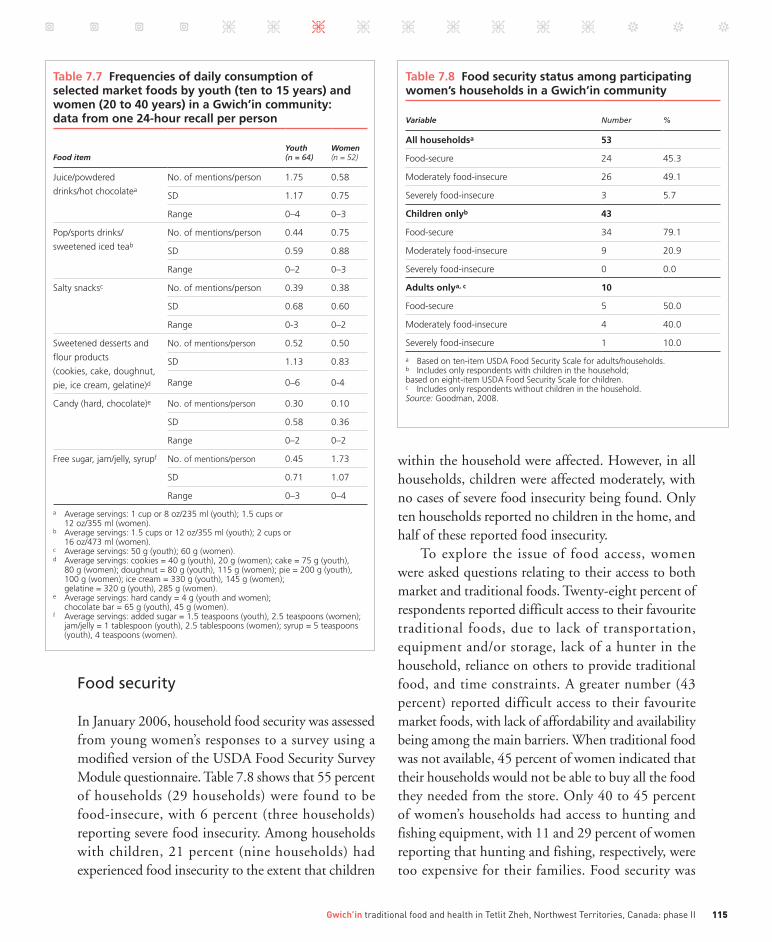
Food security
in January 2006, household food security was assessed from young women’s responses to a survey using a modified version of the USDa Food Security Survey Module questionnaire. table 7.8 shows that 55 percent of households (29 households) were found to be food-insecure, with 6 percent (three households) reporting severe food insecurity. among households with children, 21 percent (nine households) had experienced food insecurity to the extent that children
within the household were affected. however, in all households, children were affected moderately, with no cases of severe food insecurity being found. only ten households reported no children in the home, and half of these reported food insecurity.
to explore the issue of food access, women were asked questions relating to their access to both market and traditional foods. twenty-eight percent of respondents reported difficult access to their favourite traditional foods, due to lack of transportation, equipment and/or storage, lack of a hunter in the household, reliance on others to provide traditional food, and time constraints. a greater number (43 percent) reported difficult access to their favourite market foods, with lack of affordability and availability being among the main barriers. when traditional food was not available, 45 percent of women indicated that their households would not be able to buy all the food they needed from the store. only 40 to 45 percent of women’s households had access to hunting and fishing equipment, with 11 and 29 percent of women reporting that hunting and fishing, respectively, were too expensive for their families. Food security was
Table 7.8 Food security status among participating women’s households in a Gwich’in community
Variable Number %
All householdsa 53
Food-secure 24 45.3
moderately food-insecure 26 49.1
Severely food-insecure 3 5.7
Children onlyb 43
Food-secure 34 79.1
moderately food-insecure 9 20.9
Severely food-insecure 0 0.0
Adults onlya, c 10
Food-secure 5 50.0
moderately food-insecure 4 40.0
Severely food-insecure 1 10.0
a Based on ten-item uSda Food Security Scale for adults/households.b includes only respondents with children in the household; based on eight-item uSda Food Security Scale for children.c includes only respondents without children in the household. Source: Goodman, 2008.
Table 7.7 Frequencies of daily consumption of selected market foods by youth (ten to 15 years) and women (20 to 40 years) in a Gwich’in community: data from one 24-hour recall per person
Food itemYouth (n = 64)
Women (n = 52)
Juice/powdered
drinks/hot chocolatea
no. of mentions/person 1.75 0.58
Sd 1.17 0.75
range 0–4 0–3
pop/sports drinks/
sweetened iced teab
no. of mentions/person 0.44 0.75
Sd 0.59 0.88
range 0–2 0–3
Salty snacksc no. of mentions/person 0.39 0.38
Sd 0.68 0.60
range 0-3 0–2
Sweetened desserts and
flour products
(cookies, cake, doughnut,
pie, ice cream, gelatine)d
no. of mentions/person 0.52 0.50
Sd 1.13 0.83
range 0–6 0-4
candy (hard, chocolate)e no. of mentions/person 0.30 0.10
Sd 0.58 0.36
range 0–2 0–2
Free sugar, jam/jelly, syrupf no. of mentions/person 0.45 1.73
Sd 0.71 1.07
range 0–3 0–4
a average servings: 1 cup or 8 oz/235 ml (youth); 1.5 cups or 12 oz/355 ml (women).b average servings: 1.5 cups or 12 oz/355 ml (youth); 2 cups or 16 oz/473 ml (women).c average servings: 50 g (youth); 60 g (women).d average servings: cookies = 40 g (youth), 20 g (women); cake = 75 g (youth), 80 g (women); doughnut = 80 g (youth), 115 g (women); pie = 200 g (youth), 100 g (women); ice cream = 330 g (youth), 145 g (women); gelatine = 320 g (youth), 285 g (women).e average servings: hard candy = 4 g (youth and women); chocolate bar = 65 g (youth), 45 g (women).f average servings: added sugar = 1.5 teaspoons (youth), 2.5 teaspoons (women); jam/jelly = 1 tablespoon (youth), 2.5 tablespoons (women); syrup = 5 teaspoons (youth), 4 teaspoons (women).

Indigenous Peoples’ food systems & well-being | Case studies | Gwich’in116
also found to be positively correlated with full-time employment (Goodman, 2008).
traditional food access scores were developed from questions on the availability of hunting and fishing equipment, the affordability of hunting and fishing excursions, and access to traditional food in general. the food access scores were correlated positively with the frequency of traditional food use, and households with reduced traditional food access consumed less traditional land animal meats and total traditional food, quantified by serving sizes (Goodman, 2008). Figure 7.2 shows how the traditional food access score significantly predicted food security among those interviewed.
Climate change impacts on access to food and health
Because the impacts of climate change are thought to affect food availability negatively, key informants were interviewed to assess their perceptions of the impacts of climate change on access to traditional food species, market food and health. a total of 22 Dene First
nations adults were interviewed, representing the five regions of the Dene nation and all age categories; of these 13 men and eight women, eight were elders aged 60 years or more. nine participants were from Gwich’in communities in nwt. Responses were categorized into three themes: perceived impact on the harvesting of traditional food; access to traditional foods and changes in health; and access to healthy market foods.
theme 1 – impact on the harvesting of traditional foodsSixty-eight percent (15/22) of the participants, including all Gwich’in participants, felt that climate change has affected their intake of traditional foods. Participants from northern (e.g., Gwich’in) and central (e.g., akaitcho) regions observed changes in the species of fish and in the water. Changes in the temperature and cleanliness of the water were perceived as contributing to fish migration and health. Responses on changes in the fish included “discolouration”, “smaller in size”, “change in flesh texture”, “unhealthy” and “less fish available to harvest”. Comments included the following:
the water is not clean. i know there is something wrong with the water but i eat the fish anyway. i see worms, parasites and bumps on the fish, but i still consume fish because it is traditional food.Participants from all regions perceived a decline in
numbers of caribou and moose, and attributed this to climate-related changes in migration patterns caused by warming temperatures, increased forest fires and reduced access to food sources. For example, caribou’s access to food sources was reported to be limited by ice formation under the snow preventing them from breaking through the ice with their hooves to reach the lichen; as a result, caribou were reported as being thinner than previously. in addition, biting insects (mosquitoes, warble flies and bot flies) that harass caribou make it difficult for the animals to feed.
Changes in weather conditions were reported as affecting travel for hunting or fishing. an elder reported “it is difficult to read snow patterns”. Participants observed changes in the snow and ice, with rivers and lakes freezing more slowly, which prevents hunters from moving across the land. water under the snow
Figure 7.2 Relationship between food security status and traditional food access score among women in a Gwich’in community (n = 51)
Fo
od
-in
secu
reFo
od
-sec
ure
With traditional food accessa
Without traditional food accessb
p (χ2) < 0.05.Food security status based on ten-item adult/household scale from the USDA Food Security Survey Module.a Positive responses to all traditional food access items included in the traditional food access score.b Minimum of one negative response to a traditional food access item included in the traditional food access score.
Source: Goodman, 2008.
117Gwich’in traditional food and health in Tetlit Zheh, Northwest Territories, Canada: phase II
also makes travelling dangerous for hunters. a hunter commented, “when on the land, i don’t know if i will end up in open water where there wasn’t any before.”
Participants reported that there were fewer ducks to harvest; possible explanations included changes in flight patterns, with birds no longer stopping where they historically did so, and early migration from the north. another perspective was “ducks do not lay as many eggs, and do not protect their young as well … decrease is seen in cranes and geese”. new bird species entering the habitat were reported across all five regions.
Participants also noted that the rising cost of fuel is limiting their ability to go out on the land to harvest traditional food. the increased cost of fuel for heating homes was reported as reducing the funds available to go harvesting. the costs of supplies and equipment for hunting and fishing were reported to have increased, thus limiting harvesting. one respondent stated “in the past it would cost approximately CaD 700 to go out on the land and harvest (camp), but today it costs approximately CaD 1 200”. other factors affecting the harvesting of traditional foods included increased predators, outfitters and the tourist trade, and industries that interrupt migration patterns.
theme 2 – access to traditional foodsthirty-six percent (8/22) of key informants felt that they did not eat as much traditional food as they would like to, and that access to these foods was more difficult. those who reported eating less traditional food than they would like stated that the costs of fuel and the time available for hunting were impediments, as well as reduced animal numbers in nearby hunting locations. Being able to purchase traditional foods from a store would improve their access to these foods.
although participants reported that access to traditional foods had become more difficult recently, many also reported the cultural practice of sharing meat. Meat was noted as being given to single mothers and the elderly who cannot get to the land themselves. “through harvesting traditional foods you practise your culture and live your heritage” was a comment that summarized the value participants placed on traditional foods. Participants viewed the changes
in traditional foods over the last two years as having had an impact on their families’ health, by increasing diabetes and blood cholesterol in adults and dental caries in youth. Youth were reported as replacing traditional foods with high-sugar, high-fat foods. trends in increasing intakes of high-sugar/-fat foods were also reported in adults, and were perceived to be a contributing factor in the rise in body weight, diabetes and cholesterol problems.
Changes in traditional foods were also perceived as affecting family members’ behaviour and mood. one father stated “when there is no caribou, i feed my family hamburger, hotdog and pizza,” and that he could see a difference in his family’s behaviour. another participant reported “a decrease in caribou affects their mood. traditional foods strengthen their mood, self-esteem and attitudes, and increase their energy.” Participants also consistently stated that traditional foods are healthy, and that they feel healthier when they consume them.
theme 3 – access to healthy market foodsParticipants observed that healthy foods cost too much in communities in northern regions. Seven of the nine Gwich’in participants stated that the healthy foods in stores are too expensive to buy, although the stores keep them in stock. other factors reported as affecting access to healthy foods were lack of variety, the poor condition of fresh foods, and stores’ inadequate supplies of healthy foods. Participants in remote communities stated that they travelled to the closest towns, often several hours’ drive away, for their food shopping. Participants also noted that food costs are too high in the north: “for example, a litre of milk costs CaD 8 in the north, but only CaD 3 in the south”. Participants stated that a reduction in the price of healthy foods, and timely deliveries of perishable foods to stores would make it easier to purchase healthy foods.
Project activities in Tetlit Zheh
in the context of activities being conducted by other agencies in the community, project assistants in tetlit Zheh considered community activities for improving
Indigenous Peoples’ food systems & well-being | Case studies | Gwich’in118
knowledge of and access to healthy traditional and market foods. after consultations, local personnel developed and delivered several activities over an 18-month period. one or two community health promoters based in local healing centres were supported throughout the project. the activities implemented included:
• food teaching events for community groups (youth, schools, young mothers, etc.), usually led by elders and tl’oondih healing Society staff;
• regular local radio announcements about project activities, recipes and traditional food availability and quality (in liaison with the natural Resource Department);
• nutrition classes in schools;• fitness events for women;• classes and meals for pregnant women and young
mothers;• teaching schoolchildren about food labels
(market food); • classes on nutrition, the risk of diabetes, and
traditional values from traditional food, at youth camps (grades 4 to 7) about 30 km up-river;
• regular updates to the Band Council;• nutrition activities for the Moms and tots
programme;• production of a DVD describing the current
food situation and challenges, and emphasizing the importance of traditional food and healthy market food;2
• publication and distribution of a book about traditional Gwich’in food and health;
• Drop the Pop nwt.3
Future considerations
this chapter has provided a systematic evaluation of the food and health circumstances of youth and
young women in the Gwich’in community of tetlit Zheh, and has described awareness raising activities to improve health through the increased use of traditional
Gwich’in food and healthy market food. the tetlit Gwich’in are similar to many indigenous communities in northern Canada, which have excellent traditional food resources but reduced access to them, while the resulting nutrition transition raises growing concerns about changing dietary patterns, reduced physical activity and increasing obesity and chronic diseases.
the focus of the research was on youth and young women during the deep winter, when traditional food use is at its lowest. this strategy was based on the belief that improving the dietary and activity behaviours of these two population segments in the lean season could lead to year-round change in the entire community, through activities planned and delivered to the community as a whole.
the researchers found that dietary patterns were short of several nutrients, despite important intakes of traditional food by both youth and young women. those consuming traditional foods had better diets in several respects. Replacing market foods of low nutrient density with traditional food of higher nutrient density would improve nutrient intakes, even though food group analysis showed that servings of meat and alternatives exceeded Canadian aboriginal Food Guide recommendations, while milk, and fruit and vegetable servings fell seriously short. in general, the traditional animal foods available to and consumed by youth and women were the best foods presented in the dietary recalls. if all parts of animals/fish and berries had been consumed more frequently, intakes of nutrients such as vitamins a, C, E and D would likely have met requirements among more youth and women (Kuhnlein et al., 2006).
Physical activity patterns were modest, and overweight and obesity affected both youth and young women, with BMi and body fat being higher among women. Fortunately, hypertension was non-existent, and pre-hypertension was present for only a small proportion of youth and young women. Youth expressed interest in and enthusiasm for several culturally relevant physical fitness activities, and did not spend excessive time with in-home entertainment media (television, video and video games), as has been reported in other aboriginal communities (Bernard et al., 1995). the
2 www.indigenousnutrition.org3 www.dropthepopnwt.ca

119Gwich’in traditional food and health in Tetlit Zheh, Northwest Territories, Canada: phase II
extent of obesity among young women is especially concerning, as changing dietary patterns, reduced use of traditional food and increased use of food of lower nutrient density, coupled with a physical activity expenditure that is below the energy intake is the classic pattern of the nutrition transition and the root cause of increasing obesity and the onset of chronic disease (Kuhnlein et al., 2004).
the food security of tetlit Gwich’in women and households was associated with access to traditional food resources. Qualitative research showed that the impact of climate change and increased food and fuel prices had affected households’ ability to hunt and fish for family subsistence. this led to perceptions of poorer health having resulted from a diet composed of less traditional and quality market food than people would prefer. it is telling that full-time employment was also correlated with food security, and that people with higher incomes would like to be able to buy traditional foods, which they cannot do locally owing to government controls on the sale of wildlife. From the extensive interviews reported here, it is obvious that Gwich’in adults are well aware of the nutritional and health qualities of their traditional foods, and that they must be proactive in improving their access to these foods. this was demonstrated in the response to creating a food and health book for this project, and in other recent ethnographic research on traditional Gwich’in food resources (andre and Fehr, 2001; Parlee, Berkes and teetl’it Gwich’in, 2005).
Project assistants presented diverse intervention strategies to the tetlit Zheh community. these were primarily experiential activities focusing on traditional food preparation and the recording of recipes for a community food and health book, physical activities for youth and women, radio and internet communications, and learning activities for schools and women’s groups. the most successful activities tended to be those within the school structure, while the scheduling of activities targeting young women was more challenging, owing to the women’s time commitments (child care, community responsibilities, etc.) and limited free time. the DVD and food book have been circulated in the community and have been very well received. in a small, informal
survey, community members rated the food book as very useful. individuals found the book useful for passing on traditional food knowledge to youth, and one school teacher was using the book in the classroom. Many of the people surveyed said that they had already learned a great deal regarding nutrition and the variety of ways of preparing traditional food.
a continuous flow of resources is needed to support sustained behaviour change strategies for all segments of the population. of particular importance are mutually supportive activities that are coordinated from community offices and other settings – such as those sponsored from schools, the health centre, the head Start centre for toddlers and their mothers, elders’ committees, the hunters’ and trappers’ association and the Band administration, and those promoted by researchers present in the community. if they are to be successful, interventions for preventing chronic disease by focusing on nutrition and physical activity in low-income settings must be interactive, culturally grounded and coordinated through primary care settings, with incentives for participation (Chaudhary and Kreiger, 2007).
Community food stores, of which two were operating during the project period, also offer potential for promoting better food environments. it has been shown that disparities in obesity prevalence depend on the quality of retail food environments in disadvantaged areas, especially when income is limited, and particularly among women (Ford and Dzewaltowski, 2008). two examples of attempts to improve retail food outlets in the Canadian arctic are the Government of Canada’s Food Mail programme, which has worked to increase the availability of purchased foods in selected communities in the north (Lawn and harvey, 2001), and healthy Foods north. neither of these programmes has been active in tetlit Zheh, and healthy Foods north had to close in 2010 owing to funding problems.
the objectives of the Gwich’in traditional Food and health Project in tetlit Zheh were undermined by the impact of climate change and other forces that reduced the availability and presence of traditional animal food resources at a reasonable distance from the community, and by rapidly escalating food and fuel

Indigenous Peoples’ food systems & well-being | Case studies | Gwich’in120
prices. the project could therefore not demonstrate that an intervention based on traditional food and healthy market food had improved the health of youth and young women. a post-intervention evaluation at the close of the project budget period was deemed unfeasible because of the constraints people faced with reduced access to both traditional and healthy market foods, despite popular and broad-based community education activities.
indigenous Peoples throughout the world face circumstances that compromise their cultural food systems. in the case of the tetlit Gwich’in, the need and wish of the community is to maintain traditional foods for their health and cultural benefits, and to be able to buy quality market foods that they prefer and can afford. interventions that mitigate climate change and contribute to protecting the habitat of diverse food species will help meet this goal. it is also important to build on other social justice initiatives that protect the cultural food system and livelihoods, to assuage poverty in all its dimensions, and to continue to provide resources and tools for health promotion that develops and maintains a healthy community in the contemporary world y
Acknowledgementsthe authors thank the women and youth participants, advisers, community members and families who kindly shared their knowledge and who warmly welcomed the research team into tetlit Zheh. We especially acknowledge the elders whose expertise helped guide the project. thank you also to margaret mcdonald and the tl’oondih Healing Society, which provided key support through office space and project administration. We acknowledge the leadership and commitment of elizabeth Vittrekwa in the initial stages of data collection, and the hard work of mary ross, Brenda martin, Jayda andre and rhonda Francis in project completion. We thank liz cayen for her assistance in financial administration. appreciation is extended to Jill lambden, who worked with dina Spigelski and lauren Goodman conducting community assessments and completing data analysis, with support from louise Johnson-down and rula Soueida. We are grateful to the tetlit Gwich’in Band council, Sharon Snowshoe, Hazel nerysoo, Johnny Kay and the Hamlet for supporting this project. We thank principal Bruce Spencer, Vice-principal Shirley Snowshoe and staff of chief Julius School for their gracious support in the collection of the youth data. We give special thanks to cBQm, the local radio station, and to tena Blake and the moms and tots programme. primary funding for this project was provided by a grant from the canadian institutes of Health research (institute of aboriginal peoples’ Health and institute of nutrition, metabolism and diabetes). > Comments to: [email protected]
>> Photographic section p. X