Embed Size (px)
Citation preview

Chapter 7: Designing Reports and Labels Reports and labels provide a flexible way for you to display and summarize your data in a printed document. Reports have two basic components: a data source and a layout. The data source is often a set of tables in your database but it can also be a view, query, or cursor. Views and queries filter, order, and group data from the database and the report layout defines the printed format of the reports. After you have a table and a view or query defined, you are ready to create reports or labels.
This chapter discusses:
� Planning Your Report Layout � Creating a Report Layout � Creating a Mailing Label Layout � Modifying Your Layout � Adding Report Controls � Grouping Data on Your Layout � Customizing Your Layout � Previewing and Printing Your Report or Label
Planning Your Report Layout
You can design your report to display your data in a variety of ways on the printed page. Using the Report Designer or report wizards, you can design comprehensive lists, summaries, or special subsets of data, like an invoice. Designing a report has four main steps:
1. Determining what type of report to create.
2. Creating the report layout file.
3. Modifying and customizing the layout file.
4. Previewing and printing the report.
The report creation process

Determining the General Layout
Before creating a report, decide the general format you want your report to have. Your report might be as simple as a telephone list based on a single table or as complex as an invoice based on multiple tables. You can also create special types of reports. For example, a mailing label is a special report with a layout designed to fit a special type of paper.
General report layouts
To help you choose a layout, here are some descriptions of general layouts, their common uses, and examples.

1 Layouts that have an associated report wizard
After you select the general report layout that meets your needs, you can create the report layout file with the Report Designer.
Understanding Report Layout Files
A report layout file, which has an .frx file extension, stores the specifications for the report. Each report file also has an associated file with an .frt file extension. The report file specifies the fields you want, the text to print, and the placement of the information on a page. To get the information from your database to the printed page, you process it by printing the report file. The file does not store the values for each of the data fields, only placement and format information for that particular report. The values can change each time you run the report, depending on the changes that have occurred in the fields of the data source used by the report file.
Creating a Report Layout
You can create report layouts three ways in Visual FoxPro:
� Create simple single or multiple table reports with a Report Wizard. � Create a simple report from a single table with Quick Report. � Modify existing reports or create your own report with the Report Designer.
With each of these methods, you create a report layout file you can modify using the
Layout Type Description Examples
Column One record per row with fields placed horizontally across the page
Group/Total report1
Financial reports Inventory Sales summary
Row One column of records with fields placed vertically down the side
Lists
One-to-many1 One record or one-to-many relationship
Invoices Account statements
Multi-column More than one column of records with fields placed vertically down the left margin
Telephone directory Business cards
Label More than one column of records with fields placed vertically down the left margin; printed on special paper
Mailing labels1
Name tags

Report Designer. The Report Wizard is the easiest way to start a report and automatically offers many of the Report Designer’s customization features. The Quick Report is the fastest way to create a simple layout. If you create a report directly in the Report Designer, the Report Designer presents you with a blank layout.
Using a Report Wizard
Whenever you want to create a report, you can use a report wizard to help you set it up. The wizard asks you a series of questions and creates a report layout for you based on your answers.
Visual FoxPro provides these report and label layout wizards:
� Report � One-to-Many � Label � Mail Merge
The wizard you choose depends on the general layout and complexity of your report.
To use a report wizard
1. In the Project Manager, select Reports.
2. Choose New.
3. Choose Report Wizard.
4. Select the type of report you want to create.
5. Follow the instructions on the wizard screens.
You can also access the report wizards from the menu by choosing Wizards from the Tools menu, and selecting Report.
Once you use a wizard, you can use the Report Designer to add controls and customize your report. For more information, see Customizing Your Layout later in this chapter.
Starting the Report Designer
If you do not want to use a report wizard, you can begin with a blank report layout and add controls yourself.
To create a blank report
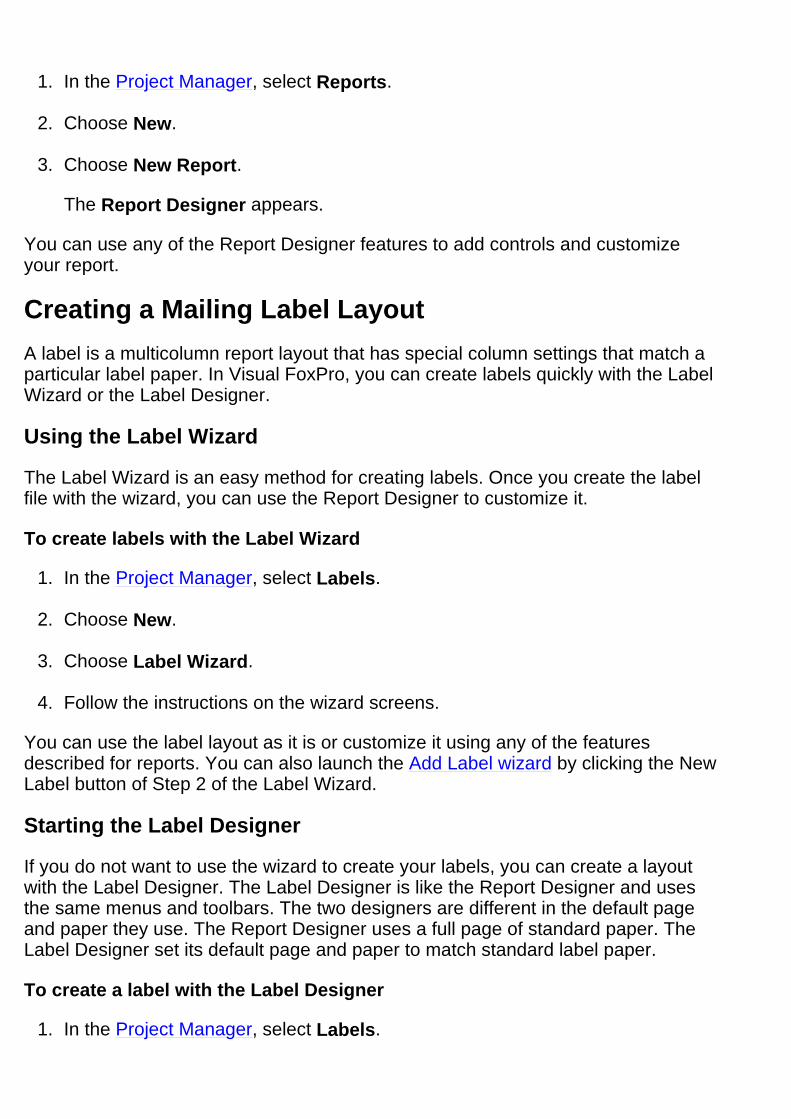
1. In the Project Manager, select Reports.
2. Choose New.
3. Choose New Report.
The Report Designer appears.
You can use any of the Report Designer features to add controls and customize your report.
Creating a Mailing Label Layout
A label is a multicolumn report layout that has special column settings that match a particular label paper. In Visual FoxPro, you can create labels quickly with the Label Wizard or the Label Designer.
Using the Label Wizard
The Label Wizard is an easy method for creating labels. Once you create the label file with the wizard, you can use the Report Designer to customize it.
To create labels with the Label Wizard
1. In the Project Manager, select Labels.
2. Choose New.
3. Choose Label Wizard.
4. Follow the instructions on the wizard screens.
You can use the label layout as it is or customize it using any of the features described for reports. You can also launch the Add Label wizard by clicking the New Label button of Step 2 of the Label Wizard.
Starting the Label Designer
If you do not want to use the wizard to create your labels, you can create a layout with the Label Designer. The Label Designer is like the Report Designer and uses the same menus and toolbars. The two designers are different in the default page and paper they use. The Report Designer uses a full page of standard paper. The Label Designer set its default page and paper to match standard label paper.
To create a label with the Label Designer
1. In the Project Manager, select Labels.

2. Choose New.
3. Choose New Label to display the New Label dialog box.
Standard label paper choices appear in the New Label dialog box
4. From the New Label dialog box, select a label layout and choose OK.
The Label Designer displays a page definition for the label layout you selected.
You can specify a data source and insert controls just as you would for a report. For more information, see Customizing Your Layout later in this chapter.
Modifying Your Layout
If you have a blank report or label, or the wizard or Quick Report generates a report that does not quite fit your needs, you can modify it in the Report Designer.
In the bands of the Report Designer, you can insert a variety of controls that hold the labels, fields, variables, and expressions that you want in the printed report. For example, in a phone list layout, you would place the field controls for the names and phone numbers as well as label controls and column headings at the top of the list. To enhance your report’s visual appeal and readability, you can add line, rectangle, and rounded rectangle controls. You can also include picture controls. Each of these controls are shown in the figure below.
Report layout file and the resulting report

You can open your report or label in the Report Designer to modify and customize the layout.
To modify a generated report or label
1. In the Project Manager, select a report or label.
2. Choose Modify.
You use the bands of the report to determine what each page, group, and the beginning and end of your report looks like. Report bands can be resized. In the report bands, you add report controls, then move, copy, resize, align, and adjust them to arrange the text and fields in your report.
Planning Data Placement
Once you have a report layout, you can modify the placement of the data on the report page. Using the bands in the Report Designer, you can control where data is printed on the page. Your report layout can have several bands. The figure below shows some of the bands a report can include and typical contents for each band. Notice that the bar below each band identifies the band.
Report bands in the Report Designer

A report can also have multiple group bands or bands for a column header and footer. You can add these bands using the procedures in Defining the Report Page and Grouping Data on Your Layout later in this chapter. You can use the table below to determine which bands you want to use.
Use this band To print Use this command
Title Once per report Choose Title/Summary from the Report menu.
Page header Once per page Available by default.
Column header Once per column Choose Page Setup from the File menu and set Column Number greater than 1.
Group header Once per group Choose Data Grouping from the Report menu.
Detail band Once per record Available by default.
Group footer Once per group Choose Data Grouping from the Report menu.
Column footer Once per column Choose Page Setup from the File menu and set Column Number greater than 1.

You can place any of the report controls in any of the bands. You can also add user-defined functions that are processed when the report is run. For more information about user-defined functions in reports and labels, see Chapter 12, Adding Queries and Reports, in the Programmer’s Guide.
Resizing Bands
You can modify the size and characteristics of each band.
To resize a band
� Drag the band’s bar to the appropriate height.
Use the ruler to the left as a guide. The ruler’s measurement is specific to the height of the band and does not include the page margins.
Tip You cannot make a band shorter than the height of the controls in the layout. Move the controls within the band first, and then reduce the height.
Adding Report Controls
You can insert the following types of report controls in your report and label layouts.
After placing the controls, you can change their format, size, color, position, and print options. You can also add a comment to each control for your reference only; it does not actually print in the report.
Page footer Once per page Available by default.
Summary Once per report Choose Title/Summary from the Report menu.
To display Choose this control
Table fields, variables, and other expressions Field
Literal text Label
Straight lines Line
Boxes and borders Rectangle
Circles, ovals, boxes with rounded corners, and borders
Rounded Rectangle
Bitmaps or general fields Picture/OLE Bound

Adding Controls with Quick Report
Quick Report is a timesaving feature that automatically creates a simple report layout for you. You select basic report components, then Visual FoxPro creates the layout using your selections.
Tip You can use Quick Report in existing report files if the Detail band is empty. If the Page Header band contains controls already, Quick Report preserves them.
To create a Quick Report
1. In the Project Manager, select Reports.
2. Choose New.
3. Choose New Report.
4. From the Report menu, choose Quick Report.
5. Select the table you want to use, and then choose OK.
Quick Report dialog box
6. Select the field layout, title, and alias options you want.
7. If you want to select fields for the report, choose Fields and complete the Field Picker dialog box.
Field Picker dialog box

8. Choose OK.
The options you choose are reflected in the report layout.
Quick Report results in the Report Designer
You can save, preview, and run the report as it is.
Note Quick Reports do not add general fields to the report layout.
Setting Report Data Sources
You can easily define the data sources that populate the controls in your report in the report’s data environment. You can add tables or views and order the data using an index from the table or view.
Using a view as a data source

The data environment manages your report’s data sources by:
� Opening the tables or views when the report is opened or run. � Populating the data set your report needs based on associated tables and
views. � Closing the tables when the report is closed or released.
To add a table or view to the data environment
1. From the View menu, choose Data Environment.
2. From the Data Environment menu, choose Add.
3. In the Add Table or View dialog box, select a database in the Database box.
4. In the Select area, choose Tables or Views.
Your selection determines which fields list appears in the Tables in database box.
Data Environment Designer

5. In the Tables in Database box, select a table or view.
6. Choose OK.
You can set the order your records appear in your report by setting an index for the data environment.
To set an index for the data environment
1. From the View menu, choose Data Environment.
2. From the shortcut menu, choose Properties.
3. In the Properties Window, choose Cursor1 in the Object box.
4. Choose the Data tab and select the Order property.
5. Enter an index name.
-or-
Select an index from the list of available indexes.
For more information about modifying the data environment, see Chapter 9, Creating Forms, in the Programmer’s Guide, and see the Data Environment Designer topic.
For more information about integrating queries and other data sources, see Chapter 12, Adding Queries and Reports. in the Programmer’s Guide.
Adding Field Controls
Your report or label can include field controls that represent values from table fields, variables, and calculations.
To add table fields from the data environment
1. Open the report’s data environment.
2. Select a table or view.
3. Drag fields onto the layout.
To add table fields from the toolbar
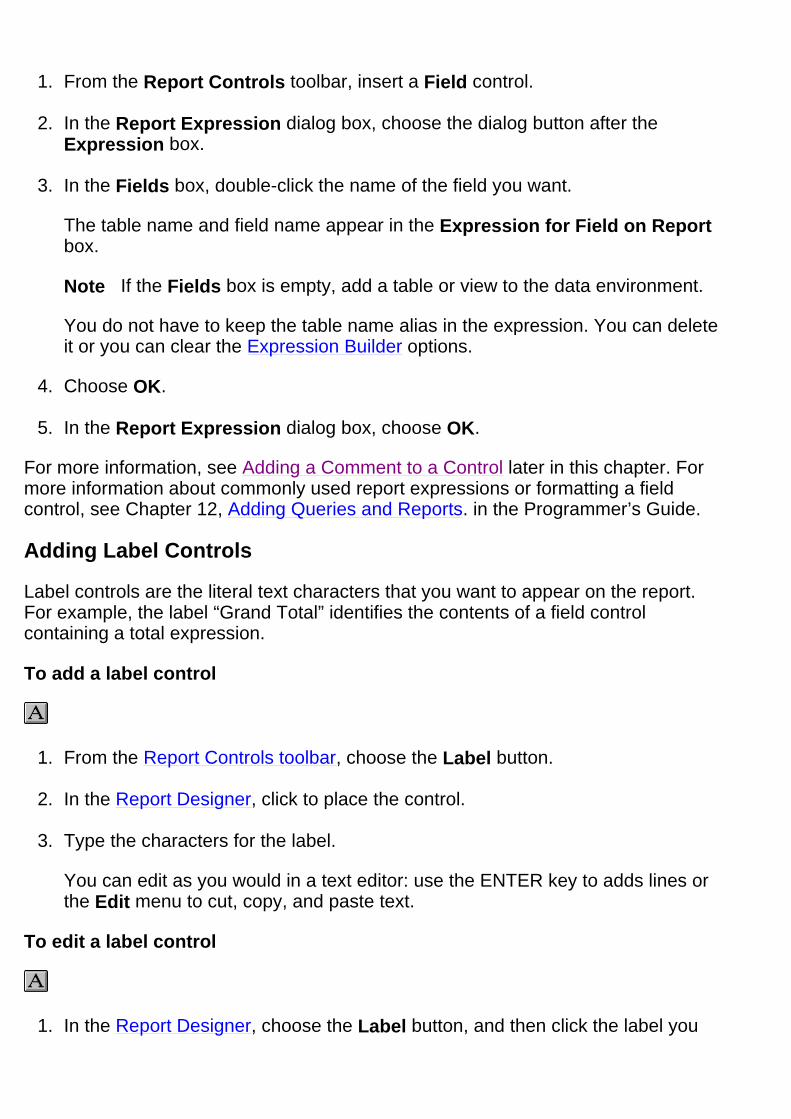
1. From the Report Controls toolbar, insert a Field control.
2. In the Report Expression dialog box, choose the dialog button after the Expression box.
3. In the Fields box, double-click the name of the field you want.
The table name and field name appear in the Expression for Field on Report box.
Note If the Fields box is empty, add a table or view to the data environment.
You do not have to keep the table name alias in the expression. You can delete it or you can clear the Expression Builder options.
4. Choose OK.
5. In the Report Expression dialog box, choose OK.
For more information, see Adding a Comment to a Control later in this chapter. For more information about commonly used report expressions or formatting a field control, see Chapter 12, Adding Queries and Reports. in the Programmer’s Guide.
Adding Label Controls
Label controls are the literal text characters that you want to appear on the report. For example, the label “Grand Total” identifies the contents of a field control containing a total expression.
To add a label control
1. From the Report Controls toolbar, choose the Label button.
2. In the Report Designer, click to place the control.
3. Type the characters for the label.
You can edit as you would in a text editor: use the ENTER key to adds lines or the Edit menu to cut, copy, and paste text.
To edit a label control
1. In the Report Designer, choose the Label button, and then click the label you

want to edit.
2. Type the changes.
After placing the text, you can change its font and colors. For more information, see the sections Changing Fonts and Changing Control Colors later in this chapter.
Adding a General Field
You can insert a General field containing OLE objects into your report.
To insert a General field
1. In the Report Designer, add a Picture/OLE Bound control.
2. In the Picture From area, select Field.
Report Picture dialog box
3. In the Field box, type a field name.
-or-
Choose the dialog button to select a field or variable.
4. Choose OK.
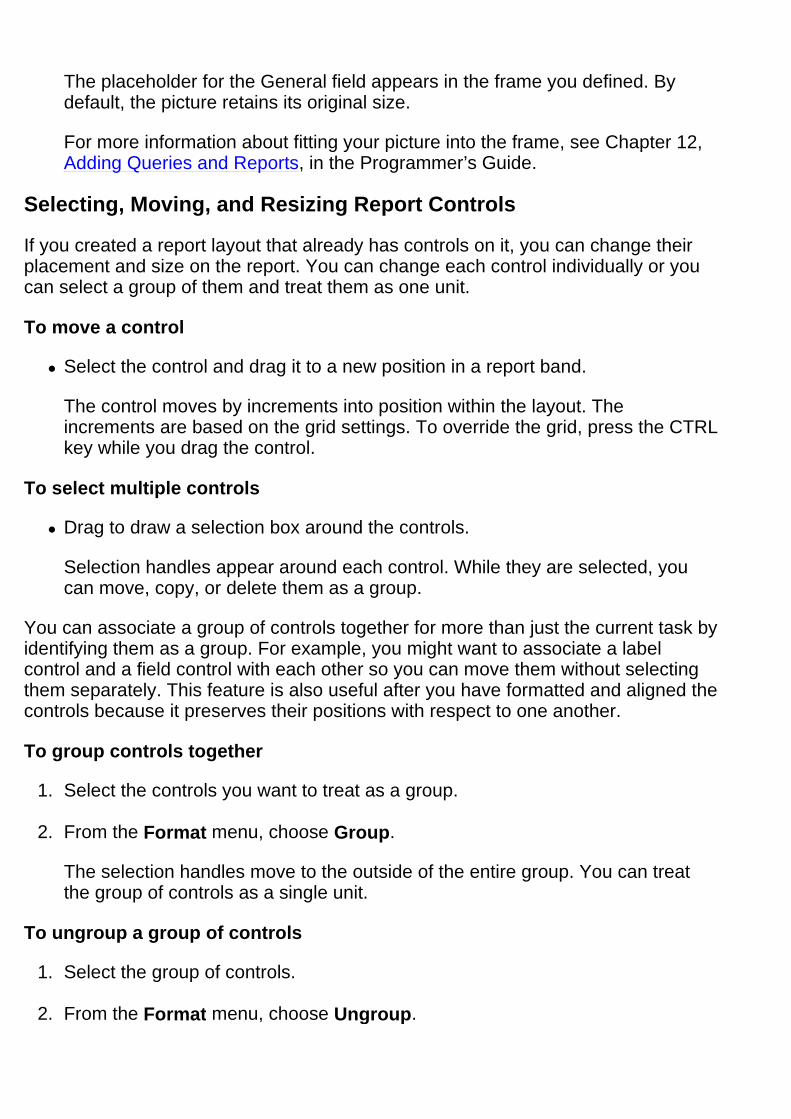
The placeholder for the General field appears in the frame you defined. By default, the picture retains its original size.
For more information about fitting your picture into the frame, see Chapter 12, Adding Queries and Reports, in the Programmer’s Guide.
Selecting, Moving, and Resizing Report Controls
If you created a report layout that already has controls on it, you can change their placement and size on the report. You can change each control individually or you can select a group of them and treat them as one unit.
To move a control
� Select the control and drag it to a new position in a report band.
The control moves by increments into position within the layout. The increments are based on the grid settings. To override the grid, press the CTRL key while you drag the control.
To select multiple controls
� Drag to draw a selection box around the controls.
Selection handles appear around each control. While they are selected, you can move, copy, or delete them as a group.
You can associate a group of controls together for more than just the current task by identifying them as a group. For example, you might want to associate a label control and a field control with each other so you can move them without selecting them separately. This feature is also useful after you have formatted and aligned the controls because it preserves their positions with respect to one another.
To group controls together
1. Select the controls you want to treat as a group.
2. From the Format menu, choose Group.
The selection handles move to the outside of the entire group. You can treat the group of controls as a single unit.
To ungroup a group of controls
1. Select the group of controls.
2. From the Format menu, choose Ungroup.
The selection handles appear around each of the controls that were in the group.
Once a control is on your layout, you can change its size individually or you can resize a group of controls to match each other. You can resize any report control except labels; their size is determined by the text, font, and point size.
To resize a control
� Select the control, then drag one of the selection handles to the desired size.
To match the size of multiple controls
1. Select the controls you want to have the same size.
2. From the Format menu, choose Size.
3. Choose the appropriate option to match the width, height, or size.
The controls resize to match the option you selected.
Copying and Deleting Report Controls
You can copy and delete any of the controls on the layout individually or as a group.
To copy controls
1. Select the controls.
2. From the Edit menu, choose Copy then Paste.
A copy of the controls appears below the original set.
3. Drag the copy into position on the layout.
To delete controls
1. Select the controls.
2. From the Edit menu, choose Cut or press the DELETE key.
Aligning Controls
You can align controls in relationship to each other or you can place them according to the grid provided by the Report Designer. You can align the controls with a particular side or with the center.
To align controls with each other

1. Select the controls you want to align.
2. From the Format menu, choose Align.
3. From the submenu, choose the appropriate alignment option. Visual FoxPro uses the control whose edge is the closest to the direction you selected to align as the anchor.
You can also use the Layout toolbar. Using the toolbar, you can align with the control farthest from the side you select by holding the CTRL key down while clicking the alignment button.
Left alignment tool
Align the controls with an edge that all of the selected controls have open and away from each other. Controls that are in a row and are selected to align with their right side, or left side, will pile on top of each other. Likewise, controls that are in a vertical line and selected to align with their top, bottom, will overlap. For more information about the toolbars, search for a specific toolbar name in Help.
To center controls within a band
1. Select the controls you want to align.
2. From the Format menu, choose Align.
3. From the submenu, choose Center Vertically or Center Horizontally.
The controls move to the vertical or horizontal center of their respective band.
Adjusting Control Placement
You can place a control in a specific position on the report page by using the status bar or the grid. By default, controls snap into position according to the grid. You can choose to turn off the snap feature and to show or hide the grid lines. Grid lines can help you in positioning controls on the layout.
To place a control at a specific position
1. From the View menu, choose Show Position.
2. Select the control, then move the control into place using the position information on the status bar.
To align controls manually
� From the Format menu, clear Snap to Grid.
To display grid lines
� From the View menu, choose Grid Lines.
A grid appears in the report bands.
To change the measurements of the grid
1. From the Format menu, choose Set Grid Scale.
2. In the Set Grid Scale dialog box, enter the number of pixels for the horizontal width and vertical height of each square in the grid.
Grouping Data on Your Layout
After designing the basic layout, you may decide that grouping the records by certain fields or other criteria would make the report easier to read. Grouping allows you to separate groups of records visually and display introductory and summary data for each group. The group break is based on a grouping expression. This expression is usually based on one or more table fields but it can be as complex as you like.
When you have groups, your report layout has Group Header and Footer bands, to which you can then add controls. Typically, Group Header bands contain the Field control for the field used for the group. You may add lines, rectangles, rounded rectangles, or any label you want to appear before the first record in a group. Group Footers often contain group totals and other summary information for the group.
You can also specify other options for the groups:

� Printing text in headers and footers to identify specific groups � Printing each group on a new page � Resetting page numbers when groups are printed on a new page
If the data source is a table, the records are probably not in the appropriate order for grouping. You can sort and order the data appropriately by setting an index on the table, using an ordered view in the data environment, or using a query as the data source to display the records in groups. The report layout does not actually sort and order your data but processes the records in the same order that they exist in the data source. Sorting and ordering must be done with a view, index, or other form of data manipulation outside the layout.
For example, if a group breaks at the Region field, each time the report processes a different region value, it produces a group. It does not recognize that a country at the beginning of the table should be sorted to group with the same country at the end of the table. For information on sorting and indexing, see Chapter 2, Creating Tables and Indexes, Chapter 4, Retrieving Data, or Chapter 5, Updating Data with Views, For more information about data sources, see Chapter 12, Adding Queries and Reports, in the Programmer’s Guide.
Adding a Single Group
A single group report has one level of data grouping based on an expression you enter. For example, you can base a group on the field Country to print all records for the same country together. The data source must be ordered by that field.
To add a group
1. From the Report menu, choose Data Grouping.
Data Grouping dialog box

2. In the first Group box, type the group expression.
-or-
Choose the dialog button to create an expression in the Expression Builder.
3. In the Group properties area, select the properties you want.
4. Choose OK.
After adding the expression, you can place any controls you want in the bands. Usually, the Field control used for grouping is moved from the Detail band to the Group Header band.
Adding Multiple Data Groupings
You can define up to 20 levels of data grouping within a report. Nested groups are helpful for organizing data and totaling expressions for different levels.
To choose a level for a grouping, estimate how often the value might change, then define the group that will change most often first. For example, your report might need a grouping by region and a grouping by city. The value of a city field changes more than the value of a region field; therefore, the city should be the first of the two groups and the region should be the second. In this multiple group report, the table must be sorted or indexed on a key expression such as Region+City.
To add multiple groups
1. From the Report menu, choose Data Grouping.

Data Grouping dialog box
2. In the first Group box, type the group expression.
-or-
Choose the dialog button to create an expression in the Expression Builder.
3. In the Group properties area, choose the properties you want.
4. Choose Insert and repeat steps 2 and 3 for each grouping expression.
5. Choose OK.
Groups are numbered in the Data Grouping list in the order they are created. In the Report Designer, the names of the group bands contain the number of the group and a truncated group expression. The group headers and footers with the lowest number appear closest to the Detail band.
Changing a Group Band
You can change the group’s expression and group printing options.
To modify a group band
1. From the Report menu, choose Data Grouping.
2. In the Data Grouping dialog box, select a group expression to change.
3. Enter the new expression.

-or-
Choose the dialog button to change the expression in the Expression Builder.
4. Change the grouping options as necessary.
Group properties in the Data Grouping dialog box
5. Choose OK.
6. In the Data Grouping dialog box, choose OK.
Deleting a Group Band
If you no longer need a particular group on your report layout, you can remove it.
To delete a group band
1. From the Report menu, choose Data Grouping.
2. Select the group you want to delete.
3. Choose Delete.
The group band is removed from the layout. If the group band contains controls, you are prompted to delete the controls as well.
Changing the Grouping Order
You can change the order of groups in a report after they have been defined. When groups are reordered, all controls defined in a group band are moved to the new location. Reordering groups does not change any previously defined controls. If boxes or lines have been positioned relative to the top or bottom of a group band, they will remain anchored in that band.
To change the order of the groups
1. From the Report menu, choose Data Grouping.
2. Select the mover button to the left of the group you want to move and drag it to

its new position.
Customizing Your Layout
Once you create a report layout, you can customize it. Layouts created with the report wizards and Quick Report are already customized based on the choices you made while creating the layout. For example, the Mailing Label Wizard customized the page setup by adding columns and setting the paper size. You can further customize the layout and change the current settings with the Report Designer.
Tools for customizing your report layout
You can change the data environment, page setup, or report controls. The data environment defines the source for the data to include in the report, the page setup defines the overall look of the report page and report bands, and the report controls define items that appear on the page.
Defining the Report Page
When you plan a report, you usually have an idea of what the page will look like. For example, you know the margins, the type of paper, and the layout you want. This

section describes setting the margins, the page orientation, and the height for the bands of the report page.
For information about adding columns to your report page, see Chapter 12, Adding Queries and Reports, in the Programmer’s Guide.
Setting the Margin, Paper Size, and Orientation
You can set the left margin, paper size, and orientation for your report, as well as, the column widths and space between columns for a multicolumn report. In this context, the word “columns” refers to the number of records that print across the page, not the number of fields from a single record. The Report Designer does not display these settings. It shows only the area within the margins that contains one record in a column on the page. Also, if your report has columns and you change the left margin, the width for the column will automatically change to accommodate the new margin.
If you change the paper size and orientation settings, make sure that the orientation is correct for the paper size you select. For example, if you select an envelope, the orientation should be set to Landscape.
To set the left margin
1. From the File menu, choose Page Setup.
Page Setup dialog box
2. To set the margin, enter a number for the margin in the Left margin box.

The page image changes to display the new margin.
3. To select a paper size, choose Print Setup.
4. In the Print Setup dialog box, select a paper size from the Size list.
5. To select paper orientation, choose an orientation in the Orientation area, and then choose OK.
6. In the Page Setup dialog box, choose OK.
Defining the Page Header and Footer
The controls placed in the Page Header or Page Footer bands appear once on each page of the report. A report that has many pages should include the report name, page number, date, and labels (if appropriate) in a header or footer.
Defining the Detail Band
Typically, the controls placed in the Detail band print once for each record. For information about how to change the print options for each individual control, see Chapter 12, Adding Queries and Reports, in the Programmer’s Guide.
Adding Title and Summary Bands
The Title band holds information that prints once at the beginning of the report and the Summary band holds information that prints once at the end of the report. Both the title and the summary can be on their own page. Fields with totaling expressions become grand totals when placed in the Summary band.
To add a title or summary band
1. From the Report menu, choose Title/Summary.
2. Select the bands you want.
3. If you want the band to appear on its own page, select New Page.
4. Choose OK.
The Report Designer shows the new bands.
Formatting Field Controls
After inserting a field control, you can change the control’s data type and print format. Data types can be Character, Numeric, or Date. Each of these data types has its own format options, including the option to create your own format template.

The format determines how the field is displayed when the report or label is printed.
Typically, you might convert all alphabetical output to uppercase, insert commas or decimal points in numeric output, display numeric output in currency format, or convert one date format to another.
Defining Field Control Formats
You can set a variety of format options for each data type.
To format a field control
1. Double-click the Field control.
2. In the Report Expression dialog box, choose the dialog button after the Format box.
3. In the Format dialog box, select the data type for the field: Character, Numeric, or Date.
The Editing area displays the formatting options available for that data type.
Note This data type applies only to the report control. It reflects the data type of the expression and does not change the data type of the field in the table.
4. Select the justification and format options you want.
The Format dialog box displays different options depending on the data type you choose. You can also create a format template by entering characters in the Format dialog box. For more information, search for “Format Template.”
Justifying Text in a Field
You can justify field contents within the control in two ways. This setting does not change the position of the control on the report, only the contents within the space of the control.
To justify text in a field control
1. Select the controls you want to change.
2. From the Format menu, choose Text Alignment.
3. From the submenu, choose the appropriate command.
To justify text in a field
1. Double-click the Field control.

2. In the Report Expression dialog box, choose the dialog button after the Format
box.
Format dialog box for a Numeric expression
3. In the Format dialog box, select the data type for the field: Character, Numeric, or Date.
4. Select the justification and format options you want.
Changing Fonts
You can change the font and size of text for each field or label control or you can change the default font for the report.
To change fonts and size in a report
1. Select the control.
2. From the Format menu, select Font.
The Font dialog box appears.
3. Select the appropriate font and point size, and then choose OK.
To change the default font
1. From the Report menu, choose Default Font.
2. In the Font dialog box, select the appropriate font and point size you want as the default, and then choose OK.
Only the controls inserted after you changed the default font will reflect the new font settings.
Adding Lines, Rectangles, and Circles
Lines, rectangles, and circles add visual interest to the layout of your report. You can use them to separate or emphasize parts of your report.
Drawing Lines
You can add vertical and horizontal lines to your report layout with the Line control. Often, you might want lines between the details contained in the body of the report and the information in the header and the footer.
To draw a line
1. From the Report Controls toolbar, choose the Line button.
2. In the Report Designer, drag to size the line.
After drawing the line, you can move or resize it, or change its thickness and color. For more information, see the section Changing Line Thickness or Style later in this chapter.
Drawing Rectangles
You can draw rectangles on your layout to visually organize the information that prints on the page. You can use them as borders around report controls, report bands, or the entire page.
To draw a rectangle
1. From the Report Controls toolbar, choose the Rectangle button.
2. In the Report Designer, drag to size the rectangle.
Drawing Rounded Rectangles and Circles
You can draw circles or rectangles with a variety of rounded corners.
To draw a rectangle or circle

1. From the Report Controls toolbar, choose the Rounded Rectangle button.
2. In the Report Designer, drag to size the control.
3. Double-click the control.
Round Rectangle dialog box
4. In the Style area, select the corner style you want.
5. If appropriate, set position options.
6. Choose OK.
Changing Line Thickness or Style
You can change the thickness of lines used for vertical and horizontal lines, rectangles, and rounded rectangles from a hairline to 6 points wide. You can also change the style of the line from dotted to a combination of dots and dashes.
To change line size or style
1. Select the line, rectangle, or rounded rectangle controls you want to change.
2. From the Format menu, choose Pen.
3. From the submenu, select the appropriate size or style.

Adding a Picture
You can insert a picture as part of the report. For example, a company logo can appear in the page header of an invoice. Pictures from a file are static; they do not change with each record or group of records. If you want to change the display depending on the record, insert a General field instead.
To add a picture
1. From the Report Controls toolbar, choose the Picture/OLE Bound Control button.
2. In the Report Designer, drag to size the picture.
Report Picture dialog box
3. In the Picture from area, select File.
4. In the File box, type a file location.
-or-
Choose the dialog button to select a graphic file.

5. If appropriate, set the size, position, or print options.
6. Choose OK.
Changing Control Colors
You can change the color of a field, label, line, or rectangle.
To change colors
1. Select the controls to change.
2. In the Color Palette toolbar, choose Foreground Color or Background Color.
3. Select the color you want.
Adding a Comment to a Control
While creating or changing a control, you might want to include a description. The dialog box for each control offers a comment box. These comments are saved with the layout file but do not appear in the printed report or label.
To add a comment to a control
1. Double-click the control.
2. In the control’s dialog box, enter your comment in the Comment box.
3. Choose OK.
Previewing and Printing Your Report or Label
After starting your report or label layout, you can preview the results of your work or print a report or label. You can preview at any time while you are customizing it.
For more information about setting a control’s print options or setting page breaks, see Chapter 12, Adding Queries and Reports, in the Programmer’s Guide.
Previewing Your Results
By previewing a report, you can see how it looks on the page without printing it. For example, you can check the alignment and spacing of the columns of data, or see if the report is returning the data you want. You have two choices: view an entire page

or zoom in on a portion of a page.
The Preview window has its own toolbar with buttons that move you from page to page in the report.
Caution If you get the prompt, “Do you want to save changes to your file?”, you have selected to close not just the Preview window, but also the layout file. You can select Cancel to return to Preview mode or Save to save your changes and close the file. If you select No, any changes you made to the layout will not be saved.
To preview your layout
1. From the View menu, choose Preview.
Report Preview
2. In the Print Preview toolbar, choose Previous Page or Next Page to switch pages.
3. To change the size of the report’s image, choose Zoom.
4. To print the report, choose Print.
5. To return to design mode, choose Close Preview.

Printing Reports
The report or label layout file you create using the Report Designer is a shell that formats the data into a pleasing display for printing. It processes the records in the order they appear in the data source. If you use data directly from a table, the data is not sorted and ordered for any groups that may be in the layout. Before printing a report file, you should verify that the data source will sort and order the data appropriately. If the table is part of a database, you create a view and add it to the report’s data environment. The view sorts and orders the data for you. If the data source is a free table, you can create and run a query that uses the report as its destination. For more information about views, see Chapter 5, Updating Data with Views. For more information about queries, see Chapter 4, Retrieving Data. For more information about controlling the records that print in your report, see Chapter 12, Adding Queries and Reports, in the Programmer’s Guide. If you do not need to sort or order the data, you can print the report from the Report Designer.
To print a report
1. From the File menu, choose Print.
2. Choose OK.
Note If the data environment is not set, the Open dialog box appears with a list of tables from which you can select.
Visual FoxPro sends the report to the printer.