Embed Size (px)
Citation preview
Chapter 6: Survival of Incident and Prevalent Patients
David Ansell, Paul Roderick, Alex Hodsman, Retha Steenkamp and Charlie Tomson
Summary
. The age adjusted survival of incident patientsstarting RRT continued to improve. Therewas an improvement for patients starting onHD and PD. The one year after 90 day survi-val was 87.3% (95% CI 86.7–88.1).
. There has been a survival improvement forboth the under and over 65 year age groups.The last 8 years have shown an annual 3%relative improvement in survival in both theunder and over 65 year age group.
. The ‘vintage effect’ of increasing hazard ofdeath with length of time on RRT, promi-nent in data from the US, was not seen inthe UK within the 9 year incident cohortfollow up period.
. From the date of first RRT, the 1 year survi-val of all patients (unadjusted for age) was81%. From the 90th day of RRT (to allowcomparison with other countries’ 1 yearsurvival), the 1 year survival was 86%. Theage adjusted (60 years) survival for the 1year after 90 day period was 85%. There wasa high death rate in the first 90 days on RRT(6% of all patients starting RRT), a periodnot included in reports by many registriesand other studies.
. The 5 year survival rates (including deathswithin the first 90 days) were 87%, 78%,67%, 48%, 29% and 18% respectively forpatients aged 18–34, 35–44, 45–54, 55–64,65–74 and >75 years (last years publisheddata was incorrect).
. It was possible to compare co-morbidityadjusted survival (in addition to age andprimary renal diagnosis) for nine centres.
. Eight centres had a figure for the 1 year after90 day survival which was outside 2 standarddeviations from the mean for the UK. In 5
centres this was better survival and in 3centres poorer survival than expected. Poorreporting by renal centres of patient co-morbidity makes interpretation of theseapparent differences in patient survivalbetween centres difficult and a relationship toclinical performance cannot yet be inferred.
. Analysis of prevalent dialysis patient survivalshowed 6 centres outside 2 standard devia-tions, (4 below and 2 above).
Introduction
The analyses presented in this chapter examinesurvival from the start of renal replacementtherapy (RRT). They encompass the outcomesfrom the total incident UK dialysis populationreported to the Registry, including the 21%who started on peritoneal dialysis and the 5%who received a pre-emptive transplant and werenot censored for transplantation. The resultstherefore show a true reflection of the wholeUK RRT population. The incident survivalfigures reported here are better than thosereported for the UK by the iDOPPS study(which only included a haemodialysis cohort).Additionally, 1st year UK survival dataincluded patients that had died within the first90 days of starting RRT, a period excludedfrom most other countries’ registry data.
For the first time, the dataset this yearincluded patients from all the UK countries(Northern Ireland data were not available inprevious Reports). Patients returning to dialysisafter a failed transplant were not included inthe incident cohort as their survival was calcu-lated from the date of their first RRT.
The incident survival figures quoted in thischapter are from the first day of renal replace-ment therapy. In many instances survival fromday 90 onwards is also presented, as this allowscomparison with many other registries, including
93

the US, which mainly record data from day 90onwards. This distinction is important, as thereis a high death rate in the first 90 days whichwould distort international comparisons. Inmany other countries, patients are not reportedto their national registry or considered to haveestablished renal failure until they have com-pleted 90 days on RRT, whereas in the UK allpatients starting RRT are included from the dateof the first RRT treatment unless they recoverrenal function within 90 days. The UK datatherefore include some patients who developacute irreversible renal failure in the context ofan acute illness for instance and were recordedby the clinician as being irreversible establishedrenal failure.
To allow comparisons between centres withdiffering age distributions, survival analyseswere statistically adjusted for age and reportedas survival adjusted to age 60. This age waschosen because it was approximately the aver-age age of patients starting RRT 10 years agoat the start of the Registry’s data collection.The average age of patients commencing RRTin the UK in 2005 was approximately 65 years,but the Registry has maintained age adjustmentto 60 years for comparability with previousyears’ analyses.
Survival rates in different centres contributingto the UK Renal Registry are reported here. Inthe 2006 Report, with the agreement of all UKclinical directors, centre anonymity wasremoved for the first time. Similarly to lastyear, it is stressed that these are raw data thatrequire very cautious interpretation. TheRegistry can adjust for the effects of thedifferent age distributions of patients in differ-ent centres, but lacks sufficient data from manyparticipating centres to enable adjustment forco-morbidity and ethnic origin, which havebeen demonstrated to have a major impact onoutcome. With this lack of information on casemix, it was difficult to interpret any apparentdifference in survival between centres. Usingdata only from those centres with greater than85% complete data returns on co-morbidity, ananalysis has been undertaken to highlight theimpact of changes in estimates of survival ratesby centre after adjusting for age, primary renaldiagnosis and co-morbidity. It is hoped this willencourage all centres to allocate the resourcesto return the co-morbidity data.
Despite the uncertainty about any apparentdifferences in outcome for centres which appearto be outliers, the Registry will follow theclinical governance procedures as set out inChapter 21.
The survival of prevalent patients, in previousReports included within the prevalent chapter,has now been incorporated within this chapter.
Methods
Methodology for incident patientsurvival
The take-on population in a year includedpatients who recover from ERF after 90 daysfrom the start of RRT, but excluded those thatrecover within 90 days. Patients newly trans-ferred into a centre who were already on RRTwere excluded from the take-on population forthat centre. Patients re-starting dialysis after afailed transplant were also excluded (unless theystarted RRT in that current year).
Patients who started treatment at a centreand then transferred out after starting RRTtreatment were counted at the original centre.
For patients who recovered renal function for>90 days and then went back into ERF, thelength of time on RRT was calculated from theday on which the patient re-started RRT. Ifrecovery was for less than 90 days, the start ofrenal replacement therapy was calculated fromthe date of the first episode and the recoveryperiod ignored.
Patients who transferred out of their initialtreatment centre to one of the five UK centresnot returning individual patient data to theRegistry, were censored on the day they trans-ferred out.
The one year incident survival for patients in2005 were for those who had all been followedfor 1 full year through 2006. The 2006 incidentpatients were excluded from this year’s incidentsurvival analysis as they had not been followedfor a sufficient length of time.
For analysis of 1 year after 90 day survival,patients who started RRT in October through
The UK Renal Registry The Tenth Annual Report
94

December 2005, were not included in thecohort, as 2007 data on these patients were notyet available. The analyses prior to the 2006Registry Report have used the previous year’spatient cohort to calculate the 1 year after 90day survival (eg this year the alternative wouldhave been to use the 2004 rather than 2005cohort) starting in October. A comparison ofthese two methods has shown no differencebetween them for any but the smallest centres(who will have wide 95% confidence intervals),so for simplicity of understanding the cohortand using a common cohort across analyses,the Registry will now use the previous year’sdata (2005 cohort).
Adjustment of 1 year after 90 day survivalfor the effect of co-morbidity, was undertakenusing a combined incident cohort from 2001 to2005. Nine centres had returned >85% of co-morbidity data for patients. Adjustment wasfirst performed to a mean age of 60 years, thento the average primary diagnosis mix for all thenine centres. The individual centre data werethen further adjusted for average co-morbiditymix present at these centres.
Methodology for prevalent patientsurvival
All patients who had been established on RRTfor at least 90 days on 1 January 2006 wereincluded in this analysis. The patients in thetransplant cohort had all been established witha transplant for at least 6 months.
As discussed in previous reports, comparisonof survival of prevalent dialysis patientsbetween centres is complex. Survival of preva-lent dialysis patients can be studied with orwithout censoring at transplant. When a patientis censored at transplantation, the patient isconsidered as alive up to the point of transplan-tation, but the patient’s status post-transplant isnot considered. Therefore a death followingtransplantation is not taken into account incalculating the survival figure. This censoringcould cause apparent differences in survivalbetween those renal centres with a high trans-plant rate and those with a low transplant rate,especially in younger patients where the trans-plant rate is highest. The differences are likelyto be small due to the low post-transplantation
mortality rate and the relatively small pro-portion of patients being transplanted in agiven year compared to the whole dialysispopulation (usually less than 7% of the totaldialysis population). To estimate the potentialdifferences, the results for individual renal cen-tres were compared with and without censoringat transplant. The results are shown in Table6.13. Overall there is a 0.5% increase in survivalusing the censored data. With such smalldifferences only the censored results havebeen quoted throughout the prevalent ana-lyses.
Another potential source of error in compar-ing survival of dialysis patients in differentrenal centres, especially younger patients, is thediffering transplant rates between centres.Those with a high transplant rate have removedmore of the fitter patients from dialysis andare left with a higher risk population ondialysis.
Centre exclusion from survivalanalysis
The survival analysis for the London Westcentre (2005 Hammersmith & Charing Crossdata) revealed that this centre was an outlierwith an apparent survival of better than 3 s.dsabove average. Due to this finding, these datawere investigated further. Investigation showedthat there were no deaths reported (to theUKRR) from this centre for the first 5 monthsof the year.
This finding is statistically unlikely andsuggests either that the centre were not report-ing the deaths from this period or were notreporting patients that had started RRT earlierand then died within this timeframe. As theRegistry does not solely rely on the centre toreport the date of death but also uses the NHStracing service to verify death (linked to theOffice for National Statistics Deaths Register),under-reporting of deaths by the centre, inpatients already registered with the UKRR,could not be the cause. There must thereforebe an incomplete cohort of patients being sentby this centre to the UKRR. This centre hastherefore been excluded from the incident andprevalent survival analysis.
Chapter 6 Survival of Incident and Prevalent Patients
95

Incident (new RRT) patientsurvival results
The 2005 cohort included 6,085 patients whowere starting RRT (Table 6.1).
Comparison with audit standards
The 2002 UK Renal Standards document2
(www.renal.org) concluded that:
It is hard to set survival standards at presentbecause these should be age, gender and co-morbidity adjusted and this is not yet possiblefrom Registry data. The last Standardsdocument (1998) recommended at least 90%one year survival for patients aged 18–55years with standard primary renal disease.This may have been too low as the rate inparticipating centres in the Registry was97%, though numbers were small.
The Renal Standards document defines standardprimary renal disease using the EDTA-ERAdiagnosis codes (including only codes 0–49), thisexcludes patients with renal disease due todiabetes and other systemic diseases. It is morewidespread practice to simply exclude patientswith diabetes, so these analyses were alsoincluded in this report to allow comparison withreports from other registries. The results areshown in Table 6.2 and are similar to theprevious year.
Between country
The Northern Ireland figures have not beenincluded in this table as data are only availablefrom 2005 onwards. Two years incident datahave been combined to increase the size of thepatient cohort, so that any differences betweenthe three other UK countries are more likely tobe identified (Table 6.3). These data have notbeen adjusted for differences in primary renaldiagnosis, ethnicity or co-morbidity.
Modality
The age-adjusted one year survival estimates onHD and PD were 85.8% and 93.1% respec-tively with the improvement in HD survivalfrom 2002 (83.9%) being maintained. Thereappears to be better survival on PD comparedwith HD (Table 6.4) after age adjustment, simi-lar to data from the USRDS and Australasian(ANZDATA) registries. However, a straightfor-ward comparison of the modalities in this wayis not valid, as there are significant factors in
Table 6.1: Summary of the exclusions from the
2005 incident cohort
Reasons for exclusion
No of
Patients
Recovered and started again in 2005 (2ndstart only included)
�1
Recovered in 2004 with 2nd start in 2005and had a recovery period <90 days(so remain in the 2004 cohort)
�5
Recovered in 2005 with 2nd start in 2006and had a recovery period 590 days (thesewill be included in the 2006 analysis)
�7
Patients with date of death before RRT startdate
�3
Patients without a treatment modality atstart
�18
Total incident survival cohort 6,051
Number of deaths in the first year 1,139
Table 6.2: One-year patient survival, patients aged
18–54, 2005 cohort
First
treatment
Standard
primary renal
disease
All primary
renal diseases
except diabetes
All % 96.1 93.8
95% CI 94.7–97.2 92.4–94.9
HD % 94.9 91.5
95% CI 92.8–96.3 89.5–93.1
PD % 98.7 98.8
95% CI 96.6–99.5 97.2–99.5
Table 6.3: Incident patient percentage survival across the UK, combined 2 year cohort (2004–2005), adjusted
to age 60
England Wales Scotland UK
% 90 day
95% CI
94.4
93.9–94.9
93.5
92.1–95.0
94.3
93.1–95.4
94.3
93.8–94.8
% 1 year after 90 days
95% CI
87.9
87.1–88.6
86.1
83.9–88.6
83.9
81.9–86.0
87.3
86.65–88.08
The UK Renal Registry The Tenth Annual Report
96

selection for the modalities and the patients inthe two groups are not comparable.
Age
Tables 6.5 to 6.10 show survival of all patientsand those above and below 65 years of age, forup to eight years after initiation of renalreplacement therapy. The UK is showing animprovement in both short and longer term
survival on dialysis for patients aged bothunder and over 65 years. As to be expectedthere was also a steep age related decline in sur-vival over all time periods (see also Figures 6.1and 6.2).
If the survival data in Tables 6.8 to 6.10 arecalculated from day 90 (1 year after day 90
Table 6.4: One-year after day 90 survival by first established treatment modality (adjusted to age 60)
Year HD PD
2005 Adjusted 1 year after 90 days %
95% CI
85.8
84.6–87.1
93.1
91.6–94.5
2004 Adjusted 1 year after 90 days %
95% CI
85.5
84.3–86.8
90.3
88.7–92.0
2003 Adjusted 1 year after 90 days %
95% CI
85.7
84.3–87.2
92.5
90.9–94.1
2002 Adjusted 1 year after 90 days %
95% CI
83.9
82.4–85.5
90.2
88.46–92.1
Table 6.5: Unadjusted 90 day survival of new patients, 2005 cohort, by age
Age KM�survival (%) KM 95% CI N
18–64 96.2 95.5–96.9 2,957
565 88.2 87.0–89.3 3,112
All ages 92.1 91.4–92.8 6,069
�KM¼Kaplan–Meier.
Table 6.6: Unadjusted 1 year after day 90 survival
of new patients, 2005 cohort, by age
Age KM survival (%) KM 95% CI N
18–64 91.5 90.4–92.5 2,837
565 78.0 76.4–79.5 2,737
All ages 84.9 83.9–85.8 5,574
Table 6.7: Increase in proportional hazard of death
for each 10 year increase in age, at 90 days and for
1 year thereafter
Interval
Hazard of death
for 10 year
age increase 95% CI
First 90 days 1.69 1.56–1.83
1 year after first 90 days 1.55 1.47–1.64
Table 6.8: Unadjusted KM survival of new patients 1997–2005 cohort for patients aged 18–64
Cohort
1
year
2
year
3
year
4
year
5
year
6
year
7
year
8
year
9
year
95% CI for
latest yr N
2005 89.5 88.4–90.6 2,957
2004 89.8 83.8 82.3–85.1 2,650
2003 89.4 82.5 77.1 75.3–78.7 2,364
2002 88.4 81.5 75.9 70.7 68.6–72.6 2,075
2001 87.4 79.9 74.3 68.8 64.1 61.8–66.3 1,844
2000 89.5 81.9 75.2 70.4 65.2 60.2 57.7–62.6 1,585
1999 87.7 81.5 74.1 68.1 63.2 59.2 55.1 52.4–57.8 1,366
1998 86.9 79.6 72.9 67.7 61.6 56.8 52.8 50.4 47.5–53.1 1,278
1997 86.0 78.5 71.3 65.8 60.7 56.1 52.5 50.3 48.5 44.9–52.0 789
Chapter 6 Survival of Incident and Prevalent Patients
97

survival, 2 year after day 90 survival, etc) thesurvival in all cases increased by an additional3–4% across both age bands. These are theresults most comparable to the figures quotedby the USRDS from the USA and most other
national registries3;4 (see Chapter 12 on inter-national comparisons).
There was a nonlinear increase in death rateper 1,000 patient years with age, shown in
Table 6.9: Unadjusted KM survival of new patients 1997–2005 cohort for patients aged 565
Cohort
1
year
2
year
3
year
4
year
5
year
6
year
7
year
8
year
9
year
95% CI for
latest yr N
2005 72.7 71.1–74.2 3,112
2004 68.8 54.8 52.9–56.7 2,733
2003 69.2 53.9 42.6 40.6–44.6 2,378
2002 66.0 51.5 41.1 33.0 31.0–35.0 2,180
2001 67.2 52.1 39.5 30.6 23.2 21.3–25.2 1,861
2000 66.8 53.3 40.2 29.3 22.9 18.2 16.3–20.2 1,508
1999 66.3 50.6 38.4 28.9 21.5 15.4 11.1 9.4–12.9 1,266
1998 63.8 46.7 36.4 27.5 20.6 14.8 10.8 7.4 5.9–9.0 1,140
1997 64.0 46.0 33.2 23.9 16.5 11.6 7.9 6.3 4.6 3.1–6.5 582
Table 6.10: Unadjusted survival of new patients 1997–2005 cohort for patients of all ages
Cohort
1
year
2
year
3
year
4
year
5
year
6
year
7
year
8
year
9
year
95% CI for
latest yr N
2005 80.9 79.9–81.9 6,069
2004 79.1 69.0 67.8–70.3 5,383
2003 79.2 68.1 59.8 58.3–61.2 4,742
2002 76.9 66.1 58.0 51.3 49.8–52.8 4,255
2001 77.3 66.0 56.8 49.6 43.5 41.9–45.1 3,705
2000 78.4 68.0 58.2 50.4 44.6 39.8 38.1–41.5 3,093
1999 77.4 66.6 56.9 49.2 43.1 38.1 33.9 32.1–35.8 2,632
1998 76.0 64.1 55.7 48.8 42.3 37.1 33.0 30.1 28.3–32.0 2,418
1997 76.7 64.8 55.2 48.1 42.1 37.3 33.7 31.7 29.9 27.5–32.4 1,371
Pe
rce
nta
ge
su
rviv
al
100
95
90
85
80
75
70
65
60
55
50
45
4035–44 45–54 55–64 65–74 75–84 85+18–34 35–44 45–54 55–64 65–74 75–84 85+18–34 35–44 45–54 55–64 65–74 75–84 85+18–34
Age bands
90 day 1 yr after day 90 0–1 yr
Figure 6.1: Unadjusted survival of all incident patients 2005 by age band
The UK Renal Registry The Tenth Annual Report
98

Figure 6.2 for the period one year after 90 days.There were no differences between UK countries.
The effect of censoring age relatedsurvival at the time of transplantation
The KM long term survival curves published inall previous years reports, were censored at thetime of transplantation. This was not madeclear in the analysis and although not incorrect,will make the longer term outcomes of youngerpatients (who are more likely to have under-gone transplantation) appear worse. This isbecause those younger patients remaining on
dialysis (who may have more co-morbidity) willhave only been included in the survival analysis.To demonstrate this difference in outcomebetween these two methods, Figure 6.3a isshown below without censoring for transplanta-tion and Figure 6.3b with censoring. In futurereports it is planned to only reproduce thesingle figure of the longer term age relatedsurvival which is uncensored at the time oftransplantation.
In addition, it should be noted that in theprinted version and CD copy of the 2006 Report,Figure 12.2 showing the 8 year KM survival of
100
150
0
50
200
250
300
350
400
450
500
550
600
18–34 35–44 45–54 55–64 65–74 75–84 85+
Age group
Death
rate
England
N Ireland
Scotland
Wales
Figure 6.2: One year after 90 days death rate per 1,000 patients years by nation and age group for incident
patients, 2002–2005 cohort
0.0 0.5 1.0 1.5 2.0 2.5 3.0 3.5 4.0 4.5 5.0 5.5 6.0 6.5 7.0 7.5 8.0 8.5 9.0 9.5
Period (years)
Perc
enta
ge s
urv
ival
18–34
35–44
45–54
55–64
65–74
75+
100
90
80
70
60
50
40
30
20
10
0
Figure 6.3a: Kaplan–Meier 9-year survival of incident patients 1997–2005 cohort (from day 0), without
censoring at transplantation
Chapter 6 Survival of Incident and Prevalent Patients
99
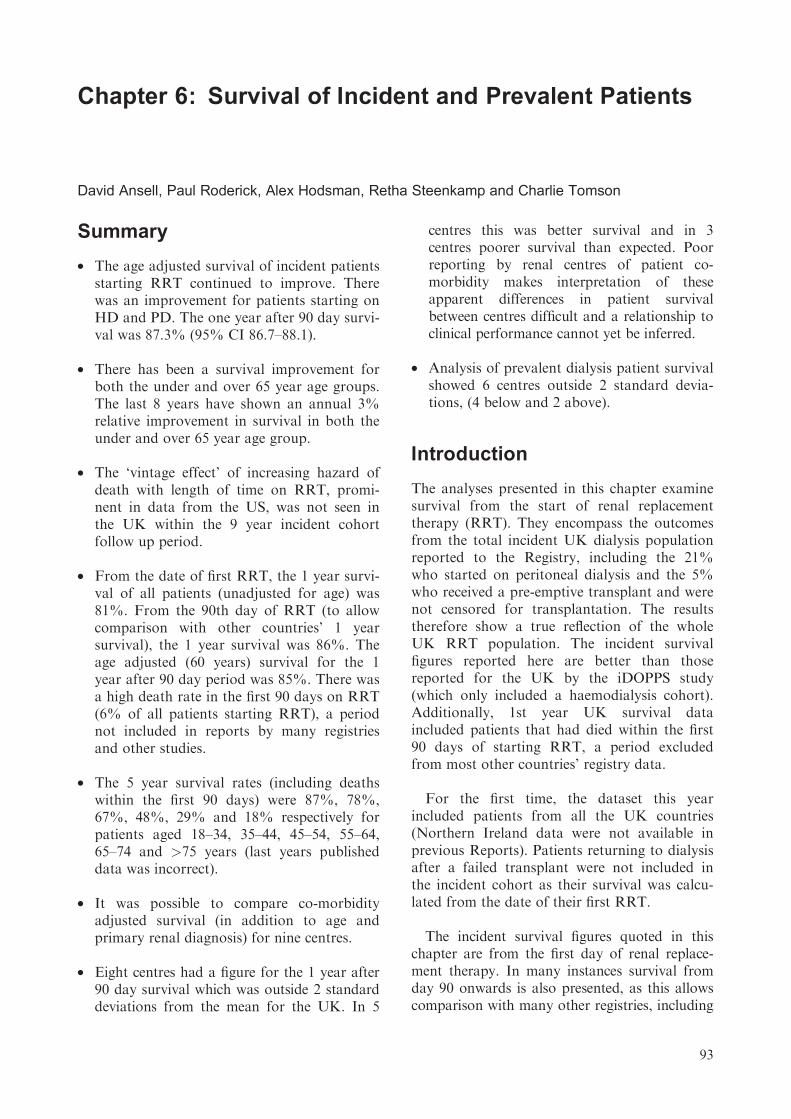
incident patients was incorrect, with the incorrectfigure showing very much poorer survival than isthe case. An error has been found in the SAScode previously used to calculate these data andthis has now been corrected.
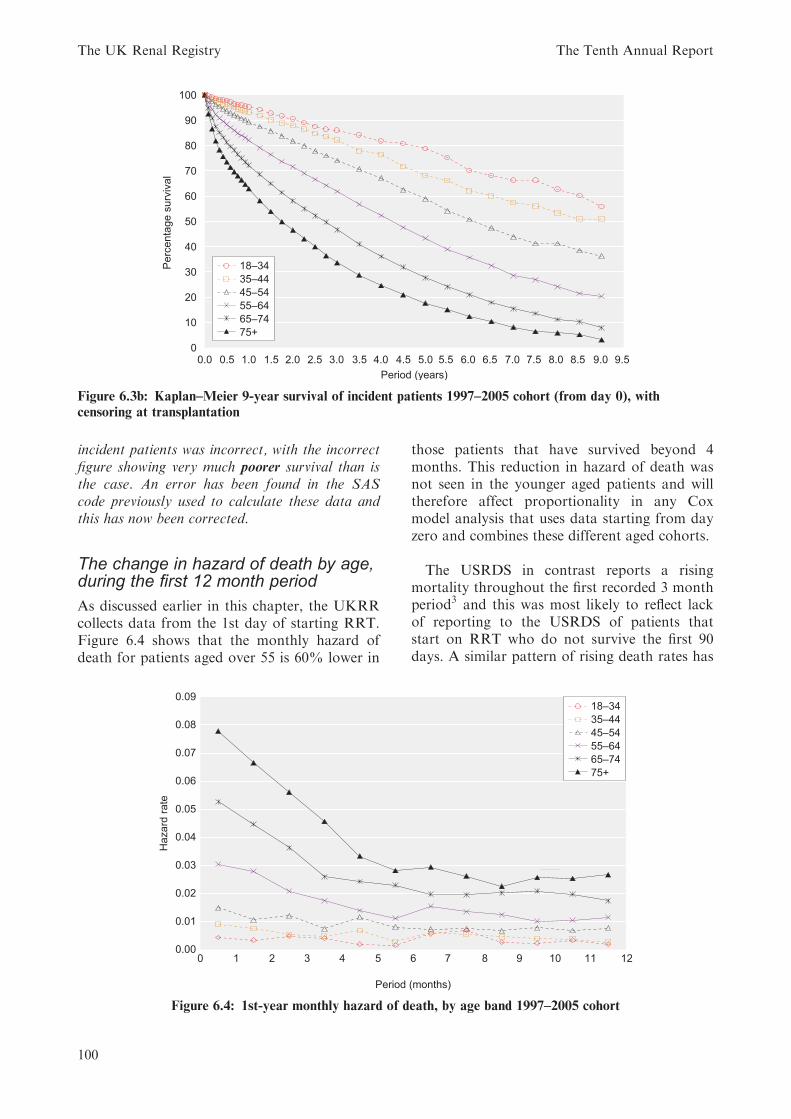
The change in hazard of death by age,during the first 12 month period
As discussed earlier in this chapter, the UKRRcollects data from the 1st day of starting RRT.Figure 6.4 shows that the monthly hazard ofdeath for patients aged over 55 is 60% lower in
those patients that have survived beyond 4months. This reduction in hazard of death wasnot seen in the younger aged patients and willtherefore affect proportionality in any Coxmodel analysis that uses data starting from dayzero and combines these different aged cohorts.
The USRDS in contrast reports a risingmortality throughout the first recorded 3 monthperiod3 and this was most likely to reflect lackof reporting to the USRDS of patients thatstart on RRT who do not survive the first 90days. A similar pattern of rising death rates has
0.0 0.5 1.0 1.5 2.0 2.5 3.0 3.5 4.0 4.5 5.0 5.5 6.0 6.5 7.0 7.5 8.0 8.5 9.0 9.5
Period (years)
Perc
enta
ge s
urv
ival
100
90
80
70
60
50
40
30
20
10
0
18–34
35–44
45–54
55–64
65–74
75+
Figure 6.3b: Kaplan–Meier 9-year survival of incident patients 1997–2005 cohort (from day 0), with
censoring at transplantation
0.00
0.01
0.02
0.03
0.04
0.05
0.06
0.07
0.08
0.09
0 1 2 3 4 5 6 7 8 9 10 11 12
Period (months)
Hazard
rate
18–34
35–44
45–54
55–64
65–74
75+
Figure 6.4: 1st-year monthly hazard of death, by age band 1997–2005 cohort
The UK Renal Registry The Tenth Annual Report
100

been shown in analysis of data from theGerman Renal Registry, with under-reportingof patients with early deaths highlighted as thecause (Caskey F, verbal communication).
Changes in survival from 1997–2005
The KM survival tables have been included asin previous years. The one year death rate per1,000 patient years has also been included thisyear (Figure 6.5). These death rates are notdirectly comparable with those produced by theUSRDS Registry, as the UK data included thefirst 90 day period where the death rates will bemuch greater.
The unadjusted KM survival data (Tables 6.8and 6.9, Figures 6.6 and 6.7) and annual deathrates appear to be showing a large improvementin 1 to 7 year survival across the time periods forboth the under and over 65s. This has happenedeven though the average age of patients startingRRT has risen by 5 years during this period.The patients aged under 65 years have seen the1st year survival improve from 86% to 89.5%.As survival rates were already high in thesepatients, the overall survival improvement wasonly 4%. The reduction in risk of death(¼ relative survival improvement) in Figure 6.5shows that this equates to a 26% relativeimprovement over this 8 year period (¼ 3%annual improvement in the reduction in risk ofdeath). Similar reduction in risk of death wasseen in the 2 year and 3 year cohorts.
Similarly for patients aged over 65 yearsthere has been a 14% improvement in 1st year
survival, which translates into a similar 25%relative reduction in risk of death over this 8year period.
A confounding factor may be the fact thatadditional renal centres have joined the Registryover these intervening years. To attribute thisyear on year improvement to this fact, then everyrenal centre joining in each subsequent year musthave better patient survival than all renal centresin each of the previous years. This would bestatistically very improbable. Additionally, aseparate analysis of survival in the earlier vslatter centres has shown this not to be the reason.
As these are observational data it is difficult toattribute this reduction in risk of death to anyspecific improvement in care. During this period
100
150
0
50
200
250
300
350
400
450
500
550
1997 1998 1999 2000 2001 2002 2003 2004 2005
Year
De
ath
ra
te
18–64
All ages
65+
Figure 6.5: One-year incident death rate per 1,000
patient years for all age groups
50
55
60
65
70
75
80
85
90
95
KM
su
rviv
al
1 year
2 year
3 year
4 year
5 year
6 year
7 year
1997 1998 1999 2000 2001 2002 2003 2004 2005
Year
Figure 6.6: Change in KM long term survival by
year of starting RRT; for incident patients aged
18–64 years
10
0
20
30
40
50
60
70
80
KM
su
rviv
al
1 year
2 year
3 year
4 year
5 year
6 year
7 year
1997 1998 1999 2000 2001 2002 2003 2004 2005
Year
Figure 6.7: Change in KM long term survival by
year starting RRT; for incident patients aged 565
years
Chapter 6 Survival of Incident and Prevalent Patients
101

mean haemoglobin in HD patients has shownannual improvement rising from 10.2 g/dl in1998 to 11.6 g/dl in 2006. Other improvementsin phosphate and calcium control have beenrestricted to the last 3 years. This recentimprovement contrasts with dialysis dose wherethe main improvements were in the first 4 years.
Change in survival on renalreplacement therapy by vintage
RRT patients in the UK continued to show noevidence of a worsening prognosis with time onRRT (vintage), even with the follow up period
now increased to 9 years. Figure 6.8 demon-strates this clearly for patients aged under 65years. For those patients aged over 65 years, novintage effect was seen within the first 7 years,though with the decreasing numbers remainingalive beyond 7 years the numbers become toosmall to draw any further conclusions. Figures6.9 and 6.10 show these data for the non-diabetic and diabetic patients respectively.
As highlighted in last years report, these datacontrast with the USRDS data3 which showsworsening prognosis with increasing length oftime on RRT.
0.0
0.1
0.2
0.3
0.4
0.5
0.6
0 0.5 1 1.5 2 2.5 3 3.5 4 4.5 5 5.5 6 6.5 7 7.5 8 8.5 9
Years on RRT
6 m
onth
ly h
azard
of death
18–34
35–44
45–54
55–64
65–74
75+
Figure 6.8: Six monthly hazard of death, by vintage and age band, 1997–2005 incident cohort after day 90
0 0.5 1 1.5 2 2.5 3 3.5 4 4.5 5 5.5 6 6.5 7 7.5 8 8.5 9
Years on RRT
0.0
0.1
0.2
0.3
0.4
0.5
0.6
6 m
onth
ly h
azard
of death
18–34
35–44
45–54
55–64
65–74
75+
Figure 6.9: Six monthly hazard of death, by vintage and age band, 1997–2005 non-diabetic incident cohort
after day 90
The UK Renal Registry The Tenth Annual Report
102
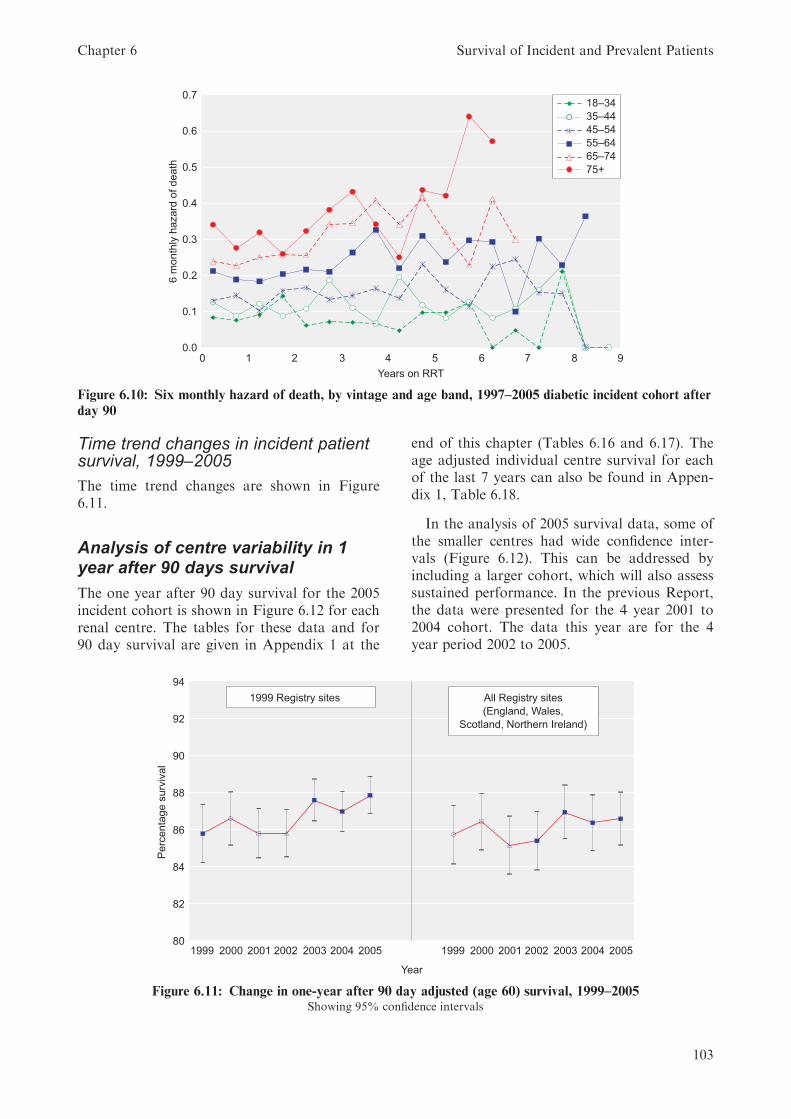
Time trend changes in incident patientsurvival, 1999–2005
The time trend changes are shown in Figure6.11.
Analysis of centre variability in 1year after 90 days survival
The one year after 90 day survival for the 2005incident cohort is shown in Figure 6.12 for eachrenal centre. The tables for these data and for90 day survival are given in Appendix 1 at the
end of this chapter (Tables 6.16 and 6.17). Theage adjusted individual centre survival for eachof the last 7 years can also be found in Appen-dix 1, Table 6.18.
In the analysis of 2005 survival data, some ofthe smaller centres had wide confidence inter-vals (Figure 6.12). This can be addressed byincluding a larger cohort, which will also assesssustained performance. In the previous Report,the data were presented for the 4 year 2001 to2004 cohort. The data this year are for the 4year period 2002 to 2005.
0.0
0.1
0.2
0.3
0.4
0.5
0.6
0.7
0 1 2 3 4 5 6 7 8 9
Years on RRT
6 m
onth
ly h
azard
of death
18–34
35–44
45–54
55–64
65–74
75+
Figure 6.10: Six monthly hazard of death, by vintage and age band, 1997–2005 diabetic incident cohort after
day 90
80
82
84
86
88
90
92
94
1999 2000 2001 2002 2003 2004 2005 1999 2000 2001 2002 2003 2004 2005
Year
Pe
rce
nta
ge
su
rviv
al
All Registry sites
(England, Wales,
Scotland, Northern Ireland)
1999 Registry sites
Figure 6.11: Change in one-year after 90 day adjusted (age 60) survival, 1999–2005Showing 95% confidence intervals
Chapter 6 Survival of Incident and Prevalent Patients
103
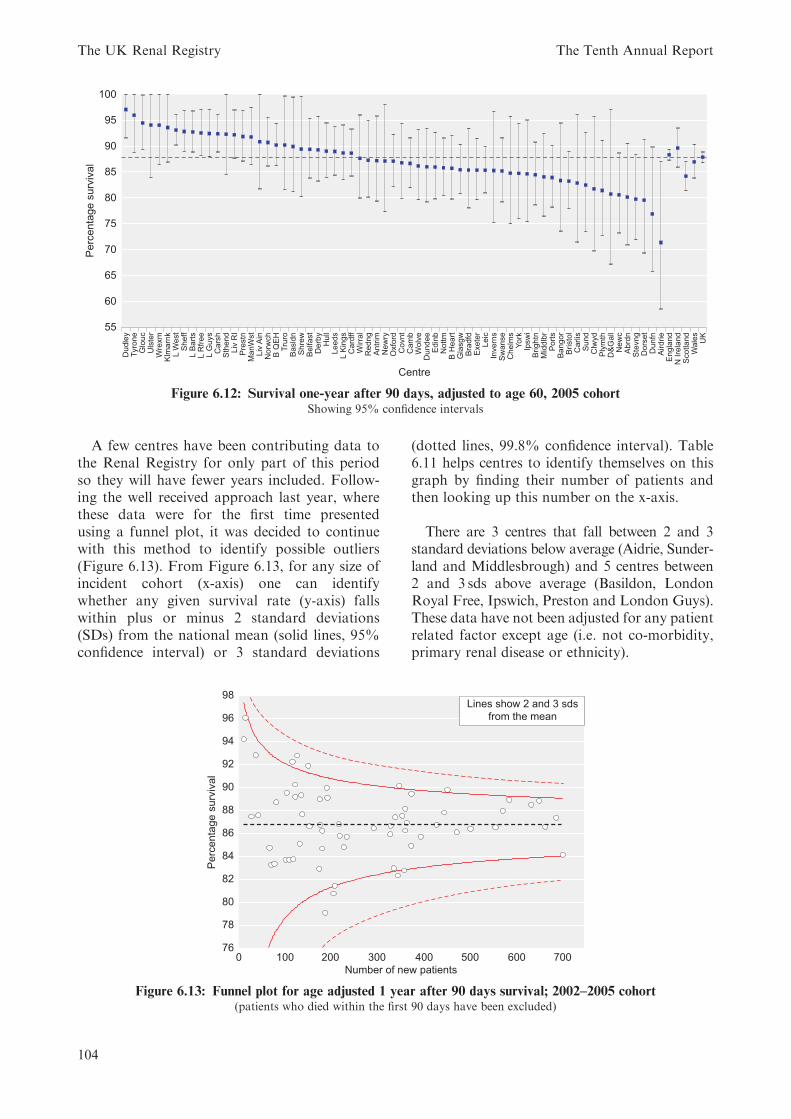
A few centres have been contributing data tothe Renal Registry for only part of this periodso they will have fewer years included. Follow-ing the well received approach last year, wherethese data were for the first time presentedusing a funnel plot, it was decided to continuewith this method to identify possible outliers(Figure 6.13). From Figure 6.13, for any size ofincident cohort (x-axis) one can identifywhether any given survival rate (y-axis) fallswithin plus or minus 2 standard deviations(SDs) from the national mean (solid lines, 95%confidence interval) or 3 standard deviations
(dotted lines, 99.8% confidence interval). Table6.11 helps centres to identify themselves on thisgraph by finding their number of patients andthen looking up this number on the x-axis.
There are 3 centres that fall between 2 and 3standard deviations below average (Aidrie, Sunder-land and Middlesbrough) and 5 centres between2 and 3 sds above average (Basildon, LondonRoyal Free, Ipswich, Preston and London Guys).These data have not been adjusted for any patientrelated factor except age (i.e. not co-morbidity,primary renal disease or ethnicity).
55
60
65
70
75
80
85
90
100
95D
udle
yTyro
ne
Glo
uc
Uls
ter
Wre
xm
Klm
arn
kL W
est
Sheff
L B
art
sL R
free
L G
uys
Cars
hS
thend
Liv
RI
Pre
stn
ManW
st
Liv
Ain
Norw
ch
B Q
EH
Tru
roB
asld
nS
hre
wB
elfast
Derb
yH
ull
Leeds
L K
ings
Card
ffW
irra
lR
edng
Antr
imN
ew
ryO
xfo
rdC
ovnt
Cam
bW
olv
eD
undee
Edin
bN
ott
mB
Heart
Gla
sgw
Bra
dfd
Exete
rLeic
Invern
sS
wanse
Chelm
sY
ork
Ipsw
iB
rightn
Mid
dlb
rP
ort
sB
angor
Bristo
lC
arlis
Sund
Clw
yd
Ply
mth
D&
Gall
Ne
wc
Abrd
nS
tevng
Dors
et
Dunfn
Airdrie
Engla
nd
N I
rela
nd
Scotland
Wale
sU
K
Centre
Pe
rce
nta
ge
su
rviv
al
Figure 6.12: Survival one-year after 90 days, adjusted to age 60, 2005 cohortShowing 95% confidence intervals
76
78
80
82
84
86
88
90
92
94
96
98
0 100 200 300 400 500 600 700
Number of new patients
Pe
rce
nta
ge
su
rviv
al
Lines show 2 and 3 sds
from the mean
Figure 6.13: Funnel plot for age adjusted 1 year after 90 days survival; 2002–2005 cohort(patients who died within the first 90 days have been excluded)
The UK Renal Registry The Tenth Annual Report
104

These data have not been censored at trans-plantation, so the effect of differing centre ratesof transplantation was not taken into account.
There are known regional differences in thelife expectancy of the general population withinthe UK. Table 6.12 shows differences in life
expectancy between the UK countries5;6. TheRegistry is investigating ways to adjust centresurvival for the differences in the underlyingpopulation.
Analysis of the impact ofadjustment for co-morbidity on the 1year after 90 day survival
Co-morbidity returns to the Registry haveremained static (Chapter 5). With the de-anonymisation of centre names, it is essential toshow what the importance is of adjustingpatient survival for co-morbidity.
Preliminary analysis (Figure 6.14a) showedthat several centres demonstrated a large reduc-tion in survival after adjusting for co-morbidity.
Table 6.11: Adjusted 1 year after 90 day survival 2002–2005
Centre
No. of
incident pts
1 year after 90 day
survival %
Ulster 11 94.2
Tyrone 15 96.1
Newry 28 87.5
Liv Ain 37 92.9
Antrim 43 87.6
Clwyd 67 84.8
D&Gall 71 83.3
Chelms 78 83.4
Shrew 82 88.7
Bangor 102 83.7
Belfast 105 89.6
Carlis 110 83.7
Basldn 117 92.3
Dunfn 119 83.8
Sthend 123 89.2
Wrexm 123 90.3
L Rfree 127 92.8
Inverns 133 85.1
Dudley 136 89.4
Klmarnk 138 87.7
Ipswi 151 91.9
Dorset 154 86.6
York 175 82.9
Norwch 176 89.0
Derby 177 86.8
Glouc 181 86.2
Wirral 181 84.7
Airdrie 188 79.1
Redng 191 90.0
Truro 193 89.1
Sund 206 80.8
Plymth 209 81.5
Centre
No. of
incident pts
1 year after 90 day
survival %
Brightn 217 86.8
Abrdn 220 85.8
Bradfd 228 84.8
Dundee 235 85.7
Covnt 293 86.5
Wolve 329 86.0
B Heart 330 86.7
Edinb 337 83.0
ManWst 340 87.5
Middlbr 345 82.4
L Barts 348 90.2
Prestn 355 87.6
Swanse 359 82.8
Exeter 361 86.3
Stevng 361 88.2
Hull 365 87.0
Newc 374 84.9
B QEH 375 89.5
Nottm 395 85.7
Camb 430 86.8
L Kings 446 87.8
L Guys 453 89.8
Liv RI 473 86.1
Ports 503 86.4
Bristol 557 86.5
Leeds 573 88.0
Sheff 587 89.0
Oxford 635 88.5
Carsh 652 88.9
Cardff 665 86.6
Leic 689 87.4
Glasgw 703 84.2
Table 6.12: Life expectancy 2003–2005 in UK
countries (source ONS)
At Birth At age 65
Male Female Male Female
England 76.9 81.2 16.8 19.6
Wales 76.3 80.7 16.4 19.2
Scotland 74.2 79.3 15.5 18.4
Northern Ireland 76.0 80.8 16.4 19.3
UK 76.6 81.0 16.6 19.4
Chapter 6 Survival of Incident and Prevalent Patients
105

These centres were showing 100% completenessof data and more than the expected number ofpatients were recorded as having no co-morbid-ity. This anomaly was confined to centres using aspecific renal software package and investigationrevealed that a ‘null co-morbidity entry’ wasbeing returned as ‘no co-morbidity present’.Figure 6.14a has been included to highlight theeffect of adjusting centre survival for centres withpoor co-morbidity returns as if patients had noco-morbidity. Figure 6.14b shows the correctanalysis with the centres returning incorrect datahaving been removed from the analysis.
Using the combined incident cohort from2000–2004, 9 centres had returned co-morbiditydata for more than 85% of patients. Adjust-ment was first performed to age 60, then to theaverage primary diagnosis mix for all the 9centres. Further adjustment was then made tothe average co-morbidity mix present at thesecentres (Figure 6.14b).
This highlights the importance of improvingthe quality of co-morbidity returns to the RenalRegistry.
0.74
0.76
0.78
0.80
0.82
0.84
0.86
0.88
0.90
0.92
0.94
0.96
Antr
im
Basld
n
Belfast
Bra
dfd
Bristo
l
Chelm
s
Dors
et
Glo
uc
L K
ings
New
ry
Norw
ch
Nottm
Sw
anse
Tyro
ne
Uls
ter
Wolv
e
York
All
centr
es
Centre
Surv
ival
Unadjusted
Age
Age diag
Age diag comorb
Figure 6.14a: Change in 1 year after 90 day survival after adjustment for age, diagnosis and co-morbidity,
using centres with incorrect co-morbidity returns
0.74
0.76
0.78
0.80
0.82
0.84
0.86
0.88
0.90
0.92
0.94
Centre
Surv
ival
Bra
dfd
York
Nottm
Bristo
l
Glo
uc
L K
ings
Wolv
e
Sw
anse
All
centr
es
Unadjusted
Age
Age diag
Age diag comorb
Figure 6.14b: Change in 1 year after 90 day survival after adjustment for age, diagnosis and co-morbidity,
using only centres with correct co-morbidity returns
The UK Renal Registry The Tenth Annual Report
106
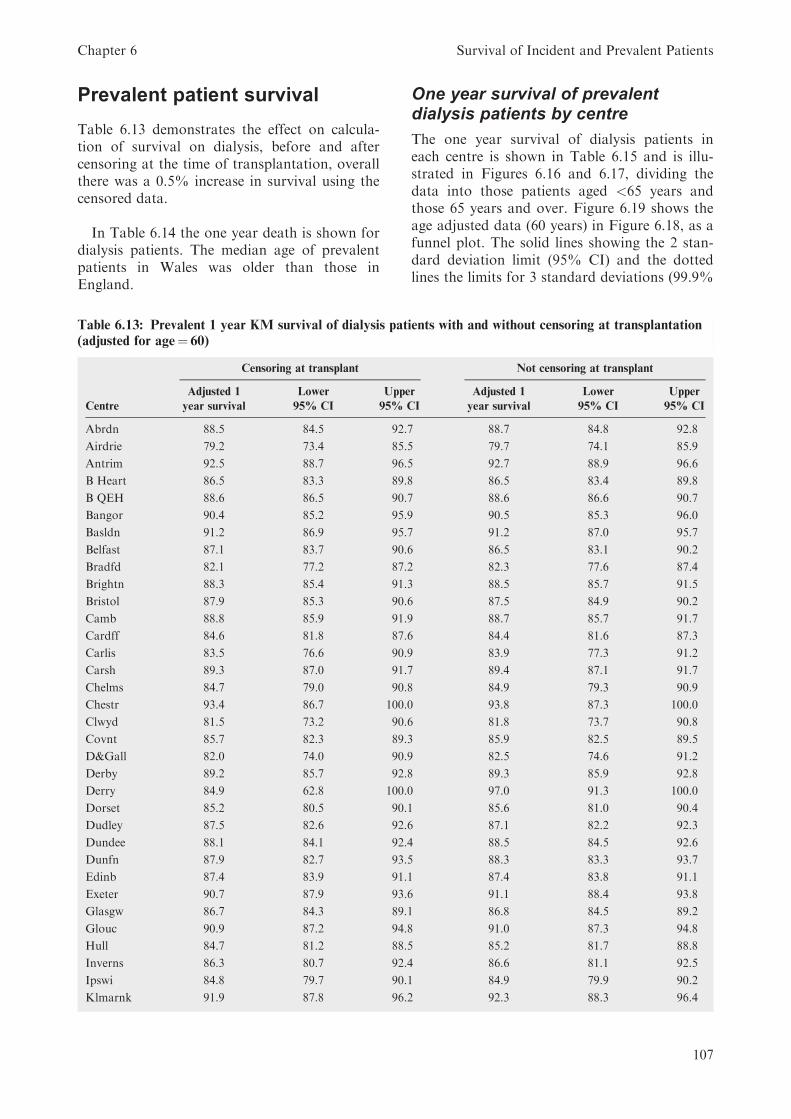
Prevalent patient survival
Table 6.13 demonstrates the effect on calcula-tion of survival on dialysis, before and aftercensoring at the time of transplantation, overallthere was a 0.5% increase in survival using thecensored data.
In Table 6.14 the one year death is shown fordialysis patients. The median age of prevalentpatients in Wales was older than those inEngland.
One year survival of prevalentdialysis patients by centre
The one year survival of dialysis patients ineach centre is shown in Table 6.15 and is illu-strated in Figures 6.16 and 6.17, dividing thedata into those patients aged <65 years andthose 65 years and over. Figure 6.19 shows theage adjusted data (60 years) in Figure 6.18, as afunnel plot. The solid lines showing the 2 stan-dard deviation limit (95% CI) and the dottedlines the limits for 3 standard deviations (99.9%
Table 6.13: Prevalent 1 year KM survival of dialysis patients with and without censoring at transplantation
(adjusted for age¼ 60)
Censoring at transplant Not censoring at transplant
Adjusted 1 Lower Upper Adjusted 1 Lower Upper
Centre year survival 95% CI 95% CI year survival 95% CI 95% CI
Abrdn 88.5 84.5 92.7 88.7 84.8 92.8
Airdrie 79.2 73.4 85.5 79.7 74.1 85.9
Antrim 92.5 88.7 96.5 92.7 88.9 96.6
B Heart 86.5 83.3 89.8 86.5 83.4 89.8
B QEH 88.6 86.5 90.7 88.6 86.6 90.7
Bangor 90.4 85.2 95.9 90.5 85.3 96.0
Basldn 91.2 86.9 95.7 91.2 87.0 95.7
Belfast 87.1 83.7 90.6 86.5 83.1 90.2
Bradfd 82.1 77.2 87.2 82.3 77.6 87.4
Brightn 88.3 85.4 91.3 88.5 85.7 91.5
Bristol 87.9 85.3 90.6 87.5 84.9 90.2
Camb 88.8 85.9 91.9 88.7 85.7 91.7
Cardff 84.6 81.8 87.6 84.4 81.6 87.3
Carlis 83.5 76.6 90.9 83.9 77.3 91.2
Carsh 89.3 87.0 91.7 89.4 87.1 91.7
Chelms 84.7 79.0 90.8 84.9 79.3 90.9
Chestr 93.4 86.7 100.0 93.8 87.3 100.0
Clwyd 81.5 73.2 90.6 81.8 73.7 90.8
Covnt 85.7 82.3 89.3 85.9 82.5 89.5
D&Gall 82.0 74.0 90.9 82.5 74.6 91.2
Derby 89.2 85.7 92.8 89.3 85.9 92.8
Derry 84.9 62.8 100.0 97.0 91.3 100.0
Dorset 85.2 80.5 90.1 85.6 81.0 90.4
Dudley 87.5 82.6 92.6 87.1 82.2 92.3
Dundee 88.1 84.1 92.4 88.5 84.5 92.6
Dunfn 87.9 82.7 93.5 88.3 83.3 93.7
Edinb 87.4 83.9 91.1 87.4 83.8 91.1
Exeter 90.7 87.9 93.6 91.1 88.4 93.8
Glasgw 86.7 84.3 89.1 86.8 84.5 89.2
Glouc 90.9 87.2 94.8 91.0 87.3 94.8
Hull 84.7 81.2 88.5 85.2 81.7 88.8
Inverns 86.3 80.7 92.4 86.6 81.1 92.5
Ipswi 84.8 79.7 90.1 84.9 79.9 90.2
Klmarnk 91.9 87.8 96.2 92.3 88.3 96.4
Chapter 6 Survival of Incident and Prevalent Patients
107
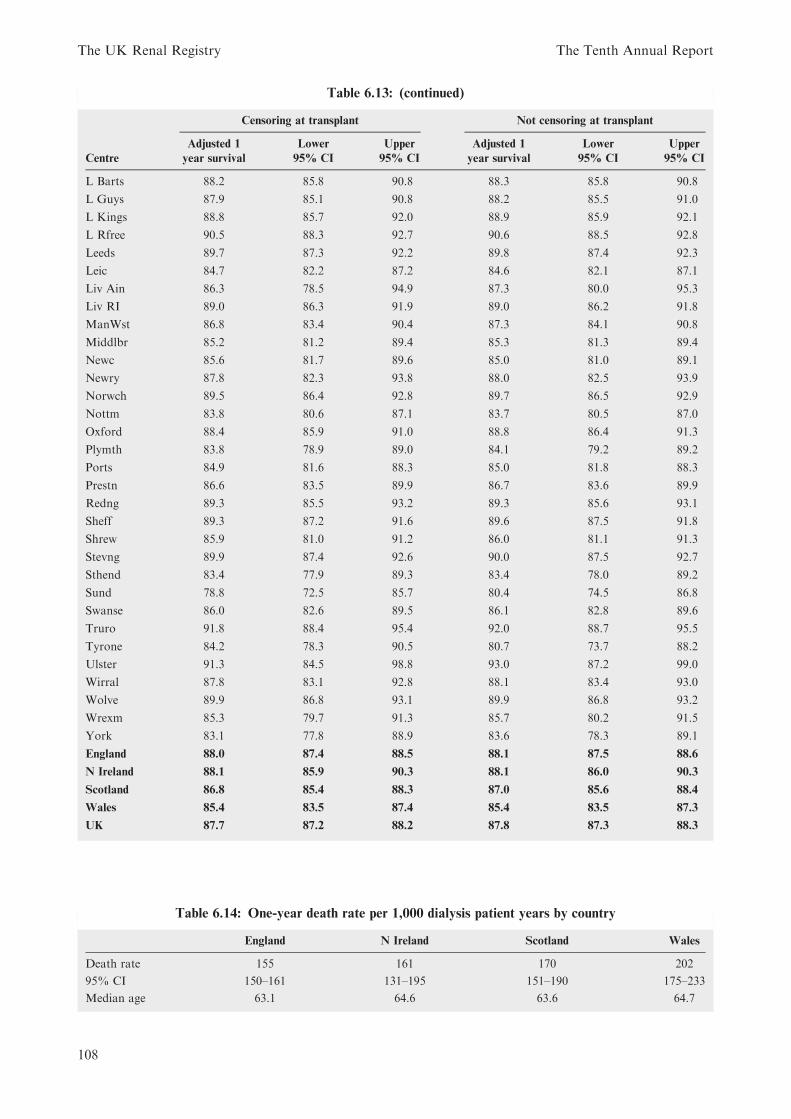
Table 6.13: (continued)
Censoring at transplant Not censoring at transplant
Adjusted 1 Lower Upper Adjusted 1 Lower Upper
Centre year survival 95% CI 95% CI year survival 95% CI 95% CI
L Barts 88.2 85.8 90.8 88.3 85.8 90.8
L Guys 87.9 85.1 90.8 88.2 85.5 91.0
L Kings 88.8 85.7 92.0 88.9 85.9 92.1
L Rfree 90.5 88.3 92.7 90.6 88.5 92.8
Leeds 89.7 87.3 92.2 89.8 87.4 92.3
Leic 84.7 82.2 87.2 84.6 82.1 87.1
Liv Ain 86.3 78.5 94.9 87.3 80.0 95.3
Liv RI 89.0 86.3 91.9 89.0 86.2 91.8
ManWst 86.8 83.4 90.4 87.3 84.1 90.8
Middlbr 85.2 81.2 89.4 85.3 81.3 89.4
Newc 85.6 81.7 89.6 85.0 81.0 89.1
Newry 87.8 82.3 93.8 88.0 82.5 93.9
Norwch 89.5 86.4 92.8 89.7 86.5 92.9
Nottm 83.8 80.6 87.1 83.7 80.5 87.0
Oxford 88.4 85.9 91.0 88.8 86.4 91.3
Plymth 83.8 78.9 89.0 84.1 79.2 89.2
Ports 84.9 81.6 88.3 85.0 81.8 88.3
Prestn 86.6 83.5 89.9 86.7 83.6 89.9
Redng 89.3 85.5 93.2 89.3 85.6 93.1
Sheff 89.3 87.2 91.6 89.6 87.5 91.8
Shrew 85.9 81.0 91.2 86.0 81.1 91.3
Stevng 89.9 87.4 92.6 90.0 87.5 92.7
Sthend 83.4 77.9 89.3 83.4 78.0 89.2
Sund 78.8 72.5 85.7 80.4 74.5 86.8
Swanse 86.0 82.6 89.5 86.1 82.8 89.6
Truro 91.8 88.4 95.4 92.0 88.7 95.5
Tyrone 84.2 78.3 90.5 80.7 73.7 88.2
Ulster 91.3 84.5 98.8 93.0 87.2 99.0
Wirral 87.8 83.1 92.8 88.1 83.4 93.0
Wolve 89.9 86.8 93.1 89.9 86.8 93.2
Wrexm 85.3 79.7 91.3 85.7 80.2 91.5
York 83.1 77.8 88.9 83.6 78.3 89.1
England 88.0 87.4 88.5 88.1 87.5 88.6
N Ireland 88.1 85.9 90.3 88.1 86.0 90.3
Scotland 86.8 85.4 88.3 87.0 85.6 88.4
Wales 85.4 83.5 87.4 85.4 83.5 87.3
UK 87.7 87.2 88.2 87.8 87.3 88.3
Table 6.14: One-year death rate per 1,000 dialysis patient years by country
England N Ireland Scotland Wales
Death rate 155 161 170 202
95% CI 150–161 131–195 151–190 175–233
Median age 63.1 64.6 63.6 64.7
The UK Renal Registry The Tenth Annual Report
108

CI). With over 60 centres included, it would beexpected by chance that 3 centres would falloutside the 95% (1 in 20) confidence intervals.The graph shows 6 centres outside the 2 sdinterval, with 2 clearly below (Airdrie and Sun-derland), 2 marginally below (Nottingham 83.8v 2 sd 84.0 and Leicester 84.7 v 2 sd 84.8) and 2above 2 sds (Antrim and London Royal Free).Similarly to the incident survival, one centre(London West) was demonstrating a survivalthat was beyond 3 sds better than expected.
This was a statistical outlier and excluded fromcalculation of the mean survival figure.
The 2006, one year death rate inprevalent dialysis patients by ageband
The death rates on dialysis, by age band areshown in Figure 6.20. The younger patients area selected higher risk group, as transplantedpatients have been excluded. In youngerpatients, the death rate increased by about 25per 1,000 patient years for a 10 year increase inage, while in the older age group it increased byabout 100 per 1,000 patient years. This demon-strates the death rates for UK dialysis patientswere lower than dialysis patients in the USAacross all age bands (Figure 6.12 USRDSReport 2007).
One year survival of prevalentdialysis patients in England, Wales,Scotland and Northern Ireland from1997–2006
For the year 2006 (Figure 6.21), there was asignificant difference in the one year age
Table 6.15: One-year survival of established prevalent RRT patients in UK (unadjusted unless stated
otherwise)
Patient group Patients Deaths KM survival KM 95% CI
Transplant patients 2006
Censored at dialysis 15,476 358 97.6 97.4–97.9
Not censored at dialysis 15,476 388 97.5 97.2–97.7
Dialysis patients 2006
All 2006 20,079 2,834 85.3 84.8–85.8
All 2006 adjusted age¼ 60 20,079 2,834 87.7 87.2–88.2
2 year survival – dialysis patients 2005
All 1/1/2005 (2 year) 19,069 4,951 72.0 71.3–72.6
Dialysis patients 2006
All age <65 10,754 910 91.0 90.4–91.5
All age 65þ 9,325 1,924 79.1 78.3–79.9
Non-diabetic <55 5,346 268 94.6 94.6–93.9
Non-diabetic 55–64 2,963 325 88.6 88.6–87.3
Non-diabetic 65–74 3,671 582 83.9 83.9–82.6
Non-diabetic 75þ 3,583 900 74.7 74.7–73.3
Non-diabetic <65 8,309 593 92.4 91.8–93.0
Diabetic <65 1,759 275 83.5 81.6–85.2
Non-diabetic 65þ 7,254 1,482 79.3 78.4–80.2
Diabetic 65þ 1,508 357 76.1 73.8–78.1
KM¼Kaplan–Meier survival.
Cohorts of patients alive 1/1/2006 unless indicated otherwise.
60
65
70
75
80
85
90
100
95
18–34 35–44 45–54 55–64 65–74 75–84 85+Age group
Pe
rce
nta
ge
su
rviv
al
Unadj 1yr survival
LCL
UCL
Figure 6.15: One year survival of prevalent dialysis
patients in different age groups – 2006
Chapter 6 Survival of Incident and Prevalent Patients
109

100
95
90
85
80
75
70
65
60
55
EdinbAntrimNewryDerby
L WestBangorL RfreeDorsetOxfordBasldnShrewRedngChestr
DundeeL BartsLeeds
ManWstExeter
SheffB QEHInverns
DunfnIpswi
CambDudleyL GuysMiddlbrBristol
KlmarnkLiv RI
LeicL KingsBelfastAbrdnCarsh
D&GallTruro
BrightnB Heart
CovntWolveNewc
NorwchStevngUlster
GlasgwWrexmPrestnClwydGloucSund
NottmChelmsLiv AinAirdrieBradfdCardffPortsWirral
SwansePlymth
YorkTyroneSthend
CarlisHull
EnglandN IrelandScotland
WalesUK
Centre
Percentage survival
Figure
6.16:Oneyearsurviva
lofpreva
lentdialysis
patien
tsaged
under
65in
each
centre
Centre
100
95
90
85
80
75
70
65
60
55
50
45
Percentage survival
DerryKlmarnk
ChestrUlsterTruroGlouc
StevngL WestAntrimBasldnWolveCarshWirral
ExeterLeeds
NorwchLiv RI
BangorL RfreeL KingsLiv Ain
SheffHull
RedngAbrdnCambPrestnB QEHBrightnL Barts
SwanseL GuysDerby
GlasgwDunfn
BelfastOxfordDudley
CarlisPorts
DundeeBristol
B HeartManWst
TyroneNewc
InvernsWrexmCardffCovnt
ChelmsPlymthNottmNewry
SthendMiddlbrShrewEdinbIpswiYork
DorsetLeic
BradfdD&GallClwydAirdrieSund
EnglandN IrelandScotland
WalesUK
Figure
6.17:Oneyearsurviva
lofpreva
lentdialysis
patien
tsaged
65andover
ineach
centre
Centre
100
95
90
85
80
75
70
65
60
Percentage survival
ChestrAntrim
KlmarnkL West
TruroUlster
BasldnGloucExeter
L RfreeBangorStevngWolveLeeds
NorwchCarshSheff
RedngDerbyLiv RICamb
L KingsB QEHAbrdn
OxfordBrightnL Barts
DundeeDunfnBristol
L GuysNewryWirral
DudleyEdinb
BelfastManWstGlasgwPrestn
B HeartInvernsLiv Ain
SwanseShrewCovntNewc
WrexmMiddlbrDorset
PortsDerryIpswiHullLeic
ChelmsCardff
TyronePlymthNottmCarlis
SthendYork
BradfdD&GallClwydAirdrieSund
EnglandN IrelandScotland
WalesUK
Figure
6.18:Oneyearsurviva
lofpreva
lentdialysis
patien
tsin
each
centre
adjusted
toage60
TheUK
RenalRegistry
TheTenth
AnnualReport
110

0.76
0.78
0.80
0.82
0.84
0.86
0.88
0.90
0.92
0.94
0.96
0 100 200 300 400 500 600 700 800 900
Number of patients
Su
rviv
al
Survival
Mean
L95
U95
Figure 6.19: One year funnel plot of prevalent dialysis patients in each centre adjusted to age 60
18–34 35–44 45–54 55–64 65–74 75–84 85+
Age group
Death
rate
100
150
0
50
200
250
300
350
400
450England
N Ireland
Scotland
Wales
Figure 6.20: Death rate per 1,000 patients years by UK country and age group for prevalent dialysis patients
70
72
74
76
78
80
82
84
86
88
90
92
19
97
19
98
19
99
20
00
20
01
20
02
20
03
20
04
20
05
20
06
19
97
19
98
19
99
20
00
20
01
20
02
20
03
20
04
20
05
20
06
19
97
19
98
19
99
20
00
20
01
20
02
20
03
20
04
20
05
20
06
19
97
19
98
19
99
20
00
20
01
20
02
20
03
20
04
20
05
20
06
Year
Pe
rce
nta
ge
su
rviv
al
England N Ireland Wales Scotland
Figure 6.21: Serial one year survival for dialysis patients in England, Wales and Scotland from 1997–2006
adjusted to age 60
Chapter 6 Survival of Incident and Prevalent Patients
111

adjusted prevalent dialysis survival between UKcountries (p ¼ 0:016). The change in prevalentsurvival by centre over the years 2000 to 2006 isshown in Appendix 1, Table 6.19.
The data for Northern Ireland were onlyavailable for the last 2 years, so were not testedfor trend. For England and Scotland, the testfor a linear trend improvement in dialysissurvival was significant (p ¼ <0:00001 andp ¼ 0:0001 respectively).
References
1. Ansell D, Feest T, Tomson C et al; UK Renal RegistryReport 2007 Chapter 2. www.renalreg.org
2. Renal Association. Treatment of Adults and Childrenwith renal failure. Standards and audit measures. 3rdedition. Royal College of Physicians of London, 2002.
3. US Renal Data System, USRDS 2007 Annual Report,Chapter 6. www.usdrs.org/atlas.htm
4. Ansell D, Feest T, Tomson C et al; UK Renal Registry
Report 2007 Chapter 13. www.renalreg.org5. General Register Office for Scotland; 2005 Annual
Review; Chapter 1. http://www.gro-scotland.gov.uk/
statistics/library/annrep/rgs-annual-review-2005/chapter-1/chapter-1-demographic-overview-deaths/deaths-part-1.html#variationsinmortalitylevelswithinscotland
6. Office for National Statistics http://www.statistics.gov.uk
The UK Renal Registry The Tenth Annual Report
112

Appendix 1: Survival tables
Table 6.16: 1 year after 90-day survival by centre for 2005 unadjusted and adjusted to age 60
Centre
Unadjusted
1 yr after
90d survival
Adjusted
1 yr after
90d survival
Adjusted
1 yr after
90d 95% CI
Abrdn 77.3 80.1 70.9–90.5
Airdrie 68.9 71.3 58.5–87.0
Antrim 81.4 87.2 79.3–95.8
B Heart 82.8 85.7 79.7–92.0
B QEH 88.3 90.2 86.3–94.3
Bangor 74.2 83.3 73.5–94.4
Basldn 85.7 89.9 81.2–99.5
Belfast 88.1 89.3 83.8–95.3
Bradfd 80.0 85.4 78.0–93.4
Brightn 77.5 84.5 78.6–90.7
Bristol 78.7 83.2 77.9–88.9
Camb 83.5 86.6 81.9–91.6
Cardff 86.3 88.6 84.2–93.3
Carlis 80.6 82.8 71.4–96.0
Carsh 90.3 92.4 88.8–96.1
Chelms 77.6 84.7 75.0–95.7
Clwyd 75.0 81.7 69.7–95.8
Covnt 84.1 86.8 79.8–94.4
D&Gall 70.1 80.7 67.1–97.0
Derby 85.1 89.3 83.2–95.7
Dorset 70.9 79.5 69.3–91.3
Dudley 96.9 97.0 91.6–100
Dundee 80.7 86.0 79.2–93.3
Dunfn 71.9 76.9 65.8–89.8
Edinb 83.1 85.9 79.8–92.6
Exeter 78.5 85.3 79.7–91.4
Glasgw 82.2 85.4 80.8–90.3
Glouc 91.3 94.4 89.3–99.8
Hull 86.0 89.0 83.8–94.5
Inverns 85.1 85.3 75.2–96.7
Ipswi 81.0 84.6 75.4–95.0
Klmarnk 92.2 93.6 86.9–100
L Barts 93.1 92.7 88.8–96.8
L Guys 91.8 92.4 88.0–97.0
L Kings 87.4 88.6 83.5–94.1
L Rfree 91.7 92.5 88.2–97.1
L West 91.7 93.1 90.2–96.1
Leeds 85.7 88.9 84.3–93.8
Leic 83.0 85.3 80.9–89.9
Liv Ain 89.9 90.9 81.7–100
Liv RI 91.1 92.2 87.7–97.0
ManWst 91.6 91.7 86.4–97.4
Middlbr 81.7 84.0 76.4–92.4
Newc 76.6 80.6 73.2–88.7
Newry 82.1 87.1 77.3–98.1
Norwch 85.5 90.7 86.1–95.5
Chapter 6 Survival of Incident and Prevalent Patients
113
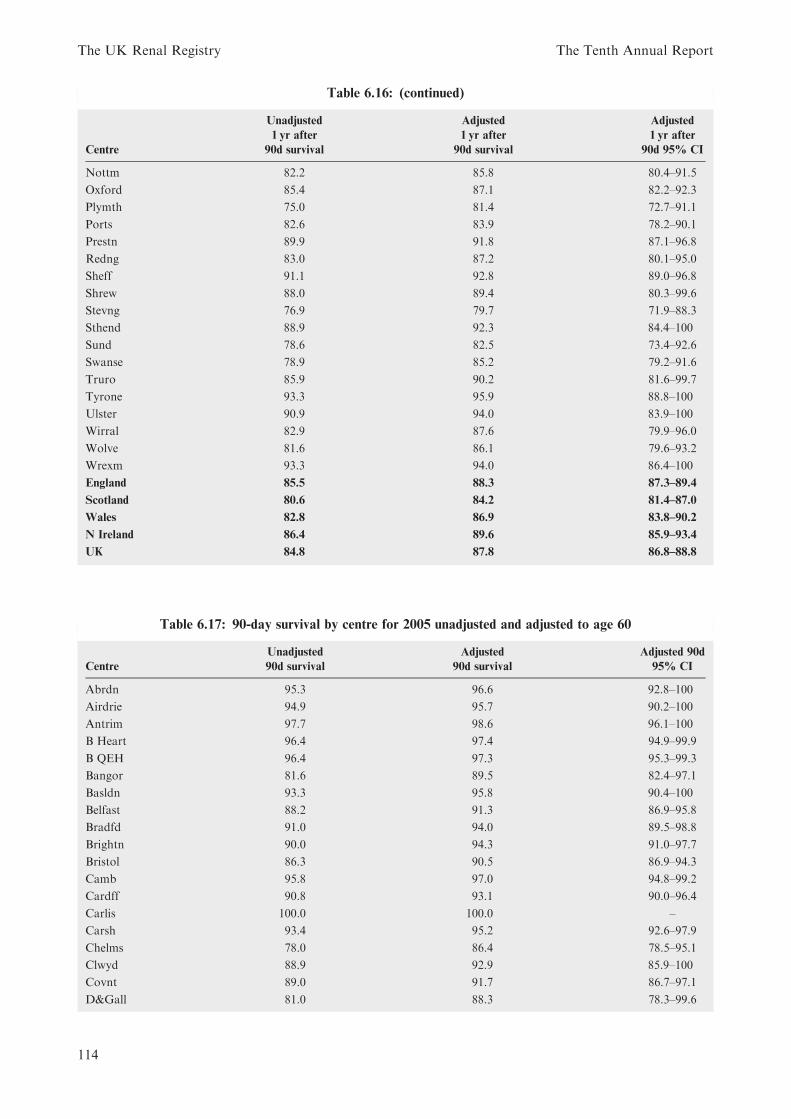
Table 6.16: (continued)
Centre
Unadjusted
1 yr after
90d survival
Adjusted
1 yr after
90d survival
Adjusted
1 yr after
90d 95% CI
Nottm 82.2 85.8 80.4–91.5
Oxford 85.4 87.1 82.2–92.3
Plymth 75.0 81.4 72.7–91.1
Ports 82.6 83.9 78.2–90.1
Prestn 89.9 91.8 87.1–96.8
Redng 83.0 87.2 80.1–95.0
Sheff 91.1 92.8 89.0–96.8
Shrew 88.0 89.4 80.3–99.6
Stevng 76.9 79.7 71.9–88.3
Sthend 88.9 92.3 84.4–100
Sund 78.6 82.5 73.4–92.6
Swanse 78.9 85.2 79.2–91.6
Truro 85.9 90.2 81.6–99.7
Tyrone 93.3 95.9 88.8–100
Ulster 90.9 94.0 83.9–100
Wirral 82.9 87.6 79.9–96.0
Wolve 81.6 86.1 79.6–93.2
Wrexm 93.3 94.0 86.4–100
England 85.5 88.3 87.3–89.4
Scotland 80.6 84.2 81.4–87.0
Wales 82.8 86.9 83.8–90.2
N Ireland 86.4 89.6 85.9–93.4
UK 84.8 87.8 86.8–88.8
Table 6.17: 90-day survival by centre for 2005 unadjusted and adjusted to age 60
Centre
Unadjusted
90d survival
Adjusted
90d survival
Adjusted 90d
95% CI
Abrdn 95.3 96.6 92.8–100
Airdrie 94.9 95.7 90.2–100
Antrim 97.7 98.6 96.1–100
B Heart 96.4 97.4 94.9–99.9
B QEH 96.4 97.3 95.3–99.3
Bangor 81.6 89.5 82.4–97.1
Basldn 93.3 95.8 90.4–100
Belfast 88.2 91.3 86.9–95.8
Bradfd 91.0 94.0 89.5–98.8
Brightn 90.0 94.3 91.0–97.7
Bristol 86.3 90.5 86.9–94.3
Camb 95.8 97.0 94.8–99.2
Cardff 90.8 93.1 90.0–96.4
Carlis 100.0 100.0 –
Carsh 93.4 95.2 92.6–97.9
Chelms 78.0 86.4 78.5–95.1
Clwyd 88.9 92.9 85.9–100
Covnt 89.0 91.7 86.7–97.1
D&Gall 81.0 88.3 78.3–99.6
The UK Renal Registry The Tenth Annual Report
114

Table 6.17: (continued)
Centre
Unadjusted
90d survival
Adjusted
90d survival
Adjusted 90d
95% CI
Derby 97.1 98.1 95.6–100
Dorset 93.3 96.0 91.7–100
Dudley 85.0 87.8 79.3–97.2
Dundee 88.3 92.3 87.6–97.3
Dunfn 90.9 93.8 88.2–99.8
Edinb 96.0 97.0 94.2–99.9
Exeter 88.4 93.0 89.4–96.8
Glasgw 91.6 94.0 91.3–96.9
Glouc 88.5 93.5 88.6–98.7
Hull 89.6 92.8 89.0–96.7
Inverns 93.2 93.7 87.1–100
Ipswi 92.2 94.5 89.5–99.8
Klmarnk 90.7 93.0 86.7–99.7
L Barts 98.3 98.4 96.5–100
L Guys 97.8 98.1 95.9–100
L Kings 97.1 97.6 95.4–99.9
L Rfree 97.7 98.0 95.8–100
L West 97.3 98.0 96.5–99.5
Leeds 87.3 91.2 87.6–95.1
Leic 93.6 95.1 92.7–97.6
Liv Ain 93.9 95.1 88.7–100
Liv RI 87.4 89.8 85.3–94.6
ManWst 91.9 92.6 88.0–97.3
Middlbr 86.9 89.9 84.4–95.8
Newc 92.6 94.5 90.7–98.5
Newry 93.3 95.7 90.1–100
Norwch 83.8 90.9 86.9–95.0
Nottm 91.5 94.1 90.9–97.4
Oxford 95.1 96.0 93.4–98.8
Plymth 89.8 93.8 89.1–98.7
Ports 93.4 94.6 91.4–97.9
Prestn 92.9 94.8 91.4–98.4
Redng 90.0 93.8 89.4–98.3
Sheff 88.5 91.5 87.8–95.4
Shrew 92.5 94.2 88.2–100
Stevng 96.6 97.4 94.5–100
Sthend 79.4 87.5 79.5–96.4
Sund 93.2 95.3 90.9–99.9
Swanse 95.7 97.4 95.0–99.9
Truro 93.5 96.0 90.9–100
Tyrone 68.2 82.2 71.1–95.0
Ulster 84.6 90.9 80.0–100
Wirral 88.7 92.2 86.5–98.4
Wolve 90.0 93.5 89.5–97.7
Wrexm 80.4 85.8 77.2–95.4
England 92.4 94.7 94.0–95.4
Scotland 92.1 94.5 92.9–96.0
Wales 89.9 93.4 91.3–95.5
N Ireland 88.6 92.7 89.9–95.5
UK 92.1 94.5 93.8–95.2
Chapter 6 Survival of Incident and Prevalent Patients
115

Table 6.18: 1 year after 90-day survival by centre for incident cohort years 1999–2005 adjusted to age 60
1 year after 90 days survival by centre
Centre 1999 2000 2001 2002 2003 2004 2005
Abrdn 81.65 79.65 92.30 87.77 82.82 89.77 80.12
Airdrie 74.61 81.47 84.70 78.24 80.15 85.55 71.35
Antrim 87.17
B Heart 86.01 81.93 84.46 86.36 85.57 87.75 85.66
B QEH 88.24 90.20
Bangor 80.72 86.15 83.66 83.33
Basldn 91.61 95.08 89.89
Belfast 89.35
Bradfd 92.29 82.51 83.29 85.18 85.36
Brightn 87.96 84.46
Bristol 85.79 86.09 86.02 88.25 87.36 87.48 83.19
Camb 90.60 82.56 89.48 88.26 86.62
Cardff 88.16 89.07 84.00 82.79 89.69 86.28 88.61
Carlis 74.95 77.53 95.31 88.58 77.18 86.42 82.81
Carsh 85.62 85.73 75.76 85.27 90.37 86.74 92.38
Chelms 81.12 84.74
Clwyd 88.28 79.22 90.01 81.72
Covnt 78.76 82.87 88.45 90.80 82.18 85.48 86.78
D&Gall 87.17 87.20 74.35 77.92 85.37 88.98 80.72
Derby 87.90 85.00 83.55 86.65 89.26
Dorset 86.05 91.21 79.52
Dudley 89.14 85.82 90.12 88.10 88.22 85.35 97.04
Dundee 89.42 77.39 86.27 83.72 89.53 83.98 85.98
Dunfn 79.88 71.93 70.14 86.68 85.98 87.77 76.86
Edinb 84.74 80.27 80.31 82.34 83.49 80.40 85.94
Exeter 86.71 86.26 86.02 87.40 86.17 86.62 85.33
Glasgw 85.02 84.68 79.79 84.51 84.95 81.59 85.40
Glouc 88.01 95.00 80.63 80.62 83.62 86.09 94.45
Hull 87.82 86.40 89.74 85.19 87.48 86.22 88.99
Inverns 94.13 84.03 91.65 83.47 88.34 83.47 85.25
Ipswi 98.24 93.70 90.87 84.61
Klmarnk 90.43 91.40 88.18 87.22 85.22 83.85 93.57
L Barts 87.55 92.72
L Guys 89.20 88.08 84.67 95.46 88.18 92.41
L Kings 88.39 86.37 88.27 88.64
L Rfree 92.54
L West 92.57 94.62 91.99 93.08
Leeds 79.89 90.43 88.51 84.38 86.90 89.72 88.94
Leic 85.68 84.81 87.57 88.24 91.68 85.53 85.31
Liv Ain 90.85
Liv RI 87.70 84.68 82.54 83.28 92.19
ManWst 87.94 82.77 91.74
Middlbr 80.87 88.40 83.72 78.45 82.23 85.09 84.02
Newc 87.77 88.86 82.83 80.56
Newry 87.10
Norwch 86.10 90.68
Nottm 86.70 89.96 89.34 86.65 86.28 83.60 85.81
Oxford 94.17 89.89 85.63 88.22 87.40 90.70 87.07
Plymth 82.05 86.18 73.02 81.08 81.30 81.20 81.38
The UK Renal Registry The Tenth Annual Report
116

Table 6.18: (continued)
1 year after 90 days survival by centre
Centre 1999 2000 2001 2002 2003 2004 2005
Ports 87.11 85.94 88.14 87.49 83.91
Prestn 87.91 86.83 86.41 86.83 86.48 84.42 91.81
Redng 75.96 81.44 90.92 90.06 93.01 87.22
Sheff 85.21 94.75 93.74 83.54 89.99 88.87 92.80
Shrew 88.10 89.39
Stevng 86.83 91.35 80.77 87.29 94.80 87.86 79.70
Sthend 87.72 81.36 80.83 85.96 90.46 88.45 92.26
Sund 80.99 85.00 84.70 69.37 81.13 87.33 82.46
Swanse 84.95 84.18 82.64 81.25 82.76 85.17
Truro 91.40 83.60 88.46 93.16 90.18
Tyrone 95.95
Ulster 94.04
Wirral 76.01 94.15 80.97 87.59
Wolve 86.18 87.79 76.53 86.49 82.95 87.59 86.15
Wrexm 80.31 83.32 82.93 92.99 81.88 91.74 94.01
York 83.16 85.42 80.91 76.65 89.20 84.69
England 85.50 87.50 86.26 86.09 87.99 87.47 88.30
N Ireland 89.60
Scotland 85.13 81.85 82.62 83.63 85.19 83.77 84.17
Wales 86.75 87.11 84.08 84.18 85.88 85.68 86.95
UK 85.52 86.41 85.59 85.59 87.47 86.95 87.83
Chester and Derry have been excluded as these centres were too small to calculate a single year survival figure.
Table 6.19: 1 year survival by centre for prevalent cohort years 2000–2006 adjusted to age 60
1 year survival by centre and year
Centre 2000 2001 2002 2003 2004 2005 2006
Abrdn 85.8 89.3 87.2 80.4 85.3 87.4 88.5
Airdrie 77.3 76.8 81.2 83.6 84.2 82.6 79.2
Antrim 83.5 92.5
B Heart 86.6 87.4 87.8 87.4 87.3 87.8 86.5
B QEH 89.0 89.1 88.6
Bangor 86.0 81.5 89.7 86.7 90.4
Basldn 82.8 88.5 91.2 91.2
Belfast 86.5 87.1
Bradfd 77.6 87.9 82.6 87.9 86.1 82.1
Brightn 86.6 84.4 88.3
Bristol 87.2 86.3 87.8 89.0 86.9 87.6 87.9
Camb 85.9 86.6 87.1 87.5 87.8 88.8
Cardff 85.2 85.7 86.0 81.1 84.5 84.5 84.6
Carlis 82.8 88.8 80.6 83.0 82.5 85.8 83.5
Carsh 83.6 83.6 82.9 85.3 88.6 86.7 89.3
Chelms 86.4 81.7 84.7
Chestr 85.9 93.1 88.5 93.4
Clwyd 87.9 87.6 75.8 82.3 81.5
Covnt 87.2 85.7 85.1 87.8 88.6 89.5 85.7
D&Gall 87.2 83.9 84.6 86.3 83.1 91.3 82.0
Derby 88.8 89.5 86.5 88.8 88.4 89.2
Chapter 6 Survival of Incident and Prevalent Patients
117

Table 6.19: (continued)
1 year survival by centre and year
Centre 2000 2001 2002 2003 2004 2005 2006
Derry 84.9
Dorset 90.0 88.3 89.7 85.2
Dudley 85.4 83.3 83.2 84.7 86.7 86.3 87.5
Dundee 76.7 85.7 84.9 84.0 85.4 87.9 88.1
Dunfn 76.1 78.6 82.1 83.5 88.9 91.0 87.9
Edinb 83.7 82.5 84.8 83.8 86.3 86.5 87.4
Exeter 85.9 84.9 87.2 86.3 85.8 84.0 90.7
Glasgw 86.1 83.4 86.0 83.8 85.8 87.6 86.7
Glouc 89.0 78.7 83.7 81.7 89.0 88.3 90.9
Hull 81.0 86.7 87.5 85.3 85.8 84.7 84.7
Inverns 80.8 88.8 88.3 87.4 87.5 87.1 86.3
Ipswi 81.7 85.5 90.3 86.4 84.8
Klmarnk 80.2 85.3 82.5 82.0 86.9 84.5 91.9
L Barts 84.1 85.5 88.2
L Guys 86.1 86.9 86.2 88.7 88.7 89.3 87.9
L Kings 81.0 77.8 81.5 86.5 88.8
L Rfree 90.3 90.5
L West 90.2 91.5 91.3 92.1 91.9
Leeds 83.2 85.9 87.4 86.0 85.4 89.0 89.7
Leic 83.2 84.7 84.1 83.8 85.3 87.3 84.7
Liv Ain 92.5 90.5 90.5 86.4 96.8 86.3
Liv RI 81.4 82.4 85.2 86.4 84.1 89.0
ManWst 85.1 82.2 84.1 86.8
Middlbr 84.0 84.0 84.2 84.3 82.9 86.0 85.2
Newc 83.9 81.7 82.8 87.6 85.6
Newry 85.9 87.8
Norwch 86.3 86.9 89.5
Nottm 85.0 87.0 82.8 85.2 86.3 85.2 83.8
Oxford 87.9 88.5 85.5 86.8 87.9 87.7 88.4
Plymth 84.9 87.4 76.8 85.2 86.9 88.0 83.8
Ports 83.7 81.1 81.5 89.0 86.3 84.9
Prestn 85.6 87.1 86.2 84.5 85.8 85.6 86.6
Redng 83.5 78.3 84.9 82.9 89.8 87.2 89.3
Sheff 84.1 87.9 90.3 91.1 87.7 87.0 89.3
Shrew 84.8 87.8 85.9
Stevng 90.9 86.7 88.4 89.5 88.9 89.9
Sthend 85.1 88.7 88.7 86.9 88.7 86.3 83.4
Sund 76.7 79.3 77.6 75.5 82.8 86.5 78.8
Swanse 83.9 88.1 80.9 82.4 87.9 89.5 86.0
Truro 88.9 82.4 90.2 89.9 85.8 91.8
Tyrone 89.1 84.2
Ulster 85.9 91.3
Wirral 91.6 84.4 85.6 88.6 87.8
Wolve 84.2 90.1 86.3 83.5 86.6 87.9 89.9
Wrexm 83.9 87.7 86.9 85.3 85.7 84.2 85.3
York 87.1 78.9 84.6 81.6 82.6 89.0 83.1
England 85.3 85.9 85.7 86.2 87.1 87.6 88.0
N Ireland 86.2 88.1
Scotland 83.2 83.6 85.1 83.6 85.9 87.1 86.8
Wales 84.5 86.9 84.8 82.4 85.5 86.0 85.4
UK 84.9 85.6 85.6 85.6 86.9 87.4 87.7
The UK Renal Registry The Tenth Annual Report
118
Appendix 2: Statisticalmethods
The unadjusted survival probabilities (with 95%confidence intervals) were calculated using theKaplan–Meier method, in which the probabilityof surviving more than a given time can beestimated for members of a cohort of patients,without accounting for the characteristics of themembers of that cohort. Where centres aresmall, or the survival probabilities are greaterthan 90%, the confidence intervals are onlyapproximate.
In order to estimate the difference in survivalof different subgroups of patients within thecohort, a stratified proportional hazards model(Cox) was used where appropriate. The resultsfrom the Cox model are interpreted using ahazard ratio. When comparing two groups, thehazard ratio is the ratio of the estimatedhazards for group A relative to group B, where
the hazard is the risk of dying at time t giventhat the individual has survived until this time.The underlying assumption of a proportionalhazards model is that this ratio remains con-stant throughout the period under considera-tion. Whenever used, the proportional hazardsmodel was tested for validity.
Validity of the centre adjustment forproportional hazards
For the Cox model to be used to adjust centresurvival to a specific age (eg 60 years), theassumption of constant proportionality meansthat the relationship of survival (hazard ofdeath) to age is similar in all centres within thetime period studied. If one centre had arelationship of survival with age different fromthe other centres, the adjustment would not bevalid. Testing showed the relationship to besimilar for all centres.
Chapter 6 Survival of Incident and Prevalent Patients
119