Embed Size (px)
Citation preview
2001 Everglades Consolidated Report Chapter 6: STA Optimization
6-1
Chapter 6: Optimization Researchfor the Stormwater
Treatment AreasMartha K. Nungesser, Jana Majer Newman, Christy Combs,Tammy Lynch, Michael J. Chimney, and Richard Meeker
SUMMARY
Research into optimization of the Stormwater Treatment Areas (STAs) has continued overthe past year. The 2000 Everglades Consolidated Report (SFWMD, 2000) contained detailedanalyses and information on the state of knowledge about the Everglades Nutrient RemovalProject (ENRP) and STAs. This chapter updates ongoing research and summarizes new findingscompleted since last year’s report.
The Everglades Forever Act (Act) requires the South Florida Water Management District(District) to conduct research and monitoring programs to optimize nutrient removal performanceof the STAs. Information is derived from practical experience operating the STAs and analyzingperformance data, from experiments in some of the 30 0.2-hectare test cells, from mesocosmexperiments, from analysis of data available from other wetlands, and eventually throughsimulation of operational scenarios using a dynamic water quality model.
The primary focus of STA Optimization Research this year has been to assess theperformance of the STA treatment cells, conduct controlled experiments in the test cells, performmarsh dry-out experiments in mesocosms, and improve the hydraulic performance of treatmentCell 4.
The highlights of events and research into STA optimization are listed below:
• STA-1 West:
! The Everglades Nutrient Removal Project (ENRP) has been incorporated intothe larger STA-1 West (STA-1W) with the addition of treatment Cells 5A and5B. The effective treatment area of the enlarged STA is now 2,699 hectares(ha) (6,670 acres), a significant increase from the former 1,545 ha (3,819acres).
! Incorporating the ENRP into STA-1W has altered some of the previoushydrologic flow patterns. Because construction activities disrupted collectionof critical inflow water quality and flow data, water and phosphorus budgetupdates are available only for treatment Cells 2, 3 and 4 this year, for whichphosphorus (P) retention was higher than that of prior years. Mass removal of
Chapter 6: STA Optimization 2001 Everglades Consolidated Report
6-2
total phosphorus (TP) in Cell 4 has averaged greater than 56 percent over 5years.
! The eastern and western flow-ways differ significantly in TP retention evenwhen accounting for differences in TP loading. These results may be due todifferences in vegetation, hydraulic retention time, water depths, and/orseepage inflow into the eastern flow-way.
! Although treatment Cell 4 retains more TP relative to its size than the othertreatment cells, a dye tracer study indicated that over half (51 percent) of theinflow water into treatment Cell 4 bypassed the vegetation. A series ofearthen plugs was installed across the deeper canals to distribute flow moreevenly and a follow-up study will determine the effectiveness of thesestructures.
! Peat accretion during the first four years of operation was 8.5 mm/year.
• Test Cells
! Experiments to determine the effects of changing hydraulic loading rate anddepth on treatment performance are in progress. Mean outflow TPconcentrations increased as hydraulic loading rates increased, exceeding0.050 mg/L (1 mg/L=1000 µg/L=1000 ppb) only when hydraulic loadingrates surpassed 10 cm/d. At low TP, increased inflow concentrations did notproduce higher exports of TP.
! Cotton strip assays in the test cells determined that decomposition ratesincreased as phosphorus loads increased. At low TP concentrations,decomposition rates were not affected by loading rates.
• Mesocosms
! Marsh dryout experiments are being conducted to determine the effects ofextreme drought and subsequent soil oxidation on nutrient release andretention when the marsh is reflooded. Preliminary results suggest that whilethe dryout/reflooding cycle does produce TP influx into the water column,this release lasts about one month. Total phosphorus flux into the watercolumn was less in tanks with emergent species present.
BACKGROUND AND ISSUES
EVERGLADES IMPACTS AND STORMWATER TREATMENT AREAS
The Everglades ecosystem has been degraded as a consequence of human activities. Impactsinclude land use changes such as urban and agricultural development, altered hydrology fromregional flood-control efforts, and nutrient enrichment from agricultural and urban runoff andLake Okeechobee water releases. Discussions of these impacts and their effects on theEverglades ecosystem are presented in the 1999 Everglades Interim Report (McCormick et al.,1999; Redfield et al., 1999; Sklar et al., 1999).
Everglades periphyton and plant communities are known to be extremely sensitive tophosphorus (P) availability. Excess P and changing hydrology are most responsible for negativeecological impacts occurring in the Everglades (Koch and Reddy, 1992; McCormick and O’Dell,

2001 Everglades Consolidated Report Chapter 6: STA Optimization
6-3
1996; McCormick et al., 1998). A reduction in total P (TP) input to this system is central to theDistrict’s Everglades restoration program. Part of the restoration program includes buildingSTAs, a series of large treatment wetlands. Under the Act, the District must initiate a research andmonitoring program to collect information necessary to optimize STA nutrient removalperformance. Regional environmental issues and Act requirements pertaining to the STAs arediscussed more fully in the Introduction (Chapter 1) of this Report.
STORMWATER TREATMENT AREA OPTIMIZATION RESEARCHPROGRAM
The STA Optimization Research and Monitoring Program mandated by the Act will assist theDistrict to develop operational strategies to maximize STA performance independent of othertechnologies. The STA Optimization Research and Monitoring Program is described in greaterdetail in Chimney and Moustafa (1999) and Chimney et al. (2000). Information is beingcompiled from four distinct research efforts:
• Practical experience gained from operating the ENRP and analysis of its performancedata
• Experiments conducted in the STA-1W test cells and mesocosms
• Analysis of data from other treatment wetlands, especially those located in South andCentral Florida
• Simulation of nutrient removal under different operating scenarios using a dynamic waterquality model.
CONSTRUCTION OF STA-1 WEST
The Everglades Nutrient Removal Project (ENRP) was a 1,545 hectares (ha) (3,819 acres)treatment wetland constructed by the District on land previously farmed for sugar cane, rice andvegetables (SFWMD, 1991). The ENRP served as a prototype STA (Chimney et al., 2000) andhas been incorporated into the footprint of STA-1 West (STA-1W; Figure 6-1). The ENRPceased to exist as a separate entity from both a regulatory and operations perspective with theissuance of the STA-1W NPDES [#FL0177962-001] and Everglades Forever Act [#503074709]operating permits in May 1999 and completion of key water control structures shortly thereafter.The operational and reporting requirements of FDEP operating permit #502232569 for the ENRProject have been superceded by these new permits.
Completion of treatment Cells 5A and 5B in STA-1W (Figure 6-1) increased the effectivetreatment area of this wetland from 1,545 ha to 2,699 ha (6,670 acres). Inflow now entersSTA-1W through gates at the G302 weir. Some of this flow is diverted into treatment Cell 5Athrough a series of culverts in a dividing levee, while the remainder enters treatment Cells 1through 4 through gates at the G303 structure. The G250 pump station has ceased handlingcombined inflow and seepage return waters and now handles seepage return exclusively. Thelevee separating the Buffer Cell and Treatment Cell 1 was degraded and these cells werecombined into an enlarged Treatment Cell 1.

Chapter 6: STA Optimization 2001 Everglades Consolidated Report
6-4
Water Storage Area
Inflow Pum ps
15 Lined Half-acre Wetlands
Outflow into the ENR
30” Diameter Inflow Feeder Pipe
Cell 5B
Cell 4
Cell 5A
S5A Pump Station
Cell 2 Cell 1
Cell 3
Direction of Flow
G256
G255
G250
G251
G310
G300
G302
G301
G303
G308
G259
G258G309
Figure 6-1. Stormwater Treatment Area 1-W and the test cells. Directional flowis illustrated for the existing and new water control structures in STA-1W and in the test cells. The north test cells are in Treatment Cell 1and the south test cells are in Treatment Cell 3.

2001 Everglades Consolidated Report Chapter 6: STA Optimization
6-5
Outflow from treatment Cells 3 and 4 still exits the system through the G251 pump station. Anew pump station (G310) was built to process all flow from treatment Cells 5A and 5B andexcess water from treatment Cells 3 and 4 during large storm events. Water will be released fromtreatment Cells 3 and 4 through the G258, G259, G308 and G309 structures into the canal leadingto G310.
CHAPTER OBJECTIVES
Detailed results from a number of individual studies that comprise the STA OptimizationResearch and Monitoring Program were presented and discussed at length in previous reports(Chimney and Moustafa, 1999; Chimney et al., 2000). The objectives of this chapter are topresent new findings and analyses completed since last year’s report and/or to provide an updateto ongoing activities that have generated sufficient new information. The primary focus of STAOptimization Research this year has been to document the performance of the treatment cells,improve the performance of treatment Cell 4, and conduct controlled hydrologic experiments inthe test cells.
HYDROLOGY AND PHOSPHORUS BUDGETS FORTREATMENT CELLS
Water and phosphorus budgets were calculated in the past for the entire ENRP and individualinterior cells (Chimney and Moustafa, 1999; Chimney et al., 2000; Nungesser and Chimney,2000). Construction activities associated with building STA-1W (such as installation of G303 andmodifications made to G250) resulted in a disruption of critical flow data needed to calculatethese budgets. Stage recorders installed at G303, the new primary source of inflow to treatmentCells 1 through 4, had not been fully calibrated by the end of April 2000 and could not be used tocalculate flow through this structure. While accurate flow measurements through G250 areavailable, they represent only part of the total inflow. As a result, water and phosphorus budgetscould not be updated for the entire STA-1W nor for Treatment Cell 1. Because the Buffer Cellwas incorporated into treatment Cell 1, no further budgets can be calculated for it. However,collection of accurate flow and water quality data continued in treatment Cells 2, 3 and 4 duringthis year (Table 6-1).
Table 6-1 reports the flow and total phosphorus budgets for treatment Cells 2, 3 and 4 for the5-year period from 1 May 1995 through 30 April 2000. Except for seepage into and out of thetreatment cells, the methods for calculating the water and nutrient budgets follow those defined inChimney et al. (2000). Seepage losses from the treatment cells had relied on the assumption thatthe seepage return canal water was isolated from other seepage sources. However, constructionhas intermingled water from the new Treatment Cell 5 and has periodically interrupted water flowin the seepage return canal. Because there are no consistent data upon which to estimate seepageout of the cells for Water Year 1999-2000, we estimated it as the mean for the same month inprevious years. Groundwater seepage into the treatment cells had relied upon stage gauges thatwere removed. A stage gauge located at the south end of the L-7 levee above the outflow pumpG-251 was substituted. Alternative methods to estimate seepage will be explored for future waterand nutrient budgets for STA-1W.

Chapter 6: STA Optimization 2001 Everglades Consolidated Report
������������������������
TrGRGSE
TrGRLLGSE
TrGRGGSE
TrGRDGS
TrGRSGDGS
TrGRDGS
2 P
Table 6-1. STA-1W Water Budget and Phosphorus Budget data for TreatmentCells 2, 3, and 4 from May 1995 through April 2000. Data areunavailable for treatment Cell 1 and for the entire ENRP for wateryear 1999-2000 because of alterations from construction andinstallation of monitoring equipment. See text for details.
6-6
��������������������������������������������������������������������������������������������������������������������������������������������������������������������������������������������������������������������������������������������������������������������������������������������������������������������������������������������������������������������������������������������������������������������������������������������������������������������������������������������������������������������������������������������������������������������������������������������������������������������������������������������������������������������������������������������������������������������������������������������������������������������������������������������������������������������������������������������������������������������������������
∆SSources of Flow hm3 cm/day % hm3 cm/day % hm3 % hm3
eatment Cell 2 - 05/01/95 to 04/30/2000255 449.0 7.44 94.2 -- -- -- -- -- --ainfall 27.8 0.46 5.8 -- -- -- -- -- --254 -- -- -- 418.1 6.92 79.0 -- -- --eepage -- -- -- 85.7 1.42 16.2 -- -- --vapotranspiration -- -- -- 25.6 0.42 4.8 -- -- --
TOTALS 476.8 7.9 100.0 529.4 8.8 100.0 -52.6 -11.0 0.22
eatment Cell 3 - 05/01/95 to 04/30/2000253 342.3 5.79 84.5 -- -- -- -- -- --ainfall 27.2 0.46 6.7 -- -- -- -- -- ---7 Surficial Seepage 12.4 0.21 3.1 -- -- -- -- -- ---7 Deep Seepage 23.4 0.40 5.8 -- -- -- -- -- --251-G256 -- -- -- 310.6 5.26 85.2 -- -- --eepage -- -- -- 28.3 0.48 7.8 -- -- --vapotranspiration -- -- -- 25.5 0.43 7.0 -- -- --
TOTALS 405.3 6.9 100.0 364.4 6.2 100.0 40.9 10.1 -0.29
eatment Cell 4 - 05/01/95 to 04/30/2000254 418.1 19.46 97.7 -- -- -- -- -- --ainfall 9.8 0.46 2.3 -- -- -- -- -- --256 -- -- -- 387.6 18.04 90.4 -- -- --258 -- -- -- 0.1 0.00 0.0 -- -- --eepage -- -- -- 32.1 1.49 7.5 -- -- --vapotranspiration -- -- -- 9.1 0.42 2.1 -- -- --
TOTALS 427.9 19.9 100.0 428.9 20.0 100.0 -1.0 -0.2 0.14
TP Sources kg g/m2/yr % kg g/m2/yr % kg g/m2/yr %2
eatment Cell 2 - 05/01/95 to 04/30/2000255 38,611 2.34 98.4 -- -- -- -- -- --ainfall 400 0.02 1.0 -- -- -- -- -- --ry Deposition 214 0.01 0.5 -- -- -- -- -- --254 -- -- -- 18,978 1.15 97.5 -- -- --eepage -- -- -- 496 0.03 2.5 -- -- --
TOTALS 39,225 2.37 100.0 19,474 1.18 100.0 19,751 1.19 50.4
eatment Cell 3 - 05/01/95 to 04/30/2000253 11,421 0.71 88.7 -- -- -- -- -- --ainfall 391 0.02 3.0 -- -- -- -- -- --urficial Seepage 136 0.01 1.1 -- -- -- -- -- --roundwater Seepage 725 0.04 5.6ry Deposition 209 0.01 1.6 -- -- -- -- -- --251-G256 -- -- -- 8,697 0.54 98.8 -- -- --eepage -- -- -- 109 0.01 1.2 -- -- --
TOTALS 12,882 0.80 100.0 8,806 0.54 100.0 4,076 0.25 31.6
eatment Cell 4 - 05/01/95 to 04/30/2000254 18,978 3.23 98.9 -- -- -- -- -- --ainfall 141 0.02 0.7 -- -- -- -- -- --ry Deposition 76 0.01 0.4 -- -- -- -- -- --256 -- -- -- 8,304 1.41 98.7 -- -- --eepage -- -- -- 107 0.02 1.3 -- -- --
TOTALS 19,195 3.26 100.0 8,411 1.43 100.0 10,784 1.83 56.2
ercent TP retained calculated relative to the amount of TP that entered only that individual cell.
PHOSPHORUS BUDGETInflow TP Load Outflow TP Load TP Retained
Outflow W ater LoadInflow W ater Load Remainder
WATER BUDGET

2001 Everglades Consolidated Report Chapter 6: STA Optimization
6-7
One of the estimated inflows to the ENRP in the water budgets is seepage from WaterConservation Area 1 (the Arthur R. Marshall Loxahatchee National Wildlife Refuge). In 1997,the USGS conducted extensive field monitoring of groundwater seepage into and out of theENRP from a series of wells installed along three transects positioned across treatment Cells 1, 2,3 and 4 in 1997 (Harvey et al., 2000). Results from this study supported the seepage rates used inour water budgets (Guardo and Prymas, 1998) in both magnitude and temporal pattern.
Inflow volumes for Treatment Cells 2 and 4 were consistent with those for prior years(Chimney et al., 2000, Table 6-5). However, flow-weighted inflow TP concentrations werehigher than previous years (Figure 6-2), particularly in Treatment Cell 2 where TP concentrationssurpassed any previous monthly values during 1999-2000. Inflow TP loading into Cell 2 hadaveraged 0.47 g/m2/yr over the previous four years in 1999; in 2000, it increased nearly five-foldto 2.37 g/m2/yr. For Cell 4, it was much higher as well, 3.26 g/m2/yr in 1999-2000, compared to2.34 g/m2/yr for the prior four years (Chimney et al., 2000):
Area loading (g/m2/yr Area retention (g/m2/yr) Retention (%) 1995-1999 1995-2000 1995-1999 1995-2000 1995-1999 1995-2000
Cell 2 0.47 2.37 0.65 1.19 36.4% 50.4%Cell 3 0.71 0.80 0.11 0.25 16.1% 31.6%Cell 4 2.34 3.26 1.10 1.83 46.9% 56.2%
Total phosphorus retention (the difference between inflow and outflow mass loadings) forTreatment Cells 2, 3 and 4 was much higher than that of prior years. TP retention in Cell 2 nearlydoubled to 1.19 g/m2/yr from 0.65 g/m2/yr (Chimney et al., 2000) and for Treatment Cell 4retention averaged 1.83 g/m2/yr versus 1.10 g/m2/yr. Retention for Cell 3 was similar to previousyears, although its performance exceeds that of prior years (Figure 6-2). TP retention in Cell 2increased dramatically and its value of 50.4 percent approached that of Cell 4 (56.2 percent)(Table 6-1).
With an overall TP retention rate of 56.2 percent, Cell 4 continued to outperform othertreatment cells, though Cell 2 performance increased dramatically as well (Table 6-1, Figure6-2). The two western flow-way cells retained a total of more than 30,500 kg of TP over theproject period. Treatment Cell 3 retained the least amount of TP based both on mass and on arealefficiency of TP removal, but its performance improved over this last year, as well. It should benoted that Cell 3 was the least loaded at a third to a quarter of the levels of Cells 2 and 4, and itsretention is therefore lower.
Wetland ecosystem behavior often varies with vegetation, hydrology, nutrients, area, shape,water depth, and other differences. Retention rates of TP (as a percent of inflow mass) in thetreatment cells have varied over time (Figure 6-3). Each water year has seen highly variableretention rates. Cell 2 has retained 42 to 58 percent of inflow TP consistently since 1995. Cell 3performance has improved over the last two years. The performance of Cell 4 has improved overthe project period, and has maintained consistently high retention rates. This cell has beenmanaged differently than the other three, maintained as open water and submerged aquaticvegetation; it is smaller in size, and is operated with shorter hydraulic residence times.

Chapter 6: STA Optimization 2001 Everglades Consolidated Report
6-8
CELL 3
0
20
40
60
80
100
120
140
160
180
Jul-9
5
Nov-9
5
Mar-9
6
Jul-9
6
Nov-9
6
Mar-9
7
Jul-9
7
Nov-9
7
Mar-9
8
Jul-9
8
Nov-9
8
Mar-9
9
Jul-9
9
Nov-9
9
Mar-0
0
TP
Co
nce
ntr
ati
on
su
g/L
CELL 2
0
20
40
60
80
100
120
140
160
180
Jul-9
5
Nov-9
5
Mar-9
6
Jul-9
6
Nov-9
6
Mar-9
7
Jul-9
7
Nov-9
7
Mar-9
8
Jul-9
8
Nov-9
8
Mar-9
9
Jul-9
9
Nov-9
9
Mar-0
0
TP
Co
nce
ntr
ati
on
s u
g/L
Outflow
Inflow
CELL 4
0
20
40
60
80
100
120
140
160
180
Jul-9
5
Nov-9
5
Mar-9
6
Jul-9
6
Nov-9
6
Mar-9
7
Jul-9
7
Nov-9
7
Mar-9
8
Jul-9
8
Nov-9
8
Mar-9
9
Jul-9
9
Nov-9
9
Mar-0
0
TP
Co
nce
ntr
ati
on
su
g/L
Water Year (1995-2000)
Figure 6-2. Monthly flow-weighted TP concentrations for Treatment Cells2, 3, and 4 for the period of record (1995-2000).

2001 Everglades Consolidated Report Chapter 6: STA Optimization
6-9
With the intent of improving its performance even further, a detailed analysis of hydrologicconditions in Cell 4 was performed. Under the supervision of District staff, DB EnvironmentalLaboratories (2000; App. A8-1) conducted a lithium tracer study to determine flow patterns inCell 4 to quantify short-circuiting which may reduce nutrient removal performance. The dyetracer study results showed that about 51 percent of the inflow water bypassed the submergedaquatic vegetation (SAV) and rapidly moved down existing borrow canal areas. Earthen plugswere constructed in the spring of 2000 to redistribute flow and reduce short-circuiting. A secondtracer study will be conducted during the upcoming water year to determine the effectiveness ofthese modifications. Future analyses will determine whether these modifications improved Cell 4performance.
Treatment cell data from 1995 through 1999 have been analyzed to determine not only howthe treatment cells are performing, but also whether their performances differ once physicaldifferences are accounted for. Differences between cells include nutrient retention rates (Table6-1), size, depth, area, hydraulic residence time, vegetation types and coverage (Table 6-2), andother factors. In an attempt to discern what effect these factors have on TP retention, we lookedat TP load reduction relative to cell size and TP inflow characteristics (Nungesser and Chimney,2000).
0
10
20
30
40
50
60
70
80
1995-96 1996-97 1997-98 1998-99 1999-2000
Water Year (1995-2000)
% T
P R
etai
ned
Cell 2Cell 3Cell 4Cell 1
Figure 6-3. Annual TP retention rates for treatment wetlands in STA-1W as apercent of the inflow TP mass.

Chapter 6: STA Optimization 2001 Everglades Consolidated Report
6-10
Table 6-2. Vegetation development in STA-1W Cells 1, 2, 3, and 4, and the BufferCell from May 1995 through April 1999. Units are hectares covered byvegetation type determined through aerial imagery and fieldvalidation.
Date 05/95 11/95 04/96 11/96 05/97 10/97 04/98 11/98 04/99BUFFER CELLcattail 23.6 22.4 21.7 22.8 23.6 24.1 23.4 23.5floating spp. 17.8 15.3 19.6 20.6 24.3 22.1 22.0 24.3other emergent spp. 7.7 8.3 8.7 8.4 4.5 5.3 4.8 4.5open H2O/sub. veg. 4.7 8.0 3.9 1.9 1.4 2.3 3.6 1.3TOTAL 53.7 53.9 54.0 53.7 53.7 53.8 53.7 53.7
CELL 1cattail 227.6 211.2 193.5 176.0 183.8 183.8 179.8 161.3 152.9floating spp. 21.4 51.1 29.0 65.1 21.0 24.5 16.1 26.5 28.7other emergent spp. 80.7 80.1 82.5 84.8 87.3 85.8 85.3 101.7 115.0open H2O/sub. veg. 194.3 183.0 219.0 199.0 233.0 230.3 243.0 235.5 228.0TOTAL 524.0 525.4 524.0 524.8 525.2 524.3 524.2 525.0 524.6
CELL 2cattail 335.3 341.9 336.7 316.4 312.5 269.9 230.0 189.9 190.1floating spp. 1.8 29.6 21.8 42.4 39.1 33.2 33.8 26.7 43.9other emergent spp. 15.6 8.9 11.0 10.0 10.5 5.6 5.5 4.1 9.5open H2O/sub. veg. 58.4 32.3 44.5 46.0 52.3 105.6 145.1 193.7 170.9TOTAL 411.2 412.7 413.9 414.7 414.4 414.4 414.3 414.4 414.3
CELL 3cattail 99.7 126.7 137.2 153.3 164.2 171.1 178.9 188.7 192.4floating spp. 0.2 2.7 2.6 8.0 5.8 3.3 1.5 5.8 3.9other emergent spp. 197.2 188.3 187.2 185.0 178.9 179.4 175.5 167.3 169.2open H2O/sub. veg. 105.5 85.2 79.0 60.7 57.7 52.4 49.7 45.0 41.0TOTAL 402.6 402.9 405.9 407.0 406.6 406.2 405.7 406.7 406.4
CELL 4cattail 1.9 3.1 3.7 5.0 5.2 5.1 5.0 6.4 7.0floating spp. 0.0 2.1 1.2 3.2 2.3 1.1 0.5 0.4 1.2other emergent spp. 5.4 0.7 0.6 1.6 2.2 2.1 1.9 1.4 1.1open H2O/sub. veg. 140.0 141.6 141.1 137.0 137.2 138.4 139.5 138.4 137.4
2001 Everglades Consolidated Report Chapter 6: STA Optimization
6-11
To account for loading differences among cells, we weighted TP load reduction by the area ofthe treatment cell. Because the treatment cells were loaded differently, performance among thesecells was evaluated statistically in a one-way analysis of covariance (ANCOVA) of unit-area TPload reduction, using inflow TP as a covariate. All data were log transformed prior to analysis.The ANCOVA model tested for homogeneity of slopes among treatment cells. The comparisonof 3-month moving averages was followed by a post hoc least squares mean test using SAS (ProcGLM, SAS Institute Inc. Cary, NC) to discriminate among treatment cells.
The ANCOVA of TP retention detected significant differences among treatment cells (Table6-3). The least squares means test declared all cells to be statistically different from each otherwith the exception of Cells 2 and 3. The regression model resulting from the ANCOVAaccounted for almost all the variance in TP retention (R2=0.9978). The inverse relationshipbetween smaller size and higher removal efficiency is at first counterintuitive, although similarfindings have been reported for other treatment wetlands (Li, 2000). These results may beproduced by differences between flow-ways in hydraulic residence time (HRT), operating depths,vegetation characteristics, and/or the influence of seepage into the eastern flow-way from WaterConservation Area 1 (WCA-1).
A previous analysis (Chimney et al., 2000) compared three-month rolling average TP settlingrates with TP loading rates, hydraulic loading rates, water depth, and nominal hydraulic residencetime (Figures 6-27 through 6-34 in Chimney et al., 2000). The settling rates were positivelycorrelated with the first three factors and negatively with nominal hydraulic residence time exceptin the Buffer Cell and treatment Cell 3. Flow-weighted outflow TP concentrations werepositively correlated with TP and hydraulic loading rates and negatively correlated with nominalhydraulic residence time. Flow-weighted outflow TP was positively correlated with water depthin the Buffer Cell and treatment Cell 3, negative for treatment Cell 4, and not significant for thetreatment Cells 1 and 2.
Results of the ANCOVA and the correlation analyses suggest that management strategiesinvolving manipulation of water depth, HRT, vegetation type, and nutrient loading may alterphosphorus retention in the STAs. Further analysis of data from the District’s STA OptimizationResearch Program will help clarify these relationships.

Chapter 6: STA Optimization 2001 Everglades Consolidated Report
6-12
Table 6-3. Summary of analysis of covariance of total phosphorus retained withtotal phosphorus loading (3-month moving unit-area values) in theinterior cells of STA-1W from May 1995 through April 1999. All datawere log transformed prior to analysis.
Sum of MeanSource DF Squares Square F value P > F
Model 9 548.5 60.9 10506.4 <0.0001Treatment Cells 4 2.1 0.5 90.7 <0.0001TP Load 1 131.4 131.4 22652.8 <0.0001Cells*TP Load 4 <0.1 <0.1 1.83 0.1236
Error 210 1.2 <0.1Corrected Total 219 549.7 R2 = 0.9978
Least Squares MeansGroupinga Meanb Cell
A 1.2323 BufferB 0.2066 4C -0.8338 3C -0.8328 2D -1.0913 1
aTreatment Cell Means with the same letter are not significantly different.bTreatment Cell Means have been adjusted for the covariate, TP load

2001 Everglades Consolidated Report Chapter 6: STA Optimization
6-13
VEGETATION AND PEAT ACCRETION
Spatial and temporal changes in the composition of the vegetation community in the ENRPwas monitored through a combination of aerial overflight imagery and field verification(Chimney et al., 2000). Fourteen overflights were conducted from October 1993 through April1999. Although a total of 20 different vegetation types was identified, the data presented here aresummarized into four major categories: cattail, open water/submerged aquatic vegetation, floatingmacrophytes and other emergent macrophytes. Vegetation mapping of the ENRP was a conditionof the expired FDEP operating permit and has been discontinued. One more overflight toconstruct a base map of STA-1W is required by the NPDES operating permit, but no furtherregular overflights are scheduled. A discussion of vegetation changes is provided in Chimney etal. (2000).
The composition of the vegetation community in Cells 1, 3 and 4 changed little over the pasttwo years (Table 6-2). However, the vegetation in Cell 2 has shifted markedly since 1997 fromdominance by cattails to expansion of open water and submerged aquatic vegetation (SAV).Water levels were 10 to 30 cm deeper during this time, and these levels may have promoted lossof cattail and expansion of open water and submerged vegetation.
The annual peat accretion rate was measured at a number of locations throughout the ENRPusing feldspar horizon markers from mid-1995 through mid-1999 at a series of sites in thewetland to provide a clear demarcation of post-operation sediment accumulation. Field andlaboratory methodologies are detailed in Chimney et al. (2000). Median accretion for the entireENRP (Figure 6-4) appeared to slow markedly during the first three years of monitoring (34.5,19.6 and 8.1 mm/yr, respectively) but remained relatively constant from year 3 to year 4 (8.5mm/yr). These changes are attributed to two possible factors: (1) compaction of materialdeposited during the first years of operation and/or (2) a real decrease in production of plantdetritus as the vegetation community shifted from rapid accumulation of new biomass duringplant colonization and subsequent production of detritus to the maintenance of existing biomassas the community matured.

Chapter 6: STA Optimization 2001 Everglades Consolidated Report
6-14
STA-1W TEST CELL RESEARCH
The District is conducting experiments in the test cells to determine hydrologic conditionsthat affect STA performance. The size, vegetation diversity, and hydrologic complexity of thetreatment cells within an STA render them difficult to conduct controlled experiments. The testcells were designed and constructed to provide sites for controlled research experiments. Theseexperiments include management strategies that maximize TP removal efficiencies as well asthose that may cause noncompliance in the STAs. The STA-1W test cells are shallow, rectangularwetlands, approximately 0.2 ha in size. They are arranged into two groups of 15 cells, halflocated in the north and half in the south STA-1W (Newman and Lynch, 2000; Figure 6-1). Tentest cells are in use for STA Optimization research experiments, six at the north and four at thesouth. Vegetation in the test cells consists primarily of dense stands of Typha species (cattails)with incidental populations of submerged aquatic vegetation (SAV) and periphyton communities(Chimney et al., 2000). The remaining wetlands are being used for Advanced TreatmentTechnology (Chapter 8) and Marsh Dry Out research projects. The hydrology, calibration,experimental design, and preliminary water quality evaluation were detailed in Chimney et al.(2000).
Experiments were designed to determine system response to various hydrologic conditions atthe north and south test cells. The hydraulic loading rates (HLR) and water depths are altered,with two test cells at each location acting as controls. The HLR experiments measure the effect ofdecreasing and increasing HLR, thereby increasing and decreasing hydraulic residence time,respectively, on TP removal efficiencies. The depth experiments will maintain a constant inflowrate while altering depth. The two control test cells at both the north and south sites are operatedat a mean HLR of 2.7 cm/d and a nominal depth of 0.6 m, which approximates the average designconditions for the STAs (Walker, 1991). While the depth is held constant, the HLR for two northtest cells and one south test cell are incrementally decreased by 50 percent, thereby increasing
Year 1 Year 2 Year 3 Year 4
Se
dim
en
t D
ep
os
itio
n (
mm
/yr)
10
20
30
40
50
60
70
Figure 6-4. Annualized sediment deposition in the STA-1W treatment cells.
2001 Everglades Consolidated Report Chapter 6: STA Optimization
6-15
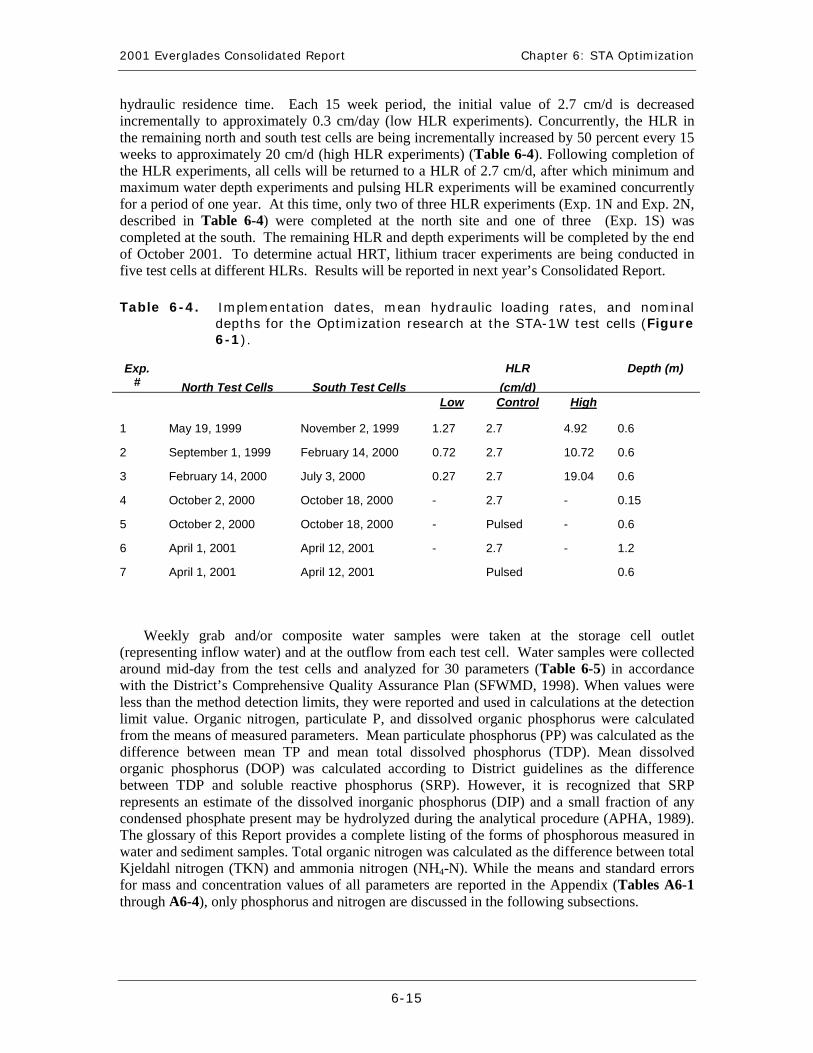
hydraulic residence time. Each 15 week period, the initial value of 2.7 cm/d is decreasedincrementally to approximately 0.3 cm/day (low HLR experiments). Concurrently, the HLR inthe remaining north and south test cells are being incrementally increased by 50 percent every 15weeks to approximately 20 cm/d (high HLR experiments) (Table 6-4). Following completion ofthe HLR experiments, all cells will be returned to a HLR of 2.7 cm/d, after which minimum andmaximum water depth experiments and pulsing HLR experiments will be examined concurrentlyfor a period of one year. At this time, only two of three HLR experiments (Exp. 1N and Exp. 2N,described in Table 6-4) were completed at the north site and one of three (Exp. 1S) wascompleted at the south. The remaining HLR and depth experiments will be completed by the endof October 2001. To determine actual HRT, lithium tracer experiments are being conducted infive test cells at different HLRs. Results will be reported in next year’s Consolidated Report.
Table 6-4. Implementation dates, mean hydraulic loading rates, and nominaldepths for the Optimization research at the STA-1W test cells (Figure6-1).
Exp.# North Test Cells South Test Cells
HLR
(cm/d)
Depth (m)
Low Control High
1 May 19, 1999 November 2, 1999 1.27 2.7 4.92 0.6
2 September 1, 1999 February 14, 2000 0.72 2.7 10.72 0.6
3 February 14, 2000 July 3, 2000 0.27 2.7 19.04 0.6
4 October 2, 2000 October 18, 2000 - 2.7 - 0.15
5 October 2, 2000 October 18, 2000 - Pulsed - 0.6
6 April 1, 2001 April 12, 2001 - 2.7 - 1.2
7 April 1, 2001 April 12, 2001 Pulsed 0.6
Weekly grab and/or composite water samples were taken at the storage cell outlet(representing inflow water) and at the outflow from each test cell. Water samples were collectedaround mid-day from the test cells and analyzed for 30 parameters (Table 6-5) in accordancewith the District’s Comprehensive Quality Assurance Plan (SFWMD, 1998). When values wereless than the method detection limits, they were reported and used in calculations at the detectionlimit value. Organic nitrogen, particulate P, and dissolved organic phosphorus were calculatedfrom the means of measured parameters. Mean particulate phosphorus (PP) was calculated as thedifference between mean TP and mean total dissolved phosphorus (TDP). Mean dissolvedorganic phosphorus (DOP) was calculated according to District guidelines as the differencebetween TDP and soluble reactive phosphorus (SRP). However, it is recognized that SRPrepresents an estimate of the dissolved inorganic phosphorus (DIP) and a small fraction of anycondensed phosphate present may be hydrolyzed during the analytical procedure (APHA, 1989).The glossary of this Report provides a complete listing of the forms of phosphorous measured inwater and sediment samples. Total organic nitrogen was calculated as the difference between totalKjeldahl nitrogen (TKN) and ammonia nitrogen (NH4-N). While the means and standard errorsfor mass and concentration values of all parameters are reported in the Appendix (Tables A6-1through A6-4), only phosphorus and nitrogen are discussed in the following subsections.

Chapter 6: STA Optimization 2001 Everglades Consolidated Report
6-16
Table 6-5. Physical and chemical parameters monitored at inflow and outflowstations located at the STA-1W test cells.
Total phosphorus Dissolved oxygen Total suspended solids
Total dissolved phosphorus Temperature Total dissolved solids
Soluble reactive phosphorus pH Total organic carbon
Total nitrogen Specific conductance Dissolved organic carbon
Total Kjeldahl nitrogen Stage Total inorganic carbon
Total Dissolved Kjeldahl nitrogen Flow Alkalinity
Ammonia nitrogen Aluminum Calcium
Nitrate-nitrite nitrogen IronPotassium
Potassium
Silica Magnesium Sodium
Sulfate Manganese Zinc
Chloride Molybdenum
RESULTS
North Site Experiments (Exp. 1N and Exp. 2N)
Mean inflow TP concentrations at the north site were 0.077 and 0.104 mg/L during Exp. 1Nand Exp. 2N, respectively (Table 6-6). Mean outflow TP concentrations were lower than meaninflow, and exceeded the interim Phase 1 target of 0.050 mg/L only for the highest HLR tested(Figure 6-5). At low HLR, mean outflow TP values were significantly lower than mean outflowTP values produced by the high HLR trials. Generally, outflow TP concentrations increased asHLR increased.
Mean north site inflow total dissolved phosphorus (TDP) concentrations during Exp. 1N andExp. 2N were 0.044 mg/L and 0.065 mg/L, respectively. Mean outflow TDP values were lowerthan inflow (Table 6-6). For the low and control trials, TDP mean outflow concentrations weresimilar but increased for high HLR trials (Figure 6-5).
2001 Everglades Consolidated Report Chapter 6: STA Optimization
6-17
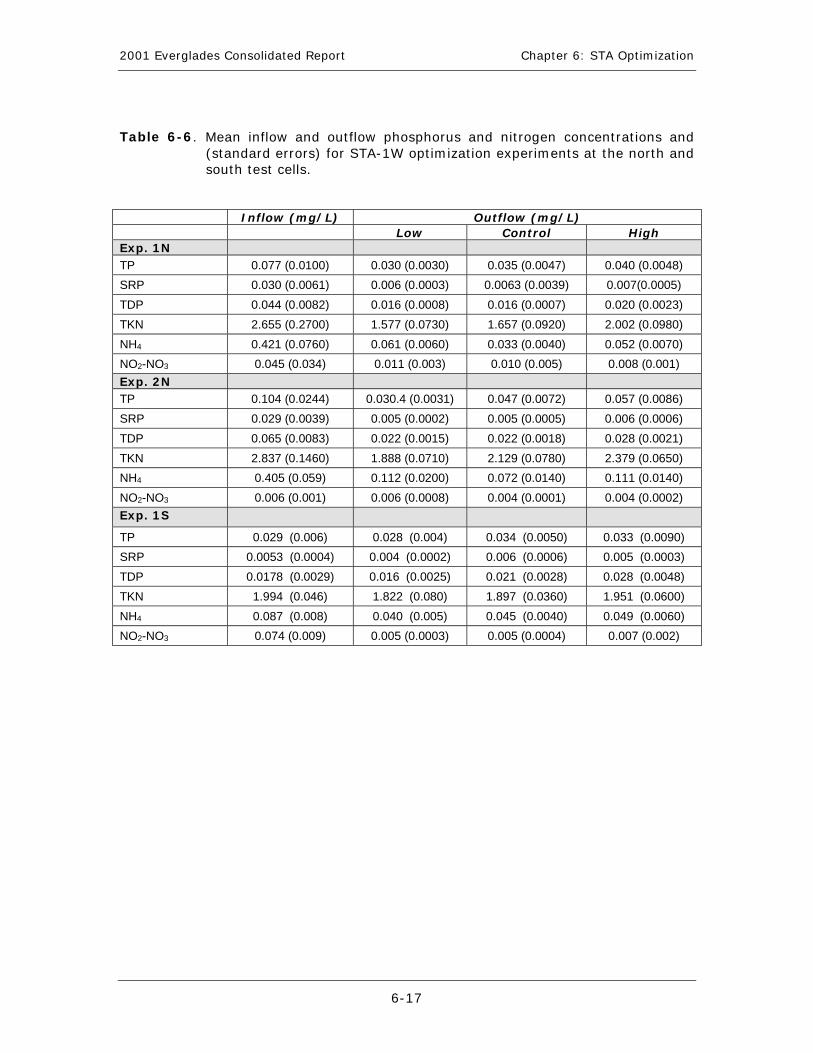
Table 6-6. Mean inflow and outflow phosphorus and nitrogen concentrations and(standard errors) for STA-1W optimization experiments at the north andsouth test cells.
Inflow (mg/L) Outflow (mg/L)Low Control High
Exp. 1NTP 0.077 (0.0100) 0.030 (0.0030) 0.035 (0.0047) 0.040 (0.0048)
SRP 0.030 (0.0061) 0.006 (0.0003) 0.0063 (0.0039) 0.007(0.0005)
TDP 0.044 (0.0082) 0.016 (0.0008) 0.016 (0.0007) 0.020 (0.0023)
TKN 2.655 (0.2700) 1.577 (0.0730) 1.657 (0.0920) 2.002 (0.0980)
NH4 0.421 (0.0760) 0.061 (0.0060) 0.033 (0.0040) 0.052 (0.0070)
NO2-NO3 0.045 (0.034) 0.011 (0.003) 0.010 (0.005) 0.008 (0.001)
Exp. 2NTP 0.104 (0.0244) 0.030.4 (0.0031) 0.047 (0.0072) 0.057 (0.0086)
SRP 0.029 (0.0039) 0.005 (0.0002) 0.005 (0.0005) 0.006 (0.0006)
TDP 0.065 (0.0083) 0.022 (0.0015) 0.022 (0.0018) 0.028 (0.0021)
TKN 2.837 (0.1460) 1.888 (0.0710) 2.129 (0.0780) 2.379 (0.0650)
NH4 0.405 (0.059) 0.112 (0.0200) 0.072 (0.0140) 0.111 (0.0140)
NO2-NO3 0.006 (0.001) 0.006 (0.0008) 0.004 (0.0001) 0.004 (0.0002)
Exp. 1S
TP 0.029 (0.006) 0.028 (0.004) 0.034 (0.0050) 0.033 (0.0090)
SRP 0.0053 (0.0004) 0.004 (0.0002) 0.006 (0.0006) 0.005 (0.0003)
TDP 0.0178 (0.0029) 0.016 (0.0025) 0.021 (0.0028) 0.028 (0.0048)
TKN 1.994 (0.046) 1.822 (0.080) 1.897 (0.0360) 1.951 (0.0600)
NH4 0.087 (0.008) 0.040 (0.005) 0.045 (0.0040) 0.049 (0.0060)
NO2-NO3 0.074 (0.009) 0.005 (0.0003) 0.005 (0.0004) 0.007 (0.002)

Chapter 6: STA Optimization 2001 Everglades Consolidated Report
6-18
Figure 6-5. Mean total phosphorus, total dissolved phosphorus, and solublereactive phosphorus for the inflow and outflow for the controls, low,and high HLR experiments in the STA-1W test cells.
North Test CellsExperiment 2
TP TDP SRP
Ph
os
ph
oru
s c
on
ce
ntr
ati
on
(m
g/L
)
0.00
0.02
0.04
0.06
0.08
0.10
0.12
North Test CellsExperiment 1
TP TDP SRP
Ph
os
ph
oru
s c
on
ce
ntr
ati
on
(m
g/L
0.00
0.02
0.04
0.06
0.08
0.10
0.12
InflowLow OutflowControl OutflowHigh Outflow
South Test CellsExperiment 1
TP TDP SRP
Ph
os
ph
oru
s c
on
ce
ntr
ati
on
(m
g/L
)
0.00
0.02
0.04
0.06
0.08
0.10
0.12
2001 Everglades Consolidated Report Chapter 6: STA Optimization
6-19
Mean inflow soluble reactive phosphorus (SRP) concentrations were 0.030 mg/L and 0.029mg/L during Exp. 1N and Exp. 2N, respectively (Table 6-6). All experimental trials producedmean SRP outflow concentrations ranging from 0.005 mg/L to 0.007 mg/L and were not affectedby changes in HLR (Figure 6-5). During both HLR experiments, 25 to 81 percent of outflowSRP values were below the method detection limit (0.004 mg/L).
While nutrients can be categorized into four main fractions (dissolved and particulateinorganics and dissolved and particulate organics), we aggregated the particulate constituents intoone category. Therefore, TP is comprised of dissolved inorganic phosphorus (DIP, also referredto as SRP), dissolved organic phosphorus (DOP), and particulate phosphorus (PP). Inflow TPconcentration characteristics differed between Exp. 1 and Exp. 2 at the north site (Figure 6-6).During Exp. 1N, inflow TP concentration consisted of approximately 40 percent each of DIP andPP with DOP the remainder. In Exp. 2N, inflow concentrations consisted of approximately equalproportions of P species.
Although inflow TP species characteristics differed from Exp. 1N to Exp. 2N, outflowcharacteristics were similar. Generally, DIP<DOP<PP except at the lowest HLR tested, whenconcentrations of DOP exceeded PP (Figure 6-6). Additionally, Exp. 1N outflow concentrationsof DOP and PP increased as HLR increased for control and high HLR relative to inflow. DuringExp. 2N, only PP outflow concentrations changed relative to HLR. As previously mentioned,DIP was unaffected by changes in HLR and remained close to minimum detection levels for allHLR.
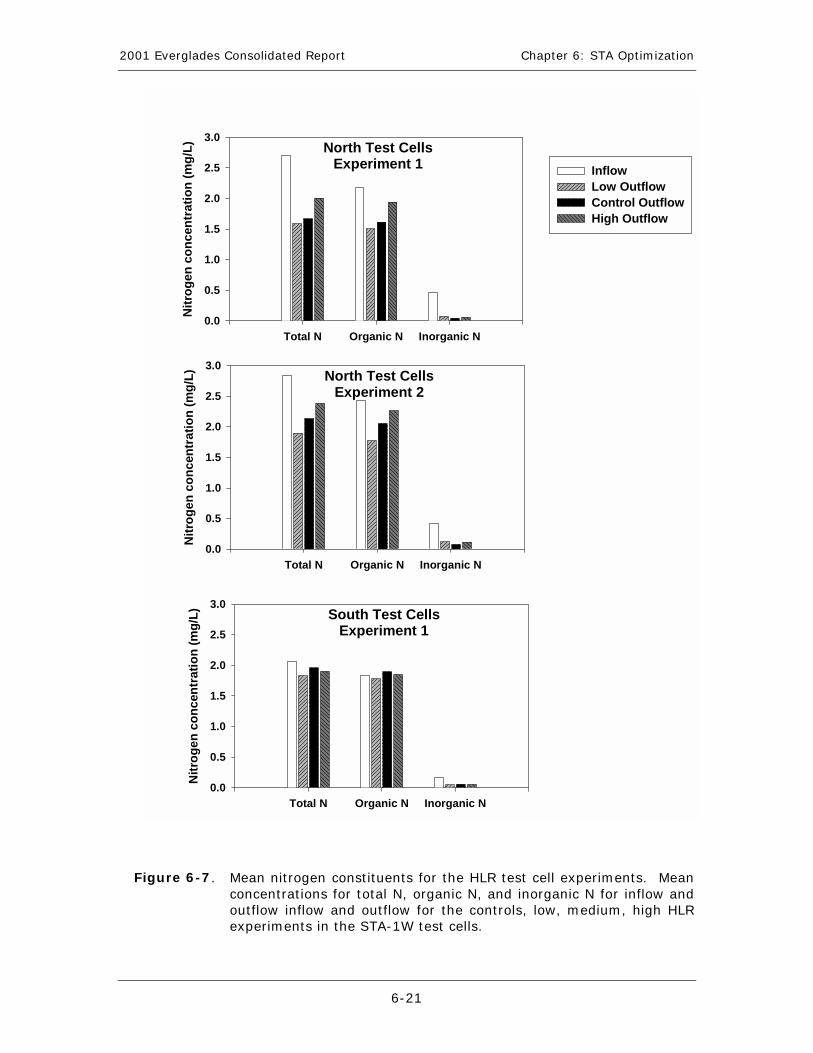
Mean outflow nitrogen concentrations ranged from 1.588 mg/L to 2.383 mg/L, less thanmean inflow concentrations of approximately 2.77 mg/L (Figure 6-7). Mean total nitrogen (TN)outflow concentrations generally increased as loading rate increased, although this trend wasmore pronounced during Exp. 2N. Organic nitrogen was the predominant form of nitrogen atboth inflow and outflow sites, with inorganic nitrogen preferentially being taken up within thewetlands (Figure 6-7). Within an experimental trial, mean outflow organic nitrogenconcentrations generally increased as the HLR increased, ranging from 1.505 mg/L to 2.264mg/L. Mean outflow inorganic nitrogen concentrations did not change in response to changes inHLR, representing less than 10 percent of the outflow nitrogen concentration for all experimentaltrials.

Chapter 6: STA Optimization 2001 Everglades Consolidated Report
6-20
North Test CellsExperiment 1
Inflow Low Outflow Control Outflow High Outflow
Pe
rcen
t o
f P
ho
sp
ho
rus
Sp
ecie
s
0
10
20
30
40
50
60
70
North Test CellsExperiment 2
Inflow Low Outflow Control Outflow High Outflow
Pe
rcen
t o
f P
ho
sp
ho
rus
Sp
ecie
s
0
10
20
30
40
50
60
70
DIPDOPPP
South Test CellsExperiment 1
Inflow Low Outflow Control Outflow High Outflow
Pe
rcen
t o
f P
ho
sp
ho
rus
Sp
ecie
s
0
10
20
30
40
50
60
70
Figure 6-6. Phosphorus constituents (mean percent dissolved inorganic, dissolvedorganic, and particulate phosphorus) for the inflow and outflow in theSTA-1W test cells.
2001 Everglades Consolidated Report Chapter 6: STA Optimization
6-21
Figure 6-7. Mean nitrogen constituents for the HLR test cell experiments. Meanconcentrations for total N, organic N, and inorganic N for inflow andoutflow inflow and outflow for the controls, low, medium, high HLRexperiments in the STA-1W test cells.
North Test CellsExperiment 1
Total N Organic N Inorganic N
Nit
rog
en
co
nc
entr
ati
on
(m
g/L
)
0.0
0.5
1.0
1.5
2.0
2.5
3.0
North Test CellsExperiment 2
Total N Organic N Inorganic N
Nit
rog
en
co
nc
entr
ati
on
(m
g/L
)
0.0
0.5
1.0
1.5
2.0
2.5
3.0
InflowLow OutflowControl OutflowHigh Outflow
South Test CellsExperiment 1
Total N Organic N Inorganic N
Nit
rog
en c
on
cen
trat
ion
(m
g/L
)
0.0
0.5
1.0
1.5
2.0
2.5
3.0

Chapter 6: STA Optimization 2001 Everglades Consolidated Report
6-22
South Site Experiments (Exp. 1S)
Only one experiment was completed for the south test cells during this reporting period. Themean inflow TP concentration for the HLR experiments was 0.029 mg/L, lower than mean inflowconcentrations at the north site and below the interim Phase 1 target of 0.050 mg/L (Table 6-6).No affect was seen in this treatment (Figure 6-5). Approximately 62 percent of the total P at theinflow was in the dissolved phase. Mean TDP outflow concentrations were approximately thesame as inflow levels for the low flow experiment. These concentrations generally increased asHLR increased. Mean SRP concentrations at the inflow and outflow were similar. More thanhalf of the inflow and outflow values were less than or equal to the minimum detection limit of0.004 mg/L. Inflow and outflow TN concentrations were similar (Figure 6-7) at the south testcells. As observed at the north site, organic nitrogen was the predominant form of nitrogen,comprising more than 90 percent of the TN.
Mass
For the Water Year 1999-2000, separate water balances were calculated for each test cell.Balances were calculated only when data were available for a full year. The balance is based ondaily inflows, outflow and change in storage capacity using the general water mass balanceequation:
I – O + RO - ET = !S + r (1)
where:
I = inflow water volume to the test cell (m3)
O = outflow water volume from the test cell (m3)
RO = runoff water volume to the test cell (m3)
ET = evapotranspiration (m3)
!S = change in storage capacity within the test cell (m3), and
r = residuals of the water budget (m3).
A calibrated tipper bucket was used to verify the inflows for each HLR (Chimney et al.,2000). For the north test cells, the residuals (which include unmeasured components andmeasurement error) ranged from 16.27 to -15.87 percent during water year 1999-2000 (Table6-7). Surveys of various lake and wetland water balance studies showed that it is not uncommonfor residuals to range from 10 to 20 percent in either direction (Winter, 1981).

2001 Everglades Consolidated Report Chapter 6: STA Optimization
6-23
Table 6-7. Water balance at STA-1W north test cells from May 1, 1999 to April 30,2000.
Test Cell Number Inflow (m3) Outflow (m3) Residuals (%)
TC 07N Low 8418 9130 -8.45
TC 08N Low 8119 8224 -1.29
TC 05N Control 25,331 22,479 11.26
TC 10N Control 26,953 31,230 -15.87
TC 06N High 93,572 78,347 16.27
TC 09N High 88,890 76,395 14.06
Higher inflow HLR resulted in more phosphorus mass exported from the test cells thantreatments with lower HLR. At the north site, an average 0.68 g P/m2/yr and 2.12 g P/m2/yr wereexported from the high HLR experimental cells and 0.14 g P/m2/yr and 0.12 g P/m2/yr wereexported from the low HLR experimental cells (Figure 6-8). Similar trends were noted at thesouth site. However, low inflow concentrations produced a smaller phosphorus mass export fromthe south than wetlands operating at similar HLR in the north site. Mass TP retention at the northsite ranged between 30 and 52 percent with retention during low load experiments slightly higherthan for high load experiments (Figure 6-9). At the south site, only the low HLR wetland retainedTP. Both the control and high HLR wetlands experienced a small net export of TP mass.
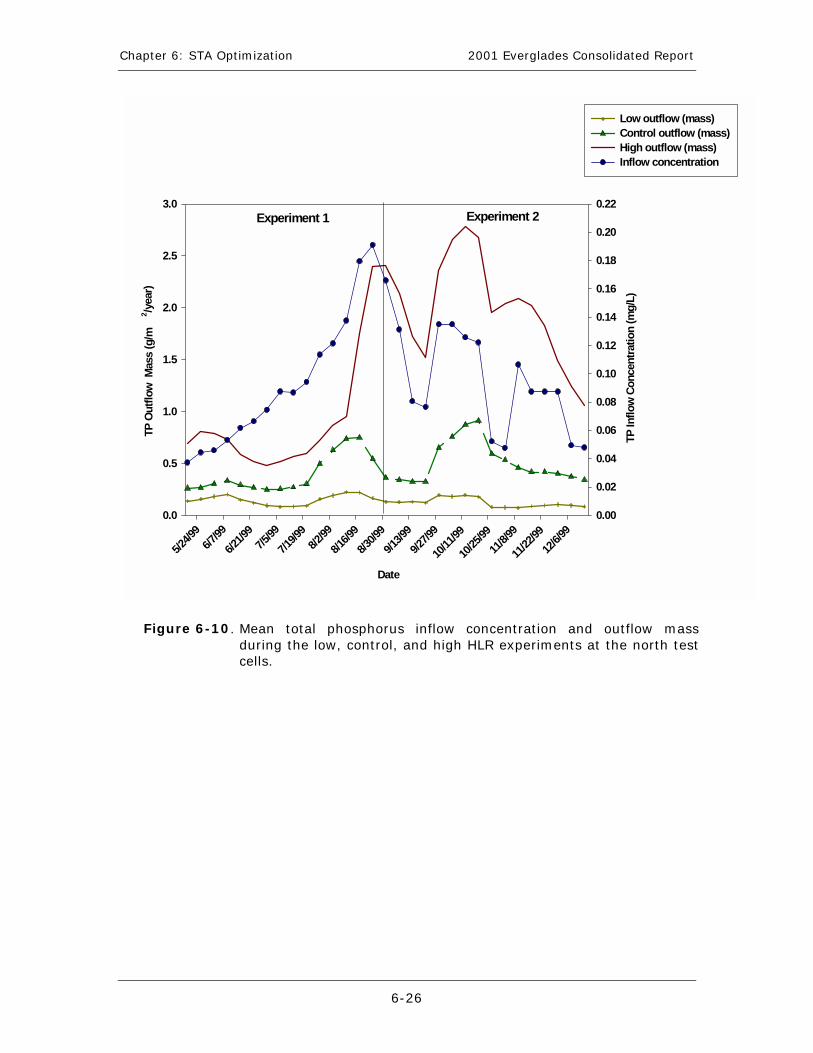
At higher HLR, the TP mass exported from the system was generally related to changes in theinflow TP concentration (ranging between 0.04 mg-P/L and 0.20 mg-P/L). Total phosphorusexport peaked when influent TP concentrations spiked (Figure 6-10). However, at low HLR, theTP mass exported was independent of influent TP concentrations. These results indicate thatthese test cells were able to process all TP regardless of influent TP concentrations at low HLR.
The north and south sites differed not only in inflow TP concentrations but also in thewetlands’ responses to changes in HLR. Early results suggest that this response difference can beattributed to the lower mass loading at the south site. Preliminary north site results indicate thatoutflow TP concentration increased with increasing HLR. A mean HLR of 10.72 cm/d producedan outflow concentration just above the interim target of 50 ppb. At the south site, increased HLRhad no direct effect on outflow TP concentration levels and these wetland systems were operatingat steady state for TP concentration. Further support of these findings was provided at the northsite when TP mass export increased only when TP inflow concentrations spiked at higher TPloading levels. At lower TP loadings, TP mass export was unaffected by increased TP inflowconcentrations.
SRP responded differently than TP. While soluble reactive phosphorus made up a greaterportion of the inflow TP at the north site than at the south, mean outflow SRP concentrationvalues at all sites during all experiments were very close to the method detection limit. These lowvalues indicate SRP limitation within these systems, and even at extremely low residence times,wetland plants and animals are able to utilize almost all available phosphorus.

Chapter 6: STA Optimization 2001 Everglades Consolidated Report
6-24
Figure 6-8. Mean total phosphorus mass for the inflow and outflow during the low,control, and high HLR experiments in the STA-1W test cells.
Control HLR
In Out In Out In Out
TP
Mas
s (g
/m2 /y
r)
0.0
0.5
1.0
1.5
2.0
2.5
3.0
Low HLR
In Out In Out In Out
TP
Mas
s (g
/m2/y
r)
0.0
0.2
0.4
0.6
0.8
North Exp1North Exp2South Exp1
High HLR
In Out In Out In Out
TP
Mas
s (g
/m2 /y
r)
0
2
4
6
8
10

2001 Everglades Consolidated Report Chapter 6: STA Optimization
6-25
Low Control High
Hydraulic Loading Rate
North Test Cells
Exp 1 Exp 2 Exp 1 Exp 2 Exp 1 Exp 2
% T
P M
ass
Ret
enti
on
0
10
20
30
40
50
60
70
80
90
100
South Test Cells
% T
P M
ass
Ret
enti
on
-15
-10
-5
0
5
10
15
HighControlLow
Hydraulic Loading Rate
Figure 6-9. Mean percent mass retention for total phosphorus during the low,control, and high HLR experiments in the STA-1W test cells.
Chapter 6: STA Optimization 2001 Everglades Consolidated Report
6-26
Date
5/24/9
96/7
/99
6/21/9
97/5
/99
7/19/9
98/2
/99
8/16/9
9
8/30/9
9
9/13/9
9
9/27/9
9
10/11
/99
10/25
/99
11/8/
99
11/22
/99
12/6/
99
TP O
utf
low
Mas
s (g
/m2 /y
ear)
0.0
0.5
1.0
1.5
2.0
2.5
3.0
TP In
flo
w C
onc
entr
atio
n (m
g/L
)
0.00
0.02
0.04
0.06
0.08
0.10
0.12
0.14
0.16
0.18
0.20
0.22
Low outflow (mass)Control outflow (mass)High outflow (mass)Inflow concentration
Experiment 1 Experiment 2
Figure 6-10. Mean total phosphorus inflow concentration and outflow massduring the low, control, and high HLR experiments at the north testcells.
2001 Everglades Consolidated Report Chapter 6: STA Optimization
6-27
DECOMPOSITION STUDIES
Decomposition of plant cellulose is an important component of nutrient cycling in wetlandsand can provide a significant nutrient source to the system (Harrison et al., 1988). Factorsaffecting the rates at which plant material is broken down include temperature, pH, dissolvedoxygen, and nutrient availability. Cotton strip assays are a good indicator of natural cellulosedecomposition rates (Maltby, 1985). Cotton strip assays were used to determine the effects ofnutrient concentration and hydraulic loading rate on cellulose mineralization within the test cells.
Cotton strip assays were performed using a technique similar to Maltby (1985). A stainlesssteel frame supporting three 12-cm by 30-cm strips was inserted 15 cm deep into the soil for oneweek. Half the cotton strip was in the sediment and half was in the water column to comparedecomposition environments in these media. Four replicate strips were located within emergentand submerged vegetation at the inflow and outflow regions. Upon removal, the strips were cutinto 2-cm increments, 10-cm above the soil surface and 10-cm below the soil surface. The stripswere frayed by hand until a single thread could be removed intact along the length of the cut edgeto assure a constant cotton strip width to avoid bias from weak or torn threads. Each strip wassoaked in water and blotted dry to remove excess water and simulate 100 percent humidity.Tensile strength of these strips was measured using a Chatillon TCD-200 tensiometer equippedwith a digital force gauge (DFIS 200, Chatillon, Greensboro, NC). The tensiometer applied forceto the strip until it tore. Tensile strengths were adjusted to correct for the loss in tensile strength ofa field control strip. The data were linearized and expressed as annual cotton rotting rates (CRR)over time, calculated as:
CR = 3 /)( yyyo − (2)
CRR = (CR/t)*365 (3)
where CR = rottenness
y0 = mean tensile strength of control strip
y = mean tensile strength of the test strip at a given depth
t = duration of burial.
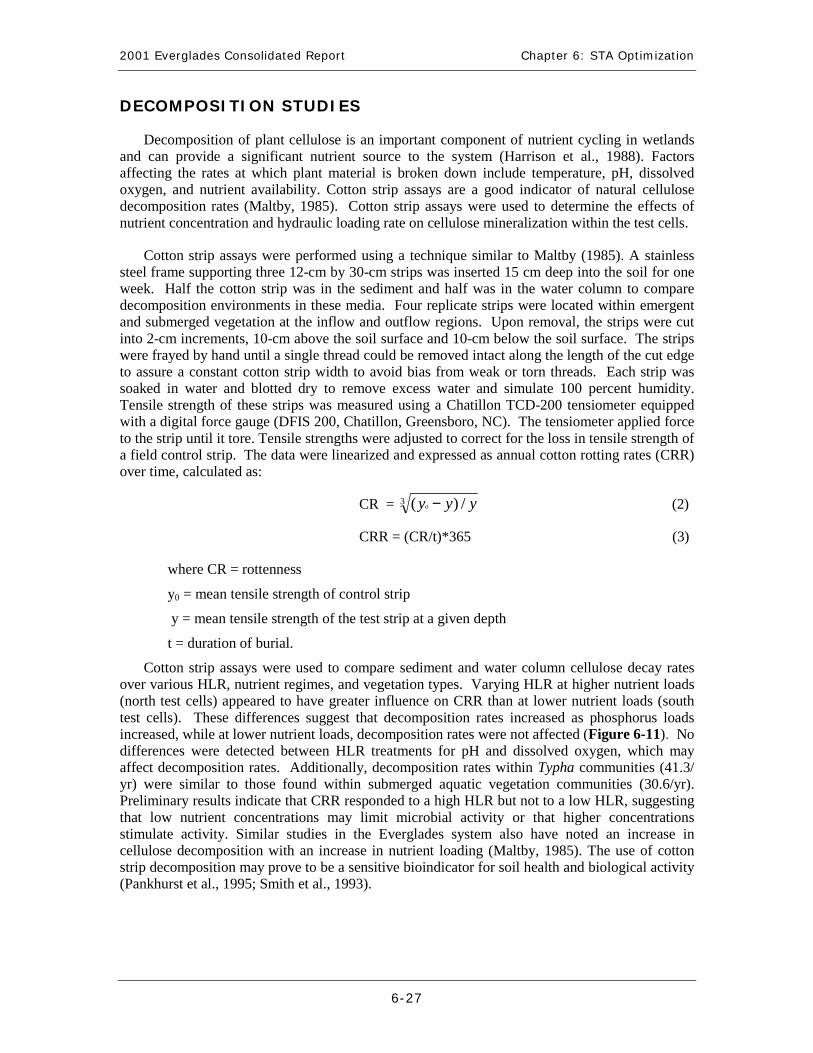
Cotton strip assays were used to compare sediment and water column cellulose decay ratesover various HLR, nutrient regimes, and vegetation types. Varying HLR at higher nutrient loads(north test cells) appeared to have greater influence on CRR than at lower nutrient loads (southtest cells). These differences suggest that decomposition rates increased as phosphorus loadsincreased, while at lower nutrient loads, decomposition rates were not affected (Figure 6-11). Nodifferences were detected between HLR treatments for pH and dissolved oxygen, which mayaffect decomposition rates. Additionally, decomposition rates within Typha communities (41.3/yr) were similar to those found within submerged aquatic vegetation communities (30.6/yr).Preliminary results indicate that CRR responded to a high HLR but not to a low HLR, suggestingthat low nutrient concentrations may limit microbial activity or that higher concentrationsstimulate activity. Similar studies in the Everglades system also have noted an increase incellulose decomposition with an increase in nutrient loading (Maltby, 1985). The use of cottonstrip decomposition may prove to be a sensitive bioindicator for soil health and biological activity(Pankhurst et al., 1995; Smith et al., 1993).
Chapter 6: STA Optimization 2001 Everglades Consolidated Report
6-28
South Test CellsExperiment 1
0 5 10 15 20 25 30 35 40
CR
R (
yr-1
)
0
20
40
60
80
100
120
140
North Test CellsExperiment 2
TP Mass (g/wetland/wk)
0 20 40 60 80 100 120 140 160 180 200 220
CR
R (
yr-1
)
0
20
40
60
80
100
120
140
North Test CellsExperiment 1
0 5 10 15 20 25 30 35 40 45 50 55
CR
R (
yr-1
)
0
20
40
60
80
100
120
140
High HLR
Control HLR
Low HLR
Figure 6-11. Comparison of cotton rotting rates (CRR) and totalphosphorus loads of the varying hydraulic loading rates(HLR) for each experiment at the north and south STA-1Wtest cells.

2001 Everglades Consolidated Report Chapter 6: STA Optimization
6-29
ONGOING RESEARCH
The primary objective of the test cell experiments is to define the limits of operation for theSTAs for TP outflow concentration. Research into the effects of HLR will continue in addition tonew experiments on the effects of pulsed HLR and high and low depths on TP outflowconcentrations. Data will be analyzed for the other 29 water quality parameters to discern patternsrelated to HLR that may affect downstream water quality. Two studies on periphyton andmacroinvertebrates in the test cells began in February 2000 and concluded in June 2000. Thesestudies were designed to provide a broad overview of community structure and biomass estimatesin the test cells and to examine any changes in this structure due to dry out. Results will bepresented in next year’s report. Lithium tracer studies are being conducted this year to determineactual flow paths and hydraulic residence times in five test cells at different HLRs.
MARSH DRYOUT STUDY
While design and operational guidelines of STAs require normal water levels of 15 to 135cm, extreme drought conditions may dry out part or all of an STA. Some STAs, including theSTA-1W, are composed of highly organic peat soils. If these peat soils are dried and oxidized forprolonged periods, they may release nutrients into the water column upon reflooding. This lossresults from factors controlling oxidation within the soils, including composition of organicmaterial, sediment temperature, seasonal variability, and duration of dry-out (Reddy, 1983; Olilaet al., 1997). The District is conducting research in mesocosms to quantify the effects ofphosphorus loading, duration of dry-out periods, season of dry-out (wet and dry seasons), and thepresence or absence of macrophytes on the rate of phosphorus flux from the sediments to theoverlying water column. Results of these experiments indicate a time-limited flux that is greaterin the absence of macrophytes.
METHODS
The mesocosms used for the Marsh Dry-Out Study (MDOS) consisted of 24 fiberglass-linedplywood tanks measuring 5.9 m long by 1.0 m wide by 1.0 m deep. Each mesocosm contained 30cm of peat soil overlaid with 40 cm of STA-1W water and was open at the top. A flow-throughsystem operating at an average hydraulic loading rate of 2.61 cm/d resulted in a nominalhydraulic retention time of 15.4 days. Mesocosms were located at two sites within STA-1W, 12 atthe North Advanced Treatment Technology (ATT) Site using post-BMP water with high P inflowconcentrations, and 12 at the South ATT Site using post-STA water with reduced Pconcentrations. Dry-out involved draining water in the tank and then eliminating all supplementalwater sources except for rainfall. The MDOS experimental design is described in greater detail inChimney et al. (2000).
Chapter 6: STA Optimization 2001 Everglades Consolidated Report
6-30
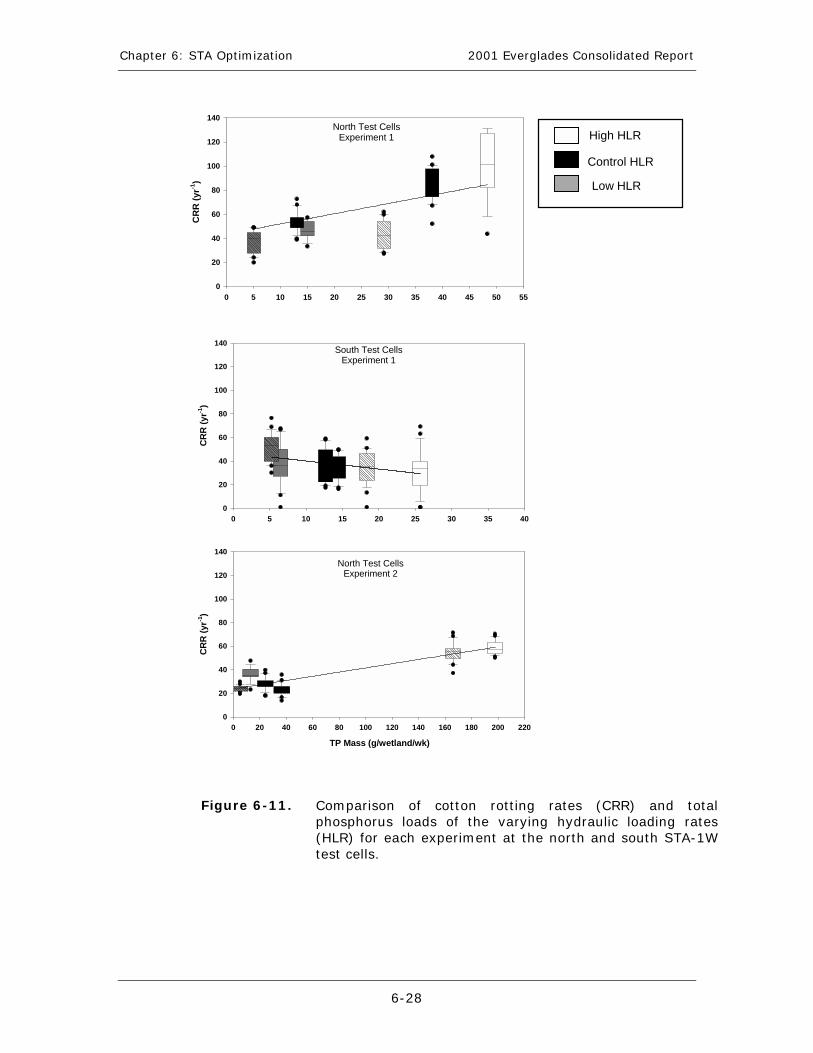
At both north and south sites, mesocosms were divided into four treatment types, providingreplication in triplicate for each treatment. Treatments were based on the presence or absence ofvegetation and flooding regime types (Table 6-8). Tanks representing emergent vegetation wereplanted with cattail (Typha spp.). Additional species grew in these tanks, including muskgrass(Chara spp.), smartweed (Polygonum spp.), torpedo grass (Panicum repens; L.), southern naiad(Najas guadalupensis; Spreng.) small duckweed (Lemna valdiviana; Philippi), water fern(Salvinia minima; Baker.), and floating and benthic algae. Non-planted tanks developedcommunities dominated by Chara spp. and floating, benthic, and epiphytic algae. During dry-out,both emergent and non-emergent tanks grew several species of grass, including para grass(Brachiaria mutica; Forsk. Stapf), Cyperus spp., Amaranthus spp., and several unidentifiedspecies of grasses and sedges.
Table 6-8. Mesocosm treatment types based on the presence or absence ofvegetation and flooding regime. For treatment number, “C” representscontrol, “D” represents dry out tanks, “N” represents non-plantedtanks, and “P” represents planted tanks.
Tank Number Treatment Type
Vegetation Flooding RegimeNorthATTSite
SouthATTSite
TreatmentNumber
Planted Non-Planted
Continuously Intermittently
31 231 C – P ✔ ✔
12 212 C – N ✔ ✔
43 243 D – P ✔ ✔
24 224 D – N ✔ ✔
25 225 D – N ✔ ✔
46 246 D – P ✔ ✔
37 237 C – P ✔ ✔
18 218 C – N ✔ ✔
19 219 C – N ✔ ✔
310 2310 C – P ✔ ✔
211 2211 D – N ✔ ✔
412 2412 D – P ✔ ✔

2001 Everglades Consolidated Report Chapter 6: STA Optimization
6-31
Results only from the northern sites were available during the period of this report. South siteexperiments are presently underway. At the north, water samples were collected from both tankinflow and outflow. Parameters collected for the MDOS include TP, total dissolved phosphorus(TDP), SRP, ammonia nitrogen (NH4-N), nitrate nitrogen (NO3-N), total kjeldahl nitrogen(TKN), total organic carbon (TOC), alkalinity, calcium (Ca), magnesium (Mg), iron (Fe), sulfate(SO4), and total suspended solids (TSS). For treatment number, “C” represents control, “D”represents dry out tanks, “N” represents non-planted tanks, and “P” represents planted tanks. Adetailed description of MDOS water quality and sampling methods appear in Chimney et al.(2000). Intermittently flooded tanks (dry-out tanks) were dried out three times, twice during thedry season from April to May in 1999 and 2000, and once during the wet season from Septemberto October 1999. Controls were continuously flooded for the duration of the experiment.
Weekly water quality data for the first year of study (1 March 1999 through 30 March 2000)were averaged for each phase of the MDOS. Currently, there are five phases: three continuouslyflooded (startup and interim phase) and two dry out phases (dry season and wet seasonreflooding). Each dry-out phase occurred over four weeks with no flow followed by reflooding to40 cm depths. Reflooding occurred over a four-hour period, and then the tanks remained floodedfor one week until normal flow-through resumed. The end of the dryout phase was determined tooccur when average outflow TP concentrations returned to control levels for that vegetation type.Average concentrations (mg/L) with standard error and mass (mg/d) for all values are listed inAppendix A6-5. Second year data, starting April 2000, are not yet available for analysis.Decomposition rates within mesocosm tanks were measured using cotton strip assays and leaflitter bags. Cotton strips assays (CSA) were used to assess the effect of community structure andre-flooding events on cellulose decomposition rates within the water and soil column, while leaflitter bags were used to determine the effect of dry-out on whole plant decomposition.
Two types of cotton strip assays were performed to characterize the water/sediment interfaceand the water column. The water column study consisted of suspending three 20 cm long cottonstrips for 2 weeks after the wet season reflood near the surface of the water column at both inflowand outflow of each treatment. For the water/sediment analysis, stainless steel frames with threeattached 12-cm by 30-cm strips were inserted into the soil to a depth of 15 cm for one week atvarious periods throughout the experiment. Collection and analysis methods of both studiesfollow the methods outlined for test cell CSA analysis presented earlier in this chapter. Two-cminterval results from the water/sediment interface study were averaged for the water and soilcolumn, while all water column study intervals were averaged together to provide one value.
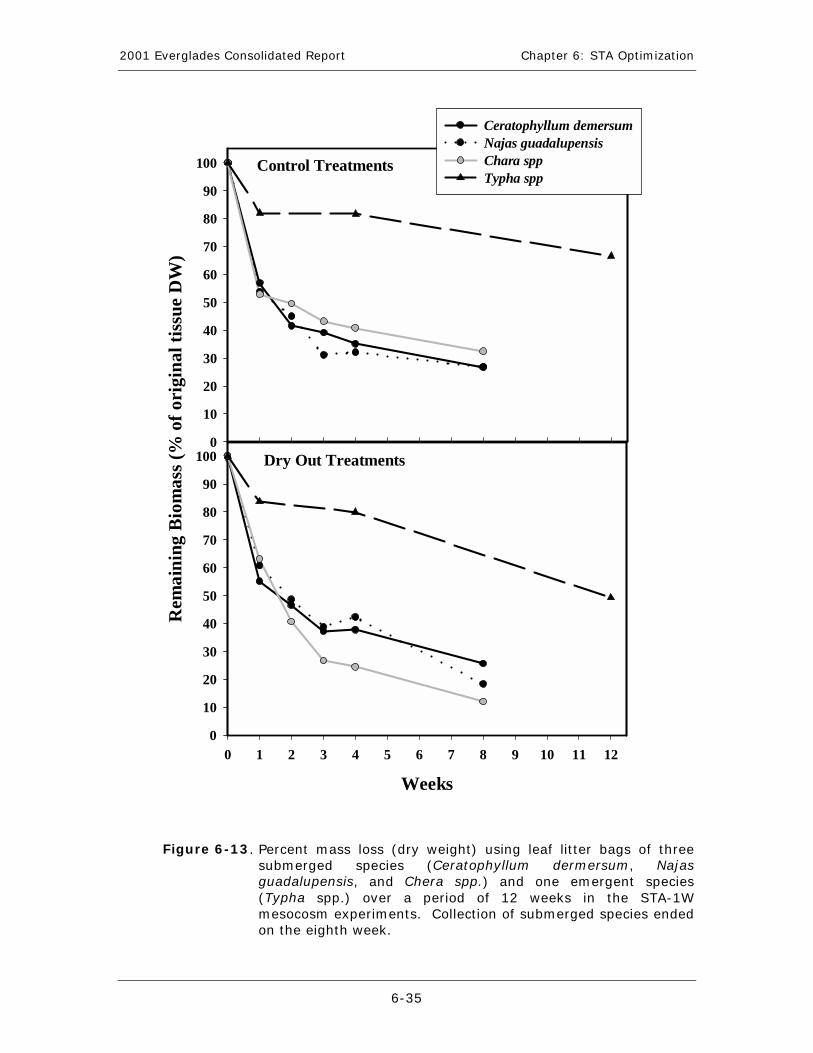
To determine the effect of the wet season dry out on whole plant decomposition rates, leaflitter bags were used. Four plant species, three submerged (Ceratophyllum demersum, N.guadalupensis, Chara spp.) and one emergent (Typha spp.) species, were obtained from the STA-1W, air dried to a constant weight, and cut into one to four cm strips. Approximately two gramsof the cut plant strips were placed into two-mm fiberglass 10 x 10 cm mesh bags and closed withnylon threading. Leaf litter bags were tied together in triplicates and laid on top of the soil. Bagswith Typha spp. were placed in the planted tanks and left for 1, 4, 12, and 48 weeks. Bagscontaining submerged vegetation were placed in both non-planted and planted tanks (sincesubmerged vegetation occurs in both treatments) and were left for 1, 2, 3, 4, and 8 weeks. Foreach time period, decomposed leaf litter was collected by removing a set of bags and immediatelyplacing them on ice within a labeled plastic bag. Leaf litter material was oven dried at 60°C for48 hours until a constant weight was obtained. Average species decomposition rates weredetermined by taking the difference of the constant dry weight of the litter bag contents from theoriginal dried weight of the litter bag contents.
Chapter 6: STA Optimization 2001 Everglades Consolidated Report
6-32
RESULTS
During the first year of study, inflow TP concentrations of all tanks averaged 0.108 mg/L,while outflow TP concentrations of the north site control tanks averaged 0.022 and 0.020 mg/Lfor planted and non-planted tanks, respectively. Phosphorus species in the control tanks consistedof an average of 30 percent soluble reactive phosphorus (SRP), 38 percent particulate phosphorus(PP), and 32 percent DOP. Reflooding of organic soils in non-planted and planted mesocosmsduring both dry and wet seasons resulted in an average 4- to 7-fold increase of outflow totalphosphorus (TP) concentrations relative to controls. This increase in water column TP resemblesthat found by Olila et al. (1997) where reflooding of dried organic soils in the Lake Apopkamarsh produced a ten-fold increase following a dry-out period of three to six weeks.
Outflow TP concentration in non-planted tanks was greater relative to planted tanks, rangingfrom 0.017 to 0.412 mg/L overall. Average dry season TP outflow concentrations for non-plantedtanks were 0.125 mg/L, and wet season outflow concentrations averaged 0.065 mg/L. Totalphosphorus outflow concentrations in the planted tanks ranged from 0.017 to 0.108 mg/L overall,with average dry season TP concentrations of 0.074 mg/L, and a wet season outflowconcentration of 0.048 mg/L (Figure 6-12). Furthermore, non-planted mesocosms released ahigher percentage of PP than planted tanks compared to controls during both dry and wet seasonreflooding (Table 6-9). These results suggest that vegetation type may play a significant role inphosphorus release after dryout and reflooding. The leaf litter study indicated that Typha spp.decayed more slowly than the submerged and periphyton species, retaining 30 percent more of itsdry weight biomass than the submerged species and periphyton (C. demersum, N.s guadalupensis,Chara spp.) (Figure 6-13). Therefore, an increase in particulates could be due to the rapidphysical breakdown of Chara.
During the wet and dry season dry-out periods, soil moisture and environmental conditionssuch as presence of standing water, cellulose decomposition rates, and vegetation type variedconsiderably. During wet season dry-out, soils within both planted and non-planted treatmentsremained moist and mostly anoxic (redox -100 to 300 mv). During the dry season, soils werecompletely aerobic and, in most cases, cracked from the absence of moisture (Figure 6-14).During the dry season, outflow TP concentrations after reflood averaged 54 and 92 percent higherthan during the wet season for planted and non-planted tanks, respectively. Percent SRP duringthe dry season increased from 53 to 83 percent relative to controls. During the wet season,percent SRP either remained the same or decreased relative to controls in the planted and non-planted tanks, respectively (Table 6-9). Olila et al. (1997) found that oxidation of newly accretedpeat material resulted in conversion of organic P into labile P (the readily useable form), which isreadily released into the water column. Since SRP percentage increased after reflooding onlyduring the dry season, soil oxidation may have converted phosphorus from organic to labileinorganic forms, contributing to the release of SRP into the water column. Decomposition keepslabile phosphorus forms relatively stable under anaerobic conditions (Reddy et al., 1999). Thedifferences in soil oxidation levels in dry and wet seasons may cause the differences in SRPlevels observed in the mesocosms.

2001 Everglades Consolidated Report Chapter 6: STA Optimization
6-33
Table 6-9. Total phosphorus concentrations and percent of phosphorus speciesbased on season reflood and treatment type. For treatment number,“C” represents control, “D” represents dry out tanks, “N” representsnon-planted tanks, and “P” represents planted tanks in the STA-1Wmesocosm experiments.
RefloodAverage
Concentration ofPercent of Total Phosphorus During Reflood
TP (mg L-1)(SE)
PP DOP SRPTreatment
Dry Wet Dry Wet Dry Wet Dry Wet
[C - N]0.018
(0.001)0.026
(0.001)24.1 46.8 47.4 26.2 28.5 27.0
[D - N] 0.125(0.022)
0.065(0.006)
37.7 61.6 18.9 18.7 43.4 19.7
[C - P] 0.018(0.001)
0.018(0.001)
31.6 38.1 41.7 23.1 26.6 38.8
[D- P] 0.074(0.005)
0.048(0.005)
24.0 36.4 27.4 25.4 48.6 38.2

Chapter 6: STA Optimization 2001 Everglades Consolidated Report
6-34
C -
N
D -
N
C -
P
D -
P
C -
N
D -
N
C -
P
D -
P
Treatment Number
C -
N
D -
N
C -
P
D -
P
Pho
sph
orus
Spe
cies
(m
g L
-1)
0.00
0.02
0.04
0.06
0.08
0.10
0.12
Particulate PhosphorusDissolved Organic PhosphorusSoluble Reactive Phosphorus
C -
N
D -
N
C -
P
D -
P
C -
N
D -
N
C -
P
D -
P
Startup Phase
Dry SeasonReflood
Reflood Phase (1)
Reflood Phase (2)
Wet SeasonReflood
Figure 6-12. Mean concentration of phosphorus species at high phosphorus loadingrates during the first year of research. Stabilization phase (3/5- 4/1),Dry Season Reflood (4/8 – 6/10), Interim Phase 1 (6/17 – 8/26), WetSeason Reflood (9/2 – 10/28), and Interim Phase 2 (11/4 – 2/28). Fortreatment number, “C” represents control, “D” represents dry out tanks,“N” represents non-planted tanks, and “P” represents planted tanks inthe STA-1W mesocosm experiments.
2001 Everglades Consolidated Report Chapter 6: STA Optimization
6-35
0 1 2 3 4 5 6 7 8 9 10 11 12
Rem
ain
ing
Bio
mas
s (%
of
orig
inal
tis
sue
DW
)
0
10
20
30
40
50
60
70
80
90
100
Ceratophyllum demersumNajas guadalupensisChara sppTypha spp
Weeks
0 1 2 3 4 5 6 7 8 9 10 11 120
10
20
30
40
50
60
70
80
90
100
Control Treatments
Dry Out Treatments
Figure 6-13. Percent mass loss (dry weight) using leaf litter bags of threesubmerged species (Ceratophyllum dermersum, Najasguadalupensis, and Chera spp.) and one emergent species(Typha spp.) over a period of 12 weeks in the STA-1Wmesocosm experiments. Collection of submerged species endedon the eighth week.

Chapter 6: STA Optimization 2001 Everglades Consolidated Report
6-36
Depth (cm)
5 10 5 10 5 10 5 10 5 10 5 10 5 10 5 10 5 10 5 10 5 10 5 10 5 10 5 10 5 10 5 10 5 10 5 10 5 10 5 10
Red
ox P
oten
tial
(m
V)
-300
-250
-200
-150
-100
-50
0
50
100
150
200
250
300
350
400
450
500
Anaerobic
Anoxic
Stabilization Phase
InterimPhase (2)
InterimPhase (1)
Dry Season Dry Out
Wet Season Dry Out
Aerobic
Treatment 1: Control - Non-plantedTreatment 2: Dry out - Non-plantedTreatment 3: Control - Planted
Treatment 4: Dry out - Planted
Figure 6-14. Corrected redox values of all treatments for soil depths of 5 and 10 cm inboth control and dry-out tanks in the STA-1W mesocosm experiments.
2001 Everglades Consolidated Report Chapter 6: STA Optimization
6-37
Re-flooding events affect not only nutrient availability, but also communities ofdecomposers, in turn affecting decay rates of organic material and potentially reducing Pretention. During the first year of study, soils of non-planted tanks had higher average CRR thanplanted tanks. Overall, CRR decreased in dry soils in both planted and non-planted tanks relativeto controls. However, the wet season dry-out differed the least in cellulose decomposition rates(Figure 6-14). Preliminary results suggest that dry season dry-out produced soils that werecompletely oxidized and lacked moisture, possibly resulting in a decline in cellulosedecomposers. During the wet season, soils remained relatively anoxic and moist, producing afavorable environment for decomposers and increasing CRR relative to the dry season.
While water/sediment cotton strip assays did not appear to be affected by dry-out within thewater column after reflood, the floating frame study revealed that decomposition rates within thewater column did increase after reflood (Figure 6-15). Water column microbial communitiescould respond differently to dry-out/reflood scenarios compared to communities ten centimetersabove or below the soil/water interface.
Decomposer communities in the lower water column could be influenced by thosecommunities in the soil, which decreased during dry-out, resulting in a lower CRR (Figure 6-16).Additionally, inflow decomposition rates in all treatments were greater than outflow in the watercolumn. These results are similar to those in the Everglades study performed by Maltby (1985),which determined that cellulose decomposition rates within the water column increased with theaddition of phosphorus and nitrogen, and decomposition rates generally decreased downstreamfrom the nutrient source.

Chapter 6: STA Optimization 2001 Everglades Consolidated Report
6-38
Figure 6-15. Cotton rotting rates in Marsh Dry-Out STA-1W mesocosms. Phase 1:Startup period, Phase 2: Dry Season Dry Out, Phase 3: Interim Phase(1), Phase 4: Wet Season Dry Out, Phase 5: Interim Phase (2).
Cot
ton
Rot
ting
Rat
es (
yr -1
)
0
10
20
30
40
50
60
70
80
90
Phase Number
1 2 3 4 5
0
10
20
30
40
50
60
70
80
90
T1: Control - PlantedT2: Dry Out - PlantedT3: Control - Non-Planted T4: Dry Out - Non-Planted
Water Column
Soil Column

2001 Everglades Consolidated Report Chapter 6: STA Optimization
6-39
CONCLUSIONS
Nutrient retention of organic soils following dry-out and reflooding appears to depend on theextent of soil oxidation and vegetation type within a wetland system. Both planted and non-planted tanks produced a nutrient flux into the water column following reflooding during both dryand wet seasons. The highest nutrient releases occurred in non-planted tanks during the dryseason dry-out/reflooding cycle. Preliminary results suggest that complete oxidation of organicsoils under plant communities that rapidly decompose, such as a submerged aquatic/algaecommunity, released more P into the water column when reflooded than those planted withemergent vegetation.
Figure 6-16. Cotton rotting rates in the water column of the inflow and outflowof four different treatment types in the STA-1W mesocosmexperiments.
Treatment
CR
R (
yr-1
)
0
2
4
6
8
10
12
14
16
Control - NP Dry Out - NP Control - P Dry Out - P
Outflow
Inflow

Chapter 6: STA Optimization 2001 Everglades Consolidated Report
6-40
RESEARCH LINKAGE TO STA MANAGEMENT
District goals include assuring that management and operational strategies maximize nutrientreduction in the STAs. The research conducted on STA Optimization focuses on understandingthe dynamics of shallow, subtropical wetlands and the conditions that improve or reduce nutrientremoval efficiencies.
• Results from STA-1W have validated the premise that treatment wetlandsconstructed on former agricultural land can effectively reduce TP levels in EAArunoff and achieve outflow concentrations less than the interim target level of 50ppb.
• The cumulative TP settling rate calculated for the ENR Project suggests that thesettling rate used to design the STAs was conservative and should provide anadequate margin of safety to accommodate any decrease in treatmentperformance that may occur as these systems mature over time.
• Analysis of nutrient data from Treatment Cell 4 in STA-1W indicated that thiscell out-performed the other treatment cells in STA-1W. This information hasguided the District to focus on the cultivation of a submerged aquatic vegetationcommunity in the lower reaches of the other STAs to enhance their treatmentperformance.
• Test cell research has identified an upper range of hydraulic loading rates incattail-dominated peat-based wetlands that exceeds the ability of these systems toeffectively remove P from flow-through waters. Additional experiments arecurrently investigating the role of water depth and inflow pulsing to furtherclarify the limits of treatment efficiency in these wetlands.
CHAPTER CONCLUSIONS
After five years of operation, STA-1W is performing at levels well below the targeted 50 ppb.Individually, Cells 2, 3 and 4 retain 31 to 56 percent of TP mass entering each treatment cell.Even though Cell 4 is the smallest of the treatment wetlands, it is most efficient in spite of a 51percent short-circuiting in its water flow. Mixing is expected to increase its efficiency with theinstallation of earthen plugs, but results of these alterations will not be known until next year.One hypothesis is that the management of Cell 4 is responsible for its success in retaining TP,particularly regarding vegetation, HRT, and operating depth. The western flow-way retains threetimes more TP than the eastern flow-way when loading rates and size differences are included inthe analysis.
Preliminary test cell experiments at the north site indicate that mean outflow TP and TNgenerally increased as inflow HLR increased. Mean outflow TP was less than the mean inflowvalues, but exceeded the Phase 1 target of 0.050 mg/L only at the highest HLR tested. Mean totaloutflow TN and organic N concentrations generally increased as hydraulic loading ratesincreased. Inorganic nitrogen was preferentially taken up in the wetlands. Removal efficiencieswere greater at lower hydraulic loading rates in the north test cells when the inflowconcentrations were higher. At the low inflow concentrations of the south test cells, HLR hadlittle effect on outflow concentrations. Decomposition experiments revealed that low nutrient

2001 Everglades Consolidated Report Chapter 6: STA Optimization
6-41
concentrations may limit decay, or that an increase in TP loading seemed to increase decay ratesin these wetlands.
The Marsh Dry-Out Study at the north site in STA-1W indicated that nutrient release in thesemesocosms during reflooding after a dry-out period is time-limited to approximately one month.Vegetation seems to play a role in that non-planted tanks release more TP into the water columnduring the reflood than tanks planted with cattails. Soil dryness during dry-out also appeared toincrease TP release into the water column.
FUTURE DIRECTIONS
Over the next water year, much of the present research, including monitoring internal waterquality and flow stations in STA-1W, will continue. Construction on the new structures shouldbe completed this year, so it is expected that next year’s report will include performance data forall treatment cells. Analysis of prior years’ performance in these treatment cells will continue andfocus on other water quality parameters in addition to TP. In the test cells, research will continueon the effects of hydraulic loading rates, depth, and pulsing on TP concentrations. The MarshDry-Out studies will continue, and similar research in STA-6 is projected.

Chapter 6: STA Optimization 2001 Everglades Consolidated Report
6-42
LITERATURE CITED
American Public Health Association (APHA), 1989. Standard methods for the examination ofwater and wastewater, 17th ed. American Public Health Association, Washington, DC.
Chimney M.J. and M.Z Moustafa, 1999. Chapter 6: Effectiveness and Optimization ofStormwater Treatment Areas for Phosphorus Removal. In: Everglades Interim Report,SWMD, pp. 6-1 through 6-45.
Chimney, M., M. Nungesser, J. Newman, K. Pietro, G. Germain, T. Lynch, G. Goforth and M.Moustafa, 2000. Chapter 6: Stormwater Treatment Areas – Status of research and monitoringto optimize effectiveness of nutrient removal and annual report on operational compliance.In: SFWMD Everglades Consolidation Report, pp. 6-1 through 6-127, SFWMD.
DB Environmental Laboratories, Inc. (DBEL), 2000. Submerged Aquatic Vegetation/LimerockTreatment System Technology for removing Phosphorus from Everglades Agricultural AreaWaters Follow-on Study: STA-1W Cell 4 Tracer Study Report, Prepared for the SouthFlorida Water Management District and the Florida Department of Environmental Protection.
Guardo, M. and A.P. Prymas, 1998. Calibration of steady-state seepage simulations to estimatesubsurface seepage into an artificial wetland. Pages 555–561 In Proceedings of theConference on Engineering Approaches to Ecosystem Restoration, American Society of CivilEngineers, Denver, CO.
Harrison, A.F., P.M. Latter and D.W.H. Walton, 1988. Cotton strip assay: an index ofdecomposition in soils. Institute of Terrestrial Ecology symposium no. 24, MerlewoodResearch Station, Grange-over-Sands, Cumbria, England.
Harvey, J.W., S.L. Krupa, C.J. Gefvert, J. Choi, R.H Mooney, and J. Gidding, 2000. Interactionof Groundwater and Surface Water in the Northern Everglades and Relation to WaterBudgets and Mercury Cycling. U.S. Geological Survey Report, 400 pp.
Koch, M.S. and K.R. Reddy, 1992. Distribution of soil and plant nutrients along a trophicgradient in the Florida Everglades. Soil Science Society of America Journal 56: 1492-1499.
Li, Xiuzhen, 2000. Purification Function of Wetlands: Spatial Modelling and Pattern Analysis ofNutrient Reduction in the Liaohe Delta. Wageningen University, the Netherlands.
Maltby, E., 1985. Effects of nutrient loading on decomposition profiles in the water column andsubmerged peat in the Everglades. In: Proceedings of Tropical peat resources: prospects andpotential, Kingston, Jamaica, pp. 450-464. International Peat Society, Helsinki, Finland.
McCormick, P. V. and M.B. O’Dell, 1996. Quantifying periphyton responses to phosphorus inthe Florida Everglades: a synoptic experimental approach. Journal of the North AmericanBenthological Society 15: 450-468.
McCormick, P.V., R.B.E. Shuford III, J.G. Backus, and W.C. Kennedy, 1998. Spatial andseasonal patterns of periphyton biomass and productivity in the northern Everglades, Florida,U.S.A. Hydrobiologia 362: 185-208.
2001 Everglades Consolidated Report Chapter 6: STA Optimization
6-43
McCormick, P., S. Newman, S. Miao, R. Reddy, D. Gawlik, C. Fitz, T. Fontaine and D Marley,1999. Chapter 3: Ecological Needs of the Everglades, pages 3-1 through 3-66. In: SFWMD.Everglades Interim Report. West Palm Beach, FL.
Newman, J.M. and T. Lynch, 2000. The Everglades Nutrient Removal Project test cells STAoptimization—status of the research at the north site. Proceedings of the InternationalConference on Wetlands Systems for Water Pollution Control, November 11-16, 2000.
Nungesser, M.K. and M.J. Chimney, 2000. Evaluation of phosphorus retention in a South Floridatreatment wetland. Proceedings, 7th International Conference on Wetland Systems for WaterPollution Control, November 11-16, 2000.
Olila O.G., K.R. Reddy and D.L. Stites, 1997. Influence of draining on phosphorus forms anddistribution in a constructed wetland. Ecological Engineering 9: 157-169.
Pankhurst, C.E., B.G. Hawke, H.J. McDonald, C.A. Kirkby, J.C. Buckerfield, P. Michelsen, K.A.O’Brien, V.V.S.R. Gupta, and B.M. Doube, 1995. Evaluation of soil biological properties aspotential bioindicators of soil health. Aust. J. Exp. Agricul. 35: 1015-1028.
Reddy, K.R., 1983. Soluble phosphorus release from organic soils. Agriculture, Ecosystems, andEnvironment 9: 373-382.
Reddy, K.R., W.F Debusk and M.Z. Moustafa, 1999. Influence of drainage and reflooding onphosphorus retention characteristics of soils in storm water treatment areas. Task 1. WorkPlan. Plan prepared for the South Florida Water Management District, West Palm Beach, FL.
Redfield, G., J. VanArman, K. Rizzardi and M.J. Chimney, 1999. Chapter 1: Introduction to theEverglades Interim Report, pages 1-1 through 1-26. In: SFWMD. Everglades Interim Report.West Palm Beach, FL.
Sklar, F., C. McVoy, R. VanZee, D. Gawlik, D. Swift, W. Park, C. Fitz, Y. Wu, D. Rudnick, T.Fontaine, S. Miao, A. Ferriter, S. Krupa, T. Armentano, K. Tarboton, K. Rutchey, Q. Dongand S. Newman, 1999. Chapter 2: Hydrologic Needs: The Effects of altered Hydrology onthe Everglades, pp. 2-1 through 2-70. In: SFWMD. Everglades Interim Report. West PalmBeach, FL.
Smith, V.R., M. Steenkamp, and D.D. French, 1993. Soil decomposition potential in relation toenvironmental factors on Marion Island (sub-Antarctic). Soil Biol. Biochem. 25: 1619-1633.
Sokal, R.R. and F.J. Rohlf, 1981. Biometry. W.H. Freeman and Company, New York.
SFWMD, 1991. Management Plan for Everglades Nutrient Removal Project. South FloridaWater Management District, West Palm Beach, FL.
SFWMD, 1998. SFWMD Comprehensive Quality Assurance Plan. WRE Inventory #370. SouthFlorida Water Management District, West Palm Beach, FL.
SFWMD, 2000. Everglades Consolidated Report. South Florida Water Management District,West Palm Beach, FL.
Walker, W.W., 1991. Water quality trends at inflows to Everglades National Park. WaterResources Bulletin 27(1).

Chapter 6: STA Optimization 2001 Everglades Consolidated Report
6-44
Winter, T.C., 1981. Uncertainties in estimating the water balance of lakes. Water ResourcesBulletin 17(1), 82-115.