Embed Size (px)
Citation preview

Chapter 5
The Consumption Sector
Copyright 2005 by The McGraw-Hill Companies, Inc. All rights reserved. 5-1

Chapter Objectives
• The average propensity to consume• The average propensity to save• The marginal propensity to consume• The marginal propensity to save• The consumption function• The saving function• The determinants of consumption• The permanent income hypothesis
5-2Copyright 2005 by The McGraw-Hill Companies, Inc. All rights reserved.

Consumption
• Consumption is the nation’s expenditures on all final goods and services produced during the year at market prices– Consumption was almost $2 trillion dollars
in 2002• $2,000,000,000,000
• $2,000 billion
• $2.0 trillion
5-3Copyright 2005 by The McGraw-Hill Companies, Inc. All rights reserved.

Four Parts of GDP
• Consumption ------------ C (this chapter)
• Investment ---------------- I (Chapter 6)
• Government -------------- G (Chapter 7)
• Net exports --------------- Xn (Chapter 8)
5-4Copyright 2005 by The McGraw-Hill Companies, Inc. All rights reserved.

Consumption
• Americans spend over 95% of their income after taxes– The total of everyone’s expenditures is called
consumption• Consumption is designated by the letter C
• C is the largest sector of GDP– Now C is just over two-thirds of GDP
5-5Copyright 2005 by The McGraw-Hill Companies, Inc. All rights reserved.

Consumption
• The consumption functions states– As income rises, consumption (C) rises, but
not as quickly– Therefore, consumption varies with
disposable income (DI)• DI increases . . . C increases but by a smaller
amount
• DI decreases . . . C decreases but by a smaller amount
5-6Copyright 2005 by The McGraw-Hill Companies, Inc. All rights reserved.

Consumption and Disposable Income
Disposable Income Consumption
1,000 1,400
2,000 2,200
3,000 3,000
4,000 3,800
5,000 4,600
5-7Copyright 2005 by The McGraw-Hill Companies, Inc. All rights reserved.

Consumption and Disposable Income
Disposable Income Consumption
1,000 1,400
2,000 2,200
3,000 3,000
4,000 3,800
5,000 4,600
+ 1000 + 800
+ 1000 + 800
+ 1000 + 800
+ 1000 + 800
5-8Copyright 2005 by The McGraw-Hill Companies, Inc. All rights reserved.

Saving
• Saving is NOT spending• The more we spend, the less we save• A low savings rate leads to a low
productivity growth rate– Without savings ($) to invest in NEW plant
and equipment, we cannot raise our productivity fast enough!
• Savings includes personal saving, business saving, and a government surplus (if they have one)
5-9Copyright 2005 by The McGraw-Hill Companies, Inc. All rights reserved.

Source: Economic Report of the President, 2001, Business Cycle Indicators, March 2001
Saving as a Percentage of Disposable Income
1960 1964 1968 1972 1976 1980 1984 1988 1992 1996 2000
5-10Copyright 2005 by The McGraw-Hill Companies, Inc. All rights reserved.

Average Propensity to Consume (APC)
(The Percent of DI Spent)
APC = -----------------------------------Consumption
Disposable Income
5-11Copyright 2005 by The McGraw-Hill Companies, Inc. All rights reserved.
Disposable Income Consumption Saving
$40,000 $30,000
Table 2
5-12Copyright 2005 by The McGraw-Hill Companies, Inc. All rights reserved.

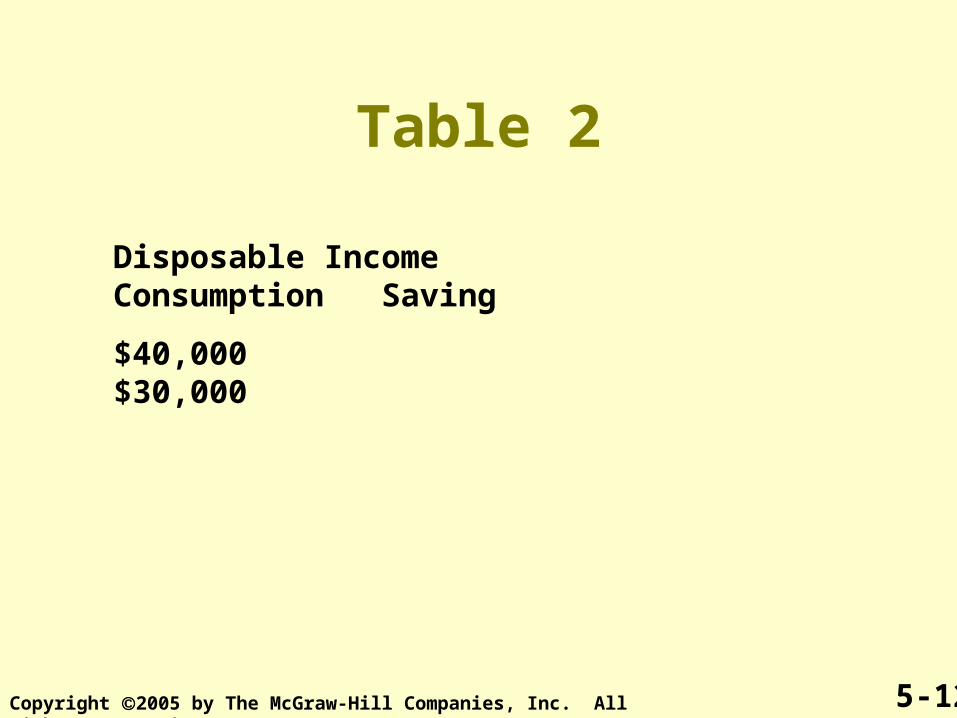
Table 2
Disposable Income Consumption Saving
$40,000 $30,000 $10,000
APC = ------------ = ------------ = ------ = .75 C 30000 3
DI 40000 4
5-13Copyright 2005 by The McGraw-Hill Companies, Inc. All rights reserved.

Table 2
Disposable Income Consumption Saving
$40,000 $30,000 $10,000
APC = ------------ = ------------ = ------ = .75 C 30000 3
DI 40000 4
APS = ------------ = ------------ = ------ = .25 S 10000 1 DI 40000 4
5-14Copyright 2005 by The McGraw-Hill Companies, Inc. All rights reserved.

Table 2
Disposable Income Consumption Saving
$40,000 $30,000 $10,000
APC = ------------ = ------------ = ------ = .75 C 30000 3
DI 40000 4
APS = ------------ = ------------ = ------ = .25 S 10000 1 DI 40000 4
+
1.05-15Copyright 2005 by The McGraw-Hill Companies, Inc. All rights reserved.
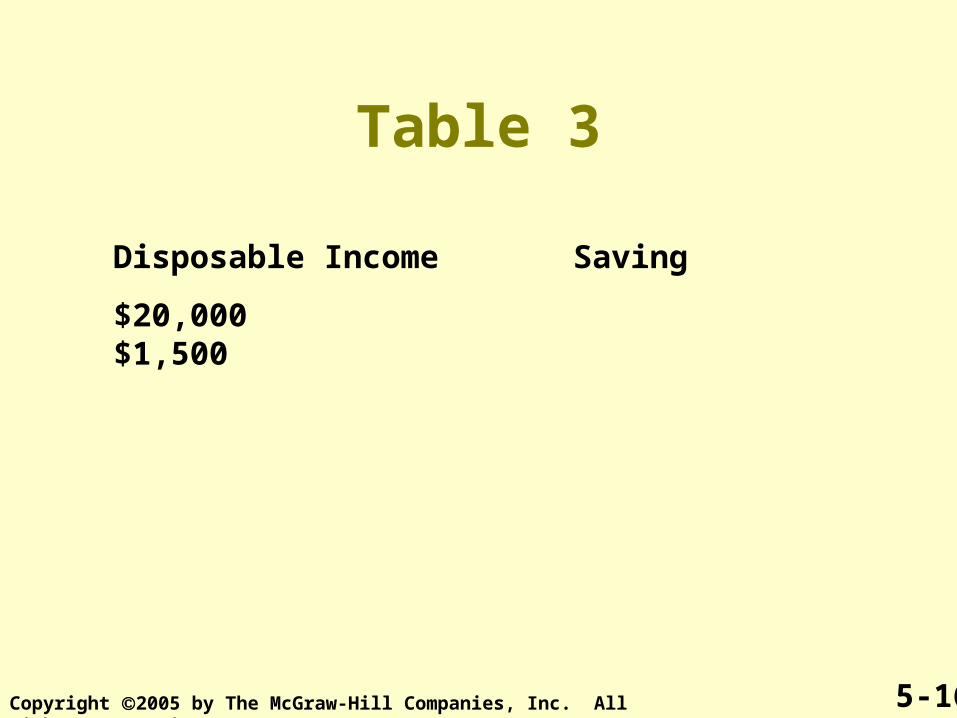
Table 3
Disposable Income Saving
$20,000 $1,500
5-16Copyright 2005 by The McGraw-Hill Companies, Inc. All rights reserved.

Table 3
Disposable Income Saving
$20,000 $1,500
Disposable Income Saving Consumption
$20,000 $1,500 $18,500
5-17Copyright 2005 by The McGraw-Hill Companies, Inc. All rights reserved.

Table 3
Disposable Income Saving
$20,000 $1,500
Disposable Income Saving Consumption
$20,000 $1,500 $18,500
APC = ------------ = ------------ = ------ = .925 C 18500 37
DI 20000 40
5-18Copyright 2005 by The McGraw-Hill Companies, Inc. All rights reserved.

Table 3
Disposable Income Saving
$20,000 $1,500
Disposable Income Saving Consumption
$20,000 $1,500 $18,500
APC = ------------ = ------------ = ------ = .925 C 18500 37
DI 20000 40
APS = ------------ = ------------ = ------ = .075 S 1500 3 DI 20000 40
5-19Copyright 2005 by The McGraw-Hill Companies, Inc. All rights reserved.

Table 3
Disposable Income Saving
$20,000 $1,500
Disposable Income Saving Consumption
$20,000 $1,500 $18,500
APC = ------------ = ------------ = ------ = .925 C 18500 37
DI 20000 40
APS = ------------ = ------------ = ------ = .075 S 1500 3 DI 20000 40
+
1.05-20Copyright 2005 by The McGraw-Hill Companies, Inc. All rights reserved.

APCs Greater Than One
Disposable Income Consumption Saving
$10,000 $12,000
5-21Copyright 2005 by The McGraw-Hill Companies, Inc. All rights reserved.

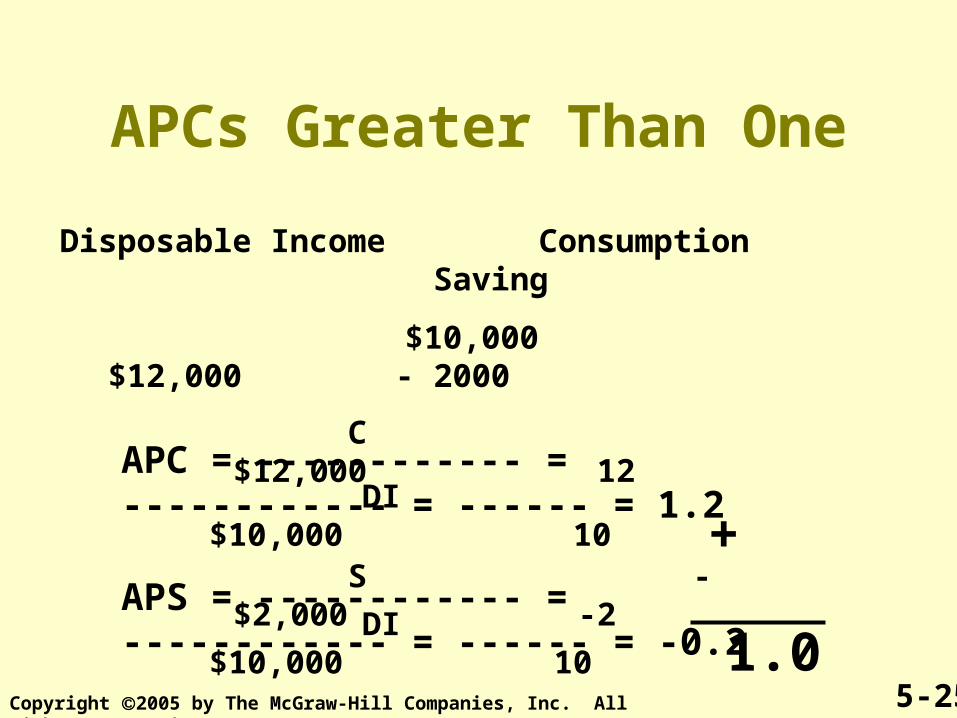
APCs Greater Than One
Disposable Income Consumption Saving
$10,000 $12,000 - 2000
Where is this going to come from?
5-22Copyright 2005 by The McGraw-Hill Companies, Inc. All rights reserved.

APCs Greater Than One
Disposable Income Consumption Saving
$10,000 $12,000 - 2000
APC = ------------ = ------------ = ------ = 1.2 C $12,000 12
DI $10,000 10
5-23Copyright 2005 by The McGraw-Hill Companies, Inc. All rights reserved.

APCs Greater Than One
Disposable Income Consumption Saving
$10,000 $12,000 - 2000
APC = ------------ = ------------ = ------ = 1.2 C $12,000 12
DI $10,000 10
APS = ------------ = ------------ = ------ = -0.2 S -$2,000 -2
DI $10,000 10
5-24Copyright 2005 by The McGraw-Hill Companies, Inc. All rights reserved.
APCs Greater Than One
Disposable Income Consumption Saving
$10,000 $12,000 - 2000
APC = ------------ = ------------ = ------ = 1.2 C $12,000 12
DI $10,000 10
APS = ------------ = ------------ = ------ = -0.2 S -$2,000 -2
DI $10,000 10
+
1.05-25Copyright 2005 by The McGraw-Hill Companies, Inc. All rights reserved.

Marginal Propensityto Consume (MPC)
MPC = CHANGE in Consumption
CHANGE in Income
5-26Copyright 2005 by The McGraw-Hill Companies, Inc. All rights reserved.

Marginal Propensityto Consume (MPC)
Table 4Year DI C S
1998 $30000 $23000 $7000
1999 $40000 $31000 $9000
5-27Copyright 2005 by The McGraw-Hill Companies, Inc. All rights reserved.

Marginal Propensityto Consume (MPC)
Table 4Year DI C S
1998 $30000 $23000 $7000
1999 $40000 $31000 $9000
10000 8000 2000Change
5-28Copyright 2005 by The McGraw-Hill Companies, Inc. All rights reserved.

Table 4Year DI C S
1998 $30000 $23000 $7000
1999 $40000 $31000 $9000
10000 8000 2000Change
MPC =---------------- = ---------- = ------- = .8Change in C 8000 8
Change in DI 10000 10
5-29Copyright 2005 by The McGraw-Hill Companies, Inc. All rights reserved.

Table 4Year DI C S
1998 $30000 $23000 $7000
1999 $40000 $31000 $9000
10000 8000 2000Change
MPC =---------------- = ---------- = ------- = .8Change in C 8000 8
Change in DI 10000 10
MPS = -------------- = ---------- = -------- = .2Change in S 2000 2
Change in DI 10000 10
+
1.0
5-30Copyright 2005 by The McGraw-Hill Companies, Inc. All rights reserved.

Graphing the Consumption Function
If Consumption rose at the same rate as Disposable Income . . . A graph of this function would be a 45 % line
Disposable income ($)
45û
1,000
1,000
2,000
3,000
2,000 3,000
5-31Copyright 2005 by The McGraw-Hill Companies, Inc. All rights reserved.

Graphing the Consumption Function
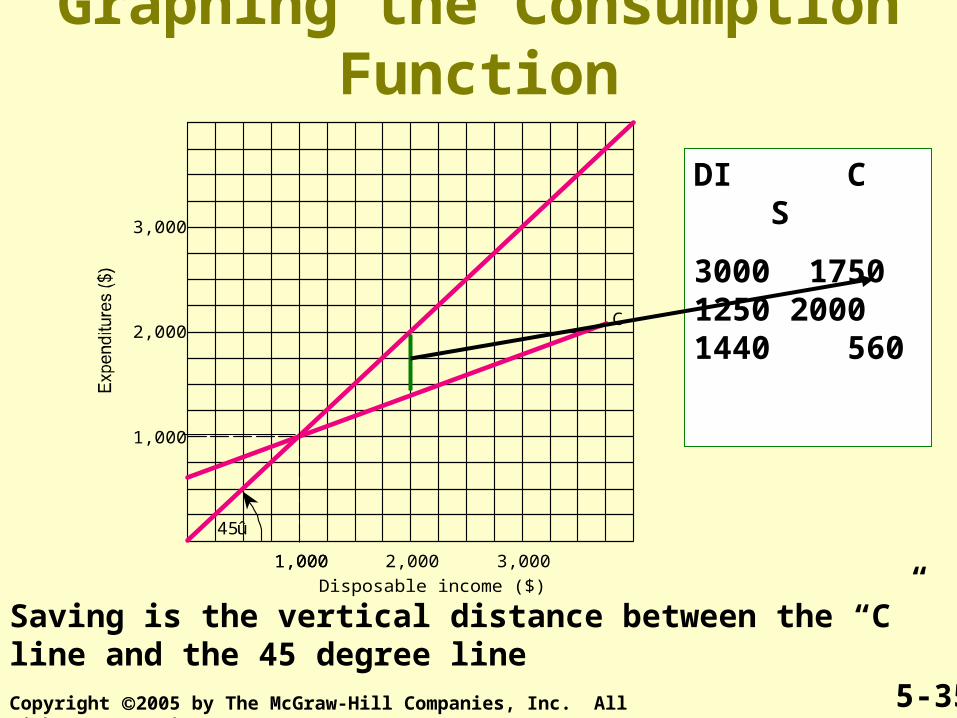
Consumption is the vertical distance between the bottom (horizontal) axis and the “C” line.
DI C S
3000 1750
5-32
Disposable income ($)
45û
C
1,000 2,000 3,0001,000
1,000
2,000
3,000
Copyright 2005 by The McGraw-Hill Companies, Inc. All rights reserved.

Graphing the Consumption Function
DI C S
3000 1750 1250
5-33
Disposable income ($)
45û
C
1,000 2,000 3,0001,000
1,000
2,000
3,000
Saving is the vertical distance between the “C” line and the 45 degree lineCopyright 2005 by The McGraw-Hill Companies, Inc. All rights reserved.

Graphing the Consumption Function
DI C S
3000 1750 1250 2000 1440
5-34
Disposable income ($)
45û
C
1,000 2,000 3,0001,000
1,000
2,000
3,000
Consumption is the vertical distance between the bottom (horizontal) axis and the “C” line.Copyright 2005 by The McGraw-Hill Companies, Inc. All rights reserved.
Graphing the Consumption Function
DI C S
3000 1750 1250 2000 1440 560
5-35
Disposable income ($)
45û
C
1,000 2,000 3,0001,000
1,000
2,000
3,000
Saving is the vertical distance between the “C” line and the 45 degree lineCopyright 2005 by The McGraw-Hill Companies, Inc. All rights reserved.

Graphing the Consumption Function
DI C S
3000 1750 1250 2000 1440 560 1000 1000
5-36
Disposable income ($)
45û
C
1,000 2,000 3,0001,000
1,000
2,000
3,000
Consumption is the vertical distance between the bottom (horizontal) axis and the “C” line.Copyright 2005 by The McGraw-Hill Companies, Inc. All rights reserved.

Graphing the Consumption Function
DI C S
3000 1750 1250 2000 1440 560 1000 1000 0
5-37
Disposable income ($)
45û
C
1,000 2,000 3,0001,000
1,000
2,000
3,000
Saving is “0” at 1000 DI because there is NO distance between the C line and the 45 degree line.Copyright 2005 by The McGraw-Hill Companies, Inc. All rights reserved.

Graphing the Consumption Function
DI C S
3000 1750 1250 2000 1440 560 1000 1000 0 0 625
5-38
Disposable income ($)
45û
C
1,000 2,000 3,0001,000
1,000
2,000
3,000
Consumption is the vertical distance between the bottom (horizontal) axis and the “C” line.Copyright 2005 by The McGraw-Hill Companies, Inc. All rights reserved.

Graphing the Consumption Function
DI C S
3000 1750 1250 2000 1440 560 1000 1000 0 0 625
5-39
Disposable income ($)
45û
C
1,000 2,000 3,0001,000
1,000
2,000
3,000
When DI is “0” the level of Consumption is called Autonomous Consumption (AC)Copyright 2005 by The McGraw-Hill Companies, Inc. All rights reserved.

Graphing the Consumption Function
DI C S
3000 1750 1250 2000 1440 560 1000 1000 0 0 625 -625
5-40
Disposable income ($)
45û
C
1,000 2,000 3,0001,000
1,000
2,000
3,000
Saving is the vertical distance between the “C” line and the 45 degree line. Saving is negative to the left of where the C line crosses the 45 degree line
Copyright 2005 by The McGraw-Hill Companies, Inc. All rights reserved.

Autonomous Consumption versus Induced Consumption
• Autonomous consumption (AC) is the level of consumption when disposable income is “0”– It is called autonomous because it is independent of
change in disposable income
• Induced consumption (IC) is that part of consumption that varies with the level of disposable income– As disposable income rises, induced income rises– As disposable income fall, induced income falls
• IC = C - AC
5-41Copyright 2005 by The McGraw-Hill Companies, Inc. All rights reserved.

Graphing the Consumption Function
DI C S
3000 1750 1250 2000 1440 560 1000 1000 0 0 625 -625
5-42
Disposable income ($)
45û
C
1,000 2,000 3,0001,000
1,000
2,000
3,000
DI = 0
What is IC?
IC = C - AC
IC = 625 - 625
IC = 0
Copyright 2005 by The McGraw-Hill Companies, Inc. All rights reserved.

Graphing the Consumption Function
DI C S
3000 1750 1250 2000 1440 560 1000 1000 0 0 625 -625
5-43
Disposable income ($)
45û
C
1,000 2,000 3,0001,000
1,000
2,000
3,000
DI = 1000
What is IC?
IC = C - AC
IC = 1000 - 625
IC = 375
Copyright 2005 by The McGraw-Hill Companies, Inc. All rights reserved.

Graphing the Consumption Function
DI C S
3000 1750 1250 2000 1440 560 1000 1000 0 0 625 -625
5-44
Disposable income ($)
45û
C
1,000 2,000 3,0001,000
1,000
2,000
3,000
DI = 2000
What is IC?
IC = C - AC
IC = 1440 - 625
IC = 815
Copyright 2005 by The McGraw-Hill Companies, Inc. All rights reserved.

Graphing the Consumption Function
DI C S
3000 1750 1250 2000 1440 560 1000 1000 0 0 625 -625
5-45
Disposable income ($)
45û
C
1,000 2,000 3,0001,000
1,000
2,000
3,000
DI = 3000
What is IC?
IC = C - AC
IC = 1750 - 625
IC = 1125
Copyright 2005 by The McGraw-Hill Companies, Inc. All rights reserved.

Consumer Spending ($ billions)
The major change in consumer spending has been a massive shift from nondurables to services
5-46
1955
Durables15.2%
Nondurables48.4%
Services36.3%
Total: 1,588
2000
Services58.0%Nondurables
29.8%
Total: 6,759
Durables12.2%
Copyright 2005 by The McGraw-Hill Companies, Inc. All rights reserved.

5-47Copyright 2005 by The McGraw-Hill Companies, Inc. All rights reserved.
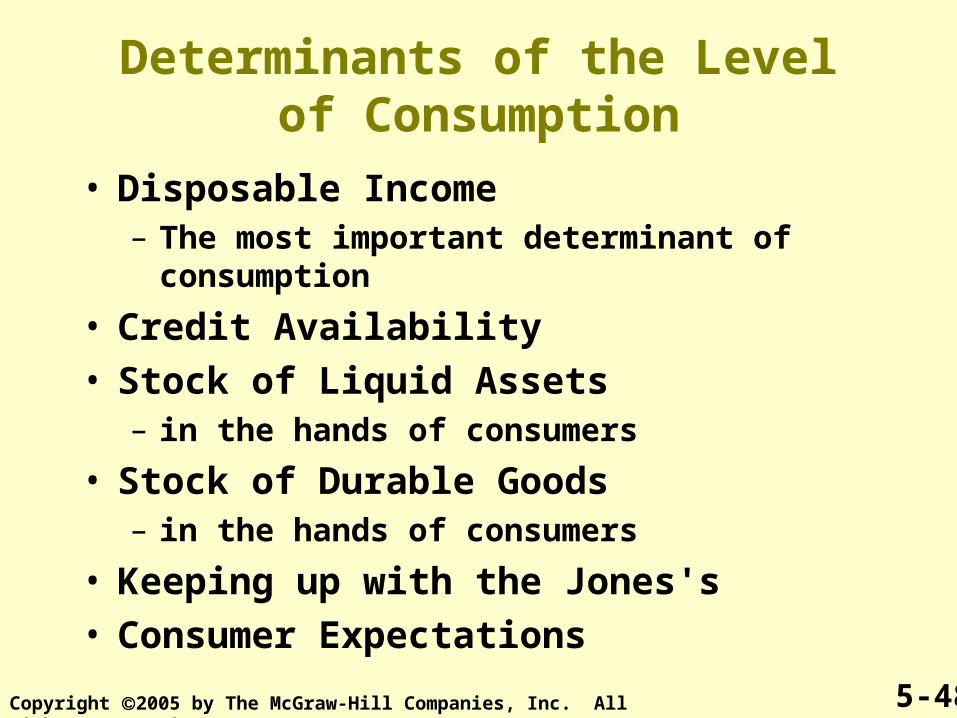
Determinants of the Level of Consumption
• Disposable Income– The most important determinant of consumption
• Credit Availability• Stock of Liquid Assets
– in the hands of consumers
• Stock of Durable Goods– in the hands of consumers
• Keeping up with the Jones's• Consumer Expectations
5-48Copyright 2005 by The McGraw-Hill Companies, Inc. All rights reserved.

Permanent Income Hypothesis(Milton Friedman)
• People gear their consumption to their expected lifetime average earnings more than to their current income– Apparently there are quite a few deviations from
the behavior predicted by the permanent income hypothesis
5-49Copyright 2005 by The McGraw-Hill Companies, Inc. All rights reserved.

The Determinants of Saving
• There is no single reason why people save• Some spend virtually all of their
disposable income• Some spend more than they earn• Americans now save less than 5 percent
of disposable income• Americans used to save 7 - 10 percent of
disposable income
5-50Copyright 2005 by The McGraw-Hill Companies, Inc. All rights reserved.

5-51
25
20
15
10
5
0
-5
25
20
15
10
5
0
Ð5
25
20
15
10
5
0
-5
25
20
15
10
5
0
Ð5
The shaded areas indicate periods of recession
RATIO, SAVING TO GROSS NATIONAL PRODUCT
Gross saving
Corporate and other private saving
Personal saving
Gross government saving
Copyright 2005 by The McGraw-Hill Companies, Inc. All rights reserved.

Why Do We Spend So Much and Save So Little?
• Americans have been on a spending binge the last 20 years– Mottos
• Buy now, pay later• Shop till you drop• We want it all, and we want it all
now!
5-52Copyright 2005 by The McGraw-Hill Companies, Inc. All rights reserved.
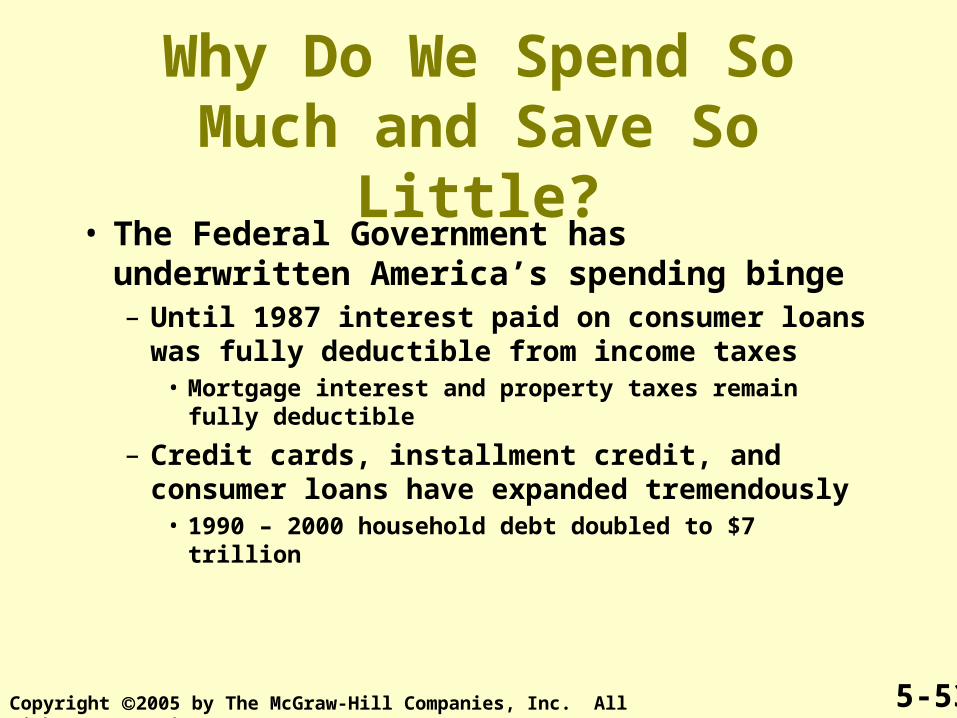
• The Federal Government has underwritten America’s spending binge– Until 1987 interest paid on consumer loans was fully
deductible from income taxes• Mortgage interest and property taxes remain fully
deductible
– Credit cards, installment credit, and consumer loans have expanded tremendously
• 1990 – 2000 household debt doubled to $7 trillion
Why Do We Spend So Much and Save So Little?
5-53Copyright 2005 by The McGraw-Hill Companies, Inc. All rights reserved.

• Two factors have become increasingly important– Social Security causes many to NOT feel
a pressing need to save for their old age– Home ownership is seen as a form of
saving • Especially during a period of rising real
estate prices
Why Do We Spend So Much and Save So Little?
5-54Copyright 2005 by The McGraw-Hill Companies, Inc. All rights reserved.

Total Saving
• Every economy depends on saving for capital formation
• Individual saving + business saving + government saving = Total Saving– Declines in household saving has been offset
somewhat since 1993 by a sharp rise in government saving and business saving
5-55Copyright 2005 by The McGraw-Hill Companies, Inc. All rights reserved.