Embed Size (px)
Citation preview

131
CHAPTER 5
2D FINITE ELEMENT MODELLING OF BURIED PIPE
TESTS
5.1 INTRODUCTION
Finite element method has been proved to be very useful tool in the
analysis of buried structures. The method allows for different boundary
conditions to be applied in such a way that an acceptable global approximate
solution to the physical problem can be achieved.
‘PLAXIS’ version 8 used in this thesis is a finite element code
specifically developed for the analysis of geotechnical problems such as the
settlement of foundations, the stability of slopes, or the deformation of buried
structures. PLAXIS stands for PLANE strain and AXISymmetric analysis,
two idealizations commonly used in geotechnical engineering. The plane
strain idealization is used for structures having a constant cross section over a
significant length. This idealization simplifies the problem because it is
assumed that the displacements perpendicular to the cross-section are zero.
The axisymmetric model is used for problems that are symmetrically relative
to the central axis. This idealization simplifies the problem by assuming the
deformation and the stress state identical in any radial direction. Geotechnical
problems involve nonlinear and time-dependent behaviour of soils that can
only be handled by advanced constitutive models. PLAXIS integrates some
well known constitutive models that can deal with such complex analysis, as

132
well as pore pressure in multi-phase materials. In addition, PLAXIS can
model the interaction between a structure and soil.
This chapter deals with the modeling of the buried pipe tests
conducted in this study as a plane strain problem i.e. in only two dimensions.
The tests with and without geogrid were modeled. Parametric studies have
been conducted by varying the trench width, plate dimensions, properties of
the pipe and backfill. It is revealed that overall two dimensional simulations
were reasonable. A brief summary of all the features of plaxis is given below.
5.2 REVIEW OF THE FEATURES OF PLAXIS
5.2.1 Graphical Input of Geometry
The version 8.2 of PLAXIS includes a computer assisted drawing
program. This drawing program is convenient and allows the possibility to
model a wide variety of geometry. Applied loads, prescribed displacements
and structural members can be directly added to the geometry in the drawing
area.
5.2.2 Automatic Mesh Generation
Precious time is saved by the automatic mesh generation of finite
elements. This feature allows the automatic generation of a random mesh of
triangular elements. There is an option available to refine the mesh where the
displacement and stress are concentrated.
5.2.3 High Order Continuum Elements
Two types of triangular elements are available in PLAXIS. They
are the quadratic 6-noded element and the cubic 15-node elements. These
elements are chosen depending on the problem and the accuracy required. It

133
might be advantageous to use the 6-noded element in problems with very
large number of elements, since this element type is less time consuming. A
smooth distribution of stresses can be obtained if 15 noded elements are used.
5.2.4 Beam Elements
A beam in PLAXIS is "a structural object used to model slender
structures in the ground with a significant flexural rigidity and normal
stiffness. The beam element can include three or five nodes depending on the
type of elements previously chosen. Each node has three degrees of freedom.
There are two degrees of freedom related to the displacement, and one related
to the rotation. It is also possible to simulate the development of a plastic
hinge when the maximum bending moment or maximum axial force is
reached. The weight of the beam can be taken into account. In the formulation
of PLAXIS, beams are superimposed as a continuum and therefore "overlap"
the soil. It is then necessary to subtract the unit weight of the soil from the
unit weight of the beam.
5.2.5 Plates
Special beam elements are used to model the bending of retaining
walls, tunnel linings, shells, and other slender structures. The behaviour of
these elements is defined using a flexural rigidity, a normal stiffness and an
ultimate bending moment. A plastic hinge may develop for elastoplastic
plates as soon as the ultimate moment is mobilized. Plates with interfaces may
be used to perform realistic analysis of geotechnical structures.
5.2.6 Geogrids
Geogrids (or geotextiles) are often used in practice for the
construction of reinforced embankments or soil retaining structures. These

134
elements can be simulated in PLAXIS by the use of special tension elements.
It is often convenient to combine these elements with interfaces to model the
interactions with the surrounding soil.
5.2.7 Tunnels
The PLAXIS program offers a convenient option to create circular
and non circular tunnels using arcs and lines. Plates and interfaces may be
used to model the tunnel lining and the interaction with the surrounding soil.
Fully isoparametric elements are used to model the curved boundaries within
the mesh. Various methods have been implemented to analyse the
deformations that occur as a result of various methods of tunnel construction.
5.2.8 Steady State Pore Pressure
Complex pore pressure distribution may be generated on the basis
of a combination of phreatic levels or direct input of water pressures. As an
alternative, a steady state groundwater flow calculation can be performed to
calculate the pore pressure distribution in problems that involve steady flow
or seepage.
5.2.9 Excess Pore Pressures
PLAXIS distinguishes between drained and undrained soils to
model permeable sands as well as nearly impermeable clays. Excess pore
pressures are computed during plastic calculations when undrained soil layers
are subjected to loads. Undrained loading situations are often decisive for the
stability of geotechnical structures.

135
5.2.10 Interface
The formulation of interface element in PLAXIS uses an elasto-
plastic model. The model is governed by the Coulomb failure criterion, which
differentiate between plastic and elastic behaviour. Elastic displacement
occurs when the shear stress is lower than (σntan φi +ci ), where σn is the
normal stress acting on the interface, φi is the fiction angle of the interface and
ci is the adhesion of the interface. The parameters φi and ci , are determined
from the properties of the soil. Usually, the strength of the interface is less
than the strength of the soil. Therefore, a reduction factor is applied to the
fiction angle and the cohesion of the soi1 resulting in the properties of the
interface.
However, the reduction factor does not apply to the dilation angle
ψ, of the interface. The dilation angle of the interface is set to zero if the
reduction factor is smaller than 1, otherwise, it is equal to the dilation angle of
the soil.
5.2.11 Automatic Load Stepping
This feature allows optimizing the step size to get an efficient
calculation process. Load increments that are too small would require many
steps, and the computer-time could be excessive. Nevertheless, too large
increments would require an excessive number of iteration to reach
equilibrium, and the solution could even diverge.
5.2.12 Staged Construction
This procedure is important to get the most realistic results. The
staged construction feature simulates the construction, excavation, and
backfill processes by changing the properties of soil clusters and structural

136
elements during the calculation. For example, soi1 clusters, which are part of
the geometry, are switched off to simulate the excavation. Structural elements
can also be switched off.
5.2.13 Presentation of the Results
The results in PLAXIS are presented graphically in the following
formats. First, a view of the deformed mesh is presented. Second, it is
possible to visualize the total, incremental, horizontal and vertical
deformations by vectors, contour lines, or shaded areas. Third, the effective
and total stresses are shown in the form of principal stresses, mean contour
lines, or mean shaded areas. It is possible to visualize deformations, bending
moments, shear stresses and normal stresses for structural and interface
element. Underground water flow and pore pressure outputs are also
available.
In addition, PLAXIS includes a special curve program to visualize
load or time versus displacement, and stress-strain diagrams. This information
is particularly useful to analyse local behaviour of soils.
5.2.14 Stress Paths
A special tool is available for drawing load- displacement curves,
stress and strain paths, stress-strain diagrams and time-settlement curves. The
visualization of stress paths provides a valuable insight into local soil
behaviour and allows a detailed analysis of the results of a PLAXIS
calculation.

137
5.3 MODELLING OF SOIL
PLAXIS includes some advanced constitutive models, as well as
some simple models. The simplest model is the well-known Mohr-Coulomb
model. This model gives a good approximation of the ultimate load for simple
problems. For more complex problems, involving time-dependent behaviour
or unloading –reloading residual strain, more advanced models are necessary.
The soft-soil model, which is based on the cam-clay model (Schofield and
Wroth, 1968), is efficient to analyse the behaviour of normally consolidated
soft soils. Secondary compression can also be modeled. For stiffer soils, the
Hardening Soil model of Scahnz (PLAXIS, 2002) which is based on the
Hyperbolic (Duncan and Chang, 1970) relation between stress and strain. A
detailed presentation of the Mohr-Coulomb model is presented below.
5.3.1 The Mohr-Coulomb Model
Plasticity is associated with the development of irreversible strains.
In order to evaluate whether or not plasticity occurs in a calculation, a yield
function f is introduced as a function of stress and strain. A yield function can
often be presented as a surface in principal stress space. A perfectly-plastic
model is constitutive model with a fixed yield surface, i.e. a yield surface that
is fully defined by model parameters and not affected by (plastic) straining.
For stress states represented by points within the yield surface, the behaviour
is purely elastic and all strains are reversible.
5.3.1.1 Elastic perfectly – plastic behaviour
The basic principle of elastoplasicity is that strains and strain rates
are decomposed into an elastic part and a plastic part. Hooke’s law is used to
relate the stress rates to the elastic strain rates. According to the classical
theory of plasticity , plastic strain rates are proportional to the derivative of
138
the yield function with respect to the stresses. This means that the plastic
strain can be represented as vectors perpendicular to the yield surface. This
classical form of the theory is referred to as associated plasticity. However,
for Mohr-Coulomb type yield function, the theory of associated plasticity
leads to an over prediction of dilatancy. Therefore in addition to the yield
function, a plastic potential function is introduced.
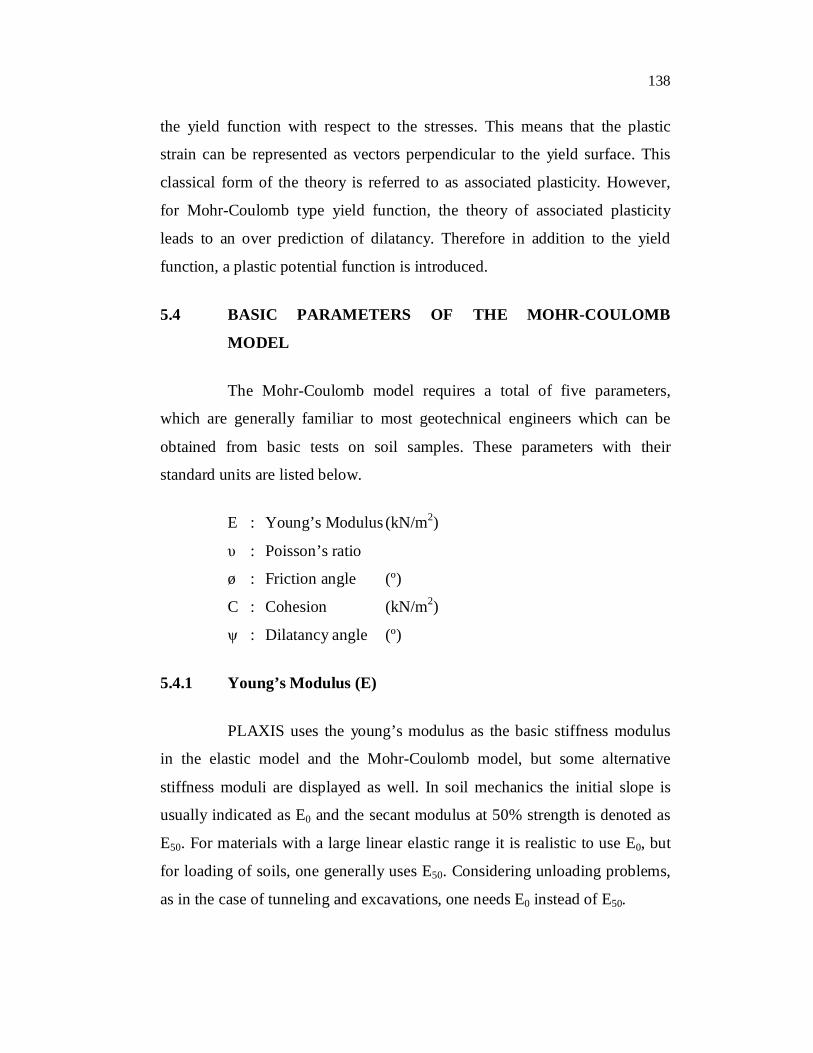
5.4 BASIC PARAMETERS OF THE MOHR-COULOMB
MODEL
The Mohr-Coulomb model requires a total of five parameters,
which are generally familiar to most geotechnical engineers which can be
obtained from basic tests on soil samples. These parameters with their
standard units are listed below.
E : Young’s Modulus (kN/m2)
υ : Poisson’s ratio
ø : Friction angle (º)
C : Cohesion (kN/m2)
ψ : Dilatancy angle (º)
5.4.1 Young’s Modulus (E)
PLAXIS uses the young’s modulus as the basic stiffness modulus
in the elastic model and the Mohr-Coulomb model, but some alternative
stiffness moduli are displayed as well. In soil mechanics the initial slope is
usually indicated as E0 and the secant modulus at 50% strength is denoted as
E50. For materials with a large linear elastic range it is realistic to use E0, but
for loading of soils, one generally uses E50. Considering unloading problems,
as in the case of tunneling and excavations, one needs E0 instead of E50.
139
5.4.2 Poisson’s Ratio (υ)
The selection of a Poisson’s ratio is particularly simple when the
elastic model or Mohr-coulomb model is used for gravity loading. Poisson’s
ratio is evaluated by matching K0. In many cases the value of Poisson’s ratio
ranges from 0.3 to 0.4. In general, such values can also be used for loading
conditions other than one- dimensional compression. For unloading
conditions, however it is more common to use values in the range between
0.15 and 0.25.
5.4.3 Cohesion (c)
The cohesive strength has the dimension of stress. PLAXIS can
handle cohesionless sands (c = 0) but some options will not perform well. To
avoid complications, non experienced users are advised to enter at least a
small value. PLAXIS offers a special option for the input of layers in which
the cohesion increases with depth.
5.4.4 Friction Angle (ø)
The friction angle is entered in degrees. High friction angles, as
sometimes obtained for dense sands, will substantially increase plastic
computational effort. The computing time increases more or less
exponentially with the friction angle. Hence in high friction angles should be
avoided when performing preliminary computations for a particular project.
The friction angle largely determines the shear strength.
5.4.5 Dilatancy Angle (ψ)
The dilatancy angle, specified in degrees. Apart form heavily over
consolidated layers, clay soils tend to show little dilatancy (ψ = 0). The
dilatancy of sand depends on both the density and on the friction angle. For

140
quartz sands the order of magnitude is ψ = φ - 30º. For φ values of less than
30º, however the angle of dilatancy is mostly zero. A small negative value for
ψ is only realistic for extremely loose sands.
5.5 VALIDATION OF PLAXIS
In order to assess the capability of the plaxis software in solving
certain idealised problem it is required to test the software by solving similar
problem for which solution is available.
A PVC pipe of 630 mm diameter and SDR of 35 was modelled
using plaxis FE code for different soil covers above the crown of the pipe. In
this FE model the pipe is modelled as beam element of uniform thickness and
the material of the pipe is idealised as elastic material. The soil medium in
which the pipe buried is idealised as Mohr-Coulomb material to include
elasto-plastic response of soil. The element used for the soil medium is 15
noded triangular element. Interface elements are also used between the soil
and the pipe elements. The properties of soil and pipe material adopted in the
analysis are presented in Table 5.1 which is as reported by Suleiman et al
(2002).
Figure 5.1 presents the typical problem chosen and simulated FE
model for the comparative study. In Plaxis automatic mesh generation was
adopted after creating the geometric model (half boundary). Symmetric
boundary condition was adopted along the centre line of the pipe and
displacements at two other boundaries (both bottom and right vertical
boundary) were arrested. The analysis was performed for various cover
depths under gravity loading.

141
Table 5.1 Properties of Pipe and Soil used in the analysis (Suleiman et al
2002)
Property PVC SOIL E ( kPa ) 2756000 6890
υ 0.45 0.38
t ( mm ) 18.0 - Density ( kN/m3 ) - 18
ø ( deg. ) - 30
Ψ ( deg. ) - 0 C ( kPa ) - 57
2 m
10 m
Soil
Pipe
H
D
Soil
Pipe
a) Physical model b) FE model
Figure 5.1 Problem chosen for comparitive study

142
From the results of the FE analysis conducted the vertical
deflections of the crown of the pipe are determined for different embedment
depths and are compared in Figure 5.2 with the deflections reported by Moser
(1990) in his study conducted on a PVC pipe with SDR 35 at Buried
Structural Laboratory, Utah state university.
The vertical deflection of pipe is increased with cover depth and the
rate of increase in deflection is reduced as reported by Moser (1990) based on
his experimental studies. Plaxis results compare well the experimental results
till the soil cover of 3 m and the difference between them is increased with
cover depth for the depth of cover more than 3. The maximum variation
between the results of Plaxis and Moser is found to be 8% even for the soil
cover of 9 m. The comparison throughout Plaxis FE code simulates behaviour
of buried pipe reasonably well, hence Plaxis programme is used to study the
performance of buried pipe subjected to surcharge load.
0
0.5
1
1.5
2
2.5
3
0 2 4 6 8 10 12
Height of Soil Cover (m)
Vert
ical
Def
ectio
n (%
)
Moser
Plaxis
Figure 5.2 Vertical deflection percent with respect to soil cover for
PVC pipe compared with Moser (1990)

143
5.6 TWO DIMENSIONAL MODELING OF THE BURIED PIPE
TESTS
Finite element analysis program “PLAXIS” was used to study the
interaction of PVC pipe with the backfill soil. The cross trench condition was
analysed as plane strain condition. Six circular segment elements were used
to represent the PVC pipe. Interface elements were used around the pipe to
ensure a complete soil-structure interaction phenomenon. Fifteen noded plane
strain triangular elements were used to model the backfill and the soil is
assumed to follow Mohr-coulomb material model. A vertically free and
horizontally fixed boundary was used for the soil box sidewalls. For the
numerical analysis the vertical outer boundary was assumed to be rigid. The
distance between this boundary and the pipe springing line ranged one pipe
diameter. The influence of this boundary was investigated in the 2D
parametric analysis.
The soil was zoned into two sections as bedding and backfill in
order to represent normal method of installation. They have been assigned
appropriate properties. The boundary between the bedding and the surround
was approximately horizontal, the irregularity of the layer interface being a
function of the method of generating the mesh and the number of elements
used. Figure 5.3 shows the geometry of the model with the boundary
condition.

144
Sand Backfill (Vibrated)
Bedding 400mm (Tamped)
Figure 5.3 Plot of geometry model with boundary conditions
The loading plate of width 0.2 m and length 0.6 m was discretised
as a plate element with the engineering properties of steel. Loading was
simulated by applying a uniform pressure to the width of the plate. For the
finite element tests the vertical outer boundary of the soil was considered to
be rigid.
5.7 PIPE PROPERTIES
The pipe is modeled as beam element and the material of the pipe is
assumed to behave as perfectly elastic material. The properties adopted for
the FE study is outlined in Table 5.2. The values of hoop stiffness EA and the
flexural stiffness EI per m length of the pipe were input directly into the
material data set for the beam column element used in the two dimensional
analysis.

145
Table 5.2 Properties of Materials
Properties Loose Sand
Dense Sand
PVC Steel Plate
GeoGrid (CE 121)
γ (kN/m3) 15 17 - -
E (kN/m2) 9000 19000 0.933E+06 - Υ 0.30 0.30 0.31 0.30 -
EA (kN/m) 4665.00 2.4E+06 60
EI (kNm2 /m) 9.7E-03 28.8 ø (deg.) 32 42 - -
Ψ (deg.) 2 12 - -
Relative Density (%)
15 74
5.8 PRESENTATION AND DISCUSSION OF RESULTS
The results of the laboratory tests and data from 2D finite element
analysis for 200 mm diameter pipes embedded in sand are compared.
5.8.1 Effect of Cover Depth
The influence of cover height on the performance of the 200 mm
diameter pipe predicted by FEA is provided in Figure 5.4 for loose sand
backfill condition. Plots of diametric strains are given against applied pressure
for FEA of tests for cover heights (embedment depths) of 200, 400 and 600
mm cover. It is evident that relatively small increases in cover height
theoretically afford better protection for the pipe. Increasing the cover height
from 200 mm to 400 mm, the prediction of vertical diametric strain at a
surface pressure of 100 kPa was approximately halved. Lateral pipe strains
although small as seen in model tests, were similarly reduced. The predictions
over estimated the observed diametric strains by 7 %.

146
-4.5
-3.5
-2.5
-1.5
-0.5
0.5
1.5
2.5
3.5
0 50 100 150 200
APPLIED SURFACE PRESSURE(kN/m2)
DIA
ME
TRIC
STR
AIN
(%)
H/D = 1
H/D = 2
H/D =3
HORIZONTAL
VERTICAL
Figure 5.4 Influence of cover height on deflections of 200 mm diameter
pipe as predicted by 2D FEA
Table 5.3 Comparison of Vertical diametric strains (%) for different
embedment ratios of the pipe in dense sand backfill
Surface pressure (kN/m2)
H/D = 1 H/D = 2 H/D = 3
Experiment FEM Experiment FEM Experiment FEM
50 -0.745 -0.804 -0.415 -0.448 -0.145 -0.156
100 -1.770 -1.911 -0.810 -0.874 -0.265 -0.286
150 -2.725 -2.943 -1.165 -1.258 -0.380 -0.410
The comparison of vertical diametric strain for embedment ratios of
1, 2 and 3 for the applied surface pressures of 50 kN/m2, 100 kN/m2 and 150
kN/m2 is presented in Table 5.3. The FEM results show a good agreement
with the experimental results for all the different levels of embedment of the
ø = 32º

147
pipe. With the increase in surface pressure the FE results slightly
overestimated the vertical diametric strains of the pipe by 8%. The horizontal
diametric strains obtained from the FEA are compared in Table 5.4 and are
found to overestimate the results. The maximum difference of 9% was
observed when compared with the experimental values. This is due to the
rigid boundary conditions generated in the FE model.
Table 5.4 Comparison of Horizontal diametric strains (%) for different
embedment ratios of pipe in dense sand backfill
Surface pressure (kN/m2)
H/D = 1 H/D = 2 H/D = 3
Experiment FEM Experiment FEM Experiment FEM
50 0.320 0.352 0.255 0.280 0.050 0.054
100 0.725 0.783 0.505 0.555 0.085 0.093
150 1.08 1.188 0.740 0.821 0.120 0.132
5.8.2 Effect of Cover Density
The density indices of the backfill and the surround soil for each
FEA are provided in the legend. It is obvious from the Figure 5.5 that the
pressure – diametric strain behaviours were essentially the same. It appeared
that the soil density variations had marginal influence on the lateral pipe
deflections with loading as observed in model test. The changes in the backfill
and surround soil properties seemed to have little influence on the
development of horizontal pipe diametric strain with loading and again, the
pipe-soil system was predicted to behave linearly.

148
-0.5
-0.4
-0.3
-0.2
-0.1
0
0.1
0.2
0 50 100 150
Applied Surface pressure(kN/m2)
Dia
met
ric S
trai
n (%
)
Loose sand
Dense sand
Vertical
Horizontal
Figure 5.5 Influence of soil density on deflections of 200 mm diameter
pipe with 400 mm of cover, from 2D FEA
5.8.3 Comparison of FEM and Experimental Results without
Geogrid Reinforcement
The match with the experimental data was satisfactory as evidenced
by the plots of diametric strain against applied pressure in Figure 5.6. The
ratio of FEA to observed vertical diametric strains at an applied pressure of
150 kPa was around 8 %.
The correspondence of the FEA output with the horizontal pipe
strain was also satisfactory. Observed pipe diametric strains were almost
identical between the horizontal and vertical directions in the experimental
tests conducted for various cases but the 2D FEA could not exactly simulate
this behaviour owing to the assumption of rigid side wall boundaries. A
typical plot of the vertical deflection of the pipe under a surface pressure of
150 kPa in loose sand backfill is shown in the Figure 5.7.
H/D = 2

149
-1.5
-1
-0.5
0
0.5
1
1.5
0 50 100 150 200
Applied Surface pressure(kN/m 2)
Dia
met
ric S
trai
n (%
)Experimental (w ithoutgeogrid)
FEM (w ithout geogrid)
Horizontal
Vertical
Figure 5.6 Plot of Diametric strain against applied pressure 2D analysis, 200 mm pipe diameter at 400 mm cover without geogrid reinforcement in loose sand
Figure 5.7 Vertical deflection in metres for a 200 mm diameter pipe, 600 mm cover 2D FEA at a surface pressure of 150 kPa in loose sand
ø = 32º

150
(a) Deviatoric stress
(b) Vertical stress at the level of crown of pipe
(c) Horizontal stress on a plane passing at springline of pipe
Figure 5.8 Stresses in kpa for a 200 mm diameter pipe, 600 mm cover 2D FEA at a surface pressure of 150 kPa in loose sand

151
From the Figure 5.8 it is clear that the major principal stress from
the FEA was highest below the edge of the loading plate and adjacent to the
center of the loading plate. The stress concentration from the edge of the
loading plate headed towards the quarter point of the pipe. The plots of
deviator stress show extensive, but similar zone of high stresses, which
reaches the quarter point of the pipe. Such a pattern of stress development
could be expected of granular soil which is conducive to arching. The crown
of the pipe, having deflected significantly has shed load to neighboring pipe
sections. The vertical stresses at the level of crown of pipe are found to be
-29.27 kN/m2 and the horizontal stresses at the springline of the pipe is found
to be -25.91 kN/m2.
Figure 5.9 Development of plasticity for a pressure of 150 kPa in loose
sand
Typical plot of the development of plasticity in loose sand backfill
is presented in Figure 5.9 The Figure is relevant to an applied surface
pressure of 150 kPa. By the time the surface loading had reached 150 kPa, a
152
zone of plasticity had formed below the soil surface. Plasticity had developed
along the unloaded surface adjacent to the loading plate and was heading
downwards along the wall and towards the shoulder of the pipe. More
significantly, a tongue like area of plasticity extended below the edge of the
loaded area. The depth of this zone extended for half the backfill cover height.
The development of this zone as loading continued resulted in the instability
of the finite element analysis more often in the case of loose sand backfill.
This observation is in good agreement with the earlier investigation carried
out by Cameron (2005) using Finite element code ‘AFENA’
-0.35
-0.3
-0.25
-0.2
-0.15
-0.1
-0.05
0
0.05
0.1
0.15
0 50 100 150 200
Applied Surface pressure(kN/m 2)
Dia
met
ric S
trai
n (%
) Experimental (w ithoutgeogrid)
FEM (w ithout geogrid)
Horizontal
Vertical
Figure 5.10 Plot of diametric strain against applied surface pressure for
200 mm diameter pipe with 600 mm cover in dense sand,
against 2D analysis
A further example is provided in Figure 5.10 in which the applied
pressure and corresponding diametric strain of the pipe are compared for the
pipe tests with 600 mm of cover. The test observations indicated a slight
difference in both the horizontal and vertical pipe responses with loading. The
ø = 42º
153
match between the FE predictions and the experimental results was
appreciable upto 50 kpa and with the increase in surface pressure the FEA
predictions slightly overestimated the test deflection data.
It is also apparent in the plots that the two-dimensional FEA
predictions of pipe–soil system behaviour indicated an almost linear
development of pipe deflection with applied pressure.
Figure 5.11 provides further data from the FEA of the test with the
dense sand backfill. In this Figure, plots are provided for vertical deflection
contour, principal stress and deviatoric stress, which corresponded to the
average applied surface pressure of 100 kPa.
(a) Vertical deflection
Figure 5.11 (Continued)

154
(b) Principal stress
(c) Deviatoric stress
Figure 5.11 2D FEA data for 200 mm diameter pipe test (600 mm of cover) in dense sand
The major principal stress was highest below the edge of the
loading plate and the stress concentration headed towards the pipe. Deviatoric
stresses show more extensive but similar zone of stresses which reaches the
quarter point of the pipe. The crown of the pipe having deflected significantly
has shed load to the neighbouring pipe sections. The development of plasticity

155
in the analysis is indicated in the Figure 5.12. The corresponding average
surface pressure is 100 kPa. It is predicted that plasticity will quickly develop
at shallow depth below the unloaded surface of the backfill. With loading, plasticity progresses downwards beside the unloaded surface of the backfill.
Figure 5.12 Development of Plasticity with displacement of the loading
plate, 2D FEA of test, 600 mm of cover in dense sand
With loading, plasticity progresses downwards, beside the first two
elements from the axis of symmetry that is beside the directly loaded area.
Further loading not only deepens the plastic zone but also induces plasticity
immediately below the edges of the plate. The depth of the zone almost
reaches half the cover height.
5.8.4 Comparison of FEM and Experimental Results with Geogrid
Reinforcement
The effect of single layer of geogrid reinforcement provided at 100
mm (0.5D) and 200 mm (D) above the pipe crown on vertical and horizontal
deflections are compared between finite element and experimental results and
are presented in the Figure 5.13. The provision of geogrid reinforcement

156
reduced the vertical deflections on the crown of the pipe by 20%. However
the FEM results slightly overestimated the experimental results on the average
by 8% for the range of surface pressures studied. The horizontal strains in the
pipe were satisfactory and the FEM results matched well with the
experimental results.
-1.4
-1.2
-1
-0.8
-0.6
-0.4
-0.2
0
0.2
0.4
0.6
0.8
0 50 100 150
Applied Surface pressure(kN/m 2)
Dia
met
ric S
trai
n (%
)
Experimental
FEM
Horizontal
Vertical
(a) Geogrid reinforcement at 100 mm above the pipe crown in loose sand (Type I reinforcement)
-1.2
-1
-0.8
-0.6
-0.4
-0.2
0
0.2
0.4
0.6
0.8
0 50 100 150
Applied Surface pressure(kN/m 2)
Dia
met
ric S
trai
n (%
)
Experimental
FEM
Horizontal
Vertical
(b) Geogrid at 200 mm above the pipe crown in loose sand (Type II reinforcement)
Figure 5.13 Plots of Diametric strain Vs Applied surface pressure for 400 mm cover with geogrid reinforcement as predicted in 2D FEA
ø = 32º
ø = 32º

157
-1.4
-1.2
-1
-0.8
-0.6
-0.4
-0.2
0
0.2
0.4
0.6
0 50 100 150
Applied Surface pressure(kN/m2)
Dia
met
ric S
trai
n (%
)
Experimental
FEM
Horizontal
Vertical
(a) Single layer of Geogrid reinforcement at the springing line of the pipe in
Loose sand (Type III reinforcement)
(b) Two layers of Geogrid reinforcement at the springing line of the pipe with
50mm loose sand packing in between the layers (Type IV reinforcement)
Figure 5.14 (Continued)
ø = 32º
-1.5
-1
-0.5
0
0.5
1
0 50 100 150 200
Applied Surface pressure(kN/m 2)
Dia
met
ric S
trai
n (%
)
FEM
Experimental
Horizontal
V
Vertical ø = 32º

158
-1.2
-1
-0.8
-0.6
-0.4
-0.2
0
0.2
0.4
0 50 100 150
Applied Surface pressure(kN/m 2)
Dia
met
ric S
trai
n (%
)
Experimental
FEM
Horizontal
Vertical
(c) Two layers of Geogrid reinforcement at the springing line of the pipe with
50 mm dense sand packing in between the layers (Type V reinforcement)
Figure 5.14 Plot of Diametric strain Vs Applied surface pressure for 200
mm diameter pipe with 400 mm cover for Type III, Type IV
and Type V reinforcements as predicted in 2D FEA
The Figure 5.14 shows the comparison of finite element results
with the experimental results when geogrid reinforcement was placed in a
single layer along the springline and when two layers geogrid are placed
along the springline of the pipe with 50 mm of loose or dense sand packing
in-between the layers. It was observed that the presence of geogrid
reinforcement along the springline of the pipe reduced the lateral deflection of
the pipe significantly by 38%. However these results were found to be 9%
higher than the experimental results even though there was reasonable
agreement with the horizontal pipe strain. In the case of Type IV
reinforcement the FE results closely matched with the experimental results for
the horizontal diametric strain of the pipe. The FE results were found to be
5% higher than the experimental observations for an applied surface pressure
ø = 32º

159
of 150 kN/m2. A similar observation was made with two layers of geogrid
placed along the springline with 50 mm dense sand packing in-between the
layers. The reduction in vertical and horizontal deflections observed in FE
results were 17% and 65%respectively. But these slightly overestimated the
experimental results on the average by 9 %.
Table 5.5 Comparison of Horizontal diametric strains (%) for H/D = 3 in
loose and dense sand
Surface pressure (kN/m2)
Reinforcement Loose sand Dense sand
Experiment
FEM
Experiment
FEM
50 Type III
0.024 0.025 0.016 0.017
100 0.045 0.048 0.030 0.032
150 0.064 0.069 0.052 0.056
50 Type IV
0.036 0.038 0.018 0.019
100 0.050 0.054 0.036 0.038
150 0.070 0.075 0.058 0.062
50 Type V
0.014 0.015 0.007 0.008
100 0.024 0.026 0.017 0.018
150 0.030 0.032 0.025 0.027
Typical results of horizontal diametric strain (%) obtained for an
embedment ratio of 3 (i.e. 600 mm from the surface of the backfill)
corresponding to 50 kN/m2, 100 kN/m2 and 150 kN/m2 are presented in
Table 5.5. The FE results showed a slight overestimation in the range of 7.5 to
8% in the observed horizontal strains for the surface pressures considered.
This observation was evident for the pipe buried in both loose and dense sand
backfills.

160
Table 5.6 Comparison of Hoop stresses at the crown of the pipe with
Type I and Type II reinforcement for H/D = 2 in loose sand
Surface pressure (kN/m2)
Type I reinforcement Type II reinforcement
Experiment (kN/m2)
FEM (kN/m2)
Experiment (kN/m2)
FEM (kN/m2)
50 -0.151 -0.164 -0.149 -0.160
100 -0.292 -0.315 -0.285 -0.306
150 -0.391 -0.420 -0.382 -0.414
The hoop stresses obtained at the crown of the pipe with Type I and
Type II reinforcement for the pipe embedded at a depth of 400 mm from the
surface of the loose sand backfill is presented in Table 5.6. The FEM shows
higher values for both the types of reinforcements. The stress values obtained
from the experimental studies are found to be 9% lesser than the finite
element results for the surface pressures considered.
The FE predictions of the hoop stresses at the springline of the pipe
embedded at 400 mm from the surface of the backfill with geogrid
reinforcement is compared with the experimental results obtained from
laboratory model tests in Figure 5.15. From the FE predictions it is clear that
the Type V reinforcement reduces the hoop stresses by 40% at a surface
pressure of 100 kPa. But the FE predictions tend to be higher than the
experimental results by 7.5% on the average for the surface pressures
considered.
161
00.050.1
0.150.2
0.250.3
0.350.4
0.45
Hoop
Stre
ss (k
N/m
2 )
50 100 150
Applied Surface Pressure ( kN/m2)
Expt (Type I)FEM (Type I)Expt (Type II)FEM (Type II)Expt (Type III)FEM (Type III)Expt (Type IV)FEM (Type IV)Expt (Type V)FEM (Type V)
Figure 5.15 Comparison of Hoop stresses at the springline of the pipe with geogrid reinforcement for H/D = 2 in loose sand
Typical contour plots obtained for the pipe embedded at a depth of 400 mm from the surface of the dense sand backfill with Type II
reinforcement (i.e. provision of geogrid at 200 mm above the crown of the pipe) for an applied surface pressure of 150 kPa is shown in Figure 5.16. The
plots give a clear understanding of the mechanism of the buried pipe. Figure 5.16(a) shows the FE model with the provision of geogrid reinforcement at 200 mm above the crown of the pipe. The deformed mesh obtained at an applied surface pressure of 150 kN/m2 shown in Figure 5.16(b) indicates that
the deformations of buried pipe need not be exactly elliptical. This is in agreement with the conclusions reported by Sivakumar et al (2006) in his finite element studies on buried steel pipes subjected to gravity loading.
The displacement contour is shown in Figure 5.16(c) and the maximum vertical displacement as predicted by FEM is found to be
-3.44 mm. The stresses developed in the principal directions are shown in Figure 5.16(d) and the extreme principal stress predicted by FE analysis is -198.99 kN/m2. The mean deviatoric stress reaches a maximum value of 118.30 kN/m2 and the stress contour is illustrated in Figure 5.16(e). The finite
element studies predicted a maximum shear strain of 9.51%. The contour

162
lines shown in Figure 5.16(f) indicate the shear strains developed at the shoulder, haunch of the pipe and the edge of the loading plate.
(a) FE model with geogrid reinforcement at 200 mm above the pipe crown
(Type II reinforcement)
(b) Deformed mesh
Figure 5.16 (Continued)

163
(c) Vertical displacements in metres, 400 mm cover 2D FEA
(d) Principal stress
Figure 5.16 (Continued)

164
(e) Deviatoric stress in kPa for 400 mm cover of 200 mm diameter pipe, 2D FEA
(f) Shear strain (%) for 400 mm cover of 200 mm diameter pipe, 2D FEA
Figure 5.16 Contour plots of 2D FEA for 200 mm diameter pipe, 400
mm cover in dense sand at 150 kPa

165
The variation of vertical stress on a horizontal plane at the level of
the crown of the pipe is found to be -81.22 kN/m2 which is less than the
effective overburden pressure. Similarly the horizontal stress at the springline
is determined and its value is -59.68 kN/m2. The stress variations are
illustrated in Figure 5.17.
(a) Vertical stress at the level of the crown of pipe
(b) Horizontal stresses at the springline of the pipe
Figure 5.17 Stresses at the crown and springline of the pipe
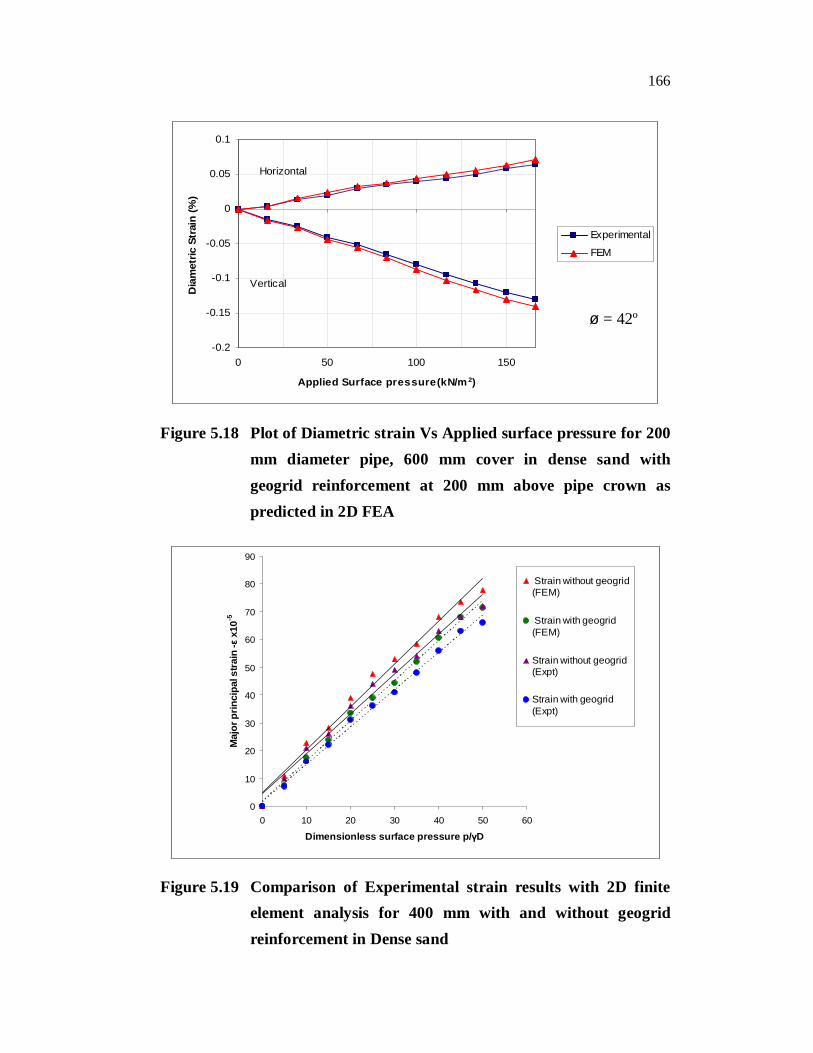
Figure 5.18 shows the compatibility of FE and experimental results
as observed in the dense sand with Geogrid reinforcement placed at 200 mm
above the pipe crown. The pipe is embedded at a depth of 600 mm from the
surface. The results are satisfactory with the reduction in the vertical crown
deflection observed as 40% in 2D analysis. But the FE results have
overestimated the vertical deflection by 10% and the lateral deflection by 9%
when compared with the experimental results.
166
-0.2
-0.15
-0.1
-0.05
0
0.05
0.1
0 50 100 150
Applied Surface pressure(kN/m 2)
Dia
met
ric S
trai
n (%
)
Experimental
FEM
Vertical
Horizontal
Figure 5.18 Plot of Diametric strain Vs Applied surface pressure for 200 mm diameter pipe, 600 mm cover in dense sand with geogrid reinforcement at 200 mm above pipe crown as predicted in 2D FEA
0
10
20
30
40
50
60
70
80
90
0 10 20 30 40 50 60
Dimensionless surface pressure p/γD
Maj
or p
rinci
pal s
train
-ε x
10-5
Strain without geogrid(FEM)
Strain with geogrid(FEM)
Strain without geogrid(Expt)
Strain with geogrid (Expt)
Figure 5.19 Comparison of Experimental strain results with 2D finite element analysis for 400 mm with and without geogrid reinforcement in Dense sand
ø = 42º

167
From the Figure 5.19 it is evident that the use of geogrid
reinforcement reduces the strain on the crown of the pipe thereby offering
better protection to the pipe. The finite element results agree reasonably well
with the experimental results. Lateral strains on the pipe were similarly
reduced.
5.9 PARAMETRIC STUDIES
A series of parametric studies to gain further insights into the soil-
pipe interaction problem was conducted using Finite element method,
PLAXIS. The input parameters for the material and the soil were chosen as
given in Table 5.2
In the first case of parametric study the trench width was increased
by one pipe diameter (i.e. 200 mm) on either side and was designated as the
full model analysis. The soil on eiether side was idealized as natural soil with
modulus of elasticity 7000 kN/m2 and density 20 kN/m3 . In the second study
the thickness of the pipe was varied with the commercially available
thicknesses such as 5 mm, 6.8 mm and 7.9 mm for 200 mm diameter PVC
pipe. In the third case the trench width was varied to study the effect of
distributed load on the pipe deflections. In the last case of this parametric
analysis the influence of interface reduction factor on the pipe deflections and
stresses were studied. Results of the studies are summarized and the
comments are made while examining the plots.
5.9.1 Influence of Trench Width
Comparisons of the typical results obtained from the analysis of the
experimental model and the full model are provided in Figure 5.20 although
the vertical deflections appeared to be similar above the pipe crown the
deflections were laterally restricted within the backfill of the full soil model.

168
The perfectly rough interface between the sand in the trench and the natural
soil at the side appeared to have restricted the development of vertical
deflection. Lateral deflection although small, whereas expected more
pronounced for the full model.
It was evident from Fig 5.20 that the pipe between the spring line
and the crown was able to expand more freely in the full model as the crown
deflected. As the trench width decreases, the proportionate sharing of the soil
load between the pipe and the side fill is increased due to the weakening of
soil arch resulting from the limited soil fill at the springing. A flexible pipe
buried with similar boundary conditions will be subjected to even higher
displacement than those buried in wider trench. The distribution of soil load
due to soil arching causes the shoulder of the pipe to carry a higher soil load
and the pipe is supported more at the haunch than at the pipe invert.
In flexible buried pipes a higher vertical stress in the soil is
developed at the level of the pipe springing, where soil in this zone act as
vertical earth column supporting the soil arch. In the case of narrow trench
width this zone is in close proximity to the trench boundary but in wider
trench this zone seperates from trench boundary.

169
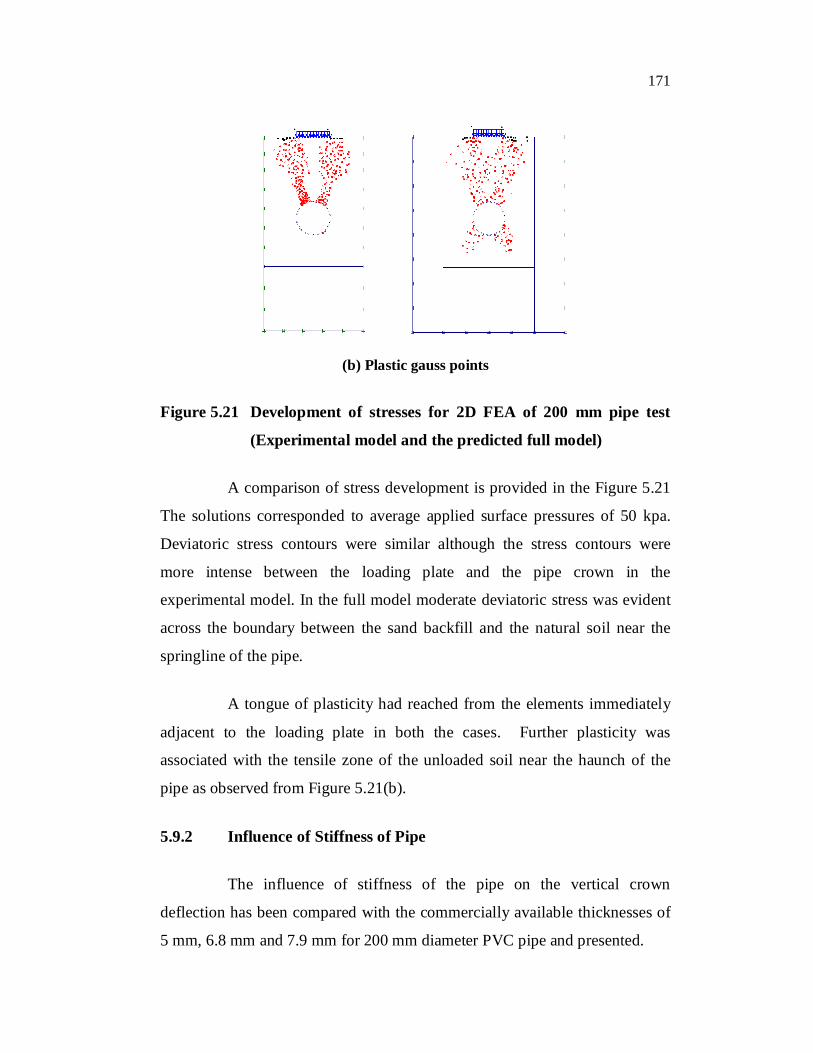
Figure 5.20 Deflection contours for 2D FEA of 200 mm pipe test
(Experimental model is above the predicted full model)
Natural Soil
Sand Backfill

170
(a) Deviatoric stress
Figure 5.21 (Continued)
171
(b) Plastic gauss points
Figure 5.21 Development of stresses for 2D FEA of 200 mm pipe test
(Experimental model and the predicted full model)
A comparison of stress development is provided in the Figure 5.21
The solutions corresponded to average applied surface pressures of 50 kpa.
Deviatoric stress contours were similar although the stress contours were
more intense between the loading plate and the pipe crown in the
experimental model. In the full model moderate deviatoric stress was evident
across the boundary between the sand backfill and the natural soil near the
springline of the pipe.
A tongue of plasticity had reached from the elements immediately
adjacent to the loading plate in both the cases. Further plasticity was
associated with the tensile zone of the unloaded soil near the haunch of the
pipe as observed from Figure 5.21(b).
5.9.2 Influence of Stiffness of Pipe
The influence of stiffness of the pipe on the vertical crown
deflection has been compared with the commercially available thicknesses of
5 mm, 6.8 mm and 7.9 mm for 200 mm diameter PVC pipe and presented.

172
0
0.2
0.4
0.6
0.8
1
1.2
1.4
1.6
1.8
2
0 50 100 150
Applied surface pressure(kN/m 2)
Def
lect
ion
(mm
)
t=5mm
t=6.8mm
t=7.9mm
Figure 5.22 Variation of vertical deflection with applied surface pressure
for 200 mm pipe with varying thickness for H/D ratio of 1
From the Figure 5.22 it is observed that the variation in deflection
with respect to decrease in wall thickness is not significant and the deflection
obtained is considerably lower than the allowable limit of 5% of the diameter
of the pipe under static loading conditions. This typical behaviour was
observed in the pipe embedded at depths of 400 mm and 600 mm from the
surface of the loose and dense sand backfills. Stress increases with the
decrease in the thickness of the pipe as evident from the contour plots shown
in Figure 5.23.
H/D = 1 Ø = 32º

173
(a) 5mm
(b) 6.8 mm
Figure 5.23 (Continued)

174
(c) 7.9 mm
Figure 5.23 Development of deviatoric stresses in 200 mm diameter pipe
with Varying thickness, 2D analysis at 200 mm cover
It is expected that an increase in pipe stiffness would result in an
increase in imposed deviatotic stress on the pipe, the degree of load shedding
(Positive arching) being controlled by the relative stiffness of the pipe and the
sidefill reducing as the pipe stiffens and thus the ratio increasing. These
studies are useful to estimate the deflection of the PVC pipe buried in soil for
a specified range of stiffness ratios, but only for simple boundary and loading
conditions considered. The approach can be extended to consider the
installation processes and the site conditions specific to regions or local
bodies.
5.9.3 Effect of Loading Area
The width of the loading plate varied from 0.5D to 1.5D and
subjected to 50 kpa of static loading in loose sand backfill. The vertical
deflection and the stresses observed are presented and discussed.

175
(a) 100 mm wide loading plate
(b) 200 mm wide loading plate
Figure 5.24 (Continued)

176
(c) 300 mm wide loading plate
Figure 5.24 Deflection contours for 200 mm diameter pipe with variable
width of loading plate, 2D analysis
(a) 100 mm wide loading plate
Figure 5.25 (Continued)

177
(b) 200 mm wide loading plate
(c) 300 mm wide loading plate
Figure 5.25 Stress contours for 200 mm diameter pipe with variable
width of loading plate, 2D analysis

178
The development of displacements and stresses in the 2D analysis
of 200 mm diameter pipe with variable width of the loading area is indicated
in the Figures 5.24 and 5.25 respectively. Three contour plots of deformation
and stresses corresponding to the loading area for an applied surface pressure
of 50 Kpa is shown. It is evident from the plots that the deflection and the
stresses on the crown of the pipe increased with the increase in the width of
the loading area. The extreme displacements obtained were 2.18 mm, 2.67
mm and 2.89 mm for 100, 200 and 300 mm width of the loading plate
respectively. The corresponding extreme deviatoric stresses obtained were
37.13 kN/m2, 37.51 kN/m2 and 39.19 kN/m2.
5.9.4 Influence of Interface Element
Interface elements allow the soil element to slip or separate from
the pipe surface when the shear stresses and the normal stresses in the
interface reach a threshold. The absence of interface element leads to the
direct connection between the soil elements and the structural elements
thereby leading to higher values.
In the light of the numerical results it can be stated that the interface
elements have a significant influence on the deformations of the pipe and the
stresses generated in the pipe. It is observed that the first step of the
compaction simulation produced a smaller vertical elongation and horizontal
deflection in the case without interface. This is related to the interface
elements attached to the beam elements and generating tension limiting
vertical elongations and horizontal deflection. The absence of interface
elements generated an increase of earth pressure at the pipe’s haunch leading
to higher vertical elongation and horizontal deflection.

179
The arching effect described by Marston does not take into
consideration the effect of friction of the backfill material on the pipe’s
surface. Marston relates the arching effect to the relative movement of the
backfill directly above the pipe with respect to the soil on both sides of the
trench. The rigidity of the pipe and the density of the backfill have a
considerable effect on the arching. For instance a loose soil placed above the
pipe will settle more than the side fills. The friction between the sides fills and
the loose soil will reduce the load applied on top of the pipe resulting in
arching. However the numerical analysis with interface elements generated
greater arching than the analysis without interface elements.
Figure 5.26 Deformed mesh for 200 mm diameter pipe, 2D analysis with
interface reduction factor of 1.0

180
The deformed mesh shown in the Figure 5.26 indicates the effect of
interface element on the pipe buried at 200 mm from the surface and
subjected to a surface pressure of 50 kPa.
The influence of interface reduction factor on the deformation of
the pipe was insignificant. The vertical elongation and the horizontal
deflections were almost the same using the interface reduction factors of 0.5,
0.67, 0.85 and 1.0. The total deformations were higher in the case of weaker
interface. The interface is particularly deformed at the haunch of the pipe
which was predominant when the pipe was buried at 600 mm from the
surface. The interface strength has an influence on the normal effective
stresses applied on the buried PVC pipe. However, the deformation of the
pipe did not reflect this increase of stress. The overburden pressure may be
too low to generate loads that would have a considerable effect on the
deformation of the pipe related to the interface strength. The normal effective
stress at the pipe’s crown was about 28.07 kN/m2 at the completion of the
backfill with an interface reduction factor of 0.5. This stress was increased to
35.5 kN/m2 with an interface reduction factor of 1.0. The analysis with higher
interface reduction factors produced higher stresses. The relative earth
movements along the top of the pipe relax the pressure at the pipe’s crown.
This phenomenon is increased as the interface reduction factor, or the
interface strength is decreased.
5.10 SUMMARY
The experimental tests conducted with and without geogrid
reinforcement in loose and dense conditions of sand backfill were adequately
modelled by the two dimensional FEA program ‘PLAXIS’. The 2D FEA
could provide some guidance on the likely response and patterns of the
behaviour of pipes subjected to applied surface pressures. The finite element
predictions slightly overestimated the experimental results. This could have

181
been due to the assumption of rigid side boundary in FE analysis . However
the predictions clearly indicated that the 2D FEA could be used with some
caution to provide a relative measure of the importance of backfill cover
height and the provision of geogrid reinforcement at different levels and
locations to offer better protection for flexible plastic pipes.