Embed Size (px)
Citation preview

65
CHAPTER 4
PREPARATION, CHARACTERIZATION OF PEROVSKITE
LaFeO3 NANOSPHERES AND ITS VISIBLE LIGHT
PHOTOCATALYTIC ACTIVITY
4.1 INTRODUCTION
Perovskite-type materials are important functional materials, having
a general formula of ABO3 (where A is a rare-earth element and B is a 3d
transition metal) are very promising due to their innovative use in advanced
technologies. Nowadays perovskite-type oxide RFeO3 (where R stands for
rare-earth element) materials have attracted considerable attention because of
their useful application in many fields (Liu et al 2011, Farhadi et al 2009,
Feng et al 2011). They have attracted considerable attention for various
applications, such as solid oxide fuel cells (Fujii et al 2011, Li et al 2011),
sensors (Farahadi et al 2009, Feng et al 2011), environmental catalysts
(Farahadi et al 2009, Feng et al 2011, Fujii et al 2011, Li et al 2011) and
magnetic material (Abazari et al 2013, Wang et al 2206, Li et al 2007) etc.
LaFeO3 is one of perovskite-type oxide that has an orthorhombic perovskite
structure. LaFeO3 is known to be antiferromagnet with a Neel temperature TN
of 738 K (Fujii et al 2011). Recently, rare-earth perovskites nanoparticles,
such as LaMnO3, LaFeO3, GdFeO3, BiFeO3, TbFeO3 and YFeO3, have
received increasing attention and been applied as photocatalysts (Li et al
2009, Li et al 2014, Li et al 2012, Wang et al 2011, Yang et al 2013, Stevens
et al 2014). When compared with bulk these nanoparticles have higher

66
photocatalytic performance due to their higher catalytic activity and larger
surface area, but their active life is short due to their instability and tendency
to aggregate in to bigger ones.
The LaFeO3 has received considerable attention because of its
strong photocatalytic activity (Tijare et al 2012, Li et al 2010, Gao et al 2012,
Thirumalairajan et al 2012). Recently, LaFeO3 powders were found to exhibit
visible-light photocatalytic activity due to their narrow band gaps (Eg < 3.0
eV). It was found that the structures and properties of the materials were
highly dependent on synthesis process of its precursor powders, so the
improvement of preparation method of these powders is paid much attention
by researchers (Kaiwen et al 2013). The preparation of LaFeO3 have been
achieved by many methods, including solid-state reaction (Kaiwen et al 2013)
sol-gel (Feng et al 2011, Li et al 2007, Rusevova et al 2014), hydrothermal
(Thirumalairajan et al 2012), microwave assisted (Farhadi et al 2009) and
polymerizable complex method (Popa et al 2002, Popa et al 2011) etc.
LaFeO3 are commonly prepared by solid-state reactions at high temperatures
(>900 °C). This technique, which uses metal oxides as starting precursors and
requires several annealing processes at high temperatures during long periods
of time with frequent intermediate grindings, has several problems, e.g., poor
homogeneity and high porosity of the samples, no control on the particle size,
etc. The development of innovative processing methods through chemistry
permits one to lower the preparation temperature and to improve homogeneity
and reproducibility of the ceramic products, with the synthesis of ultrafine and
chemically pure powders of mixed-metal oxides at low temperatures. Among
the various wet chemical methods, hydrothermal method is a facile dominant
tool for the synthesis of nanoscale material. The main advantages of this
method are low temperature growth, controlled size, simple and cost
effective. In general, citric acid is a common and good chelating agent for
metal ions to form coordination complexes. Lanthanum citrate and ion citrate
67
coordination complex can easily be synthesized by hydrothermal reaction.
Therefore, it is attractive to develop a low-cost and facile hydrothermal
approach for the synthesis of LaFeO3.
The novel LaFeO3 nanosphere has been prepared by hydrothermal
method. The prepared nanospheres were subjected to structural,
morphological, magnetic and optical property studies. The photocatalytic
activity of LaFeO3 nanospheres were investigated by the degradation of MO
under the visible-light irradiation. In addition, the possible reaction
mechanism for the formation of LaFeO3 nanospheres was discussed in detail.
4.2 EXPERIMENTAL DETAILS
A stoichiometric amount of lanthanum (III) nitrate hexahydrate
[La(NO3)3.6H2O] and iron (III) nitrate nanohydrate [Fe(NO3)3.9H2O] were
dissolved in 50 ml of double distilled water under magnetic stirring.
Appropriate amount of citric acid was added to the solution. The molar
amount of citric acid added to the solution was taken in three different ratios
1:1, 1:1.5 and 1:2. The solution was continuously stirred for 5 h at room
temperature. Ammonia solution was slowly added to adjust the pH 9.2 and
also to stabilize the nitrate-citrate solution. After stirring for 3 h at room
temperature, the resulting mixture was -lined
stainless-steel autoclave with a capacity of about 70 mL, the autoclave
was sealed and heated at 180 °C for 20 h and then cooled naturally to
room temperature. The obtained precipitate was collected and washed
with deionized water and anhydrous ethanol several times and then dried
in air at 100 °C, followed by calcination at 800 °C for 6 h to obtain LaFeO3
powder.

68
4.3 CHARACTERIZATION STUDIES
The as-synthesized sample was first subjected to thermal analysis in
order to find the decomposition, stability and phase formation of the material
using SII TG/DTA 6300 thermal analyzer. The TGA curve was recorded in
the range from 27 to 900 °C with a heating rate of 20 °C/min under nitrogen
atmosphere. Powder X-Ray diffraction analysis (XRD) was carried out for the
annealed samples with a GE Inspection Technologies 3003TT model
1
kV, and 30 mA. The X-
from 10º to 70º and was inspected using JCPDS data to identify the
crystallographic phases. The FT-IR measurements have been performed in the
potassium bromide mode (KBR) using the model 6300 FT-IR
spectrophotometer. The vibrational characteristics of the LaFeO3 powders
were investigated using Renishaw invia Raman microscope, Leica DMLM,
RL663 laser. The surface morphology of synthesized samples and elemental
presence has been studied by high resolution scanning electron microscopy
(HRSEM) using FEI Quanta FEG 200 microscope operated at 20 kV. The
particles size and morphology of the synthesized sample has been studied by
high resolution transmission electron microscopy (HRTEM) using Tecnai G2
model T-30 s-twin electron microscope with an accelerating voltage of 300
kV. The atomic force microscopy (AFM) measurements of the sample have
been performed in non-contact mode at room temperature using XE 70 Park
system. X-ray photoelectron spectroscopy (XPS) has been done to confirm
the oxidation state of the elements present in the sample. The XPS data were
collected using Omicron Nanotechnology instrument with a binding energy
resolution of 0.7 eV. The optical absorption study of the synthesized sample
has been carried out in the range of 200-900 nm using Cary 5E high
resolution spectrophotometer. The vibrating sample magnetometer (VSM)

69
measurements were recorded for two different temperatures (20 K and 300 K)
using Lakeshore VSM 7410.
4.4 RESULTS AND DISCUSSION
4.4.1 Thermal Studies
The optimizing annealing temperature of the synthesized powder
was carried out by TG analysis and shown in Figure 4.1. TGA curve shows
four weight loss segments. It can be seen that the first and last segment are
due to the elimination of water and the crystallization process of the material.
The second significant weight loss observed between 200 to 310 °C is mainly
due to the decomposition of organic compounds like C N, C H and C=O.
The third weight loss was up to ~500 °C may be due to the decomposition of
nitrates (NO3-). There is no further weight loss was observed after ~700 °C
which confirms the possible formation of metal oxide phase of perovskite
LaFeO3. With respect to above result the sample was annealed at 800 °C.
Figure 4.1 TGA curve of as-synthesized LaFeO3 sample

70
4.4.2 X-ray Diffraction Studies
Figure 4.2 XRD patterns of LaFeO3 sample synthesized at different metal nitrate to citric acid ratio (1:1, 1:1.5 and 1:2)
Figure 4.2 shows the XRD patterns of the products synthesized at
different concentrations of citric acid. The XRD pattern of as-synthesized
sample shows an amorphous phase while increases the temperature to 800 °C
single phase orthoferrite with high crystallinity was obtained. All the
diffraction peaks of the sample were assigned to orthorhombic phase and are
indexed on the basis of JCPDS file No. 37-1493. The strong and narrow
diffraction peaks indicate that the obtained material has a good crystallinity
and size. No characteristic peaks from other impurities are detected hence the
prepared LaFeO3 sample (metal nitrate to citric acid ratio 1:2) was highly
pure. Using Debye Scherrer formula the average crystallite size was
calculated and it was found to be about 45 nm. It can be seen that 2 ratio of
citric acid is an optimum condition to get the pure perovskite orthorhombic
71
LaFeO3, and less than 2 ratio of citric acid will induce impurities in the final
products. When both 1 and 1.5 ratio of citric acid was used, the products were
almost La(OH)3 and small LaFeO3 was obtained. Hence the purity of the
products was enhanced as the usage of citric acid increases to 2 ratio. This
result is similar to previous report (Thirumalairajan et al 2012).
4.4.3 FT-IR Studies
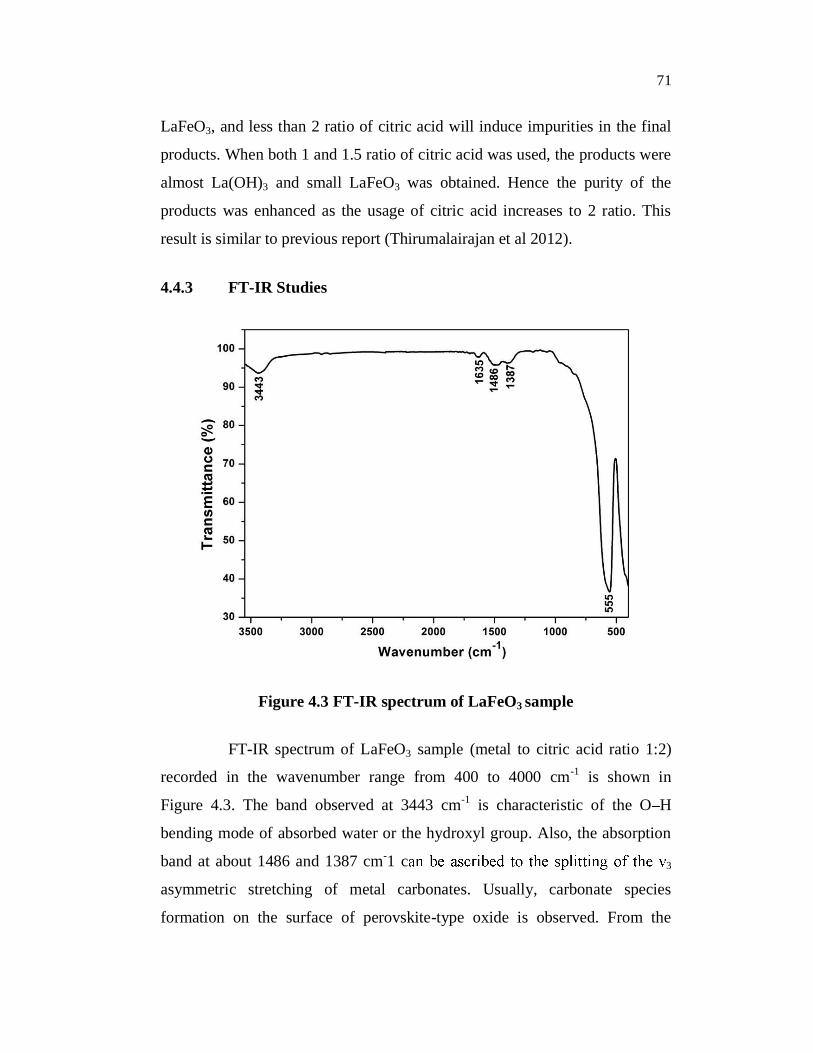
Figure 4.3 FT-IR spectrum of LaFeO3 sample
FT-IR spectrum of LaFeO3 sample (metal to citric acid ratio 1:2)
recorded in the wavenumber range from 400 to 4000 cm-1 is shown in
Figure 4.3. The band observed at 3443 cm-1 is characteristic of the O H
bending mode of absorbed water or the hydroxyl group. Also, the absorption
band at about 1486 and 1387 cm-1 c 3
asymmetric stretching of metal carbonates. Usually, carbonate species
formation on the surface of perovskite-type oxide is observed. From the
72
spectrum it was observed that the strong absorption band at 555 cm-1 indicates
the formation of LaFeO3. The 555 cm-1 band is attributed to the Fe O
stretching vibration, being characteristics of the octahedral FeO6 groups in
LaFeO3 which is commonly observed in the region 500-700 cm-1 for the
perovskite (ABO3) compounds (Feng et al 2011, Abazari et al 2013).
4.4.4 Raman Studies
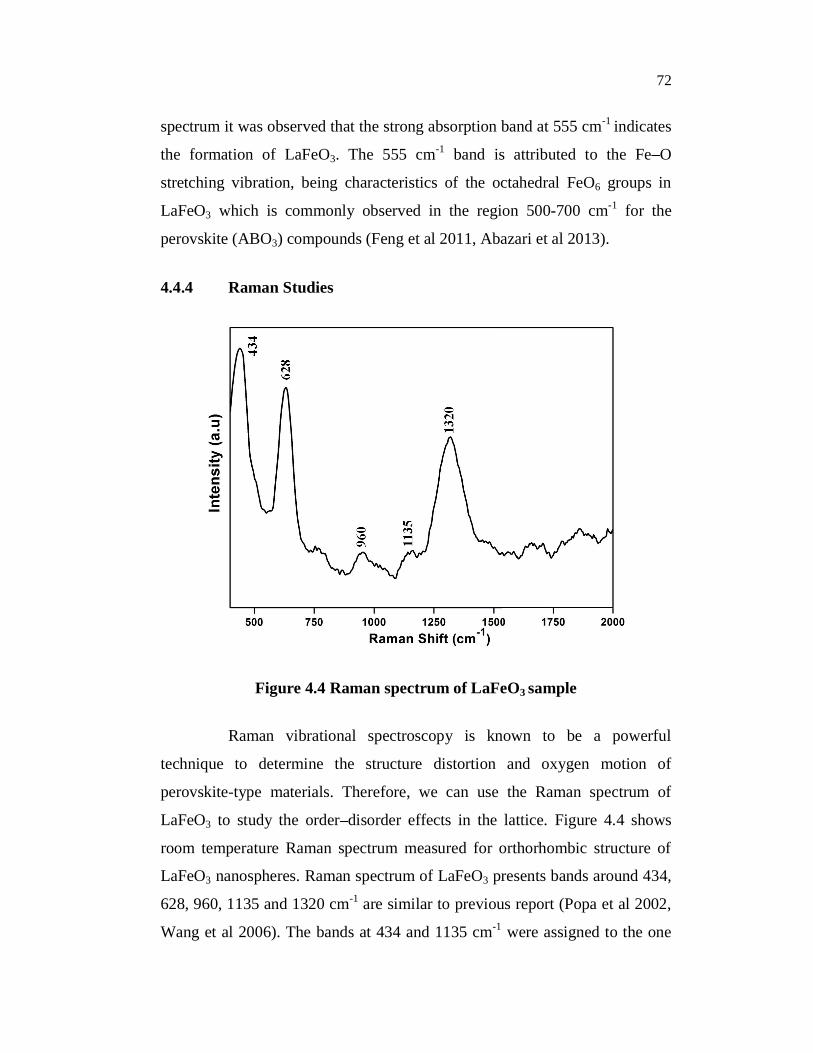
Figure 4.4 Raman spectrum of LaFeO3 sample
Raman vibrational spectroscopy is known to be a powerful
technique to determine the structure distortion and oxygen motion of
perovskite-type materials. Therefore, we can use the Raman spectrum of
LaFeO3 to study the order disorder effects in the lattice. Figure 4.4 shows
room temperature Raman spectrum measured for orthorhombic structure of
LaFeO3 nanospheres. Raman spectrum of LaFeO3 presents bands around 434,
628, 960, 1135 and 1320 cm-1 are similar to previous report (Popa et al 2002,
Wang et al 2006). The bands at 434 and 1135 cm-1 were assigned to the one
73
phonon scattering, while 1320 cm-1 were assigned to the two phonon
scattering (Lee et al 2014). The band at 630 cm-1 band in LaFeO3 was
assigned to impurity scattering (Lee et al 2014, Gallego et al 2013,
Chandradass 2010, Koshizuka 1980).
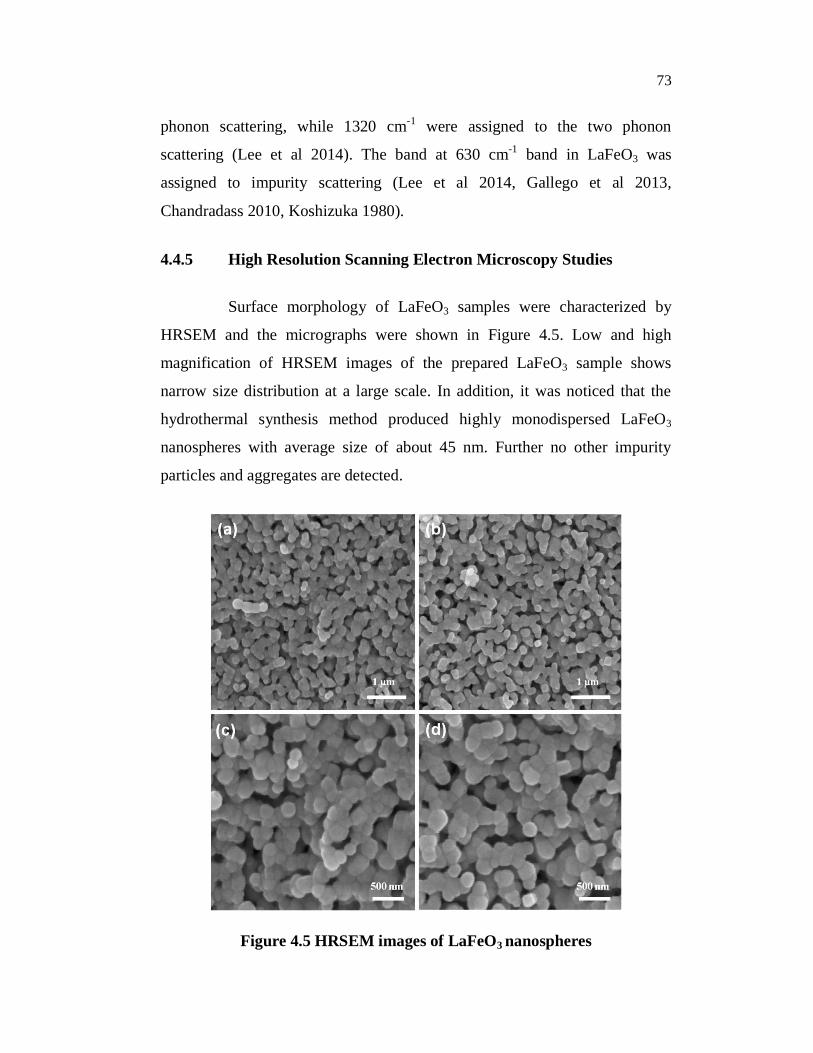
4.4.5 High Resolution Scanning Electron Microscopy Studies
Surface morphology of LaFeO3 samples were characterized by
HRSEM and the micrographs were shown in Figure 4.5. Low and high
magnification of HRSEM images of the prepared LaFeO3 sample shows
narrow size distribution at a large scale. In addition, it was noticed that the
hydrothermal synthesis method produced highly monodispersed LaFeO3
nanospheres with average size of about 45 nm. Further no other impurity
particles and aggregates are detected.
Figure 4.5 HRSEM images of LaFeO3 nanospheres
74
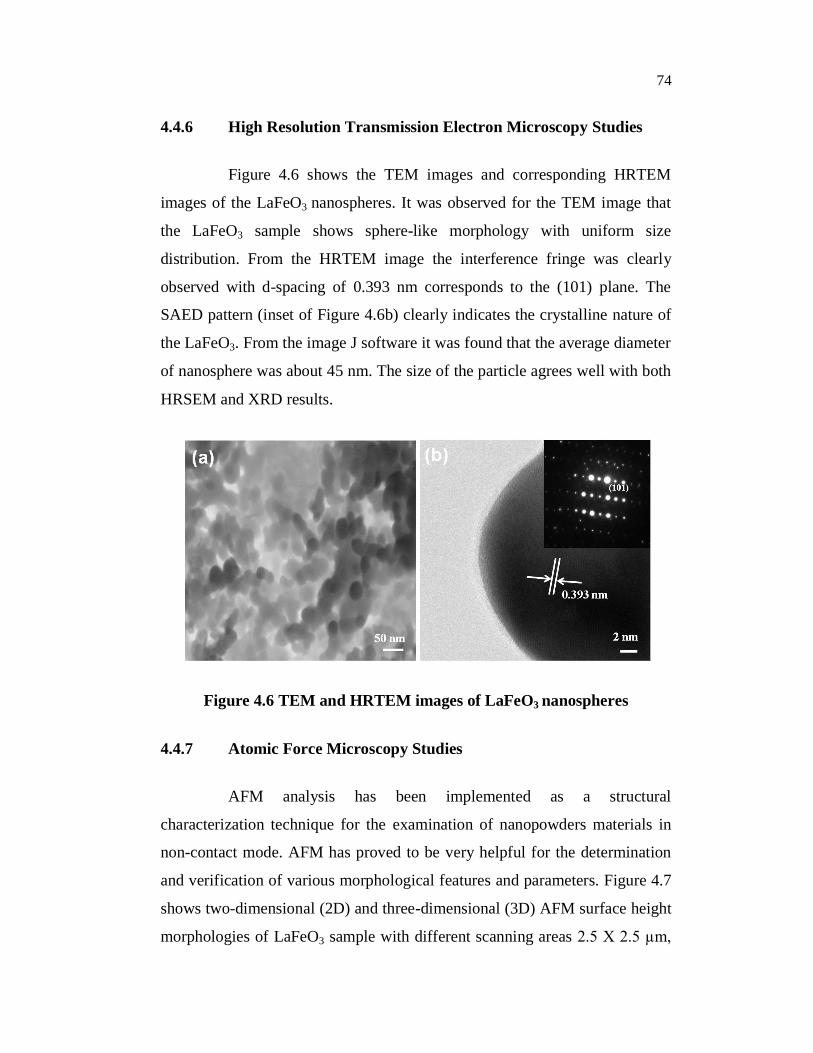
4.4.6 High Resolution Transmission Electron Microscopy Studies
Figure 4.6 shows the TEM images and corresponding HRTEM
images of the LaFeO3 nanospheres. It was observed for the TEM image that
the LaFeO3 sample shows sphere-like morphology with uniform size
distribution. From the HRTEM image the interference fringe was clearly
observed with d-spacing of 0.393 nm corresponds to the (101) plane. The
SAED pattern (inset of Figure 4.6b) clearly indicates the crystalline nature of
the LaFeO3. From the image J software it was found that the average diameter
of nanosphere was about 45 nm. The size of the particle agrees well with both
HRSEM and XRD results.
Figure 4.6 TEM and HRTEM images of LaFeO3 nanospheres
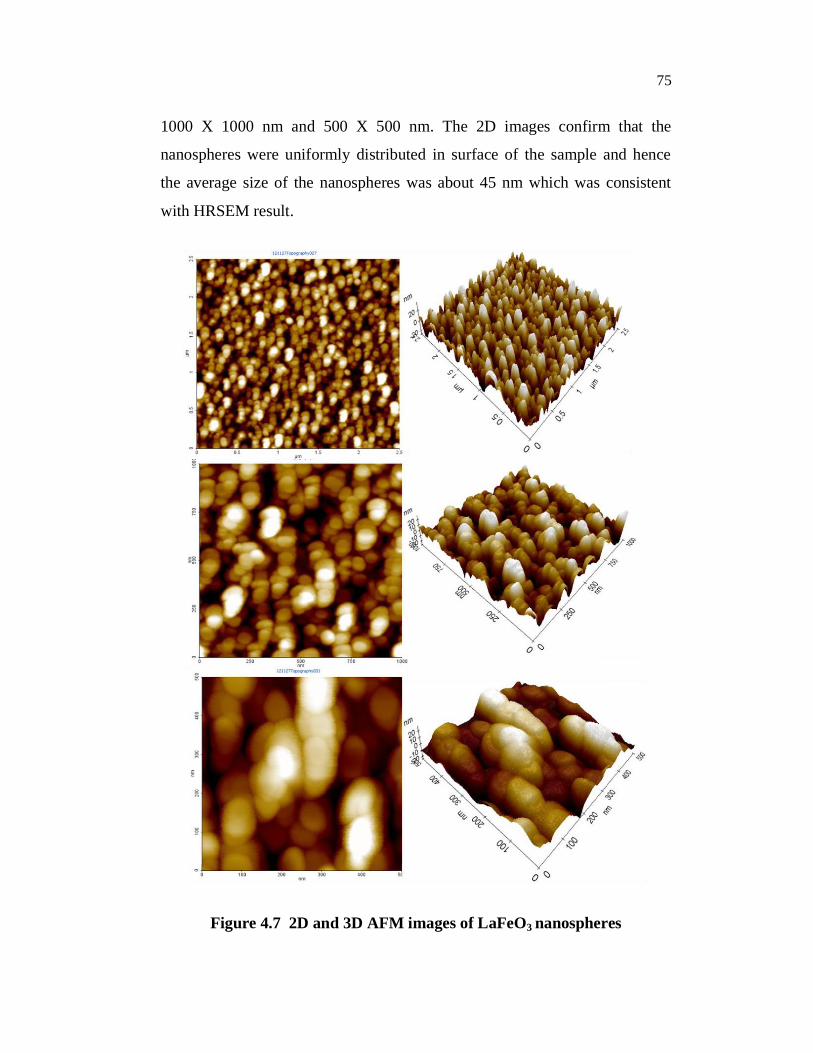
4.4.7 Atomic Force Microscopy Studies
AFM analysis has been implemented as a structural
characterization technique for the examination of nanopowders materials in
non-contact mode. AFM has proved to be very helpful for the determination
and verification of various morphological features and parameters. Figure 4.7
shows two-dimensional (2D) and three-dimensional (3D) AFM surface height
morphologies of LaFeO3 sample with different scanning areas 2.5 X 2.5 µm,
75
1000 X 1000 nm and 500 X 500 nm. The 2D images confirm that the
nanospheres were uniformly distributed in surface of the sample and hence
the average size of the nanospheres was about 45 nm which was consistent
with HRSEM result.
Figure 4.7 2D and 3D AFM images of LaFeO3 nanospheres

76
4.4.8 Formation Mechanism of LaFeO3 Nanospheres
The formation of LaFeO3 nanospheres can be obtained by the
following reaction mechanism,
[La(NO3)3.6H2O] + [Fe(NO3)3.9H2O] + [C6H8O7] + 3O2 LaFeO3 + 6NO2
+ 6CO2 + 19H2O
La(NO3)3. 6H2O and Fe(NO3)3 .9H2O dissolved in deionized water
with 1:1 ratio followed by that 2 ratio of citric acid was added to the solution.
They readily react with each other and finally produce LaFeO3 after heating it
with 800 °C with the elimination of nitrogen, carbon dioxide and water.
4.4.9 Elemental Studies
Figure 4.8 EDS spectrum of LaFeO3 nanospheres
Figure 4.8 shows EDS spectrum of LaFeO3 nanospheres which
confirm the presence of the elements in the samples. From the EDS spectra, it
77
is further confirmed that no elements other than La, Fe and O were present
hence it shows that the prepared samples were highly pure.
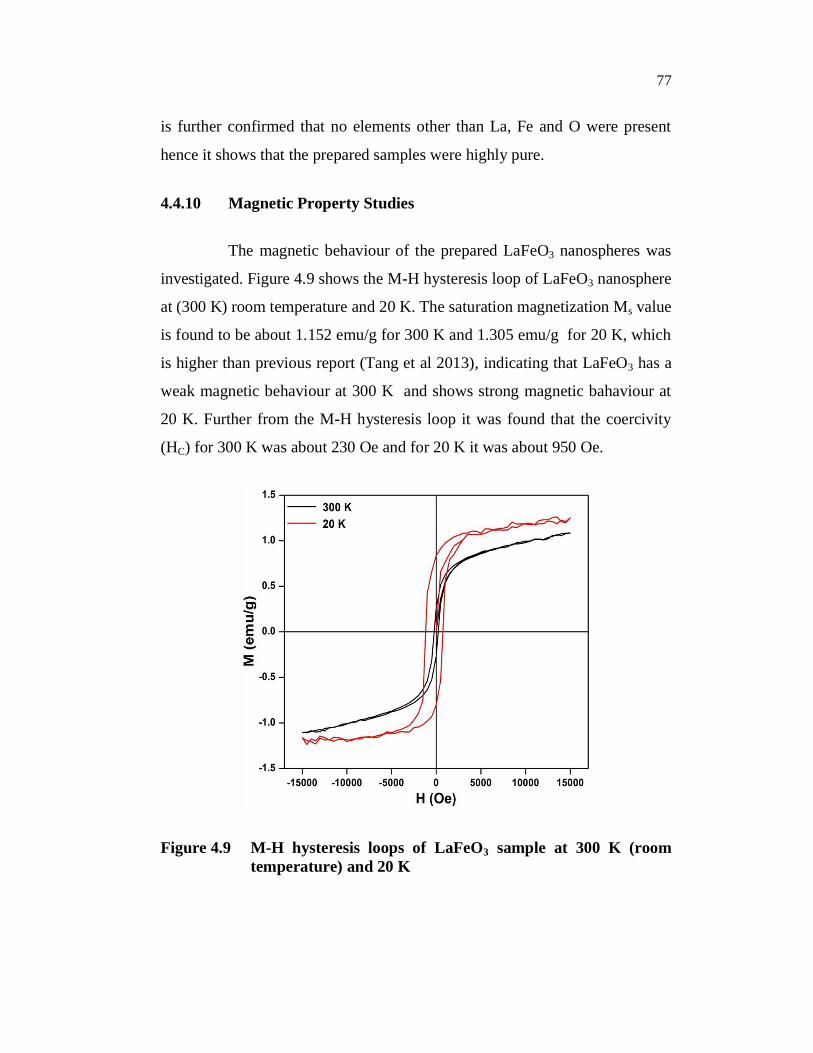
4.4.10 Magnetic Property Studies
The magnetic behaviour of the prepared LaFeO3 nanospheres was
investigated. Figure 4.9 shows the M-H hysteresis loop of LaFeO3 nanosphere
at (300 K) room temperature and 20 K. The saturation magnetization Ms value
is found to be about 1.152 emu/g for 300 K and 1.305 emu/g for 20 K, which
is higher than previous report (Tang et al 2013), indicating that LaFeO3 has a
weak magnetic behaviour at 300 K and shows strong magnetic bahaviour at
20 K. Further from the M-H hysteresis loop it was found that the coercivity
(HC) for 300 K was about 230 Oe and for 20 K it was about 950 Oe.
Figure 4.9 M-H hysteresis loops of LaFeO3 sample at 300 K (room temperature) and 20 K
78
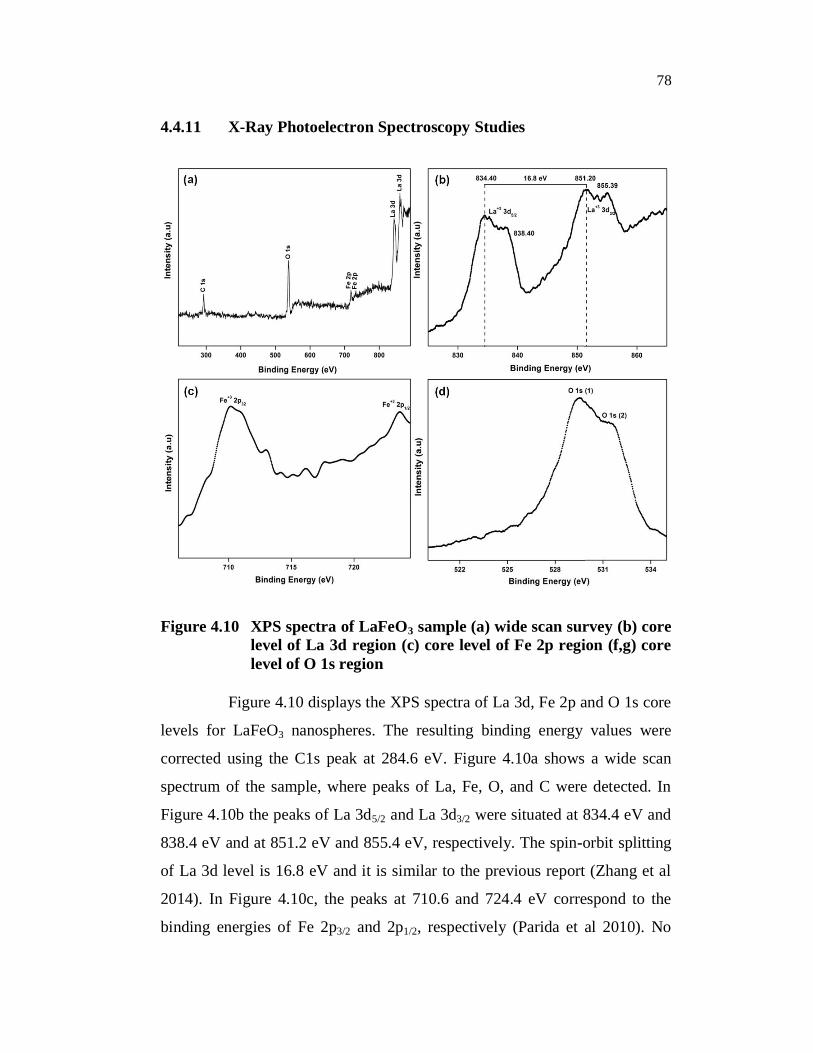
4.4.11 X-Ray Photoelectron Spectroscopy Studies
Figure 4.10 XPS spectra of LaFeO3 sample (a) wide scan survey (b) core level of La 3d region (c) core level of Fe 2p region (f,g) core level of O 1s region
Figure 4.10 displays the XPS spectra of La 3d, Fe 2p and O 1s core
levels for LaFeO3 nanospheres. The resulting binding energy values were
corrected using the C1s peak at 284.6 eV. Figure 4.10a shows a wide scan
spectrum of the sample, where peaks of La, Fe, O, and C were detected. In
Figure 4.10b the peaks of La 3d5/2 and La 3d3/2 were situated at 834.4 eV and
838.4 eV and at 851.2 eV and 855.4 eV, respectively. The spin-orbit splitting
of La 3d level is 16.8 eV and it is similar to the previous report (Zhang et al
2014). In Figure 4.10c, the peaks at 710.6 and 724.4 eV correspond to the
binding energies of Fe 2p3/2 and 2p1/2, respectively (Parida et al 2010). No

79
noticeable shoulder peaks are found in the Fe 2p XPS spectrum, indicating
that Fe mainly exhibits +3 oxidation state. The broad and asymmetric O1s
XPS spectra (Figure 4.10d) correspond to two kinds of oxygen chemical
states according to the binding energy range (527.0 533.0 eV), including
crystal lattice oxygen (OL) and hydroxyl oxygen (OH) with increasing binding
energy.
4.4.12 UV-Vis Absorption Studies
Figure 4.11 UV-Visible absorbance spectrum of LaFeO3 sample
Figure 4.11 shows the UV-Vis absorption spectrum of LaFeO3
nanospheres with absorption at about 466 nm. Generally for perovskite type
oxides the strong absorption edge can mainly be attributed to the electronic
transition from the valence band to conduction band (O 2p Fe 3d) (Farhadi
et al 2009). The UV-Vis spectrum of LaFeO3 allows us to calculate the optical
band gap (Eg) of 2.66 eV based on the absorption. The result indicates that
LaFeO3 nanosphere prepared by hydrothermal method can absorb

80
considerable amounts of visible light, implying their potential applications as
visible light-driven photocatalysts.
4.4.13 Photocatalytic Property Studies
Figure 4.12 UV-Vis time dependent absorption spectra during photocatalytic reaction of MO for LaFeO3 sample. Degradation percentage of MO as the function of irradiation time (insert) optical photograph showing gradual Color change of MO at different time intervals during photodegradation process
The photocatalytic activity of the prepared LaFeO3 nanosphere was
tested for the degradation of MO in aqueous suspensions under visible light
irradiation. Figure 4.12a shows the UV-Vis time dependent absorbance
spectrum during photocatalytic reaction of MO for LaFeO3 nanospheres after
visible light irradiation. For MO a strong absorption was observed at 465 nm.
Initially we have tried without any photocatalyst, the result shows only 3 % of
degradation within 180 min visible light radiation. Then we have tried with
LaFeO3 nanospheres as a catalyst here as the irradiation time increases from 0
to 180 min, the position of the absorption peak slowly shifts to shorter
wavelength and hence the strength of the peak was reduced. After 180 min,
the absorption peak was very low and the intense orange colour of the starting
MO solution faded (insert Figure 4.12b). The degradation rate for LaFeO3
81
nanosphere under visible light irradiation is about 83% hence the result
suggests that the LaFeO3 nanospheres are effective catalysts for MO
degradation.
4.5 CONCLUSION
LaFeO3 nanospheres have been successfully prepared by
hydrothermal method followed by calcination. The citric acid concentration
plays a major role in the formation of LaFeO3 nanospheres. XRD result shows
that the prepared LaFeO3 sample possessed orthorhombic perovskite
structure, with high crystallinity. From the results of Raman spectroscopy,
bands of crystalline LaFeO3 are observed. HRSEM and AFM image shows
that the prepared LaFeO3 sample exhibits uniform distribution of spherical-
like morphology with average size of about 45 nm. The UV-Vis study shows
strong absorption at 466 nm which has excellent visible light absorption
ability. VSM measurement indicates the products shows weak magnetic
behaviour at 300 K and strong magnetic behavior at 20 K. XPS analysis
confirms the oxidation state of all the elements. Further we proved LaFeO3
nanospheres exhibit good photocatalytic activity for the degradation of MO
under visible-light illumination within 180 min.


![Processing and characterization of CaTiO perovskite ceramics 24 01.pdfProcessing and Applicationof Ceramics 8 [2] (2014) 53–57 DOI: 10.2298/PAC1402053G Processing and characterization](https://img.dokumen.tips/doc/110x75/60c85e76ebde3702a406280e/processing-and-characterization-of-catio-perovskite-24-01pdf-processing-and-applicationof.jpg)