Embed Size (px)
Citation preview

CHAPTER 4 MAINSTEM & TRIBUTARY FIELD PROCEDURES
FEB. 9, 2017 (REV.1)
METHODS AND QUALITY ASSURANCE FOR CBP WATER QUALITY MONITORING PROGRAMS 4-1
CHAPTER 4. MAINSTEM & TRIBUTARY FIELD PROCEDURES
Section A. Background and Description 1. Management Objectives
2. Monitoring Objectives
3. Sampling Design
4. Water Quality Parameters
5. Map of Mainstem and Tributary Station Locations
Section B. Field Measurement Procedures 1. Sampling Sites
2. Weather Conditions
3. Physiochemical Profile
4. Pycnocline Determination
5. Secchi Depth
6. Light Attenuation
7. Documentation and Records
8. Decontamination
Section C. Sampling Procedures 1. Sampling Schedules
2. Sampling Equipment
3. Reagents
4. Sample Collection
5. Sample Processing and Preservation
6. Quality Control Samples
7. Documentation and Records
8. Decontamination

CHAPTER 4 MAINSTEM & TRIBUTARY FIELD PROCEDURES
FEB. 9, 2017 (REV.1)
METHODS AND QUALITY ASSURANCE FOR CBP WATER QUALITY MONITORING PROGRAMS 4-2
Section D. References
Appendix 4-A: CBP Mainstem and Tributary Station Locations
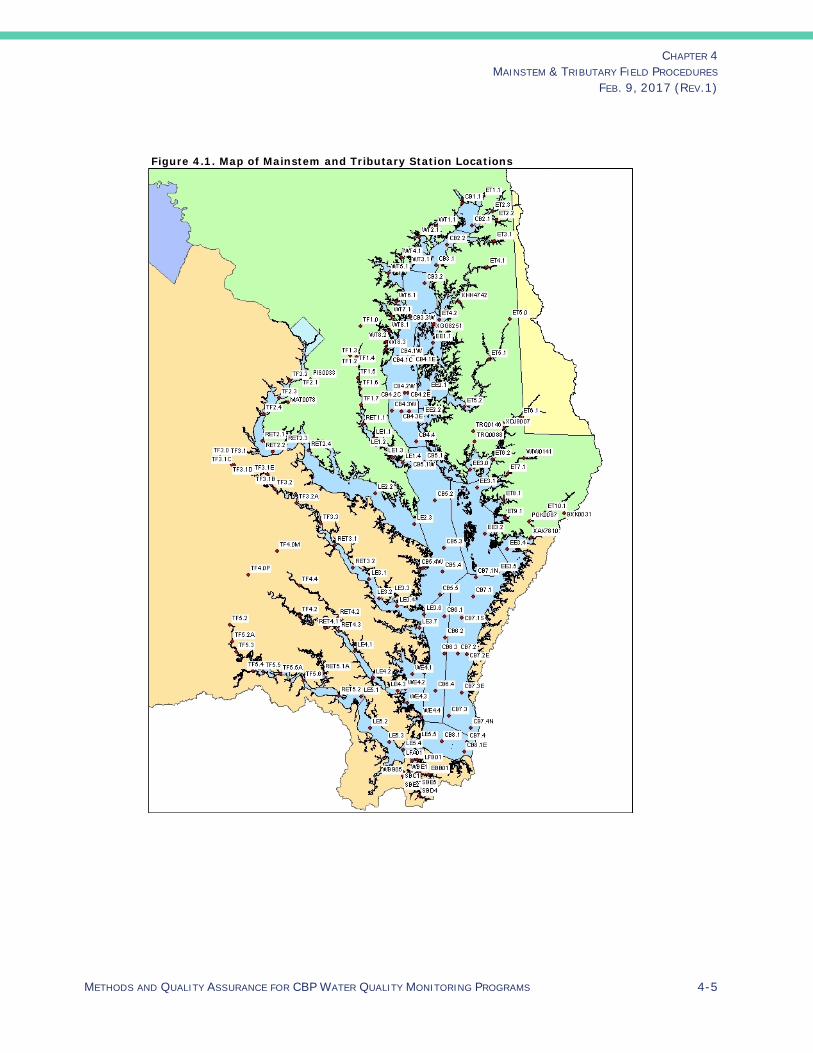
FIGURES FIGURE 4.1 MAP OF MAINSTEM AND TRIBUTARY STATION LOCATIONS
FIGURE 4.2 FIELD MEASUREMENTS AND SAMPLE PROCESSING
TABLES TABLE 4.1 MAINSTEM AND TRIBUTARY WQ PARAMETERS

CHAPTER 4 MAINSTEM & TRIBUTARY FIELD PROCEDURES
FEB. 9, 2017 (REV.1)
METHODS AND QUALITY ASSURANCE FOR CBP WATER QUALITY MONITORING PROGRAMS 4-3
Section A. Background and Description
Management Objectives
The 1985 Chesapeake Bay Restoration and Protection Plan identified the need for restoration activities and a monitoring program to measure the success of these activities. In June 2000, the Chesapeake Bay Program adopted a new Bay agreement, Chesapeake 2000: A Watershed Partnership to guide the management and restoration of the Bay. In this “C2K”document, Bay Program Partners agreed upon multiple objectives, one of which was “to achieve and maintain the water quality necessary to support the aquatic living resources of the Bay and its tributaries”. Water quality monitoring data are necessary to assess these objectives.
2. Monitoring Objectives:
2.1. The monitoring objectives for the Tidal Water Quality Monitoring Program are to:
2.2. Assess the habitat conditions for aquatic living resources and determine if these conditions meet tidal water quality criteria and standards designed to protect them from nutrient and sediment impacts;
2.3. Deduce the likely causes of nutrient and sediment impairments, and determine the best course of action necessary to meet the water quality criteria and standards;
2.4. Support continued refinement, calibration and validation of Chesapeake Bay Program models such as the Estuarine Water Quality and Sediment Transport Model; and
2.5. Provide a long-term consistent set of data that is available for public and private research.
3. Sampling Design
3.1. The Chesapeake Bay Mainstem and Tributary Monitoring Program focuses on inorganic and physical parameters in the open and deep tidal waters of the Chesapeake Bay estuary. Staffs from the Maryland Department of Natural Resources (MDNR), Virginia Department of Environment (VDEQ), and Old Dominion University (ODU) collect surface to bottom discrete measurements at over 100 mid-channel stations. The timing and methods of sample collection are closely coordinated between Maryland and Virginia to permit consistent data presentations across the region. Phytoplankton samples are collected concurrently with water quality samples.
3.2. Twenty-four field and laboratory parameters are monitored and include nutrients, suspended solids, dissolved oxygen, salinity, temperature and chlorophyll a. Field parameters are measured in-vivo, and discrete grab samples are processed (i.e., filtered) immediately onboard. A complete listing of mainstem and tributary water quality parameters is provided in Table 4.1.
3.3. The number of grab samples taken and the depth at which they are taken varies among stations. At many stations, four samples are collected: surface and bottom, and just above and below the pycnocline if one is present. In the absence of a pycnocline, samples are taken at the surface and bottom, and at 1/3 and 2/3 of the total depth. Shallower stations may have only two samples (surface and bottom) collected. Procedures for determining the

CHAPTER 4 MAINSTEM & TRIBUTARY FIELD PROCEDURES
FEB. 9, 2017 (REV.1)
METHODS AND QUALITY ASSURANCE FOR CBP WATER QUALITY MONITORING PROGRAMS 4-4
pycnocline and sampling depths are described in Chapter 4, Sections B.4, B.3.4 and C.4.
3.4. A map showing the locations of the Maryland and Virginia Water Quality Monitoring Stations is available on the Chesapeake Bay Program Website at: http://www.chesapeakebay.net/documents/3676/map_of_mainstem_and_tributary_monitoring_stations.pdf
3.5. See Appendix A for the lat/long coordinates and a description of each station. This information is also available through the Chesapeake Bay Environmental Data Repository (CDEDR) under Water Quality Data at: http://data.chesapeakebay.net/WaterQuality.
6. Water Quality Parameters
TABLE 4.1 Mainstem and Tributary WQ Parameters
Laboratory Parameters In-situ Measurements
Total Dissolved Phosphorus (TDP) Dissolved Orthophosphate (PO4F) Particulate Phosphorus (PP) Nitrite (NO2F) Nitrate + Nitrite (NO23F) Ammonium (NH4F) Total Dissolved Nitrogen (TDN) Particulate Nitrogen (PN) Particulate Carbon (PC) Total Suspended Solids (TSS) Volatile Suspended Solids* (VSS) Chlorophyll a (CHLA) Pheophytin (PHEO) Dissolved Organic Carbon* (DOC) Silica* (SiF) * Collected from a subset of stations
Dissolved Oxygen (mg/L) Temperature (°C) pH (su) Specific Conductance (µmhos/cm) Salinity (psu) Secchi Depth (m) Total Depth (m) Sample Depth (m) Photosynthetic Active Radiation (PAR) (µM = µmoles/second-meter2)
CHAPTER 4 MAINSTEM & TRIBUTARY FIELD PROCEDURES
FEB. 9, 2017 (REV.1)
METHODS AND QUALITY ASSURANCE FOR CBP WATER QUALITY MONITORING PROGRAMS 4-5
Figure 4.1. Map of Mainstem and Tributary Station Locations
CHAPTER 4 MAINSTEM & TRIBUTARY FIELD PROCEDURES
FEB. 9, 2017 (REV.1)
METHODS AND QUALITY ASSURANCE FOR CBP WATER QUALITY MONITORING PROGRAMS 4-6
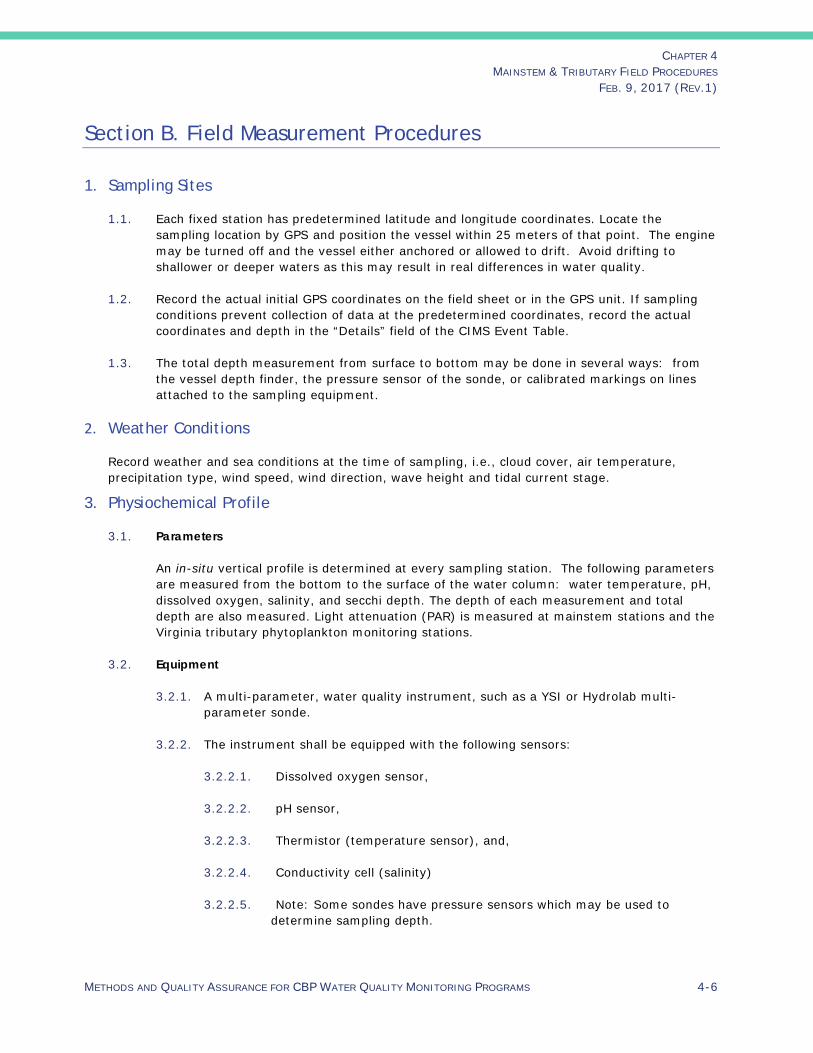
Section B. Field Measurement Procedures
1. Sampling Sites
1.1. Each fixed station has predetermined latitude and longitude coordinates. Locate the sampling location by GPS and position the vessel within 25 meters of that point. The engine may be turned off and the vessel either anchored or allowed to drift. Avoid drifting to shallower or deeper waters as this may result in real differences in water quality.
1.2. Record the actual initial GPS coordinates on the field sheet or in the GPS unit. If sampling conditions prevent collection of data at the predetermined coordinates, record the actual coordinates and depth in the “Details” field of the CIMS Event Table.
1.3. The total depth measurement from surface to bottom may be done in several ways: from the vessel depth finder, the pressure sensor of the sonde, or calibrated markings on lines attached to the sampling equipment.
2. Weather Conditions
Record weather and sea conditions at the time of sampling, i.e., cloud cover, air temperature, precipitation type, wind speed, wind direction, wave height and tidal current stage.
3. Physiochemical Profile
3.1. Parameters
An in-situ vertical profile is determined at every sampling station. The following parameters are measured from the bottom to the surface of the water column: water temperature, pH, dissolved oxygen, salinity, and secchi depth. The depth of each measurement and total depth are also measured. Light attenuation (PAR) is measured at mainstem stations and the Virginia tributary phytoplankton monitoring stations.
3.2. Equipment
3.2.1. A multi-parameter, water quality instrument, such as a YSI or Hydrolab multi-parameter sonde.
3.2.2. The instrument shall be equipped with the following sensors: 3.2.2.1. Dissolved oxygen sensor,
3.2.2.2. pH sensor,
3.2.2.3. Thermistor (temperature sensor), and,
3.2.2.4. Conductivity cell (salinity)
3.2.2.5. Note: Some sondes have pressure sensors which may be used to
determine sampling depth.

CHAPTER 4 MAINSTEM & TRIBUTARY FIELD PROCEDURES
FEB. 9, 2017 (REV.1)
METHODS AND QUALITY ASSURANCE FOR CBP WATER QUALITY MONITORING PROGRAMS 4-7
3.2.3. The sonde must be outfitted with a data logger or computer to display the measurement values. If possible, record and store measurements electronically.
3.3. Calibration: (See also Chapter 2, Section D) 3.3.1. Pre-cruise calibrations must be performed for dissolved oxygen (DO), pH, and
conductivity to standardize the response of each probe. Post-cruise calibration checks are performed to ensure that calibration was maintained over the course of sampling. For multiple day cruises, a daily, one-point DO calibration check is highly recommended.
3.3.2. Staff shall maintain logbooks for each instrument and/or sensor. The logbooks shall document all calibration, maintenance and servicing information.
3.3.3. Calibrations are performed indoors after the probes have stabilized to room temperature. Follow all manufacturer specifications for calibration and maintenance; fully document selected options in the calibration SOP.
3.3.4. If a post-calibration check does not meet acceptable tolerances, censor the corresponding data back to the last calibration check using the CIMS WQ problem code “V” (Sample results rejected due to QC criteria.) If the post-calibration failure is due to an accident that occurred after sampling, qualify the data with the CIMS WQ problem code “F” (i.e., Post-calibration failure possible due to equipment damage after sampling, but data appear normal.)
3.3.5. Conductivity: The conductivity sensor must be calibrated against a reference solution, according to manufacturer’s specifications. As a minimum, conductivity should be verified before and after each cruise.
3.3.6. pH: As a minimum, the pH sensor must be calibrated at the beginning and end of every cruise. Use two standard solutions of pH 4.0, pH 7.0 or pH 10.0 buffers, bracketing the expected values of pH. If the post-calibration drift is ± 0.2 pH units or more, censor the data with the CIMS WQ problem code “V” or report values with code “F”.
3.3.7. Dissolved oxygen (DO): The DO probe must be calibrated at the beginning and end of each multiple-day cruise according to manufacturer’s specifications. Typically, Clark cell probes are calibrated against water-saturated air. Check the calibration at the beginning of each day. If daily DO checks deviate by ≥ 0.30 mg DO/L from the expected value, the sensor must be recalibrated before using again. If a calibration check (daily or post-calibration) is ≥ 0.50 mg DO/L, censor all data corresponding back to the last calibration check using the CIMS WQ Problem Code “V”.
3.3.8. Thermistor: Verify the accuracy of the thermistor reading at least once a year against a NIST certified thermometer over a range of temperatures. If the temperature is off by ≥ ± 1°C, have a service representative recalibrate the unit.
3.3.9. Depth sensor: Verify the accuracy of the sonde pressure transducer at the beginning of each sampling day at a known depth below the surface. The depth should be
CHAPTER 4 MAINSTEM & TRIBUTARY FIELD PROCEDURES
FEB. 9, 2017 (REV.1)
METHODS AND QUALITY ASSURANCE FOR CBP WATER QUALITY MONITORING PROGRAMS 4-8
accurate to 0.2 meters, or the tolerance given by the manufacturer.
3.3.10. LiCor Meter: An annual calibration is recommended; every 2 years is required.
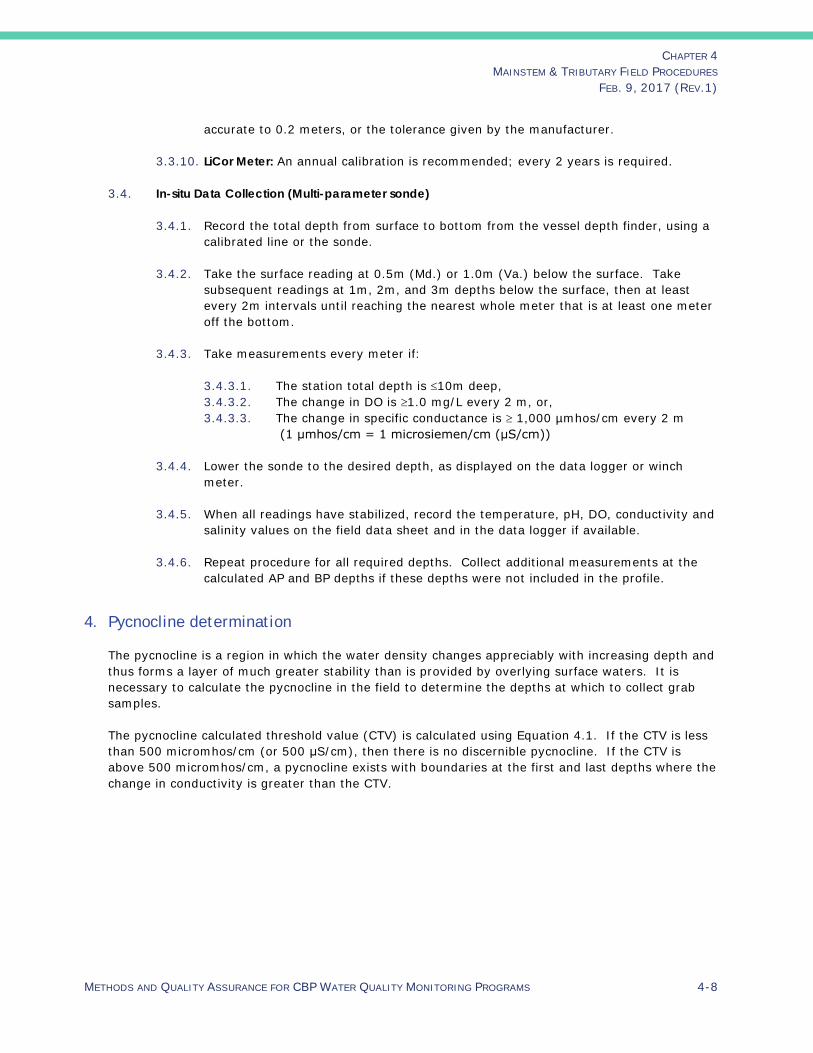
3.4. In-situ Data Collection (Multi-parameter sonde) 3.4.1. Record the total depth from surface to bottom from the vessel depth finder, using a
calibrated line or the sonde.
3.4.2. Take the surface reading at 0.5m (Md.) or 1.0m (Va.) below the surface. Take subsequent readings at 1m, 2m, and 3m depths below the surface, then at least every 2m intervals until reaching the nearest whole meter that is at least one meter off the bottom.
3.4.3. Take measurements every meter if: 3.4.3.1. The station total depth is ≤10m deep, 3.4.3.2. The change in DO is ≥1.0 mg/L every 2 m, or, 3.4.3.3. The change in specific conductance is ≥ 1,000 µmhos/cm every 2 m
(1 µmhos/cm = 1 microsiemen/cm (μS/cm))
3.4.4. Lower the sonde to the desired depth, as displayed on the data logger or winch meter.
3.4.5. When all readings have stabilized, record the temperature, pH, DO, conductivity and salinity values on the field data sheet and in the data logger if available.
3.4.6. Repeat procedure for all required depths. Collect additional measurements at the calculated AP and BP depths if these depths were not included in the profile.
4. Pycnocline determination
The pycnocline is a region in which the water density changes appreciably with increasing depth and thus forms a layer of much greater stability than is provided by overlying surface waters. It is necessary to calculate the pycnocline in the field to determine the depths at which to collect grab samples. The pycnocline calculated threshold value (CTV) is calculated using Equation 4.1. If the CTV is less than 500 micromhos/cm (or 500 μS/cm), then there is no discernible pycnocline. If the CTV is above 500 micromhos/cm, a pycnocline exists with boundaries at the first and last depths where the change in conductivity is greater than the CTV.

CHAPTER 4 MAINSTEM & TRIBUTARY FIELD PROCEDURES
FEB. 9, 2017 (REV.1)
METHODS AND QUALITY ASSURANCE FOR CBP WATER QUALITY MONITORING PROGRAMS 4-9
Eqn. 4.1
𝐶𝐶𝐶𝐶𝐶𝐶 = 𝐶𝐶𝑏𝑏 − 𝐶𝐶𝑠𝑠𝐷𝐷𝑏𝑏 − 𝐷𝐷𝑠𝑠
× 2
Where:
Cb = bottom conductivity (micromhos/cm),
Cs = surface conductivity (micromhos/cm),
Db = depth of bottom conductivity measurement (m),
Ds = depth of surface conductivity measurement (m),
CTV = calculated threshold value (micromhos/cm)
5. Secchi depth
5.1. Secchi depth is a measure of the transparency of a water column.
5.2. Equipment: A 20 cm Secchi disk, held by a non-stretchable line that is marked in tenths of meters.
5.3. Frequency: The Secchi depth is determined at each station.
5.4. Procedure:
5.4.1. The Secchi depth must be determined from the shady side of the boat during daylight hours.
5.4.2. Slowly lower the Secchi disk until it is no longer visible and note the depth using the markings on the line.
5.4.3. Slowly raise the Secchi disk until it just becomes visible and note the depth using the markings on the line.
5.4.4. Record the average of the two Secchi readings to the nearest 0.1 meter.
5.4.5. Do not wear sunglasses or any devices that shades the eyes while performing this procedure.
5.5. Quality Control - Secchi 5.5.1. If the range of measurements for the two readings is greater than 0.5 m, repeat the
entire measurement process, raising and lowering the disk several times around the “disappearing” point.
5.5.2. If the disk hits the bottom and remains visible, record the depth reading and note this in the comment section.
5.5.3. Calibrate the markings on the Secchi line periodically against a metal meter stick.

CHAPTER 4 MAINSTEM & TRIBUTARY FIELD PROCEDURES
FEB. 9, 2017 (REV.1)
METHODS AND QUALITY ASSURANCE FOR CBP WATER QUALITY MONITORING PROGRAMS 4-10
6. Light Attenuation (PAR)
6.1. Equipment: Manufactured by LI-COR, Inc. 6.1.1. LI-192SA, flat cosine Underwater Quantum Sensor
6.1.2. LI-190SA, air (deck) reference sensor.
6.1.3. Data Logger (e.g., LI-1000, LI-1400 or LI-1500).
6.2. Parameters:
6.2.1. EPARU_Z: Downwelling PAR, measured underwater (µM, micromoles/second-meter2
= µE, microEinsteins).
6.2.2. EPAR_S: PAR measured in air, on deck or pier, recorded concurrently with each underwater depth reading (µM).
6.2.3. SDEPTH: Sample depth at which PAR reading is recorded (meters).
6.3. Depths for Mid-Channel PAR
6.3.1. Record the initial PAR just below the surface. If wave action is too great, take the initial PAR at 0.5 m.
6.3.2. As a general rule, record subsequent measurements at 1 meter increments for mainstem stations and at 0.5 m intervals for tributary stations deeper than 2 m. These may be increased to 2 m if the water is clear and deep.
6.3.3. Increments of 0.25 m are recommended for stations ≤ 2 m, or if water is turbid or colored.
6.3.4. Measurements are recorded until the meter reads ≤10 % of the initial subsurface value or if the bottom is reached.
6.4. PAR Procedure 6.4.1. PAR must be measured from the sunny side of a vessel or pier during daylight
hours. Both the deck sensor and the submersed sensor must be placed away from the shadow of the vessel.
6.4.2. Check the sensor operation by connecting the deck sensor and underwater sensor to corresponding ports of the Li-Cor data logger, and turn the power on. Check battery level. Cover the sensor and check to see if the output is near zero. Place the sensor under a light source to assure that it has a positive reading. A negative reading indicates that the polarity of the sensor is reversed (it is plugged into the cable backwards). A very positive or negative reading under darkness indicates a possible short in the cable or some other electrical short.

CHAPTER 4 MAINSTEM & TRIBUTARY FIELD PROCEDURES
FEB. 9, 2017 (REV.1)
METHODS AND QUALITY ASSURANCE FOR CBP WATER QUALITY MONITORING PROGRAMS 4-11
6.4.3. In the field, mount the deck sensor in a location which is level and unobstructed by shadows. Ensure that the sensors are positioned properly on the deck sensor mounting and the lowering frame. Connect deck sensor and underwater sensor to corresponding ports of the meter, and turn the power on.
6.4.4. Set the instrument averaging constant to display results from previous 10 or 15 seconds.
6.4.5. Lower the frame until the sensor is just below the surface of the water; simultaneously record the deck sensor and the underwater readings. If wave action prevents this, take a deeper reading ≤ 0.5 m. Determine the measurement depth using a calibrated pole, non-stretching rope or depth sensor.
6.4.6. Lower the frame and take subsequent measurements at depths appropriate to the monitoring location and purpose of the project. Allow the instrument output to stabilize, and then record both deck and underwater readings at each depth.
6.4.7. The simultaneous deck and submersed readings are stored by pressing “Enter”. Each record will be stored with a time stamp which will flash on the data logger readout. Record this time so that all readings can be subsequently retrieved at the end of the cruise. Alternatively, enter the station ID and the sampling interval into the data logger remarks function before starting the PAR readings.
6.5. Quality Control
6.5.1. The deck cell should have the highest PAR value, and the underwater sensor output should decrease as the sensor is lowered to greater depths. The deck sensor reading should be consistent throughout the profile. If the sunlight fluctuates during the profile it may be necessary to repeat the measurement.
6.5.2. Periodically check that the two sensors are linear and not out of calibration with respect to each other.
6.5.3. Calibration of the sensors by LICOR, Inc. is recommended every year, and required every two years.
6.6. Reporting PAR
The CIMS database stores PAR values from the deck sensor and each underwater measurement. Report the values under the following method codes: 6.6.1. EPARU_Z F01: Flat cosine sensor LI-192SA
6.6.2. EPAR_S F01: Deck (reference) sensor LI-190SA
6.6.3. SDEPTH: Sample depth at which PAR reading is recorded, in meters
7. Documentation and Records
Field Data Sheets, Calibration and Maintenance Logs must permit a complete historical reconstruction of the data. See Chapter 2, Section B.8 for detailed document control protocols.

CHAPTER 4 MAINSTEM & TRIBUTARY FIELD PROCEDURES
FEB. 9, 2017 (REV.1)
METHODS AND QUALITY ASSURANCE FOR CBP WATER QUALITY MONITORING PROGRAMS 4-12
8. Decontamination
8.1. Multi-Parameter Sonde: Rinse the sonde, probes and cable with tap water or DI water at the end of each sampling day. Cover with the storage cup containing ~ 1 inch of water to provide an air-saturated environment. For routine maintenance, follow the manufacturer’s procedures.
8.2. LiCor Sensors: Rinse the underwater sensor and cable with tap or DI water at the end of each
sampling day. 8.3. Secchi Disk: Clean the Secchi disk with a mild detergent solution at least once per month.
Section C. Sampling Procedures
1. Sampling Schedules
1.1. The Maryland Department of Natural Resources (MDNR) and Virginia Department of Environmental Quality (VDEQ) collaborate to develop an annual sampling or “cruise” schedule to ensure that samples are collected by both groups within reasonably the same time. The cruise schedule is submitted to the EPA Project Officer and published on the Chesapeake Bay Program website at: http://www.chesapeakebay.net/documents/3676/water_quality_monitoring_cruise_schedules_8407.pdf .
1.2. Weather and sea conditions permitting, all field measurements and sample collections for each mainstem cruise shall be completed during three days; and all field monitoring and sample collections for each tributary cruise shall be completed as closely as possible to the mainstem cruise dates.
1.3. Due to the large distance that must be covered in a single day of sampling, it is not practical to sample stations at a selected tidal stage. Instead, cruises shall begin on the designated date in the early morning and shall be completed by evening (usually 6 or 7 pm). Sampling should occur during daylight hours. In addition, all light dependent measurements, i.e., Secchi depth, light attenuation and fluorescence, must be measured during daylight hours.
2. Sampling Equipment
2.1. Collection bottles: Two to four pre-cleaned 4-liter polyethylene bottles per sampling station.
2.2. Submersible pump or Hydrocast sampling system (General Oceanics Model 1016 Rosette, or equivalent).
2.3. Laboratory sample bottles - Pre-cleaned or new HDPE bottles, stored protected from contamination. Avoid using sample bottles previously used for high concentration samples.
2.4. Sample filter containers – Plastic bags, aluminum foil or plastic dishes, appropriate for the parameter.

CHAPTER 4 MAINSTEM & TRIBUTARY FIELD PROCEDURES
FEB. 9, 2017 (REV.1)
METHODS AND QUALITY ASSURANCE FOR CBP WATER QUALITY MONITORING PROGRAMS 4-13
2.5. Filtration apparatus with vacuum pump. Syringe filters may be permitted for certain projects, but never for PC/PN. 2.5.1. Chlorophyll – Vacuum pressure < 10 in. Hg (< 5 psi).
2.5.2. PC/PN – Vacuum pressure < 10in. Hg (< 5 psi).
2.5.3. TSS & Nutrients – Unspecified
2.6. Filter Preparation – Whatman® GF/F, 0.7 μm pore size. Diameters other than those listed
below may be used. See specific comments throughout the analytical methodology for concerns related to alternate sizes. 2.6.1. TSS & VSS: Whatman® GF/F, 47 mm.
Rinse filters three times with DI and transfer them to weighing pans. For TSS only, place in a drying oven at 103-105°C for 1 hour. For combined TSS/VSS, combust at 550 °C for 15 minutes in a muffle furnace. Cool in a desiccator and weigh. For at least 10% of the samples1, repeat the cycle of drying or combustion until a constant weight is reached as defined in the method cited (e.g., ± 5% is required by Standard Methods)
2.6.2. TSS only: Same as 2.6.1, without combustion at 550°C. 2.6.3. PN/PC: Whatman® GF/F, 13 or 25 mm diameter – Filters must be pre-combusted at
500°C. 2.6.4. Chlorophyll: Whatman® GF/F, 47mm diameter – Pretreatment is unnecessary. 2.6.5. Dissolved parameters: Filters must be pre-rinsed to remove trace elements.
Alternatively, use TSS filtrate. 2.6.6. Particulate P: Use either TSS or other pre-rinsed filters.
2.7. Refrigerator or a cooler with ice (≤ 6°C), and/or a freezer (≤ -20°C).
3. Reagents
3.1. Magnesium carbonate suspension for fresh water chlorophyll – Add 1 g of finely powdered MgCO3 to 100 mL water.
3.2. Reagent water - ASTM Type II water, or equivalent.
1 The CBP procedure deviates from Standard Methods, 20th edition, which requires re-drying and re-weighing 100% of the filters.
CHAPTER 4 MAINSTEM & TRIBUTARY FIELD PROCEDURES
FEB. 9, 2017 (REV.1)
METHODS AND QUALITY ASSURANCE FOR CBP WATER QUALITY MONITORING PROGRAMS 4-14
3.3. Hydrochloric acid (HCl) solution for cleaning equipment – Prepare a 5% or 10% HCl (v/v) solution. Be sure to add concentrated HCl to the water.
3.4. Reagent-grade HCl for preserving liquid samples.
4. Sample Collection
4.1. Collect samples after completing field measurements. 4.2. At stations where pycnocline sampling is designated and a pycnocline is detected, samples
are collected 0.5 m (Md.) or 1.0 m (Va.) below the surface; 1.0 m above the upper boundary of the pycnocline; 1.0 m below the lower boundary of the pycnocline; and 0.5 – 1 m above the bottom. The MDNR bottom sample is taken from the nearest whole meter that is at least one meter off the bottom. See Chapter 4, Section B.4 for pycnocline definitions and alculations.
4.3. If there is no discernable pycnocline at designated stations, collections will be made at 0.5 m
(Md.) and 1.0 m (Va.) below the surface; at the closest profile depth above one third of the distance between the surface depth, 1.0 m and the bottom sample depth; at closest profile depth below two thirds the distance between 1.0 m and the bottom sample depth; and 1.0 m above the bottom to the nearest 0.5 m.
4.4. At all other stations, samples are collected at the surface (0.5 m (Md.) and 1.0 m (Va.)) and
≥ 1m above the bottom. 4.5. Lower the submersible pump or Rosette to each sampling depth and fill one bottle per
depth. Process the sample according to Section 5 below.
5. Sample Processing and Preservation
5.1. Sample processing and division for all samples should follow Figure 4.1. Filtration should be done immediately after sample collection to prevent chemical degradation and biological growth (Zimmerman and Keefe, 1997). If weather conditions are poor, it may be necessary to process samples on shore as soon as possible, within 2 hours of collecting the sample.
5.2. Wear disposable, powderless gloves while processing the samples. 5.3. Chlorophyll and pheophytin processing 2:
5.3.1. Filtration for chlorophyll should be done in subdued light as soon as possible after
collecting the sample. Gently shake the sample and pour quickly into a graduated cylinder, measure and record the volume. Transfer the aliquot to the filter tower and
2 Deviations from EPA Method 446.0 are: a) Filtration pressure of 10 in. Hg is used instead of 6 in. Hg, b) Chlorophyll filters from tributary stations may be stored on ice for up to 24 hours, and c) Holding time prior to analysis is 28 days instead of 24 days.

CHAPTER 4 MAINSTEM & TRIBUTARY FIELD PROCEDURES
FEB. 9, 2017 (REV.1)
METHODS AND QUALITY ASSURANCE FOR CBP WATER QUALITY MONITORING PROGRAMS 4-15
apply the vacuum to concentrate the algae on the filter.
5.3.2. Filter sufficient sample (100-1,500 mL) to produce a green color on the filter pad. To avoid cell damage and loss of contents during filtration, do not exceed a vacuum of 10 in. Hg (≤ 5 psi), or a filtration duration greater than 10 minutes. Do not suck the filter dry with the vacuum; instead slowly release the vacuum as the final volume approaches the level of the filter and completely release the vacuum as the last bit of water is pulled through the filter.
5.3.3. If sampling non-saline water, i.e., < 0.5 psu salinity, add 1mL of saturated MgCO3 solution during the last few seconds of filtering. MgCO3 is optional for higher salinity samples.
5.3.4. Remove the filter from the fritted base with forceps, fold once with the particulate matter inside and place it in a foil pouch or Petri dish. Wrap Petri dish in aluminum foil to protect the phytoplankton from light. Store the filters at ≤ -20°C. Short term storage up to 4 hours on ice is acceptable2 for processed filters but they should be stored as soon as possible at ≤-20°C.
5.3.5. Chlorophyll samples that cannot be concentrated immediately after collection may be chilled at ≤ 6°C in the dark for up to 2 hours before the plankton are concentrated, however any delay is strongly discouraged due to the possible growth of phytoplankton cells or degradation of pigments.
5.3.6. The filter may be stored in the dark at ≤ -20°C for up to 28 days before extracting
the pigments. Studies have shown that extracts are stable for up to 3 months if they are extracted soon after collection (Wasmund, et al. 2006), however, analysis within 28 days is required.
5.4. Particulate Carbon and Particulate Nitrogen: A 25-500 mL sample is filtered under a vacuum (≤10 in. Hg or ≤ 5 psi) through a 13 mm GF/F filter. Do not rinse the residue on the filter with DI. Place the filters in Petri dishes or in foil pouches and keep on ice or in a freezer (at ≤ -20°C) for short-term storage and transport.
5.5. Ammonia, Nitrite, Nitrite+ nitrate, Orthophosphate, Total Dissolved Nitrogen, Total Dissolved
Phosphorus, Dissolved Organic Carbon, and Silicates: Pour the filtrate from the particulate phosphorus and/or total suspended solids filtration into sample containers, keep on ice or in freezer (≤ -20°C) for short-term storage and transport, except samples for silicate analyses must be cooled and stored at ≤ 6°C. Ammonium and DOC samples should be frozen immediately, or acidified to pH ≤2, cooled and stored at ≤ 6°C. (Note: Use only HCl to acidify DOC samples to protect laboratory instruments.)
5.6. Total Suspended and Volatile Solids:
5.6.1. A 500 mL sample is filtered under vacuum through prepared 47 mm GF/F filters. It
may be necessary to reduce the volume to keep the filtration time under 10 minutes.
5.6.2. Shake the sample vigorously and quickly fill a graduated cylinder to the desired
volume to prevent solids from settling. Quantitatively transfer the subsample to the filtration apparatus and remove all traces of water by continuing to apply vacuum after the sample has passed through. Record the volume of sample filtered.

CHAPTER 4 MAINSTEM & TRIBUTARY FIELD PROCEDURES
FEB. 9, 2017 (REV.1)
METHODS AND QUALITY ASSURANCE FOR CBP WATER QUALITY MONITORING PROGRAMS 4-16
5.6.3. With the suction on, wash the filter, residue and inside wall of filter tower with three
10 mL portions of deionized water, allowing complete drainage between washing. Remove all traces of water from the filter by continuing to apply vacuum pressure after water has passed through.
5.6.4. If the filtrate is used for dissolved parameters, dispense the filtrate into sample containers prior to rinsing the filters.
5.6.5. Remove the filter with residue with a forceps, transfer to a labeled sample container
and place on ice or in freezer for short-term storage and transport.
5.7. Particulate Phosphorus: 5.7.1. Filter a 50-1000 mL sample under vacuum through a pre-rinsed 47 mm GF/F filter.
Rinse the residue on the filter three times with ~10 mL DI water to remove dissolved solids.
5.7.2. Remove the filter with a forceps, transfer to a labeled sample container and place on
ice or in a freezer for short-term storage and transport.

CHAPTER 4 MAINSTEM & TRIBUTARY FIELD PROCEDURES
FEB. 9, 2017 (REV.1)
METHODS AND QUALITY ASSURANCE FOR CBP WATER QUALITY MONITORING PROGRAMS 4-17
Figure 4.2 Field Measurements and Sample Processing

CHAPTER 4 MAINSTEM & TRIBUTARY FIELD PROCEDURES
FEB. 9, 2017 (REV.1)
METHODS AND QUALITY ASSURANCE FOR CBP WATER QUALITY MONITORING PROGRAMS 4-18
6. Quality Control Samples
6.1. Field-Filtered Blank – A field filtered blank is an equivalent aliquot of reagent water that is processed and preserved exactly as are samples. If the concentration of an analyte exceeds the lowest standard in the calibration curve, field and/or laboratory contamination should be suspected and corrective action initiated. (See Chapter 2 for corrective actions.) 6.1.1. Mainstem cruises: One field-filtered blank is recommended each day of the cruise;
however, the required minimum is one for each 3-day cruise.
6.1.2. Tributary cruises: One field-filtered blank is required per month, or alternatively, one filtered equipment blank per month.
6.2. Replicate Sample (S1, S2 & S3) – A replicate sample is a second (or third) discrete sample taken in quick succession, at the same location and depth as the first samples. Data from replicate samples may be used to estimate overall precision or to deduce sampling precision.
6.3. Field Split (FS1, FS2 & FS3) – One sample is collected and two (or 3) homogeneous subsamples are processed identically for all parameters. 6.3.1. Mainstem Monitoring: Collect a field split or a replicate sample once for every 20
samples.
6.3.2. Tidal Tributary Monitoring: Each sampling group should collect field splits once per month, from the surface and bottom depths of the station.
6.4. Sampling Equipment Blanks (Mainstem and Tributary) 6.4.1. Equipment blanks indicate the effectiveness of the sampling equipment cleaning
procedure. The equipment blank is processed in the office laboratory after the equipment has been cleaned.
6.4.2. An equipment blank is required once per year or whenever new equipment is used for the first time.
6.4.3. The equipment blanks consist of ASTM Type II water that has been passed sequentially through each component of the sample processing and collection equipment, e.g., submersible pump and hose, Rosette bottles, sampling containers, churn splitter, filtration unit, etc.
6.4.4. An analysis of the unfiltered reagent-grade water used to prepare the blanks maybe helpful in interpreting the results if contamination is found.
6.4.5. If the concentration of the equipment blank exceeds the lowest analytical standard in the calibration curve, prepare blanks of just the sampling equipment to isolate the cause of the contamination.

CHAPTER 4 MAINSTEM & TRIBUTARY FIELD PROCEDURES
FEB. 9, 2017 (REV.1)
METHODS AND QUALITY ASSURANCE FOR CBP WATER QUALITY MONITORING PROGRAMS 4-19
7. Documentation and Records Field Processing Sheets and Laboratory Forms must have sufficient detail to allow for a complete historical reconstruction of the conditions and processes used to generate data points. A unique sample number or ID must be assigned to each sample collected and/or processed. See Chapter 2, Section B for additional document control protocols.
8. Decontamination
Filtration Units: At the end of each sampling day, clean the filtration units, flasks and graduated cylinders with a non-phosphate detergent, rinse with tap water then a final DI water rinse. For low level nutrient sampling, i.e., mainstem stations, rinse with 5-10% HCl between the tap and DI water rinses. If unable to use HCl during a multi-day cruise, soak or fill filtration equipment overnight in DI water.

CHAPTER 4 MAINSTEM & TRIBUTARY FIELD PROCEDURES
FEB. 9, 2017 (REV.1)
METHODS AND QUALITY ASSURANCE FOR CBP WATER QUALITY MONITORING PROGRAMS 4-20
Section D. References
EPA Methods for the Determination of Chemical Substances in Marine and Estuarine Environmental Matrices – 2nd Edition, Sept. 1997. (EPA/600/R-97/072) aMethod 440.0 Determination of Carbon and Nitrogen in Sediments and Particulates of Estuarine/Coastal Waters Using Elemental Analysis. bMethod 446.0 In Vitro Determination of Chlorophylls a, b, c1+c2 and Pheopigments in Marine and Freshwater Algae by Visible Spectrophotometry.
Wasmund, N., Topp, I., Schories, D. (2006). Optimising the Storage and Extraction of Chlorophyll Samples, OCEANOLOGIA, 48 (1), 2006. pp. 125-144.
Zimmerman, C. and Keefe, C. (1997). Immediate Filtration Processing of Water Samples to Separate Particulate and Dissolved Nutrient Parameters: What is the Critical Time Interval between Sample Collection and Filtration? Report from the University of Maryland System C.E.E.S. Chesapeake Biological Laboratory, submitted to the Maryland Department of Natural Resources.
Salley, B. (1995). A Comparison of Preservation Techniques for Dissolved Nutrient Analyses, Special Report in Applied Marine Sciences and Ocean Engineering, Number 333. Virginia Institute of Marine Sciences.

UNITED STATES ENVIRONMENTAL PROTECTION AGENCY REGION 111
Mr. Robert Siegfried VA Water Control Board 2111 N. Hamilton Street P.O. Box 11143 Richmond, Virginia 23230
Dear Mr. Siegfried:
Chesapeake Bay Liaison Office 410 SEVERN AVENUE
ANNAPOLIS, MARYLAND 21403
NOV 2 0 1986
At the October 22, 1986 meeting, the Monitoring Subcommlttee approved a set of recommendations on acceptance �f the use of freezing as an alternative method of sample preservation. The recommendations described here are based on the comparison study completed by the Virginia Institute of Marine Science. The recomm:!ndations for remaining parameters which were included under this study supported by the Chesapeake Biological Laboratory (particulate analyses) and the (carbon analyses) Old Dominion University will be presented to the Monitoring Subcommittee for approval at the November 25 meeting�
The use of freezing as an alternative method of sample preservation for the following parameters are now approved as an acceptable protocol for use in the Chesapeake Bay Monitoring Program.
Orthophosphate Total Dissolved Phosphorus Total Phosphorus Ammonia
Nitrite Nitrate-Nitrite Total Kjel dahl Nitrogen
Appendix 4-A
For water column samples to be analyzed for the above stated parameters, the accepted protocol. will be freezing at a temperature at -20 degree celsius for a maximum period of 28 days.
The results of the comparison study demonst:rated that there were no significant measurable differences between the preservation treatments (freezing and EPA accepted preservation methods) for suspended solids. However, given the EPA accepted 7-day holding time, the Monitoring Subcommittee did not feel it would be necessary to freeze samples to be analyzed for suspended solids was not approved by the Monitoring Subcommittee.
The comparison study results and the literature have established that freezing as a preservation technique causes measureable difference in analyzed silica levels. The use of freezing as a preservation technique for the stabilization of water column samples to be analyzed for silica was not approved by the .Monitoring Subcommittee.
4-21METHODS AND QUALITY ASSURANCE FOR CBP WATER QUALITY MONITORING PROGRAMS

METHODS AND QUALITY ASSURANCE FOR CBP WATER QUALITY MONITORING PROGRAMS 4-22

METHODS AND QUALITY ASSURANCE FOR CBP WATER QUALITY MONITORING PROGRAMS 4-23

METHODS AND QUALITY ASSURANCE FOR CBP WATER QUALITY MONITORING PROGRAMS 4-24