Embed Size (px)
Citation preview
45
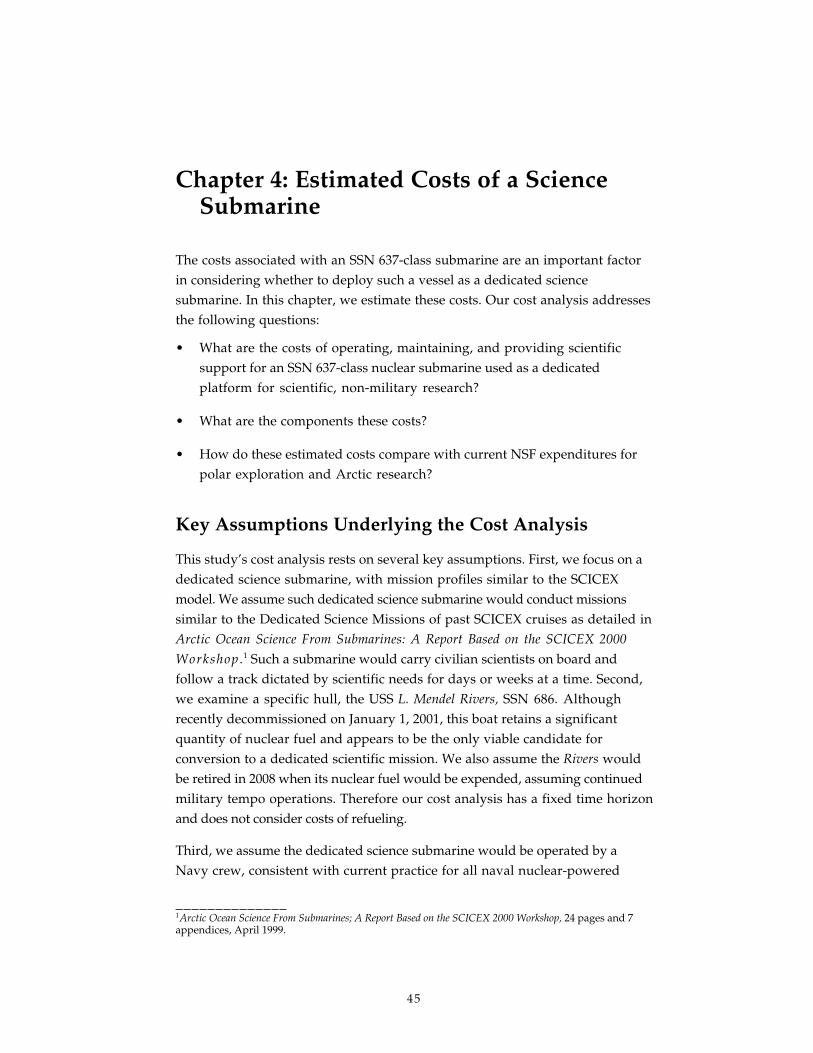
Chapter 4: Estimated Costs of a ScienceSubmarine
The costs associated with an SSN 637-class submarine are an important factorin considering whether to deploy such a vessel as a dedicated sciencesubmarine. In this chapter, we estimate these costs. Our cost analysis addressesthe following questions:
• What are the costs of operating, maintaining, and providing scientificsupport for an SSN 637-class nuclear submarine used as a dedicatedplatform for scientific, non-military research?
• What are the components these costs?
• How do these estimated costs compare with current NSF expenditures forpolar exploration and Arctic research?
Key Assumptions Underlying the Cost Analysis
This study’s cost analysis rests on several key assumptions. First, we focus on adedicated science submarine, with mission profiles similar to the SCICEXmodel. We assume such dedicated science submarine would conduct missionssimilar to the Dedicated Science Missions of past SCICEX cruises as detailed inArctic Ocean Science From Submarines: A Report Based on the SCICEX 2000
Workshop .1 Such a submarine would carry civilian scientists on board andfollow a track dictated by scientific needs for days or weeks at a time. Second,we examine a specific hull, the USS L. Mendel Rivers, SSN 686. Althoughrecently decommissioned on January 1, 2001, this boat retains a significantquantity of nuclear fuel and appears to be the only viable candidate forconversion to a dedicated scientific mission. We also assume the Rivers wouldbe retired in 2008 when its nuclear fuel would be expended, assuming continuedmilitary tempo operations. Therefore our cost analysis has a fixed time horizonand does not consider costs of refueling.
Third, we assume the dedicated science submarine would be operated by aNavy crew, consistent with current practice for all naval nuclear-powered
______________1Arctic Ocean Science From Submarines; A Report Based on the SCICEX 2000 Workshop, 24 pages and 7appendices, April 1999.
46
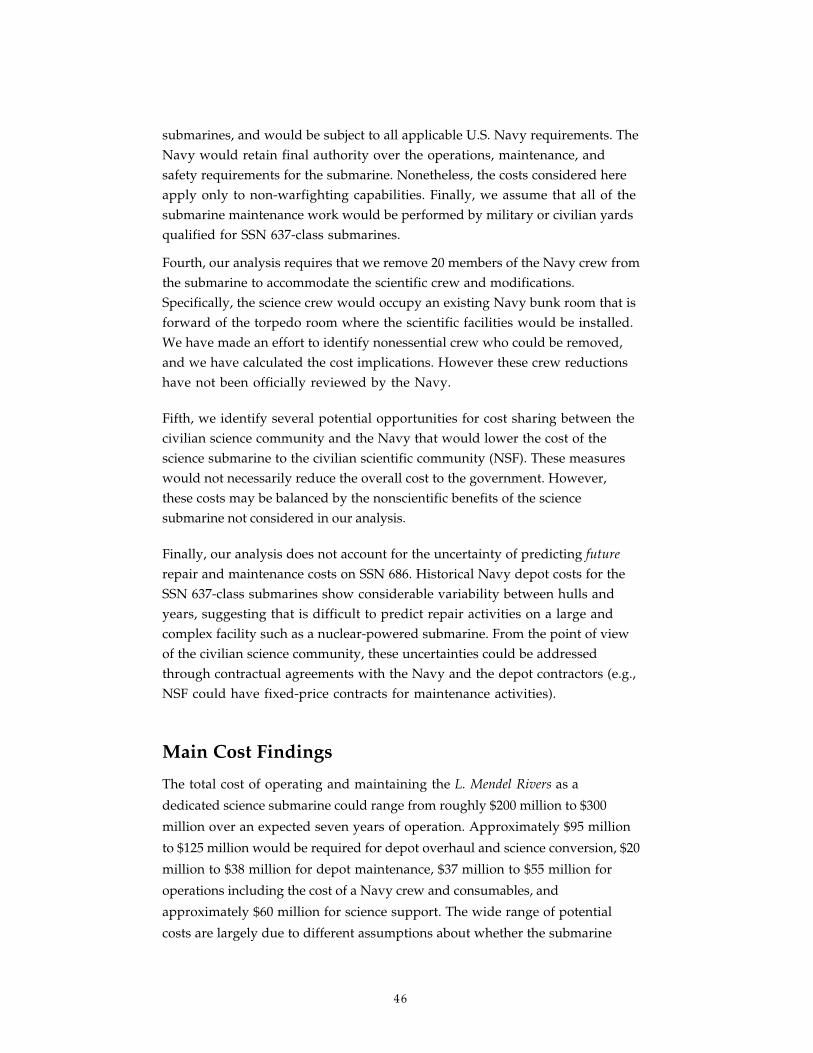
submarines, and would be subject to all applicable U.S. Navy requirements. TheNavy would retain final authority over the operations, maintenance, andsafety requirements for the submarine. Nonetheless, the costs considered hereapply only to non-warfighting capabilities. Finally, we assume that all of thesubmarine maintenance work would be performed by military or civilian yardsqualified for SSN 637-class submarines.
Fourth, our analysis requires that we remove 20 members of the Navy crew fromthe submarine to accommodate the scientific crew and modifications.Specifically, the science crew would occupy an existing Navy bunk room that isforward of the torpedo room where the scientific facilities would be installed.We have made an effort to identify nonessential crew who could be removed,and we have calculated the cost implications. However these crew reductionshave not been officially reviewed by the Navy.
Fifth, we identify several potential opportunities for cost sharing between thecivilian science community and the Navy that would lower the cost of thescience submarine to the civilian scientific community (NSF). These measureswould not necessarily reduce the overall cost to the government. However,these costs may be balanced by the nonscientific benefits of the sciencesubmarine not considered in our analysis.
Finally, our analysis does not account for the uncertainty of predicting future
repair and maintenance costs on SSN 686. Historical Navy depot costs for theSSN 637-class submarines show considerable variability between hulls andyears, suggesting that is difficult to predict repair activities on a large andcomplex facility such as a nuclear-powered submarine. From the point of viewof the civilian science community, these uncertainties could be addressedthrough contractual agreements with the Navy and the depot contractors (e.g.,NSF could have fixed-price contracts for maintenance activities).
Main Cost Findings
The total cost of operating and maintaining the L. Mendel Rivers as a
dedicated science submarine could range from roughly $200 million to $300
million over an expected seven years of operation. Approximately $95 million
to $125 million would be required for depot overhaul and science conversion, $20
million to $38 million for depot maintenance, $37 million to $55 million for
operations including the cost of a Navy crew and consumables, and
approximately $60 million for science support. The wide range of potential
costs are largely due to different assumptions about whether the submarine
47
could be overhauled and maintained at public or private shipyards, the
allocation of overhead, and whether the costs of Navy crew members would be
shared between NSF and the Navy. These issues would likely be resolved and
the cost made more certain if and when the government begins serious planning
for a dedicated science submarine. The average annual cost of the submarine
would range from $30 million to $40 million per year. By comparison, current
NSF funding for Arctic research, logistics, and facilities support totaled
approximately $70 million in FY 2000.
The cost of the submarine is unevenly distributed over time. The initial
overhaul and science conversion of the existing vessel constitutes more than a
third of the total lifetime costs of the science submarine. Thus, the majority of
spending would occur in the first years of the program, and hence there is little
flexibility to reduce costs by focusing the science submarine on a few high-
priority missions.
The costs of dedicated science submarine are not much smaller than those of a
dedicated military submarine (only about a 15 percent to 30 percent reduction),
because the costs are largely driven by Navy requirements for safely operating
and maintaining the vessel.
Our cost estimates are summarized in Table 4.1, which compares our “high,”
“medium,” and “low” estimates, along with the Navy’s cost estimate for a
science submarine, from which our cost estimates are based.2 The bottom row of
the table shows the assumptions that are required to achieve the civilian cost
savings over the Navy estimate. In this table the assumptions are additive:
The medium scenario includes the assumptions for the high estimate, the low
estimate includes the assumptions for the high and medium cases. RAND’s
high cost estimates for the dedicated science submarine differ from the Navy
estimates because we have omitted costs associated with military equipment
and operations. Our medium cost estimate differs from the high cost because we
have assumed an alternative allocation of overhead costs for some maintenance
activities. Our low cost estimate assumes that much of the maintenance and
overhaul work could be done at private shipyards, which would further reduce
costs. Excluding costs for science conversion and maintenance, the high cost
estimate for the entire seven-year period is $213 million, $31 million less than
______________ 2The Navy estimates were presented to the RAND team on August 6, 1999, during a meeting withpersonnel from the following naval offices: NAVSEA08, NAVSEA92B, PMS392, and N871.

48
the Navy estimate for continued military operations. The low cost estimate is
$147 million, nearly $100 million below the Navy estimate. The specific
components of these costs and the assumptions underlying them are explained in
the subsections that follow.
As described in detail below, and in Appendices A and B, these cost estimates
are based on data obtained from a variety of sources, including the Navy,
Electric Boat Company (a shipbuilding contractor), NSF, and the Coast Guard.
Table 4.1. USS L. Mendel Rivers Cost Estimates for Overhaul and Seven Years ofOperations (FY2000$M)
Cost CategoryUSN
Operations
ScienceOperations
(High)
ScienceOperations(Medium)
ScienceOperations
(Low)
Onetime Overhaul andConversion 141 125 125 95
Depot Overhaul 136 120 120 90Science ConversionRecurring Maintenance
545
538
525
520
Scheduled MajorMaintenance (DSRA) 12 10 10 8
Intermediate Maintenance 20 17 7 5Unscheduled Maintenance 13 11 8 7Operations 63 55 55 37Navy Crew 55 47 47 29Consumables 8 8 8 8Scientific Support 60 60 60 60Science Crew 4 4 4 4Research Support 56 56 56 56TOTAL COSTS 309 278 265 212
Key Assumptions
Navy estimatesof overhaul,
maintenance, andoperations of a
militarysubmarine.
Depot costs can bereduced by 15% by
eliminatingmilitary systems.
Navy crewreduced by 20.
Program paysreduced
overhead costsfor maintenance.
Depot work inprivate yards.
Navy-NSFcost sharing on
crew costs.
49
The Navy provided us with aggregate estimates of depot repair, normal
maintenance (including scheduled and unscheduled work), and personnel costs.
These estimates approximated what the Navy would have requested in budget
items for operating the L. Mendel Rivers. A detailed basis for these estimates
was not provided. To place these estimates in perspective, we also examined
the Navy’s extensive historical record of operation and maintenance costs for
all SSN 637-class hulls. Data for this overview came from the VAMOSC
(Visibility and Management of Operating and Support Costs) database and
SUBMEPP (Submarine Maintenance, Engineering, Planning, and Procurement).
We also used independent cost estimates of the science conversion costs provided
by Electric Boat Company, a government contractor with substantial experience
constructing and maintaining nuclear-powered submarines. Finally, the
scientific support cost estimates are derived from data on the costs for
icebreaker operations, as reported by the U.S. Coast Guard and in the National
Research Council Report, Arctic Ocean Research and Supporting Facilities and
data on the levels of NSF support for the SCICEX program.
What Are the Components of the Estimated Costs?
There are two broad categories of cost associated with using SSN 686, the L.
Mendel Rivers, as a dedicated research submarine—the costs of anymodifications or conversions, and the costs to operate and maintain the ship.The cost analysis shows that a large fraction of these costs are driven by Navyrequirements for submarine operations, including: nuclear submarinemaintenance requirements and schedules for SSN 637-class submarines;requirements for the operation and maintenance of a science submarine, asindicated by the SCICEX experience; and ship-manning requirements.
The Navy manuals and memoranda describing nuclear submarine maintenancerequirements and schedules for SSN 637-class submarines specify a schedule ofmaintenance activities that must be performed for all hulls. These requirementsare heavily influenced by the principle of “reliability-based maintenance”implemented as part of the SUBSAFE program to insure the safety of nuclearsubmarines and their crews. One of the operational principles is that theoverall safety of the hull depends on the performance of all its engineeringsystems, and that the failure of specific components could have catastrophicimplications.

50
Lessons from SCICEX suggest that Navy requirements for the operation andmaintenance of a science submarine include: a technical crew of at least fiveindividuals responsible for maintaining the science facilities on the submarine;individual investigators who want to collect and analyze data; and new sensorsor systems that would be required by the scientific mission.
Ship-manning requirements for SSN 637-class submarines are well defined byNavy regulations. The 1998 assigned crew included 13 officers and 120 enlistedmen. In actual practice, this number may vary slightly. To obtain a roughestimate of the cost difference between a military mission and a scientificmission, we obtained the personnel costs associated with the L. Mendel Rivers
in 1998, its last year of operation, and deleted 20 selected ratings from the crew.
In the following section we first discuss the overhaul, operations, andmaintenance costs associated with the operating the submarine according tothese Navy requirements. We then discuss the costs of converting the submarinefor scientific missions and conducting those missions. Throughout this chapterall costs are expressed in FY 2000 dollars unless otherwise noted.
Operation and Support Costs
During the early phases of this project, the Navy prepared an estimate of thecost to continue operating the L. Mendel Rivers to the end of its hull life. Theestimate was presented to the RAND study team and a representative of NSFat a meeting in Crystal City, Virginia, on August 6, 1999. This estimate is thestarting point for determining the operations and support costs for a dedicatedresearch submarine.
The Navy estimate represents what would be placed in the Navy’s budget tocontinue operating the L. Mendel Rivers to the end of its service life. Theestimate is presented by fiscal year from FY 2000 through FY 2008 and is inthen-year dollars.
The Navy estimate addresses six elements of cost that are relevant to thecontinued operation of Rivers: a depot overhaul (in Navy terms, an “EngineeredOverhaul” or EOH), a scheduled major maintenance (“Docking SelectedRestricted Availability” or DSRA), annual crew costs (“Military Personnel” orMPN), annual cost for consumable materials and parts (“Operating Tempo” orOPTAR), annual cost for intermediate maintenance (IMA), and annual cost forunscheduled repairs and other maintenance that may or may not require a
51
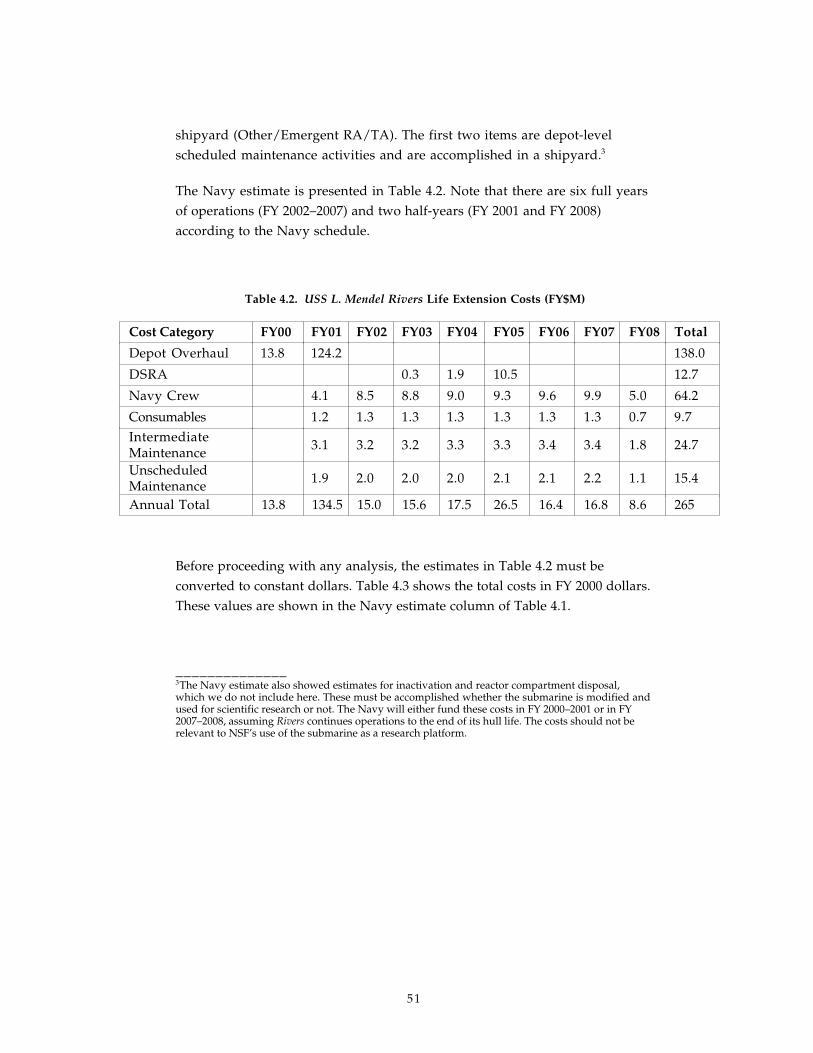
shipyard (Other/Emergent RA/TA). The first two items are depot-levelscheduled maintenance activities and are accomplished in a shipyard.3
The Navy estimate is presented in Table 4.2. Note that there are six full yearsof operations (FY 2002–2007) and two half-years (FY 2001 and FY 2008)according to the Navy schedule.
Table 4.2. USS L. Mendel Rivers Life Extension Costs (FY$M)
Cost Category FY00 FY01 FY02 FY03 FY04 FY05 FY06 FY07 FY08 Total
Depot Overhaul 13.8 124.2 138.0
DSRA 0.3 1.9 10.5 12.7
Navy Crew 4.1 8.5 8.8 9.0 9.3 9.6 9.9 5.0 64.2
Consumables 1.2 1.3 1.3 1.3 1.3 1.3 1.3 0.7 9.7IntermediateMaintenance 3.1 3.2 3.2 3.3 3.3 3.4 3.4 1.8 24.7
UnscheduledMaintenance 1.9 2.0 2.0 2.0 2.1 2.1 2.2 1.1 15.4
Annual Total 13.8 134.5 15.0 15.6 17.5 26.5 16.4 16.8 8.6 265
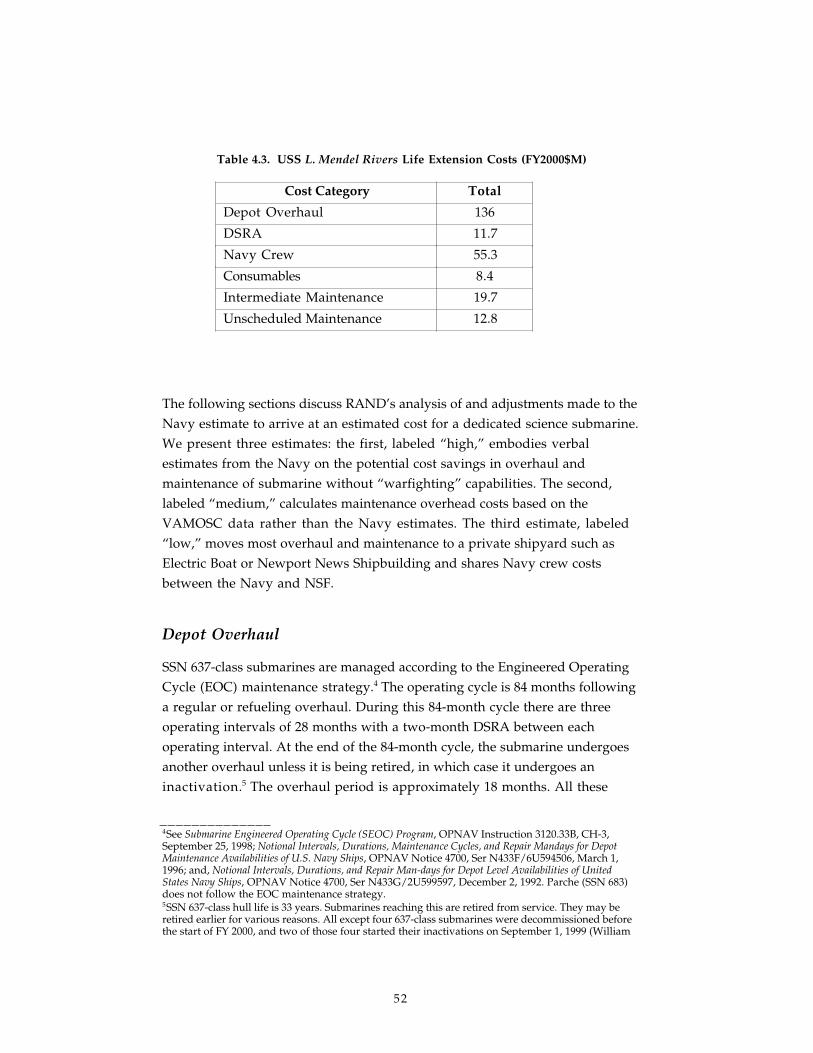
Before proceeding with any analysis, the estimates in Table 4.2 must beconverted to constant dollars. Table 4.3 shows the total costs in FY 2000 dollars.These values are shown in the Navy estimate column of Table 4.1.
______________3The Navy estimate also showed estimates for inactivation and reactor compartment disposal,which we do not include here. These must be accomplished whether the submarine is modified andused for scientific research or not. The Navy will either fund these costs in FY 2000–2001 or in FY2007–2008, assuming Rivers continues operations to the end of its hull life. The costs should not berelevant to NSF’s use of the submarine as a research platform.
52
Table 4.3. USS L. Mendel Rivers Life Extension Costs (FY2000$M)
Cost Category Total
Depot Overhaul 136
DSRA 11.7
Navy Crew 55.3
Consumables 8.4
Intermediate Maintenance 19.7
Unscheduled Maintenance 12.8
The following sections discuss RAND’s analysis of and adjustments made to theNavy estimate to arrive at an estimated cost for a dedicated science submarine.We present three estimates: the first, labeled “high,” embodies verbalestimates from the Navy on the potential cost savings in overhaul andmaintenance of submarine without “warfighting” capabilities. The second,labeled “medium,” calculates maintenance overhead costs based on theVAMOSC data rather than the Navy estimates. The third estimate, labeled“low,” moves most overhaul and maintenance to a private shipyard such asElectric Boat or Newport News Shipbuilding and shares Navy crew costsbetween the Navy and NSF.
Depot Overhaul
SSN 637-class submarines are managed according to the Engineered OperatingCycle (EOC) maintenance strategy.4 The operating cycle is 84 months followinga regular or refueling overhaul. During this 84-month cycle there are threeoperating intervals of 28 months with a two-month DSRA between eachoperating interval. At the end of the 84-month cycle, the submarine undergoesanother overhaul unless it is being retired, in which case it undergoes aninactivation.5 The overhaul period is approximately 18 months. All these
______________4See Submarine Engineered Operating Cycle (SEOC) Program, OPNAV Instruction 3120.33B, CH-3,September 25, 1998; Notional Intervals, Durations, Maintenance Cycles, and Repair Mandays for DepotMaintenance Availabilities of U.S. Navy Ships, OPNAV Notice 4700, Ser N433F/6U594506, March 1,1996; and, Notional Intervals, Durations, and Repair Man-days for Depot Level Availabilities of UnitedStates Navy Ships, OPNAV Notice 4700, Ser N433G/2U599597, December 2, 1992. Parche (SSN 683)does not follow the EOC maintenance strategy.5SSN 637-class hull life is 33 years. Submarines reaching this are retired from service. They may beretired earlier for various reasons. All except four 637-class submarines were decommissioned beforethe start of FY 2000, and two of those four started their inactivations on September 1, 1999 (William
53
intervals are nominal and can be adjusted depending on fleet needs, submarinematerial condition and reactor core life.
L. Mendel Rivers will reach the end of her hull life in February 2008 and hercore life is projected to May 2008. The end of her current operating cycle wasJanuary 2, 2001. If she is to return to service as a scientific research vessel, shemust have an overhaul.
The Navy estimate for the cost of the overhaul is $138 million in then-yeardollars. Ten percent of this would be appropriated in FY 2000 and the other 90percent in FY 2001. The submarine would be in the shipyard from December 2001to May 2002. The $136 million (FY2000$) estimate is based on 200,000 man-daysof work in the shipyard at an average cost of $600 per man-day, plus 15 percentto cover materials. The Navy compared the man-day value to a historicalaverage of approximately 350,000 man-days.6 Hence, the estimate is asignificant reduction compared to 637-class historical overhaul costs. The Navybelieves that 200,000 man-days is the minimum needed to prepare and recertifythe ship for an additional normal Navy operating cycle. A large part of thereduction derives from changes in the maintenance plan and philosophy,drawing on experience from the 688-class. The Navy estimates that thewarfighting capabilities of the submarine account for approximately 15 percentof the availability cost, which suggests that if the L. Mendel Rivers isprepared strictly for scientific operations it would require 170,000 man-daysand cost in the neighborhood of $120 million (FY2000$) for the overhaul.7 Thisexcludes the cost of any modifications for scientific equipment, science crewaccommodations, etc. We use this figure for our high and medium cost estimates.
It has been suggested that the overhaul could be accomplished at one of thequalified private shipyards8 and that the modifications for scientific use couldbe made at the same time. Studies of labor rates at the private yards versus thepublic (Navy) shipyards indicate that the private yards’ rates are one-quarterto one-third less than the public yards’ rates. Assuming a 25 percent reductionwould bring (the non-conversion portion of) the overhaul down toapproximately $90 million (FY2000$). We use this value for our low cost
H. Bates, SSN 680) and October 1, 1999 (Hawkbill, SSN 666). Only Parche (SSN 683) and the L.Mendel Rivers (SSN 686) remain in active service in FY 2000. Retirement ages for decommissionedsubmarines (age from commissioning to decommissioning) range from 18.9 years (SSN 687, Richard B.Russell) to 28.8 years (SSN 674, Trepang).6Analysis of data for thirteen 637-class refueling overhauls shows 35,400 man-days and 12.5 percentadditional cost for material. For 15 regular (non-refueling) overhauls, the corresponding values are329,000 man-days and 14.3 percent for material costs.7Most of the information in this paragraph was communicated verbally at the August 6 meeting.8General Dynamics Electric Boat and Newport News Shipbuilding are the two current, privateshipyards that construct nuclear-powered submarines.

54
estimate. It is important to note, however, that these estimates represent coststo the nation of a dedicated scientific submarine. It is possible that the Navycould have underutilized personnel in its yards. Under such conditions theincremental costs for such a submarine attributable to NSF could be less thanthis low estimate if the work was performed in these public yards. Anevaluation of this issue was beyond the scope of this study.
Scheduled Major Maintenance (Docking Selected RestrictedAvailability [DSRA])
The Navy estimate of $11.7 million (FY2000$) for the DSRA represents a verysignificant improvement over the historical norm for 637-class submarines. Asmentioned in the first paragraph of the Overhaul section above, the EOCmaintenance strategy requires two DSRAs between overhauls (or between thelast overhaul and inactivation). Based on experience with the 688-classsubmarines, the Navy projects that the two DSRAs can be replaced by a singleDSRA midway through the operating cycle. Of course, the work content and thecost of the single DSRA are greater than one of the two DSRAs. The Navyprovided RAND with actual costs for eighty 637-class DSRAs, all conductedunder the EOC strategy. These DSRAs average $9.6 million (FY2000$). Two ofthem would cost $19.2 million; thus, the Navy projects a savings ofapproximately 40 percent relative to the EOC.
For science operations, we again assume elimination of the combat systemsmaintenance (high cost estimate) and use the private shipyard man-day ratebenefit (low cost estimate). Reducing by 15 percent for the combat systemsyields $10.2 million (FY2000$), which we use for our high and medium costestimates. A further 25 percent reduction for the private yard rate yields atotal of $7.7 million (FY2000$), which we use for our low cost estimate.
Navy Personnel
This and the next three categories were not discussed at the August 6, 1999meeting with the Navy.9
A principal concept in using the L. Mendel Rivers as a dedicated scienceplatform is that the Navy crew would be reduced to allow room for sciencepersonnel and equipment on board. To develop an estimate for the reduced Navy
______________9Subsequent telephone conversations provided some definitions regarding the OPTAR, IMA, andRA/TA estimates. The MPN estimate was simply described as a standard budget figure.
55
crew costs, we obtained detailed crew composition information and identifiedspecific personnel to remove for science operations. We also developed anestimate of complete Navy crew costs that matches the value presented in theNavy’s estimate.
The L. Mendel Rivers’ crew composition data were obtained from the FORMIS(Forces Readiness and Manpower Information System) database.10 FORMISprovides three crew compositions for three fiscal years. The crew compositionsare the actual crew assigned, the authorized crew, and the required crew. Forthe L. Mendel Rivers, the authorized and assigned crews are identical.Appendix A shows the authorized crew, the actual crew for FY 1998 (the mostrecent available at the time) and a proposed science crew. We used theauthorized crew to obtain an estimate consistent with the Navy estimate,assuming it would use that crew for budgeting purposes. To develop the sciencecrew, we removed specific personnel from the FY 1998 crew. The reduction is 20below the actual crew and 25 less than the authorized crew.
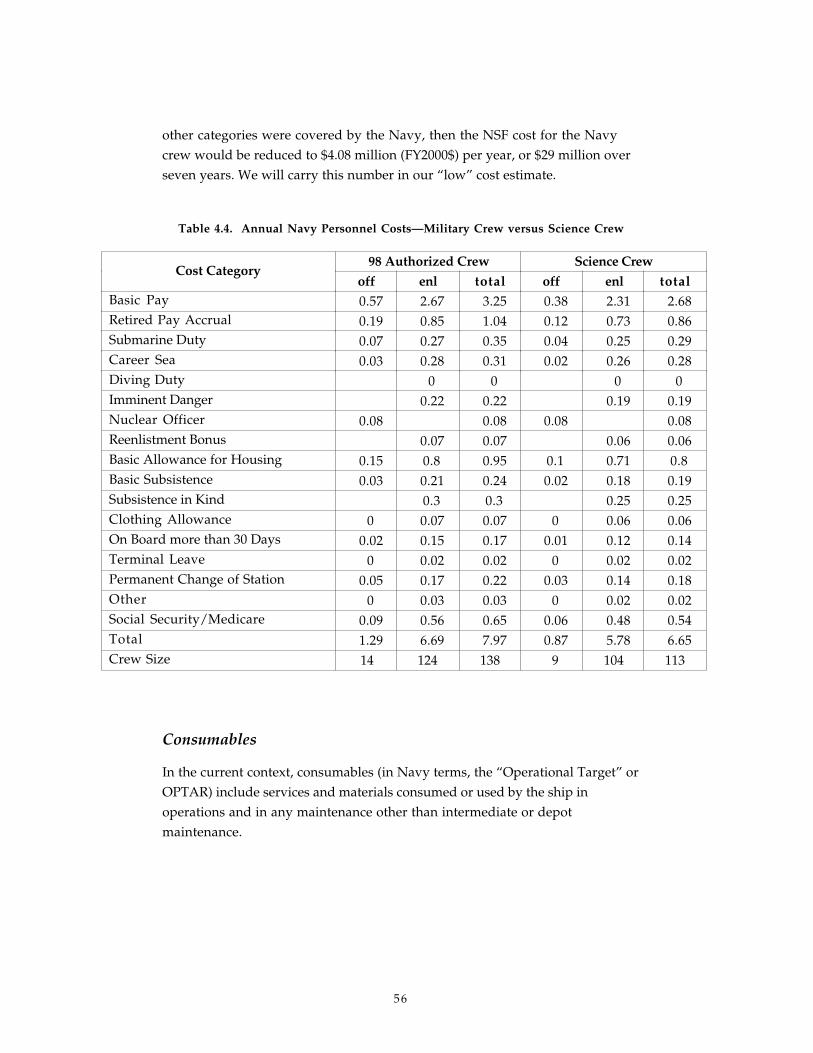
Crew cost estimates were determined using the FY 2000 pay rates and factorspresented in the Justification of Estimates from the Navy FY 2000/2001Budget.11 Results for the FY 1998 Authorized crew and the proposed sciencecrew are shown in Table 4.4. Blank cells have zero cost. Cells with a 0.00 entryhave costs less than $10,000 per year. The annual cost for the authorized crew is$7.97 million (FY2000$) and for the science crew it is $6.65 million (FY2000$),which is a reduction of 17 percent. Over seven years this yields $47 million,which we use for our high and medium cost estimates.
Retaining the L. Mendel Rivers in service may have benefits for the Navy,even if it is converted to a “non-combat” configuration. If this is the case, then itcould be argued that it would be fair for NSF and the Navy to share some of thecosts. The most logical area for such sharing would likely be in crew costs. TheNavy crew remains in the Navy and would obtain experience and training withsome positive value to the military branch. Also, the Navy could benefitdirectly from at least some of the scientific research. This is something thatwould have to be worked out between the Navy and NSF. Perhaps anagreement based on the various cost categories that constitute the budget cost ofNavy personnel could be agreed to. To illustrate this, consider the Basic Pay,Retired Pay Accrual, and Social Security/Medicare categories. Thesecorrespond to the categories that NSF would be paying the science crew. If the
______________10The FORMIS database can be accessed on the Internet at http://www.dmdc.osd.mil/formis. This is a secure site and requires “.mil” access and a user ID and password.11Department of the Navy FY 2000/2001 Biennial Budget Estimates, Justification of Estimates,February 1999.
56
other categories were covered by the Navy, then the NSF cost for the Navycrew would be reduced to $4.08 million (FY2000$) per year, or $29 million overseven years. We will carry this number in our “low” cost estimate.
Table 4.4. Annual Navy Personnel Costs—Military Crew versus Science Crew
98 Authorized Crew Science CrewCost Category
off enl total off enl totalBasic Pay 0.57 2.67 3.25 0.38 2.31 2.68Retired Pay Accrual 0.19 0.85 1.04 0.12 0.73 0.86Submarine Duty 0.07 0.27 0.35 0.04 0.25 0.29Career Sea 0.03 0.28 0.31 0.02 0.26 0.28Diving Duty 0 0 0 0Imminent Danger 0.22 0.22 0.19 0.19Nuclear Officer 0.08 0.08 0.08 0.08Reenlistment Bonus 0.07 0.07 0.06 0.06Basic Allowance for Housing 0.15 0.8 0.95 0.1 0.71 0.8Basic Subsistence 0.03 0.21 0.24 0.02 0.18 0.19Subsistence in Kind 0.3 0.3 0.25 0.25Clothing Allowance 0 0.07 0.07 0 0.06 0.06On Board more than 30 Days 0.02 0.15 0.17 0.01 0.12 0.14Terminal Leave 0 0.02 0.02 0 0.02 0.02Permanent Change of Station 0.05 0.17 0.22 0.03 0.14 0.18Other 0 0.03 0.03 0 0.02 0.02Social Security/Medicare 0.09 0.56 0.65 0.06 0.48 0.54Total 1.29 6.69 7.97 0.87 5.78 6.65Crew Size 14 124 138 9 104 113
Consumables
In the current context, consumables (in Navy terms, the “Operational Target” orOPTAR) include services and materials consumed or used by the ship inoperations and in any maintenance other than intermediate or depotmaintenance.
57
The Navy VAMOSC (Visibility and Management of Operating and SupportCost) system12 provides an independent source of data for this, and the next twocategories. For this study, RAND obtained the 637-class individual ship,annual, VAMOSC data for FY 1984 through FY 1997.13 This amounts to 440“submarine-years” of data. We restricted our analysis to only those submarinesthat were active throughout the time period and that followed the EOCmaintenance strategy. This reduced our sample to 30 submarines for nine years,for a total of 270 “submarine years.” The average annual cost of consumablematerials, per ship, is $1.35 million (FY2000$). The seven-year total is $9.5million, which is greater than the estimate provided by the Navy forextension of the L. Mendel Rivers operations. The Navy estimate is based onthe most recent three years of data for 637-class submarines. We have no basisfor reducing either of these estimates as a result of not operating the combatsystems or taking advantage of private shipyard labor rates. Consequently, weuse for all our cost estimates the Navy provided estimate of $8.4 million for theseven-year total cost.
Intermediate Maintenance
This category covers the cost of material and labor expended by a tender, repairship, or equivalent ashore or afloat intermediate maintenance activity for anyrepairs other than scheduled depot maintenance (e.g., depot overhaul andDSRA) and unscheduled maintenance.
Again, we turn to the VAMOSC data. The average annual cost of intermediatemaintenance, per ship, is $710,000 (FY2000$), for a seven-year total of $5million. This amount does not include any overhead costs for the intermediatemaintenance, which at least partially explains why the amount is so muchlower than the Navy-provided estimate, which includes overhead (for a totalof $19.7 million over seven years). The Navy’s estimate is based on the mostrecent three years and assumes the work is done at the homeport yard (Norfolkfor the L. Mendel Rivers). Considering the number of active 637-classsubmarines has been rapidly dropping in the past few years and that it islikely the overhead facilities at Norfolk supporting these submarines have notbeen reduced in proportion to the decrease in the number of active submarines,the overhead allocation per submarine in the Navy’s estimate may be
______________12VAMOSC is maintained by the Naval Center for Cost Analysis (NCCA). Information aboutVAMOSC can be found on the NCCA Web site at http://www.ncca.navy.mil.13For this time period, the average 637-class submarine age is 19.3 years, and the maximum andminimum are 27.9 and 8.9 years, respectively. In FY 1997, the L. Mendel Rivers was 22.4 years old. Allages are measured from the commissioning date.

58
exceedingly high.14 We were not able to investigate this during the course ofthe project.
The issue here is whether NSF should cover the costs of facilities at NorfolkNaval Shipyard, especially if as a dedicated research submarine, Rivers ishome-ported at one of the private yards (Electric Boat or Newport News). Forour estimates here, we take the Navy estimate reduced by 15 percent (to $17million) to reflect no maintenance of the combat systems, for the “high cost”value.
To arrive at the medium and low cost estimates, we start from the VAMOSCdata rather than the Navy estimates. To correct for the absence of overheadcosts in the VAMOSC data, we increase the $5 million figure by 32 percent,which is the ratio of overhead to labor plus material costs for depot overhaulat a public shipyard as given in VAMOSC for 637-class submarines. Thus, ourmedium cost estimate for IMA cost is $6.6 million (FY2000$).
We further reduce this by 25 percent to reflect the private shipyard rateadvantage, for our “low cost” estimate of $5 million.15
Unscheduled Repairs
This category includes nonscheduled depot level repairs requiring the ship to bein a shipyard (in Navy terms, “Restricted Availability”), and rendering itincapable of performing its mission; and also nonscheduled depot-level repairsthat do not require the ship to be in a shipyard and do not interfere with theship’s ability to perform its mission (in Navy terms, “TechnicalAvailability”). The common thread here is that both types of availabilityinvolve unscheduled maintenance and cannot be accomplished by the ship’screw or an intermediate maintenance activity.
From VAMOSC, the average annual cost of unscheduled repairs, per ship, is$1.04 million (FY2000$). VAMOSC also has an Other Depot Maintenancecategory, which for submarines contains costs for depot-level component reworkand maintenance planning. The average annual cost per ship is $260,000(FY2000$). Combining these two costs yields a seven-year total of $9.1 million,
______________14If the overhead in the $19.7 million figure is at 32 percent, then the labor plus material cost is $14.9million or nearly three times the historical VAMOSC value. It seems more likely that the overhead ishigh.15This area should be investigated more thoroughly by NSF if there is a decision to proceed withconversion of Rivers for science operations, especially if the submarine is homeported at a privateyard.

59
as compared to the Navy estimate of $12.8 million. We reduce this value by 15percent to give our high cost estimate of $11 million.
Again, the Navy estimate is based on the three most recent years and may bebiased upward. We use the $9.1 million from the VAMOSC data “unscheduledrepairs” cost category. Because this includes repairs of combat systems, wereduce our estimate by 15 percent as with the categories above to give a mediumcost estimate of $8 million. Because the repairs covered by this category areunscheduled, it does not seem reasonable to assume that they can all beaccomplished at a private shipyard. Some repairs will be urgent while othersmay be postponed until the submarine returns to its homeport. For our low costestimate, we assume half of the unscheduled repairs will be performed in aprivate shipyard, corresponding to $6.8 million (FY2000$).
Science-Related Costs
Science Conversion Costs
The Navy did not provide estimates of the onetime cost of preparing the L.
Mendel Rivers to conduct scientific missions. RAND estimates that the cost ofthese modifications, shown in detail on the following pages, is a onetimeexpenditure of $5 million.
Although the costs of converting the L. Mendel Rivers for scientific use would bea small fraction (approximately 2 percent) of the total costs, it is nonethelessuseful to examine the basis of these costs in some detail. As opposed to the othercosts of the science submarine, these modifications are new and unique to thismission.
RAND asked Electric Boat to provide a notional design of the modificationsnecessary to improve SSN 686 as a dedicated scientific platform. Thesemodifications would focus on the torpedo room, half of which would beconverted into laboratory space. The modifications would include installinglaboratory equipment for analysis, universal hull mounts for externalinstrumentation, a flow-through manifold for water sampling, a head for thescientific party; and developing a computer work room and internal datanetwork.
These modifications would be made consistent with all Navy SUBSAFECertifications. The scientific modifications would cause no change in thesubmarine’s operating characteristics, such as bare hull ship speed and
60
operating depth. Any systems and equipment not needed to meet scientificmission requirements would be inactivated in place.
We did not consider all the possible modifications for a science submarine. Forinstance, we did not include equipment for vertical water sampling or handlingcapabilities, other than the torpedo tubes for launching autonomous underwatervehicles (AUV/ROV).
While the modifications we assume in this analysis are removable, there is noneed to reinstall them for each mission. Additional scientific modificationsbeyond those considered here could be installed during regular repair periodsbetween missions.
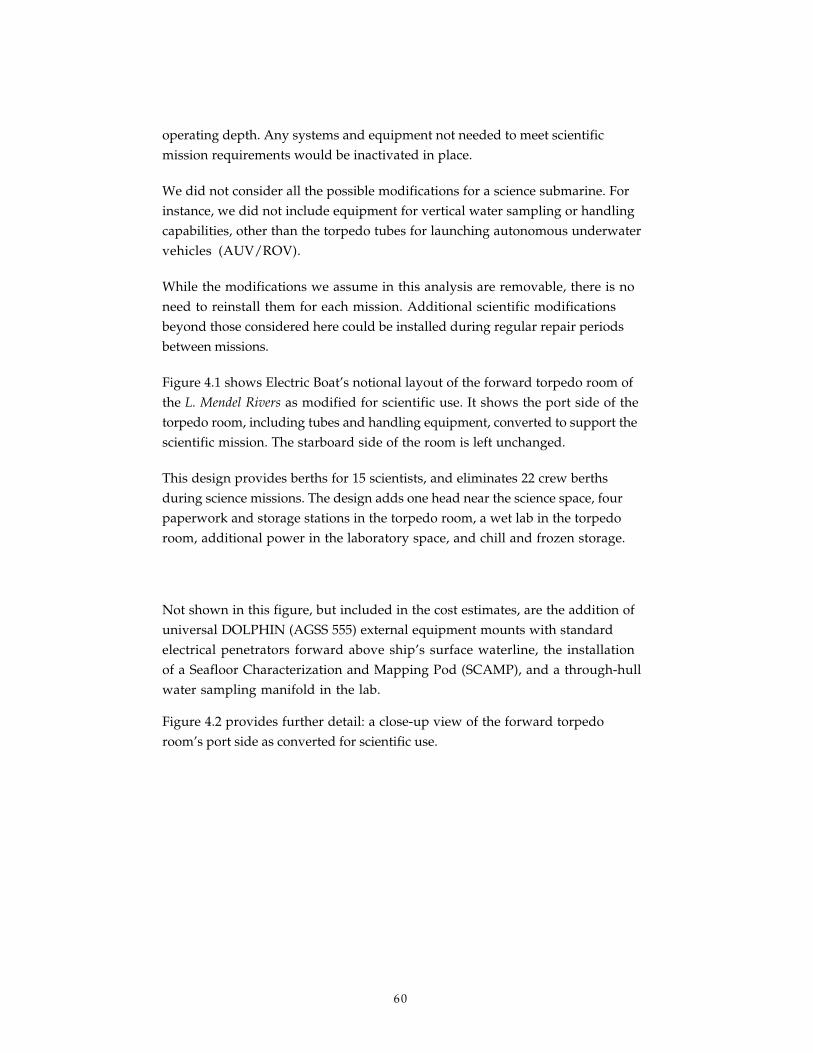
Figure 4.1 shows Electric Boat’s notional layout of the forward torpedo room ofthe L. Mendel Rivers as modified for scientific use. It shows the port side of thetorpedo room, including tubes and handling equipment, converted to support thescientific mission. The starboard side of the room is left unchanged.
This design provides berths for 15 scientists, and eliminates 22 crew berthsduring science missions. The design adds one head near the science space, fourpaperwork and storage stations in the torpedo room, a wet lab in the torpedoroom, additional power in the laboratory space, and chill and frozen storage.
Not shown in this figure, but included in the cost estimates, are the addition ofuniversal DOLPHIN (AGSS 555) external equipment mounts with standardelectrical penetrators forward above ship’s surface waterline, the installationof a Seafloor Characterization and Mapping Pod (SCAMP), and a through-hullwater sampling manifold in the lab.
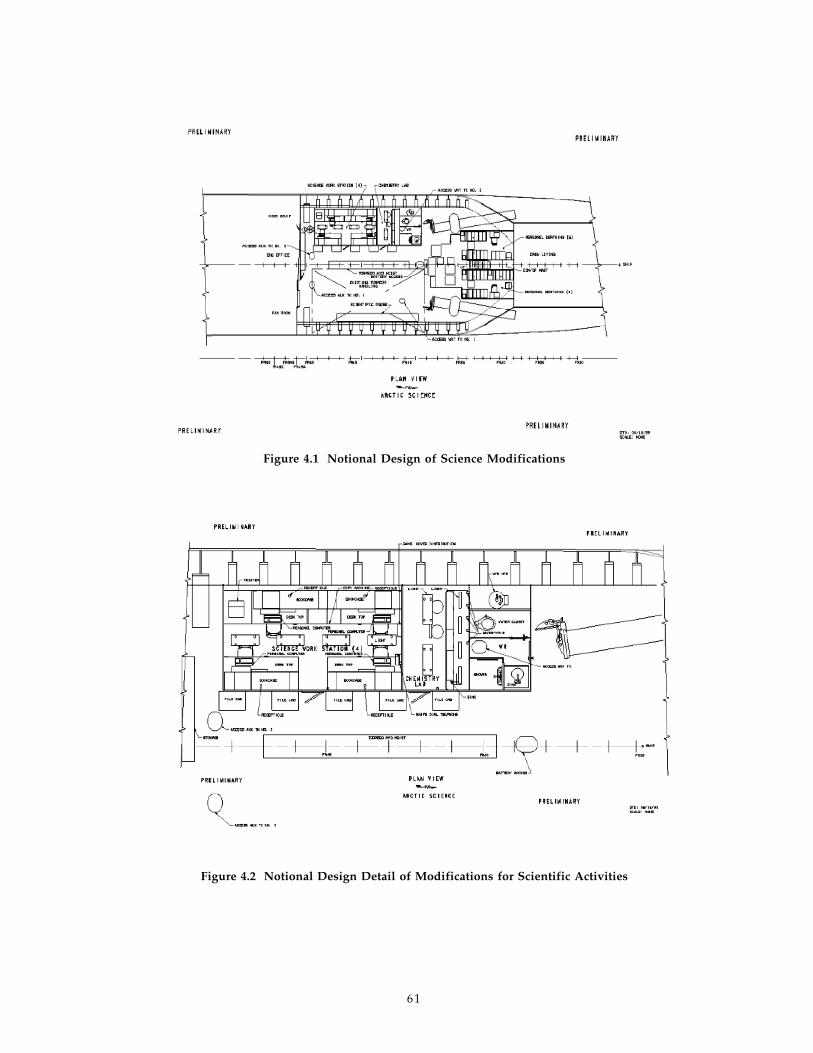
Figure 4.2 provides further detail: a close-up view of the forward torpedoroom’s port side as converted for scientific use.
61
Figure 4.1 Notional Design of Science Modifications
Figure 4.2 Notional Design Detail of Modifications for Scientific Activities
62
Science Support Costs
In addition to the conversion costs, there are costs to support the scientificmission. Separate from the onetime installation and conversion activitiesduring the depot overhaul, the scientific support costs can be viewed as ongoingoperational expenditures. We assume that these costs are driven by two majorcomponents:
• Support for a submarine science crew
• Support for individual investigators who want to collect and/or analyzedata, including new sensors or systems that are required for the scientificmission.
The scientific support costs involve a crew of science technicians and funds forindividual research projects and new sensors. Based on experience from theSCICEX cruises, we assume a crew of five technicians with an annual salary of$100,000 (including all benefits and indirect costs). With these assumptions,the submarine science crew would cost $250,000 to $500,000 per year, dependingon whether these crew costs were attributed to the dedicated science submarinefor the entire year of only the period when it was at sea. Consistent with ourassumptions about the allocation of Navy crew costs, we use the full annual costfor our high and medium cost estimates and the days-at-sea estimate for ourlow cost estimate.
Based on the NSF support for SCICEX missions between 1993 and the present,we estimate that each project on a science submarine would require $250,000 ofsupport; there would be 10 projects per cruise and 3 cruises per year. Weanticipate that these funds would allow a modest level of sensor developmentfor new submarine measurements and experiments. With these assumptions, thetotal scientific support costs would be $8 million per year.
This level of support is comparable to the average award level for thecompetitive projects from the Office of Polar Programs (OPP) in FY 1999. Theseawards include investigator support and equipment costs for the entire PolarResearch Program in the Arctic and Antarctic. More important, it excludeslogistical support. We can refine this number by considering the historical NSFsupport for the SCICEX missions. All told, more than 45 projects between 1993and the present amounts to more than $9.19 million (in current-year dollars),corresponding to an average award of $204,000. This value is slightly less thanthe OPP average in 1999 and it may be influenced by the large increase infunding for this program over the past five years (see Table 4.5). The SCICEXsupport projects range from support for individual investigators for specific

63
data analysis to the design and installation of specialized equipment (e.g., theSCAMP system).
Comparison with Current NSF Expenditures
To benchmark the operation, maintenance, and science support costs for aresearch submarine, we compared the submarine cost estimates to currentfederal budgets in related areas of research and science. For the most part, thisanalysis focused on Arctic research supported by NSF. The rationale for thisapproach is that the largest fraction of the submarine benefits will be realizedin the Arctic, where NSF is the largest supporter of research activities.
The purpose of this analysis is to put the proposed submarine expenditures inthe context of current U.S. research budgets. In essence, we ask: How would thescience submarine’s cost compare to the budgets in comparable fields of science?The submarine would augment existing research activities. Therefore, we wantto compare the cost of submarine activities to the cost of those existing researchactivities. Overall, total annual NSF expenditures in the Arctic wereapproximately $70 million. In FY 1999, annual support for the entire federaloceanographic research fleet was approximately $60 million.
As articulated by the Arctic Research Commission, U.S. funding priorities inthe Arctic encompass basic and applied research activities, educationinitiatives for Arctic residents, and support for research infrastructure andlogistics. The topic areas for our analysis overlap three of the Commission’srecommendations for basic research: studies of the Bering Sea, studies of Arcticclimate change, and Arctic Ocean research. The fourth recommendation,environmental health of Arctic residents, would not be impacted by submarinedata. Table 4.5 details the full range of Arctic research expenditures by U.S.government agencies addressed to the priorities of the Arctic ResearchCommission.
64
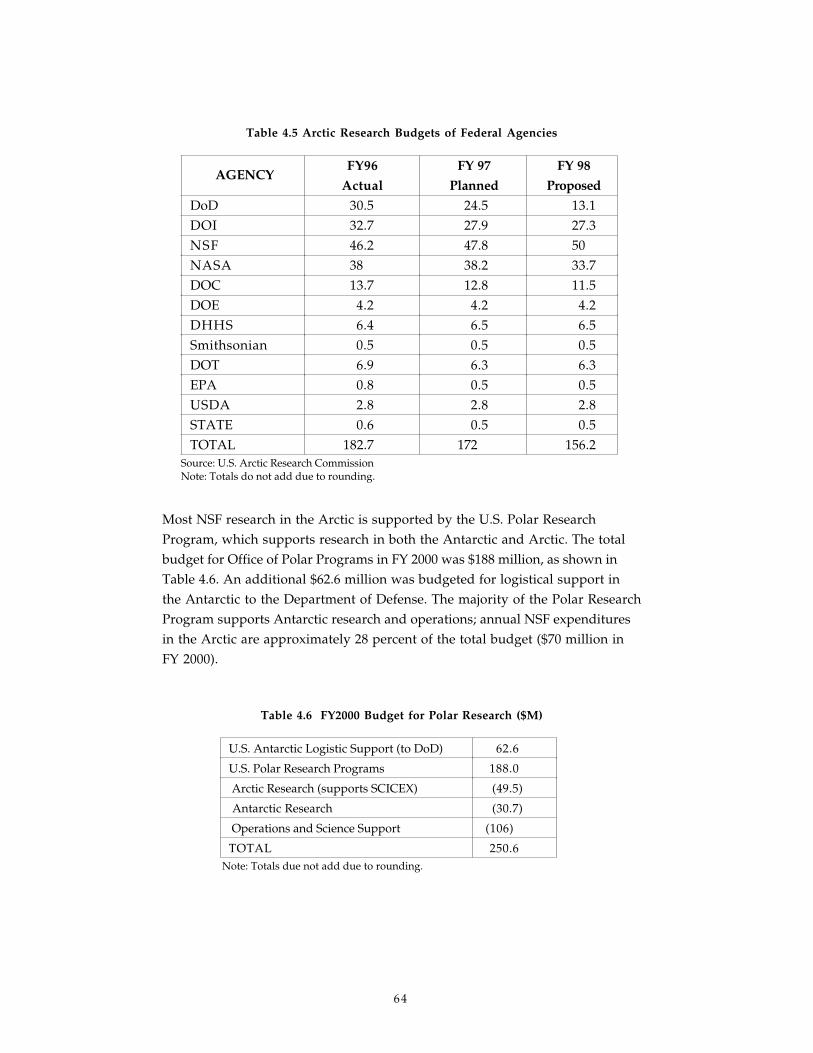
Table 4.5 Arctic Research Budgets of Federal Agencies
FY96 FY 97 FY 98AGENCY
Actual Planned Proposed
DoD 30.5 24.5 13.1DOI 32.7 27.9 27.3NSF 46.2 47.8 50NASA 38 38.2 33.7DOC 13.7 12.8 11.5DOE 4.2 4.2 4.2DHHS 6.4 6.5 6.5Smithsonian 0.5 0.5 0.5DOT 6.9 6.3 6.3EPA 0.8 0.5 0.5USDA 2.8 2.8 2.8STATE 0.6 0.5 0.5TOTAL 182.7 172 156.2
Source: U.S. Arctic Research CommissionNote: Totals do not add due to rounding.
Most NSF research in the Arctic is supported by the U.S. Polar ResearchProgram, which supports research in both the Antarctic and Arctic. The totalbudget for Office of Polar Programs in FY 2000 was $188 million, as shown inTable 4.6. An additional $62.6 million was budgeted for logistical support inthe Antarctic to the Department of Defense. The majority of the Polar ResearchProgram supports Antarctic research and operations; annual NSF expendituresin the Arctic are approximately 28 percent of the total budget ($70 million inFY 2000).
Table 4.6 FY2000 Budget for Polar Research ($M)
U.S. Antarctic Logistic Support (to DoD) 62.6
U.S. Polar Research Programs 188.0
Arctic Research (supports SCICEX) (49.5)
Antarctic Research (30.7)
Operations and Science Support (106)
TOTAL 250.6Note: Totals due not add due to rounding.
65
While the Arctic component of this program is less than 25 percent of thebudget, it is the fastest growing line item in the program, and it is the subject ofcontinuing congressional interest during the appropriations process. Accordingthe NSF budget submission, the Polar Research Program supports 70 percent ofNSF’s university-based research in the Arctic. The NSF budget notes that thisline item supports a wide range of research platforms in the Arctic. That is,current funds are not concentrated in a single large facility, comparable to asubmarine, but are dispersed across many efforts that include icebreakers, otheroceanographic vessels, ice camps, and other research platforms, as described inChapter 2.
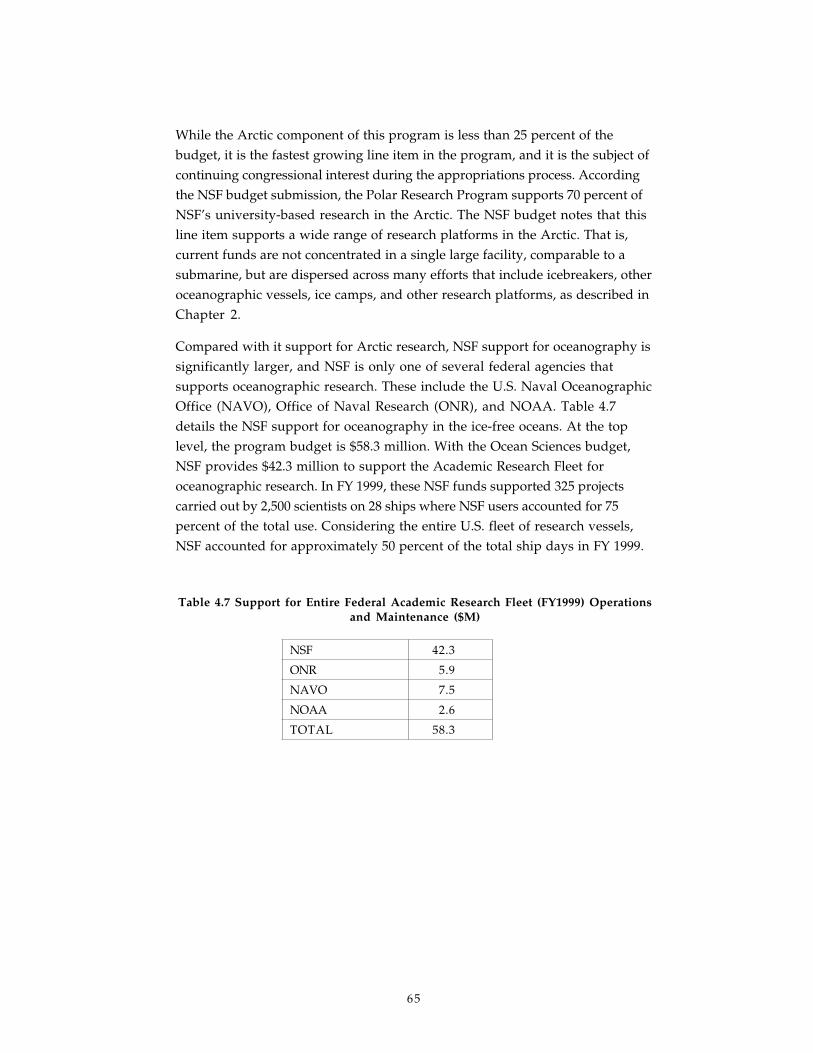
Compared with it support for Arctic research, NSF support for oceanography issignificantly larger, and NSF is only one of several federal agencies thatsupports oceanographic research. These include the U.S. Naval OceanographicOffice (NAVO), Office of Naval Research (ONR), and NOAA. Table 4.7details the NSF support for oceanography in the ice-free oceans. At the toplevel, the program budget is $58.3 million. With the Ocean Sciences budget,NSF provides $42.3 million to support the Academic Research Fleet foroceanographic research. In FY 1999, these NSF funds supported 325 projectscarried out by 2,500 scientists on 28 ships where NSF users accounted for 75percent of the total use. Considering the entire U.S. fleet of research vessels,NSF accounted for approximately 50 percent of the total ship days in FY 1999.
Table 4.7 Support for Entire Federal Academic Research Fleet (FY1999) Operationsand Maintenance ($M)
NSF 42.3
ONR 5.9
NAVO 7.5
NOAA 2.6
TOTAL 58.3