Embed Size (px)
Citation preview

78
Chapter 4 Current State and Tasks of Mining Activities
4.1 Activities of Large Mines owned by RTB Bor
RTB Bor is located in the Bor District which is about 230km by road to the southeast of
Belgrade. RTB Bor consists of three mining complexes: the Bor Copper Mine (RBB), the
Majdanpek Copper Mine (RBM) and the Copper Smelter (TIR). The RBM is located in Majdanpek
City, but the other two complexes are in Bor City.
Mining at RTB Bor dates back well over a century. RTB Bor started as an underground
mine and has expanded underground operations, but it has also developed open pit mines in Bor,
Majdanpek, Veliki Krivelj and Cerovo. In 1991, RTB Bor recorded its highest production for one
year, 26.5 million tons. But it closed the Bor open pit in 1993 and the Cerovo open pit in 2002, and
currently produces ores from only 3 mines: the Bor underground mine, and the Majdanpek and
Veliki Krivelj open pits. Fig. 4.1 shows production trends at RTB Bor for the last 20 years.
Fig.4.1 Production of the last 20 yrs at RTB Bor (source: RTB Bor)
Production dropped sharply in 1993 and 1999, as can be seen in Fig.3.18. It should be
noted that Majdanpek used to account for the vast majority of production up to the early 1990s, but
relinquished the lead to Veliki Krivelj in 1993. Production at Majdanpek began dropping sharply in
2001, and consequently total production of RTB Bor dropped dramatically, causing severe financial
problems for the company. The state-owned mine RTB Bor has completed the procedure for full
privatization, based on the restructuring and privatization strategy formulated in 2005. Official
bidding was opened in 2006. The government negotiated with the top ranked bidder, Cuprom
(Romania), but negotiations collapsed in May, 2007. The government is currently negotiating with
the awarded Austrian company in the second tender.
Each mine is operated in three shifts/day, 365 days/year. The main mine facilities of RTB
Bor in Bor City are shown in Fig.4.2. The organization chart of RBB is shown in Fig.4.3.

79
Manager for El-Mech.Maintenance
Deputy Manager forUnderground Exploitation
Manager for UG Production
Manager for El-MechMaintenance
in UG
Deputy Manager for Surface Exploitation
Manager for Electrical Mechanical Maintenance
for Open pit
Coordinator
Financial Manager Manager for Commercial
And Marketing
Manager for Development and
Investments
Supervisor for EM Maintenance sector
Supervisor for Geology Sector
Supervisor for Planning and Production analyses
Supervisor for Non-Metal Production
Supervisor for Production co-ordination
Sector
Development Sector
Manager for Law and Human Resources
Law and Human Resources Sector
Investment Sector
Supervisor for OP Veliki Kriveg
Supervisor for Processing PL Veliki Krivelg
Supervisor for OP Cerovo
Supervisor Processing PL Bor
Supervisor “Pit” (UG)
Supervisor Sandstone OP “Belorecui”
Supervisor OP “Zagradje”
Economy Sector
Information Sector
Commercial Sector
Marketing Sector
Supervisor Exploration
Safety Supervisor andfor ISO Standard Safety Sector
General Manager
Fig.4.2 Layout of the Main Mine Facilities in Bor City (source: RTB Bor)
Fig.4.3 The Organization Chart of RBB (source: RTB Bor)
4.1.1 Bor Underground Mine
The history of the RTB Bor underground mine dates back to 1897 when first exploration
was done in the Tilva Ros area by a French investor. The first production took place in 1904. In
1907, a new copper smelter began operation with a capacity of 60,000t/year. At that time, mined

80
Fig.4.4 Production of the Bor Underground Mine
kt %
ore was very high in grade (approx. 9%), and was sent to the smelter directly as concentrate
without ore processing. In 1933, an ore processing plant was built, one year after mining of
low-grade ore started. The high-grade ore deposits were mined intermittently after that until they
were exhausted in 1991. A total of 9.12 million tons of high-grade ore was mined, with an average
grade of 6.2%Cu.
In 1993, the Bor open pit stopped operation because mining targets (Tilva Ros and P2A)
were too deep. Since then, these ore bodies have become the principal ore sources for the
underground mine. Exploitation of the Brezanik ore body, which is slightly distant from these two
ore bodies, was begun in 1980. Peak production of the underground mine was 1.93 million tons in
1996, and remained at a level near that
for the next 3 years. However,
production began dropping in 1999,
and by 2001 it had fallen to 470,000t.
This was due to a shortage of parts for
underground machines caused by
economic sanctions. Fig.4.4 shows
production of the underground since
1985. Sharp production declines in
1999 and 2001 are easily recognized.
All production data are attached in the
Appendix.
Fig.4.5 shows a schematic diagram of the current underground mine.
The main shaft (6.4m in diameter) runs between K+440mL and K-235mL, and a
Koepe-type cage (capacity: 120 miners) runs between K+449mL to K-76mL (525m) to transport
Fig.4.5 Schematic Diagram of the Bor Underground Mine (source: RTB Bor)

81
miners and materials in the underground. This shaft also provides lifelines such as ventilation,
compressed air, electricity, water, etc.
The Bor underground mine introduced trackless system in 2003, when the underground
tracks were removed. Regarding mining methods, sublevel caving is used at Tilva Ros and P2A,
and cut and fill is used at Brezanik. The stope drift has a section of 4m (W)×3.5m (H), and haulage
drift has a section of 5m (H)×3.5m (H). The main machines used underground are listed in Table
4.1.
Table 4.1 Main Machines used in the Bor Underground Mine (source: RTB Bor) Type Model Manufacturer Number Year purchased Note
MINIMATIK A 200M TAMROK 1 1980 Compressed air MINIMATIK H207M TAMROK 2 1984 Hydraulic
MONOMATIK 1 1983 Jumbo
SIMBA H153 Atlas Copco 3 1990 ST6C (9t) Wagner 4 1990 For loading
LHD ST2DR (3t) Wagner 2 1990 For service
Loader CAVO320 Atlas Copco 2 1985 For loading MT-420 (11m3) Wagner 2 2003 For transporting
Truck PK-6000 Normet 2 1983
Underground machines are generally old. For example, some machines such as fans,
feeders, belt conveyors, and pumps have been used for more than 30 years. Some heavy vehicles
have been also used a long time; some drills for more than 20 years, LHDs for nearly 20 years.
Such machines often break down due to mechanical troubles.
Ore in the P2A ore body is mined at the K0m Level and transported by ST6C to the R01
ore-pass, where it is dumped. Ore in the Tilva Ros ore body is mined at the K-30m Level and
transported by ST6C and dumped in the R02 ore-pass. And ore in the Brezanik ore body is mined at
the K+90m Level and transported and dumped by ST6C into the R03 ore-pass, and then removed at
the K-13m Level to be transported and dumped by underground truck into the R04 ore-pass. Ores
mined in these 3 ore bodies are extracted at the K-150m Level via several ore-passes to be
transported and dumped by underground trucks into the underground ore-bin (capacity: 55m3).
Ore is crushed mostly to under 150 mm by a primary crusher (Allis-Chalmers) installed
in the K-150m Level. The crushed ore is then transported 755m horizontally by the belt conveyers
at the K-235m Level, and then lifted 770m up to the K-16.5m Level by inclined belt conveyers to
be crushed again to under 150 mm by another primary crusher (Allis-Chalmers type) made by
Krupp, and sent to the ore bin. After the ore is weighed and loaded into the Koepe-type skip
(capacity: 16t) installed at the K-100m Level, it is lifted about 500m up to the surface. The ore is
then crushed to under 50mm by a secondary crusher (Symons) at the surface, and crushed to under
20mm by a tertiary crusher (Symons), after which it is sent to the processing plant by belt
conveyers. The flow of ore from each stope is shown in Fig.4.6.

82
Fig.4.6 Ore Flow Chart for the Underground Mine
In Feb. 2007, an accident occurred in the Bor Underground Mine. The bottom broke due to
heavy accumulated rain in the pit bottom of the former Bor Open Pit, and a large amount of water
flowed into the Tilva Ros and P2A. A miner was killed and several miners were injured in the
accident. Currently, neither mining area can produce ore because they are under water. Belgrade
University is investigating the possibility of restoring the underground, however it seems it would be
very difficult to reopen both mining areas.
Therefore, the Brezanik is presently the only underground mining area. The Brezanik
mining area uses the Cut and Fill method with 3m slicing and filling as shown in Fig.4.7. The ore
bodies are mined in two parts, leaving a horizontal safety pillar with a thickness of 10 m.
Fig. 4.7 shows schematic section of stopes in the Brezanik mining area.
Fig.4.7 Cut and Fill Method in Brezanik
Several large fans provide ventilation that is required because of the diesel-powered

83
machines used in the underground. Total inlet-volume is about 4,500m3/min through the main inlet
shafts (GVO and IO), and total exhaust volume is about 4,560m3/min through the outlet shafts
(VO4 and SO). A schematic diagram of the underground ventilation system is shown in Fig.4.8.
Fig.4.8 Schematic Diagram of Underground Ventilation
Underground operation is finely managed using various production and cost data, the same
as in Western countries. Daily production information such as amounts of ore feeding to the plant,
and amounts of ore transportation by skip and by underground tracks, is provided to the mining
department for production and budget management. Weekly meetings are held in the mining
department to determine countermeasures when the budget is not met. However, the leading cause of
budget shortfalls is the low workability of superannuated machines, so there is no specific penalty
for them. Table 4.2 shows a comparison of operation efficiency between 1996 (year of production
peak) and 2003 (year of significantly reduced production).
Table 4.2 Comparison of Underground Operations in the Bor Mine in 1996 and 2003 (source: Bor) 1996 2003
Item operation workers efficiency operation Workers Efficiency
Brezanik 260,098t 22,896 11.36t/miner 29,111t 4,315 6.75t/miner
Tilva & P2A 1,672,977t 18,960 88.24t/miner 294,674t 9,221 31.96t/miner
Min
ing
total 1,933,075t 41,856 46.18t/miner 323,785t 13,536 23.92t/miner
Drifting 6,058m 12,900 0.47m/miner 1,464m 7,484 0.20m/miner
Investment 1,544m 9,694 0.16m/miner 1,559m 8,587 0.18m/miner
Transporting & crushing 1,933,075t 12,6446 152.88t/miner 323,785t 12,644 25.61t/miner
Grand total 1,933,075t 75,987 25.44t/miner 323,785t 42,251 7.66t/miner
According to this table, production in 2003 was only about one sixth of the 1996 level.
This dramatic decrease was mainly due to the embargo on mining machine parts. Operation

84
Fig.4.9 UCL Plan at -450mL Depicted by Gemcom
efficiency decreased in all areas, because of disruptions caused by inadequate machines. Painful
situation of the mine operation can be easily understood. The amount of drifting also dropped,
falling to one fourth because only a few machines could be used for production. Therefore,
subsequent mining could be more difficult owing to the lack of mining preparation and exploration.
It should be noted that total mining efficiency of the Bor operations in 1996 was 36%
lower than that of the Kamioka Mine, which was the most mechanized mine in Japan. Mining
efficiency cannot be compared easily because mining conditions are not the same. However, it is
likely to be one reason for the Bor to have not been depleted as much as Japanese mines. In
underground operations, there is not a precise understanding of ore distribution.
4.1.2 Development of the Borska Reka Ore body
The Borska Reka is a gigantic
ore body located near the Bor
underground and Veliki Krivelj open pit,
but it lies beneath the Bor underground
mining levels. A plan for mining the ore
body was formulated at Belgrade
University in 1999, and a mining
consultant contracted by the World Bank
reviewed and analyzed the contents of the
plan in 2005, with the following
conclusions:
♦ It may be technically possible to mine some areas of the Borska Reka in
a profitable way.
♦ Due to the geometry and characteristics of the ore body, block caving would be the preferable
mining method, if not the only one.
♦ Due to the quantity and quality of the resource, a low investment scenario is recommended as a
strategic approach to the project’s analysis. Based on this, a scenario that uses the Veliki Krivelj
flotation plant, conditioned for a 23,000t/day processing capacity (8.4 million t/year), has been
developed.
♦ The mining reserves for this project are 131 million t (0.56% Cu and 0.23g/t Au). The relatively
low-grade ores are quite sensitive to copper prices.
♦ The start-up period, including production ramp-up to over 3 years, is estimated to take 7 years
to reach full production capacity.
♦ The potential profitability of the analyzed scenario has not been estimated, as it depends

85
strongly on some strategic decisions that are yet to be made by the RTB. Nevertheless, the
project can be marginally profitable at a TC/RC of copper of around US$0.30.
♦ The mine manpower requirement is estimated to be approximately 350 workers. If other areas
are included, the complete project may require 700 to 1,000 direct employees, plus another 700
to 1,000 contractors doing associated work.
♦ There are some areas in which the current information is weak, particularly regarding
geo-mechanical conditions and hydro-geological characteristics at depth.
♦ Information about the project is not properly organized at this stage and may not be available
for potential buyers.
The following recommendations have been derived from a World Bank study from the
perspective of the privatization process:
♦ There are many tasks that can be undertaken, at low cost, with the current amount of
information available, like:
Developing an RQD model from existing borehole values, based on interpretations of
sections or plans of the available data.
Improving the quality of the analysis and documentation related with geotechnical
characteristics of the deposit.
Developing a block model with a resource coding that follows Western standards.
Completing the block model validation as started in the report and improving the
reliability of the figures.
Documenting precisely the block modeling process carried out by the RTB. This should
be done following international standards.
Documenting the QA/QC procedures used in the sample preparation and assaying
processes, including the analytical results. A part of this task, sample rejects should be
systematically stored so that any potential buyer can access the rejects for internal
validation.
Reviewing the flotation plant potential, from the perspective of a business plan oriented
toward the selling of copper concentrate. This means analyzing the options to increase
the concentrate grade to values close to 30%.
♦ The introduction of the deeper ore in the analysis may add interest to the project for some types
of investors. From this perspective, it is recommended to bring the mine project to the next step,
that is, analyzing in more detail the potential effect of mining the deeper ore, below -450mL.
This will require the refining of the present project and the extension of it to the next UCL level,
including the development of a rough mine plan.

86
kt %
Fig.4.10 Operation Result of the Bor Open Pit
Fig.4.11 Geological Section of the Veliki Krivelj
Fig.4.12 Operation Result of the Veliki Krivelj
kt %
4.1.3 Bor Open Pit Mine
The Bor Open Pit Mine was started
in 1923, but stripping data did not exist until
1928. The grade of ore was somewhat higher,
7 to 4 %Cu, in those years. However, the grade
gradually decreased, and has been less than
2%Cu since 1955. But, it appears that the Bor
Open Pit had kept its grade somewhat higher
than other open pits. The pit bottom reached
the deep part of both deposits, P2A and Tilva
Ros, in 1993, so the open pit was stopped due to the expansion of the stripping ratio, and both
deposits began to be mined by the underground ”Sublevel Caving” method. Production data for 1985
to 1993 are shown in Fig.4.10. All operational data are listed in the Appendix.
The total exploited rock mass from mine opening to closing was as follows:
Total ore 95,799,627t (Cu 1.4%) Total waste 171,176,926t (stripping ratio: 1.40)
4.1.4 Veliki Krivelj Open Pit Mine
The first waste stripping in
this mine was started in 1979, and the
first ore production was begun as the
4th mine of RTB Bor in 1983. Annual
production reached 9.6 million t in the
4th year after first production, and had
been maintained at nearly the same
level until 1998, when the
economic sanctions began. Since
1999, mine production has
decreased; in 2006, it was less than
4 million tons, which was about
40% of the peak. Ore grade was
0.5% Cu at the beginning, but it
had decreased over time to 0.28%
Cu in 2006. However, today it
plays the lead role in production,
accounting for 70% of the ore

87
produced at RTB Bor.
Fig.4.12 shows production data from Veliki Krivelj since 1985. All annual production data
are listed in the Appendix. Here, declines due to economic sanctions can be recognized clearly in
1993 and 1999. Operations are managed by computers, using the three dimensional software,
Gemcom, with input data of drilling (total length: about 160km) and surface surveying. Ore dilution
is also managed well within 5% in comparison with the ore reserve calculation.
Table 4.3 shows a comparison of ore mass exploited from 1983 to 1992, and from 2003 to
2006. The earlier period (1983 to 1992) was a comparatively good period of operation, while the
latter period (2003 to 2006) was far less favorable. Annual average of total mass removed declined
to less than one third, and average stripped waste decreased to about one fifth. Accordingly, the
stripping ratio decreased from 0.86 to 0.36. This indicates partially delayed stripping. Table 4.3 Comparison of Exploited Mass in the Veliki Krivelj Open Pit
Period Mined ore Stripped waste Total mass Stripping ratio
1983 to 1992 84,852,005t 73,340,701t 158,192,706t 0.86
Annual average 8,485,201t 7,334,070t 15,819,271t 0.86
2003 to 2006 16,769,965t 6,080,445t 22,850,410t 0.36
Annual average 4,192,491t 1,520,111t 5,712,603t 0.36
The main reason for the recent delayed stripping is superannuated mining machines. Table
4.4 lists the principal mining machines in the pit.
There are some old machines which have been used for more than 20 years, and some
machines with low availability.
Table 4.4 Principal Machines used in the Veliki Krivelj Open Pit (source: RTB Bor) Machine type manufacturer Yr. purchased Note
BE 45 R Bucyrus Erie 1969 Low working rate BE 45 R Bucyrus Erie 1979 Drills BE 45 R Bucyrus Erie 1981
191 M (11.5m3) Marion 1970 191 M (11.5m3) Marion 2001 Low working rate
PH 2100 (11.5m3) P&H 1978 Shovels
PH 2100 (11.5m3) P&H 1981 Euclid R 170 (170t) Volvo 1984
MT-3600 (190t) Terex 1994 MT-3600 (190t) Terex 1994 MT-3600 (190t) Terex 1994 Unworkable MT-3600 (190t) Terex 1997
Euclid R 170 (170t) Volvo 1997 Euclid R 170 (170t) Volvo 1997
MT-3600 (190t) Terex 2000 MT-3600 (190t) Terex 2000 Unworkable MT-3600 (190t) Terex 2000 Unworkable
Dump Tracks
MT-3600 (190t) Terex 2000 D 8K Caterpillar 1981 Unworkable D 8L Caterpillar 1990 Low working rate Bulldozers
D 355-A Komatsu 1987 Grader 16 G Caterpillar 1990
Mining is currently operated in three pits, but they will be eventually merged into one pit.
Fig.4.13 shows the final pit of the Veliki Krivelj.

88
Fig.4.14 shows a current section and plan of the partial pit. The final slope will be 41
degrees in the lower part and 39 degrees in the upper part. The safety factor is legally determined to
be more than 1.3, and the final slope is calculated based on geo-mechanics. This final slope is
sometimes lessened to 36 degrees in the weak parts such as faults, etc.
It should be noted that RTB Bor has a 20-year long-term plan (2007 to 2026) prepared by
the Copper Institute. According to the plan, stripping will be increased after 2007, and the stripping
ratio will be increased to 1.54 by 2011 to compensate for the delayed stripping. Ore production will
be increased to maintain a level of 8.5 million tons after 2010. This would entail increasing
exploited mass 3.5 times from the current 5.7 million tons to 20 million tons. To achieve this, it is
necessary to prepare mining machines including maintenance of current machines. The internal rate
Fig.4.13 Final Pit Design of the Veliki Krivelj (source: RTB Bor)
Fig.4.14 Comparison of Current and Plan Section of the Pit (source: RTB Bor)
89
Fig.4.15 Operation Result of the Cerovo Open Pit
kt %
of return is very high, 67%, based on a copper price of $2,940/t.
Waste from the Veliki Krivelj is transported about 1km by dump trucks from benches of
the pit to a crushing plant (Allis Chalmeris Emisa) which crushes waste to an adequate grain size.
After crushing, the waste is transported by belt-conveyors to the Bor open pit where it is dumped by
a stacker into the old pit.
4.1.5 Cerovo Open Pit Mine
The Cerovo open pit is
located approximately 8 km to the
north-east of the Veliki Krivelj
Mine.
The Cerovo Open Pit
Mine began stripping the initial
burden in 1991, and started
production in 1993 when the Bor
open pit stopped operation. The
Cerovo 1 finished its reserve in 2002. Total operation results are shown in Fig.4.15. The mined ore
was sent to a crushing and milling plant (equipped with primary, second and tertiary Allis-Chalmers
crushers) constructed in the 1980s at the mine site, and then transported in pulp form to the flotation
plant of the Bor processing plant. Current remaining reserve may be up to 320 million tons with a
grade of 0.3% Cu and 0.1g/tAu, which are the objective of privatization.
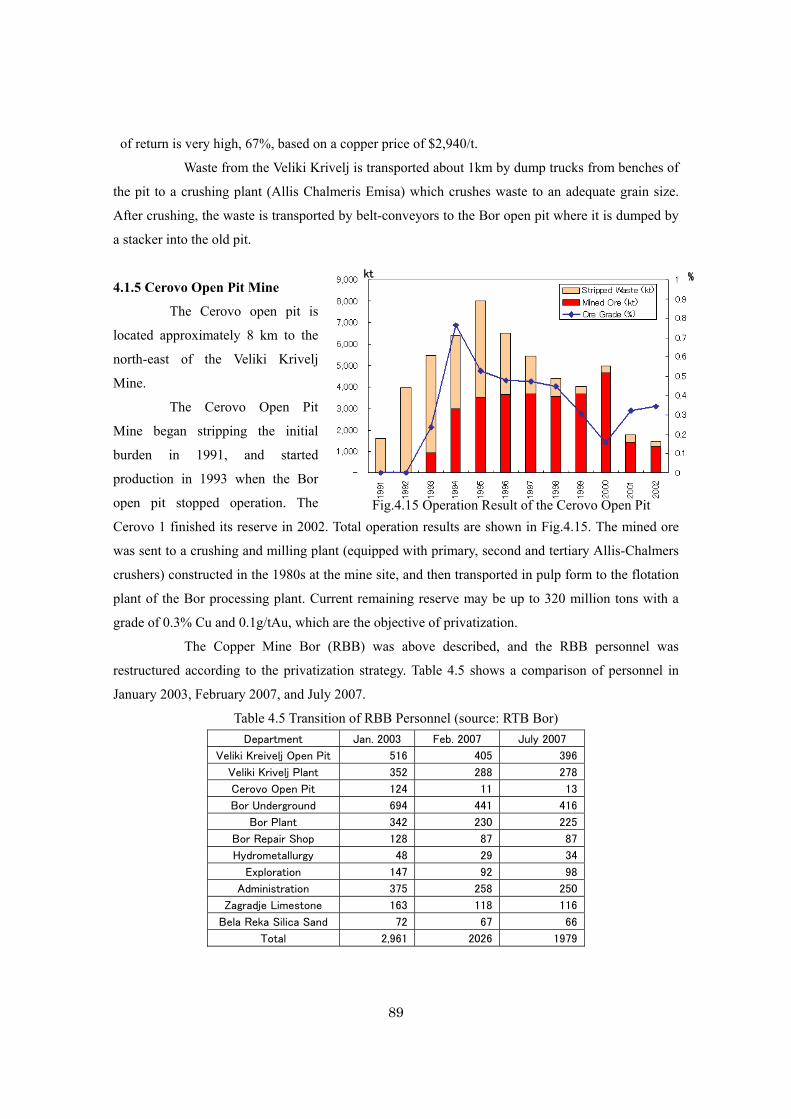
The Copper Mine Bor (RBB) was above described, and the RBB personnel was
restructured according to the privatization strategy. Table 4.5 shows a comparison of personnel in
January 2003, February 2007, and July 2007.
Table 4.5 Transition of RBB Personnel (source: RTB Bor) Department Jan. 2003 Feb. 2007 July 2007
Veliki Kreivelj Open Pit 516 405 396
Veliki Krivelj Plant 352 288 278
Cerovo Open Pit 124 11 13
Bor Underground 694 441 416
Bor Plant 342 230 225
Bor Repair Shop 128 87 87
Hydrometallurgy 48 29 34
Exploration 147 92 98
Administration 375 258 250
Zagradje Limestone 163 118 116
Bela Reka Silica Sand 72 67 66
Total 2,961 2026 1979

90
4.1.6 Slag Mining
Commercial metals from
slag discharged from the Bor smelter
have been recovered for the past
several years by the TIR (see photo).
Mining has been carried out by the
TIR, but the RBB has taken the
opportunity of stopped work in the
underground operation of the Tilva
Ros and P2A to study full open pit
mining operation of slag. And a new
operation plan for slag mining was
submitted to the MEM.
According to the plan, there are a total of 5 five-meter high benches. The elevation of the
pit bottom is 310m and the highest bench elevation is more than 350m. The first 3 benches will be
cut from the access road to the repair shop of the former Bor Open Pit.
The total amount of slag is about 9 million tons with about 66,000t of copper metal,
2,600kg of gold, and 41,000kg of silver. Ore reserves for each bench are listed in Table 4.6.
Table 4.6 Slag to be Mined Benches Slag (t) Cu (%) Cu (t) Au (g/t) Au (kg) Ag (g/t) Ag (kg)
365/350 1,318,973 0.715 9,431 0.28 372.0 4.50 5,935.4
350/340 3,061,392 0.715 21,889 0.28 863.3 4.50 13,776.3
340/332 1,277,730 0.715 9,136 0.28 360.3 4.50 5,749.8
330/330 1,465,830 0.715 10,481 0.28 413.4 4.50 6,596.2
320/320 1,330,959 0.715 9,516 0.28 375.3 4.50 5,989.3
320/310 736,056 0.715 5,623 0.28 207.6 4.50 3,312.3
Total 9,190,940 0.715 65,715 0.28 2,591.8 4.50 41,359.2
Miners for this slag mining will come from both underground mining areas; Tilva Ros and
P2A. A total of 130 workers here and elsewhere will work in mining slag.
Mined slag will be treated through a flotation process, as previous test operations have
shown this to be the best recovery method. Full scale operation of copper slag flotation is estimated
in Table 4.7.
The slag flotation results for January to June 2007 are listed in Table 4.8 and show steadily
increasing treatment amounts. Results for June were more than double those of January. This is
already about 80% of estimated monthly treatment amount, 920,000t (1,112,000t/12months).
Therefore, the monthly treatment amount estimates are expected to be met. Copper recovery has also
improved monthly, and in June achieved a recovery rate of 39.492%. This will be improved to 45%
in the near future, and eventually up to 50%.
Heaped slag to be mined

91
Table 4.7 Estimated Flotation Operation Values Item Estimated value
Annual amount to be treated 1,112,400 t
Cu grade in slag 0.715 %
Au grade in slag 0.282 g/t
Ag grade in slag 4.5 g/t
Concentrate 219,050 t
Cu grade in concentrate 15.0 %
Cu recovery 50.0 %
Cu in concentrate 32,857 t
Au grade in concentrate 5.072 g/t
Au recovery 50.0 %
Au in concentrate 1,296 kg
Ag in concentrate 64.748 g/t
Ag recovery 40.0 %
Ag in concentrate 16,544 kg
Table 4.8 Achieved Slag Flotation Values Month Item Value
Treated Amount
33,258 t
Cu grade 0.739 %
Jan.
Cu recovery 35.34 %
Treated Amount
23,436 t
Cu grade 0.702 %
Feb.
Cu recovery 35.267 %
Treated Amount
32,001 t
Cu grade 0.793 %
Mar.
Cu recovery 35.517 %
Treated Amount
46,407 t
Cu grade 0.737 %
Apr.
Cu recovery 35.777 %
Treated Amount
39,514 t
Cu grade 0.718 %
May
Cu recovery 36.283 %
Treated Amount
70,495 t
Cu grade 0.719 %
Jun.
Cu recovery 39.492 %
The total operating cost is estimated to be US$6.57/t, 1.77/t for mining costs and US$4.8/t
for processing costs. It will be possible to recover the total investment of about US$ 10 million.

92
Fig.4.16 Layout of Main Facility of the RBM
4.1.7 Majdanpek Open Pit Mine
The Majdanpek Mine
(RBM) is located in the City of
Majdanpeck which is 70km from
Bor City. The RBM has two open
pits, South Pit and North Pit, and a
processing plant. The concentrate
is transported to the Bor Smelter
(TIR) by train. The central part of
the city is located in a valley
containing many homes. The main
mine facilities are located along a
line from the central city, to the
North Pit, South Pit and the
mineral processing plant.
Furthermore, the waste dumps of
the North and South pits and
tailings pond are somewhat distant
from the other facilities, which are
fairly close together. The layout of
the main facility of the RBM is
shown in Fig.4.16. An organization
chart of the RBM is shown in Fig.4.17.
COPPER MINE MAJDANPEK
OPEN-PIT MINE
PRODUCTION
MAINTENANCE
CRUSHING
CRUSITING
TRANSPORT SYSTEMS
PRODUCTION
MAINTENANCE
PRODUCTION
MAINTENANCE
FLOTATION
PRODUCTION
MIRRNG
FLOTATION
FILTRATION
TAILINGS
MAINTENANCE
MANAGEMENT
SECTOR for LEGAL AFFAIRS and HUMAN RESOURCES
ACCOUNTINGSECTOR
TECHNICALSECTOR
SECURITY
PRODUCTIONSERVICES
MACHINEWORKSHOP
ELECTRICWORKSHOP
TYRESWORKSHOP
CHEMICALLABORATORY
Fig.4.17 Organization Chart of the RBM (source: RTB Bor)

93
%
Fig.4.18 Operation Result of the Majdanpek Mine
Fig.4.19 Miners in the Majdanpek Mine
It should be noted that during the past 10 years, the population of Bor city has decreased
from 15 000 to 10 000 due to the restructuring of the mine.
The South Pit started stripping in 1959 and production in 1961. The ore processing plant
was constructed by 1961 when the mine began to send the concentrate to the TIR. The Pit was
expanded after that, and annual production reached 13 million tons in 1976, and remained at that
level until 1989. The RBM had been a central player of RTB Bor, accounting for more than half of
its total production since the year after its opening. In 1968, the mine accounted for more than 70%
of total production, and maintained this share until 1982, when the Veliki Krivelj Open Pit was
opened.
The North Pit
recorded the first production in
1989 after it had initiated
stripping in 1977. In 1990, the
pit started full production.
Fig.4.18 shows the production
results of the Majdanpek Mine.
The lead and zinc ore was mined
in the Tenka ore body of the
North Pit for 2 months in 1993
and 3 years beginning in 1999.
After the Veliki Krivelj began
full production, the RBM was RTB
Bor’s leading producer until 1992,
when the United Nations-imposed
economic sanctions severely impacted
the mine. In 1993, the Majdanpek
Mine gave up its top spot to the Veliki
Krivelj Mine. After that the Majdanpek
Mine could not return to its former
production levels, and its production
dropped down to 30% of the peak after
1998 when Western European countries imposed their own economic sanctions. Furthermore, its
annual production decreased dramatically to about 540 000 tons in 2001. In 2006, production
slightly recovered to 1.3 million tons, but it was far from its former level. The number of RBM
workers had decreased as production decreased, as shown in Fig.4.19. In 2002, the RBM carried out
a drastic restructuring by laying off 1,370 workers, about half of the total workers. Despite this

94
action, however, operating efficiency dropped considerably. For example, the mine has maintained
its three-shift system, but the first shift is now working only in preparation, not in production.
According to the privatization strategy, the total number of workers will be reduced to 950 in 2007.
The top point of the South Pit is 670m and its bottom is 120m above sea level. The summit
of the North Pit is 790m and its bottom is 350m. The main ore mineral is porphyry copper in both
pits, but the North Pit includes some multi-complex ore deposits as well..
The bottom of the South Pit is currently 80m under water, for it stopped pumping-up water
from rain-fall and seepage of groundwater in March 2002 due to the confusion arising from the
decreased production and worker lay-offs mentioned above. Total accumulated water is estimated
to be 7.5 million m3 (Fig.4.20). Water quality is pH6, and it can be legally discharged into the river.
The North Pit also stopped water-lifting in September 2002, but it lifted water temporarily for 2
months in 2004, and for 7 months in 2005. As it has not pumped up water since then, it has plenty
of water, 80m in depth, and 3.5 million m3 in volume. Water quality is pH3.5 and it contains
dissolved Fe. As of February 2007, the RBM had no plan to lift accumulated water.
The main reason for decreased production is the superannuation of mining machines, just
like at the Veliki Krivelj Mine. The current main mining machines are listed in Table 4.9. There are
some very old machines and some machines are rarely used.
Table 4.10 shows a comparison of exploited mass from 1977 to 1989, and from 2003 to
2006 at the South Pit. The earlier years (1977 to 1989) were a comparatively good period of
operation, while the later years (2003 to 2006) were considerably less favorable.
Fig.4.20 Design and Current State of the South Pit

95
Table 4.9 Principal Machines in the Majdanpek Open Pit (source: RTB Bor) Type of machine
Model Manufacturer Yr. purchased.
Note
BE 9 Bucyrus Erie 1983 Drill
BE 10 Bucyrus Erie 1987 DXL 850 Ingersoll Rand 不明
Compressor XA 350J Atlas Copco 1989 182 M Marion 1966 M-8 Marion 1977 Shovel M-11 Marion 1986
630 E(170t) Dresser 1990 630 E (170t) Dresser 1991 630 E (170t) Dresser 1991 3600 B (170t) Terex 1997
Dump Truck
R-65 (65t) Terex 不明 Bulldozer TG 220 CK Oktober 2004 Grader G-8 Caterpillar 2001 Unworkable
Table 4.10 Comparison of Exploited Mass in the South Pit Period Mined ore Stripped waste Total mass Stripping ratio
1977 to 1989 164,933,812t 358,684,295t 523,618,107t 2.17
Annual average 12,687,216t 27,591,100t 40,278,316t 2.17
2003 to 2006 3,500,200t 2,667,000t 6,167,200t 0.76
Annual average 875,050t 666,750t 1,541,800t 0.76
Annual average of exploited mass fell approximately 76%, and average stripped waste
decreased by about 98%. Accordingly, the stripping ratio decreased to about one third, from 2.76 to
0.76. This clearly indicates delayed stripping. Waste had been transported by belt conveyers in the
North Pit, but these belt conveyers broke down in 2002 and have been out of service since then in
the South Pit. Unlike the RBB, the RBM has not introduced IT, so the past operation data is not used
efficiently. It is easy to understand the bad state of production merely by seeing the bad condition of
the local roads. Table 4.11 shows a comparison of exploited mass from 1990-2000 and from
2003-2006 at the North Pit. Table 4.11 Comparison of Exploited Mass in the North Pit
Period Mined ore Stripped waste Total mass Stripping ratio
1990 to 2000 31,609,186t 98,987,692t 130,596,878t 3.13
Annual average 2,873,562t 8,998,881t 11,872,443t 3.13
2003 to 2006 752,800t 1,166,000t 1,918,800t 1.55
Annual average 188,200t 291,500t 479,700t 1.55
The annual average of exploited mass decreased approximately 99%, as did average
stripped waste. Accordingly, the stripping ratio decreased to less than half, from 3.13 to 1.55. This
clearly indicates delayed stripping. All annual operation data are shown in the Appendix.
The RBM made a new long-term (14-year) plan for the South Pit, but there is no plan for
the North Pit. If the RBM is to continue exploiting above the current water level, it will be necessary
to reroute the national road and remove a large mass of waste (approximately 8 million tons), which
will require a considerable amount of investment.

96
Fig.4.21 Production Result of the Veliki Majdan
kt %
4.2 Activities of Middle/Small-Scale Mines in Serbia
Many small/medium-scale mines used to mine lead-zinc, rare metals, and other ores in
Serbia. However, they have been relatively inactive 1991 because of political uncertainty, so plans
were made to privatize all national mines, and some mines have already been privatized. The study
team visited three small/medium-scale mines (the Veliki Majdan, Rudnik and Zajaca mines) to
investigate their current states. The Rudnik and Zajaca are privatized mines.
4.2.1 Veliki Majdan Lead and Zinc Mine
(1) Overview
The headquarters of the Veliki Majdan Mine is located in Ljubovija City (population:
5,000), in the Macva District, about 200km east of Belgrade. The city lies on the border with Croatia,
which is 30m across the River Drina. It was opened as a modern mine in 1934 by an English
company which established the Drina Mining Company for full exploration work with the first drift.
After a period of inactivity, a national company, Zajaca, restarted exploration in 1940, and began
production in 1954. Then it became independent as Veliki Majdan in 1972 but soon joined the Zorka
Sabac Group to send the zinc and pyrite concentrate to Zorka and the lead concentrate to Trepca.
Operations were modernized in 1978 with expanded processing of 12,000t/year in crushing and
6,000t/year in flotation. Plans also called for flotation capacity to be increased up to 12,000t/year,
but these were not materialized due to financial issues. Management was taken over by Trepca in
1996. The Veliki Majdan
Mine became independent in
2003, then it was privatized
in September 2006 and
management was taken over
by the Swiss company
“Minero”. Fig.4.21 shows
production results from 1985
to 2001, and in 2001 the
mine stopped production.
The mine operated 5 days per week, with 2 shifts per day in mining and 3 shifts per day in ore
processing. The mine had been operating normally until 1992, but production in 1993 to 1994
dropped to one third due to the economic sanctions imposed by the United Nations. Production
recovered steadily after the sanctions were lifted, but it again dropped to one third in 2000, due to the
economic sanctions imposed by Western European countries in 1999. The mine continued to operate
under difficult conditions, but finally stopped operations in June 2001 when heavy rains ruptured its
tailings dam. Furthermore, the mine could no longer keep pumping water up from the underground

97
in 2003 (Fig.4.22). After privatization in December 2006, the mine restarted dewatering. Trepca gave
up management rights to the mine due to these and political issues. Currently, there are only 5 mine
staff: 3 executives (including the female president) and 2 engineers.
In the past, the mine used to be a supplier of concentrate to the parent company, and had
financial support from Zorka or Trepca when the metal price was low. Accordingly, these parent
companies had large impacts on the mine.
Current issues associated with reopening the mine are a) pumping up water from the drifts
160m under water, b) restoring the damaged tailings dam, c) hiring experienced workers because all
previous workers were fired, and d) repairing or replacing the many machines for mining and
ore-processing that had been abandoned for a long time. The mine estimates that it will take one
million euros to restart operation in September 2007. However, as of February 2007, no detailed plan
had been formulated, and many problems still remain.
In 2003, the mine began intermittently lifting water; however, the current volume of water
to be lifted is estimated to be more than 100,000 m3, so the mine began lifting water continuously in
December 2006 after privatization. Underground water has a pH of 6.0, and is allowed to flow out to
the valley. There is little water in the valley before it joins with the River Drina, so some
environmental impact has likely occurred. However, there has not been any social trouble owing to
the sparse population of the area.
In 2000, there were 133 workers in all (including 60 for mining and processing), and the
mine’s production was only 14% of the peak when there were 300 to 350 workers. It is estimated
that there will be fewer than 200 workers when the mine is reopened. Currently, there are only 18
workers: 9 who are contracted for lifting water, and 9 guards for security.
(2) Mining
Fig.4.22 Schematic Diagram of the Veliki Majdan Underground Mine
Underground main levels are developed horizontally at each 40 meters of depth, and all
deposits are accessible. There are 14 main horizontal levels, and the main adit is located 270m above
the sea. Currently, all 6 mining levels are below 270mL. All of the old stopes above 270mL are no

98
longer being mined.
The mine used to be operated 5 days a week with 2 shifts a day for mining, and 3 shifts a
day for processing. Annual production was about 40,000 to 50,000 t from 1973 to 1989, when the
mine was being operated normally.
The volume of sump water in the underground is 15 liters a second (1,296m3 a day), and
there are 2 lines in dewatering: 40mL to 270mL via 120mL, and 200mL to 270mL. Currently the
mine is pumping up water at the rate of 25 liters a second (2,160m3 a day).
All workers walked to stopes from the adit, and ore and waste were lifted by an inclined
railway (angle: 34 degrees) which was connected with each horizontal level. Ore and waste were
lifted to the 270 mL where they were transported by electric locomotives to the processing plant and
waste dump, respectively, on the surface.
Ore deposits in the mine were generally small (approximately 200m2 at maximum), and
irregular in shape.
The main mining method was room and pillar. In some large deposits, mining heights
could reach up to 40 m, which was the interval between main levels. Waste was picked out of mined ore in the underground before the ore was transported to
the surface to prevent ore dilution.
Ore grain in the milling process was 60% under 60μ. Ore recovery was about 90% for
lead and 82% for zinc. Filtration results were also good, with water content of 7% in the lead
concentrate and 9% in the zinc concentrate.
Awareness of the need for improvement is probably not so high, because the mine used to
be supported by the parent companies.
From the viewpoint of operation efficiency, the potential for mechanization may be limited due
to the small size and irregular shapes of the ore bodies. Mine officials think that 45,000t/year may be
an achievable operating scale when the mine is reopened.
4.2.2 Rudnik Poly-Metal Mine
(1) Overview
The mine is located in Rudnik Village
(population: about 2,000), Gornji Milanovac,
Sumadija District, approximately 110 km south of
Belgrade. This was the first privatized mine
which was bought by Contango (director: Mr.
Darko Vukobratovic) in a public auction held in
September 2004. Contango bought 70% stock of
the company, and the other 30% was given to Mine office located in Rudnik Village
99
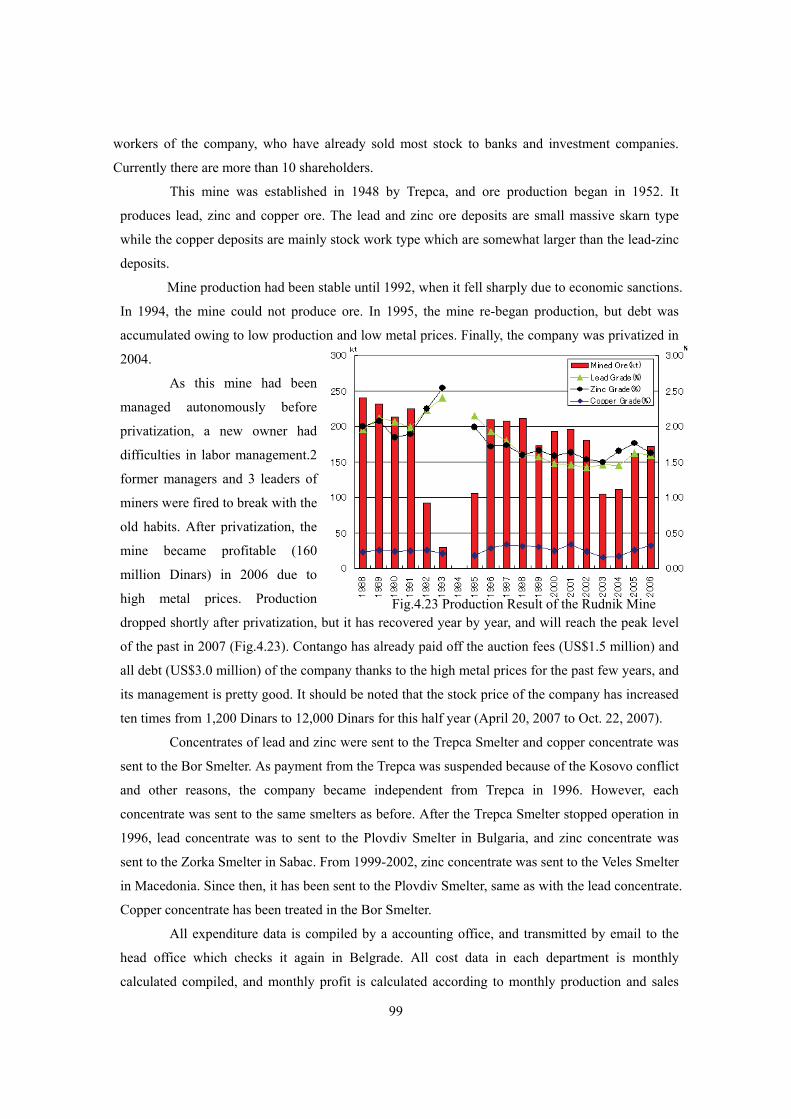
Fig.4.23 Production Result of the Rudnik Mine
workers of the company, who have already sold most stock to banks and investment companies.
Currently there are more than 10 shareholders.
This mine was established in 1948 by Trepca, and ore production began in 1952. It
produces lead, zinc and copper ore. The lead and zinc ore deposits are small massive skarn type
while the copper deposits are mainly stock work type which are somewhat larger than the lead-zinc
deposits.
Mine production had been stable until 1992, when it fell sharply due to economic sanctions.
In 1994, the mine could not produce ore. In 1995, the mine re-began production, but debt was
accumulated owing to low production and low metal prices. Finally, the company was privatized in
2004.
As this mine had been
managed autonomously before
privatization, a new owner had
difficulties in labor management.2
former managers and 3 leaders of
miners were fired to break with the
old habits. After privatization, the
mine became profitable (160
million Dinars) in 2006 due to
high metal prices. Production
dropped shortly after privatization, but it has recovered year by year, and will reach the peak level
of the past in 2007 (Fig.4.23). Contango has already paid off the auction fees (US$1.5 million) and
all debt (US$3.0 million) of the company thanks to the high metal prices for the past few years, and
its management is pretty good. It should be noted that the stock price of the company has increased
ten times from 1,200 Dinars to 12,000 Dinars for this half year (April 20, 2007 to Oct. 22, 2007).
Concentrates of lead and zinc were sent to the Trepca Smelter and copper concentrate was
sent to the Bor Smelter. As payment from the Trepca was suspended because of the Kosovo conflict
and other reasons, the company became independent from Trepca in 1996. However, each
concentrate was sent to the same smelters as before. After the Trepca Smelter stopped operation in
1996, lead concentrate was to sent to the Plovdiv Smelter in Bulgaria, and zinc concentrate was
sent to the Zorka Smelter in Sabac. From 1999-2002, zinc concentrate was sent to the Veles Smelter
in Macedonia. Since then, it has been sent to the Plovdiv Smelter, same as with the lead concentrate.
Copper concentrate has been treated in the Bor Smelter.
All expenditure data is compiled by a accounting office, and transmitted by email to the
head office which checks it again in Belgrade. All cost data in each department is monthly
calculated compiled, and monthly profit is calculated according to monthly production and sales

100
price of concentrates.
(2) Mining
The underground structure of the mine is comparatively simple, consisting of three
horizontal levels: 725m above sea-level (0mL); the main entrance level, 675m above sea-level
(-50mL) and the haulage level 575m above sea-level (-150mL). The mining areas are separated
vertically into 2 parts, the Srednji Sturac area (0mL to -50mL) and Gusavi Potok area (-50mL to
-150mL). Almost the same volume of ore is produced from these two areas.
The mining method of the mine is descending “Room and Pillars”. Each small ore-body
prepares one stope, but large ore-bodies are separated vertically into 2 or 3 portions. Each portion is
mined from top down by “Room and Pillars”. There are 14 stopes in the Srednji Sturac area and 11
stopes in the Gusavi Potok area.
Total amount of the sulfide orebody, P2, beneath the oxide ore is about 800,000t which lies
near the surface. The oxide ore has been tested by the Ore Processing Department of the mine.
However, the mine gave up exploitation of the oxide ore due to its low recovery rate. Currently, the
mine is preparing the sulfide orebody just beneath this oxide ore by the underground method. Drift
has a face of 3.5m (height) x 3.2m (width) with total length of 200m. As of 2007 October 25, drift
has finished 20m. Also, an orepass with length of 15m will be prepared. Horizontal drift are fully
supported due to its rock bad condition Room and Pillar method, main mining method of the mine, is
not applicable for this orebody, and Cut and Fill method may be adopted.
An exploitation plan for P2 orebody is shown in Fig.4.24.
Fig.4.24 Exploitation Plan for P2 Orebody
One of current problems is a shortage of good workers, and it is notable in the
101
underground. There are 148 currently employed miners, but only 76 miners work in the underground.
Absentees consist of 12 injured miners, 13 miners on vacation and 47 on leaves of absence. One
reason for this phenomenon is that many Macedonian miners sometimes return home temporarily.
The average worker’s wage roughly doubled after privatization. Wages of underground miners are
the highest, at 23,400 Dinars/month and their rate of increase is also the highest, 2.2 times.
Accordingly, mining costs increased by 37% from 890 Dinars/t in 2005 to 1,217 Dinars/t in 2006.
However, inflationary prices of metals could compensate for this increasing cost.
4.2.3 Zajaca Mine
(1) Overview
The Farmakom Ltd. is located in Sabac City (population: 50,000), Macva District, which
is about 200 km west of Belgrade.
The company was established about 20 years ago. Although the core business of the
company is agriculture, it has been gradually expanding and diversifying its operations since its
founding. Currently it is a large (200-million-euro) operation employing a total of 2,000 workers.
The company deals in milk, agricultural products cultivated in greenhouses, and spare
parts for cars, and also runs a metal foundry and a lead smelting business. It bought out the Zajaca
Mining Co. Ltd. in March 2006 to acquire antimony mines
The Zajaca area is rich in metallic minerals with a metallogenic length of 25km (300 to
500m wide) in the NW-SE direction, and many mines have been developed in this area in the last
130 years. There are many nonferrous metal ore deposits such as lead, zinc, tin, and arsenic, as well
as antimony in this area, including in the Veliki Majdan Mine.
Total production of antimony was 140,000t in metal base. Antimony production was begun
after World War 2, and the average annual production was about 2,000t from 1945 to 1990. The
production peak was during 1965 to 1977, when the average annual production was about 3,200t.
Serbia was a leading antimony production country in the world up to the 1980s. In the
latter half of the 1980s, however, antimony prices dropped dramatically due to excess antimony
production, mainly from China.
Trends in antimony prices are shown as follows (Unit: metric tonne):
Antimony price up to 1980: US$6,000/t
Antimony price during 1980 to 1996: US$1,800/t
Antimony price during 1996 to 1998: US$3,500/t
Antimony price during 1998 to 2003: US$2,000/t
Antimony price after 2003: US$6,000/t
The Zajaca Mining Co. Ltd. stopped producing antimony in 1991 due to decreased metal
prices. After that, the company produced lead for car batteries from scrap lead using its smelting

102
facility. Before 2005, the average annual production of lead was 5,000t for 10 years, but production
increased to 6,500t in 2006, and will be 8,000t in 2007. This September, a new technology will be
introduced from Italy and production is planned to be 15,000t in 2008.
(2) Mining Concessions
The Zajaca Mining Co. Ltd. was privatized in March 2006, and its management was
transferred to Farmakon. Since that time, Farmakon has studied reopening mines. They target lead,
zinc, tin, rare earths such as CaF2, and antimony.
Farmakon has many mining concessions, as follows:
In the Zajaca Area
a. Rujevac Concession (Sb, Pb, Zn, and As)
b. Zavorje-Stira Concession (Sb)
c. Brasina Concession (Sb)
d. Dolic Concession (Sb)
e. Kik Concession (Sb)
f. Stolice Concession (Sb)
In the Kopaonik Mountains Area
a. Rajiceva Gora(Pb, Zn, Sb)
Priority is given to reopening the following mines:
1. Rjiceva Gora
2. Rujevac
3. Zavorje-Stira
4. Brasina
This priority was determined by considering the dimensions of ore-bodies, ore grade, and
difficulty of operations after reopening.
Production scale of mines after re-opening for 1. and 2. (number of workers including
mines and processing plants)
1st year production : 40,000t/year (with 40 workers)
after 3rd year: 120,000t/year (with 90 workers)
The filling method will be used as the mining method. The company is currently preparing
documentation to reopen mines with following 2 tasks;
(1) More than 80% of underground facilities are expected to be in bad condition, including
partial collapses.
(2) It will be difficult to hire experienced miners, as the mines have been closed for 20 years.
(3) Clean-up Work at the Zavorje Mine
Zajaca Mining operates three underground mining areas: Turin, Pit 28, and Pit 500 in
Zavorje Mine, which was closed 16 years ago. The main mining areas in the Zavorje Mine have

103
already been mined out, so the current mining targets are located at the end of main deposits which
were not previously mined. Therefore, ore veins are small (1.0 to 1.5m wide), plunges of ore bodies
are comparatively flat (40°~50°), and most veins are irregular in shape.
In Turin, clean-up, supporting, and dewatering work in partially collapsed zones has been
completed in the main haulage level (373mL), and investigation of approximately 350m long
underground drifts is possible. In Pit 500, the drift entrance has been reconstructed, and it is now
possible to enter about 30m into the underground. They will continue to clean up old drifts and
possibly begin development in 2007. For Pit 28, there is currently no plan to clean up the old drifts,
but they are considering the many preparations to be done before production.
The Zavorje Mine used to employ the Sublevel Caving method (Schematic sections show
the Non-support style in Fig. 4.25 and the Support style in Fig.4.26). However, current mining
targets are very small, and the drifting is sufficient to mine these veins.
Fig.4.25 Non-support Style Sublevel Caving Method (source: Zajaca Mine)
Fig. 4.26 Support Style Sublevel Caving Method (source: Zajaca Mine)
Currently clean-up works is progressing in the Zavorje Mine for redevelopment. However,

104
explanation survey is not sufficient in the target areas for redevelopment. For example, geological
recommendation maps are not prepared, so it is likely to be problematic for formulating an
exploitation plan. It is necessary to prepare all necessary geological maps for an exploitation plan.
According to the Serbian Mining Law, some institutes will be selected to design mining
procedures, but there are many restrictions to the adoption of modern mining methods due to the
condition of the ore bodies.
Some mines would like to introduce small diesel machines like the ST1/2 for
transportation, but these would cause a serious ore-dilution problem due to the narrow width of the
veins. Furthermore, reliable ventilation in blind drifts may be a major issue for internal-combustion
engines. Therefore, reliable underground ventilation must first be established. For instance, the old
ventilation network in the mine was shown to the study team, but it may be insufficient for diesel
machines. However, even if several fans were used in blind drifts, closed circuit ventilation might
occur. Careful attention should be paid to prevent a lack of oxygen to the mine. Another serious
problem is how to transport a large diesel machine into the underground. Also, a diesel machine in
the underground would have to be broken down to be transported out of the underground for
periodic overhauls. Moreover, when the ground condition is bad, a lot of support would be
necessary. It would be another issue to employ experienced miners with support skills.
In the overall picture, drifting an LHD tunnel from the surface would have advantages
such as a) transporting diesel machines directly from the surface, b) assuring ventilation directly
from the surface, c) using vehicles to transport timber and miners directly from the surface.
However, it would not be a small investment. So the question is whether ore reserves will be
sufficient to offset the required investment. For instance, the total antimony (Sb) reserves in
Zavorje Mine are 2,058t according to the current ore reserve calculations. If the minable ratio is
assumed to be 50%, the net income might be about US$ 6 million. Taking uncertain underground
factors into account, more ore reserves might be an incentive to invest in LHD drifting. Therefore,
more exploration should be done around the current mining areas to better understand the precise
amount of total ore reserves, and design an LHD drift in the most appropriate location.
4.3 Other Mining Activities
Serbia is rich in mineral resources, and several mining activities besides metal mining are
in operation. Coal mining operation and a limestone quarry are presented here. The study team
investigated the Kostolac Coal Mine belonging to the state-owned EPS, and the Kovilovaca Quarry,
which was privatized in 2003. Current state of these mines and their tasks are reported here.

105
0
50
100
150
200
250
300
1984
1985
1986
1987
1988
1989
1990
1991
1992
1993
1994
1995
1996
1997
1998
1999
2000
2001
2002
2003
2004
2005
2006
Fig. 4.27 Kostolac Mine Production in the Last 20 Years
Pit of the Drmno open pit
4.3.1 Kostolac Coal Mine
Currently, the
Kostolac mine produces
approximately 7 million
tons of coal for 4 billion
kWh/year with a 1,000 Mw
facility. They plan to
increase coal production to
9 million tons/year in the
future to meet increased
electrical demand. Fig. 4.27
shows mine production for
the last 20 years. The mine
suffered less than metal mines under economic sanctions, because the Russian-made spare parts for
mining machines were continuously available. Post-1976 production results are shown in the
Appendix. In Kostolac, there are 2,600 workers employed in coal mines, and 1,000 workers in
electricity generation plants. It should be noted that the mine does not have a privatization plan,
because its production is directly linked to the Serbian people’s lives.
The Thermal Power Plant and “Kostolac” Mine are located in Kostolac, Pozarevac
Municipality in the Branicevo District about 100 km to the east of Belgrade. They are operated by
the state-owned company, EPS. The mining cost is €7- 8 /t and the mine runs profitably.
The Kostolac Mine started coal production in 1870, and changed the local economy
drastically. The first mine was an underground mine called “Stari Kostolac” The second underground
mine, “Klenovinik”, was opened in 1885. These underground mines were closed in the 1960s, when
a third underground mine, “Cirikovac”, was opened and continued operating for 18 years. The open
pit “Kostolac” was opened as the first Serbian open pit mine in 1943. 5 years later, the first Serbian
thermal plant was constructed (8MW), and operated with coal produced in the mine. The plant
expanded continuously for next 10 years, and open pit “Cirikovac” began operation in 1980. Also,
the open pit “Drmno” was opened in April 1987.
Currently at the Kostolac Mine, there are 3
open pits, Drmno (mining area: 2.5 km × 5.0 km),
Cirikovac (1.5 km × 2.0 km), and Klenovnik (0.8 km
× 1.0 km).
In the Drmno pit, stripping is carried out
with draglines, and coal is mined with 4 continuous
excavators and transported directly to the plants by

106
Pumped up water for the Drmno Pit
0
200
400
600
800
1000
1200
2003
2004
2005
2006
Fig. 4.28 Kovilovaca Production
2-meter wide belt-conveyors.
The pit bottom of Drmno Pit is located 50 to 80m
under the water level of the Danube River, which is
about 500m from the pit. Therefore, the pit
continuously operates dewatering with 200 wells.
Two tons of water must be dewatered for every 1 ton
of coal. Additional wells are needed to facilitate pit
moving in the future. They expect to drill 40 to 50
new wells for each 500m move of the pit.
Another problem with Drmno Pit is avoiding the nearby Roman ruins known as “Viminacijum” on
the coal layers. 20 million Dinars (about 250,000 Euros) per year will be needed to move most of
the ruins to another location. However, as some ruins cannot be moved, approximately 40 million
tons of coal will be remain unmined.
30 years have already passed since Cirikovac Pit was opened. There are 2 coal layers to be
mined. However, mining has already encroached to within about 700m of a local villagers’ residence
area. Thus, it will be impossible to continue mining without changing the current mining method, so
underground mining may be adopted. The current stripping ratio of this pit is about 7:1, but
dewatering is unnecessary. A total of 900 miners work in this pit.
Klenovnik Pit produces about 150,000t per year with a stripping ratio of 7:1. Mining is
done by dragline, and coal is transported 2km to the plants by train. The reserve is insufficient, and
transportation costs are significant. So, the pit is scheduled to be closed 3 years from now.
Kovilovaca Limestone Quarry
The Kovilovaca Limestone Quarry is located in
Pozarevac Municipality, Branicevo District, about
135km to the east of Belgrade. The quarry was
privatized in 2003, and the quarry owner is former high
school teacher. He has successfully managed the
modernization of the quarry.
The quarry was opened in 1960. Pre-privatization
production data does not exist, so the history of the
condition of the quarry is not known. The current proven
reserve is 21.65 million tons, but the quarry has a vast
concession area, so quarry life is not an issue. Since the
thickness of the overburden waste is about 0.5m, the mining
condition is very good. Limestone is distributed according

107
Classified plant and sedimentation ponds Classified plant and sedimentation ponds
to purity and grain sizes. There are 15 degrees of grain sizes, from very fine to 700 mm in diameter.
Product distribution is separated into 60% for material for asphalt roads, 30% for solvents for US
Steel iron smelting, and 10% for sugar factories. The company has strategic partnerships with US
Steel, such as a 10-year contract to feed limestone, as well as a joint exploration for dolomite.
Annual production trends are shown in Fig.4.28. Production has drastically increased since
privatization through several management efforts, such as renovation of machines and introduction
of an efficiency wage system. In 2007, production is expected to increase to 1.5 million tons.
The number of workers was reduced from 68 to 40 due to weak morale and lack of
working skills. However, based on the efficiency
wage system, good wages are paid to workers who
achieve satisfactory results. The current workers
have been increased to 73 to allow for 3 work shifts
for increased production. The owner maintains a
stable relationship with his clients by providing
superior quality and reliable delivery of orders.
Currently, the company is facing
environmental problems. Foremost, muddy water produced in the purification process is sent to 7
sedimentation ponds. Also, noise during night operations since changing to a 3-shift system in 2006
is impacting on residents near the quarry. A fence will be constructed around the quarry to reduce
noise. Also, water spray is used to prevent dust in summer.
Contractor Co. is in charge of designing of the quarry, which has 3 20-meter benches. The
quarry is operated as a standard open pit system. It should be noted that there are 59 authorized
non-metal mines (as shown in the Appendix), but almost the same number of mines are operating
without licenses. This is an urgent issue for the MEM.
4.4 Smelting Activities
4.4.1 Overview of the Copper Industry in Serbia
(1) Import and Export of Copper (Statistical Yearbook of Serbia 2006)
tons/yearExport Import
year 2,003 2,004 2,005 2,003 2,004 2,005Total 39,319 37,788 59,723 20,812 47,897 41,747
Cyplus 1,673 3,809 19,015 824 4,564 19,386Italy 2,526 4,164 7,416
Gemany 4,054 6,040 5,821 950 493 376USA 3,089 4,341 3,695
Romania 1,333 1,746 3,111Bosnia 1,127 1,010 2,084Bulgalia 4,379 23,614 13,077Russia 4,255 4,974 4,312Austria 1,298 1,620 2,366Others 25,517 16,678 18,581 9,106 12,632 2,230

108
Country Location (Name) Capacity Process Type x 1,000 (S); secondary
Albania Kukes (Gjegian) 5 ReverberatoryLac 7 Blast FurnaceRubik 5 Reverberatory
Armenia Alaverdi 7 Reverberatory3 Reverberatory (S)
Bulgaria Eliseina 14 Blast Furnace (S)Pirdop 190 Outokumpu Flash
Hungary Csepel 4 Reverberatory (S)Italy Porto Marghera 24 Reverberatory (S)Poland Glogow District (Glogow I) 220 Blast Furnace
Glogow District (Glogow II) 205 Outokumpu FlashWroclaw (Hutmen S.A.) 9 Blast Furnace (S)Legnica 93 Blast Furnace
Romania Baia Mare 35 Outokumpu FlashZlatna 10 Reverberatory (S)Zlatna 40 Outokumpu FlashZlatna 13 Reverberatory
Serbia Bor 170 ReverberatorySlovakia Krompachy 20 Reverberatory (S)Turkey Samsun 42 Outokumpu Flash
(2) Production by TIR Bor
According to a report from Bor, in 2004 they sold 3,584 tons of cathode and 1,214 tons of
wire and foundry products in Serbia, and 3,800 tons of cathode and 1,337 tons of wire and foundry
products overseas.
In the 1980’s, production of the Bor smelter reached 150,000 t/y and approximately 70%
of this production was supplied to fabricators in Yugoslavia.
(3) Copper Industry in the Balkans
1) Copper Mines
Total copper concentrate quantity 11,129,000 tons
Assuming the copper content in concentrate to be 25%, the net copper quantity is 282,000 tons
2) Copper Smelters
Total 1,032,000 tons
In the Balkans, the total copper quantity is 282,000 tons, meaning that there is relatively
little copper concentrate in this area.
Baia Mare and Zlata in Romania have been converted into secondary smelters using scrap
as the raw material.
Year 2003 2004 2005Cathode 14,000 12,000 31,000

109
4.4.2 Operation at the TIR Bor
Features of the RTB Bor and TIR Bor are as follows;
1) Copper content in concentrate from RTB Bor is low and the concentrate cannot be sold in the
international market when its copper content is 20% or less. Therefore, RTB Bor needs to have
its own smelter.
2) The production at TIR Bor is essentially based on raw materials from Bor mines and imported
concentrate is used to maintain the copper content in charged concentrate at 20% Cu.
Although there is no problem with using up to 28% Cu at the smelter, operations are carried out
with the minimum amount of imported concentrate.
3) Before economic sanctions were imposed in 1990, there were fabrication plants in Serbia that
used electrolytic copper as a raw material and approximately 100,000 t/y electrolytic copper was
consumed locally in Yugoslavia. At present, the domestic fabrication in Serbia is approximately
20,000 t/y, and all fabrication plants except RTB Bor are privatized.
4) Because purchases of imported concentrate and sales of electrolytic copper are entrusted to East
Point Co., Ltd. of Cyprus, electrolytic copper produced by TIR Bor is not given priority for
domestic sales.
5) The theoretically calculated copper recovery rate of TIR Bor is about 93%, which is lower than
the contract recovery rate of 95%.
6) The cut-off grade (for trading) of gold and silver in copper concentrate is 1g/t gold and 30g/t
silver and they, unlike copper, are producing a profit. However, RC (refining charges) are not
taken into account.
7) The sales price of sulfuric acid is now 0.5 euros per ton, meaning the more that is produced, the
less profit there will be. When fixing SO2 as sulfuric acid for pollution prevention, it must be
considered as a pollution control cost. (In the following study, it is not considered in the
operating costs for copper production.)
(1) Organization
1) Organization of the RTB
The organization of the RTB Bor is as follows;
Fig.4.29 Organization of the RTB Bor
RTB Bor is a holding company and under 100% control of the government. RTB Bor has a
marketing section and other companies under it as production and fabrication companies.

110
This marketing section is importing copper concentrate and selling cathode through East Point Co.,
Ltd. of Cyprus. Further, the invoice price of copper concentrate produced from the Bor Mine is
based on the international market price for the past 2 to 3 years. For reference, the current price is
US$700/t Cu (31.75 ¢/lb).
The contract recovery rate for copper is based not on a unit but on international trade.
The production of smelters is determined as follows.
• Production of copper concentrate from the Bor Mine (Cu content) From Marketing to Smelter
• Imported copper concentrate required for blending From Smelter to Marketing
2) Organization of the TIR
The organization of the TIR is as follows;
Quality control is already registered for LME electrolytic copper, and some sections have
acquired ISO 9001 (Quality Control). Also, Refinery, Blending control ISO 14000 (Environment
Control) is scheduled after privatization.
Concerning accounting, financial reports are issued yearly and quarterly. A summary of
financial reports for the 3 years is shown in the table below.
Table 4.12 Summary of Financial Reports
Commercial Marking and Investment
Technical development (Development, Finance)Maintenance
Law businessAccounting
Smelter
Acid plant
Refinery
Transport
Energy
Quality, ISO
Information
Accounting
Director Executive director
Production
Fig.4.30 Organization of the TIR

111
Because the profit and loss are settled each year, they cannot manage to have
re-investment fund. (When invested, it is depreciated.)
There are 3 labor unions at the TIR.
Smelter
Non- Smelter, such as Refinery, Dore, etc.
Union that split from the Refinery union.
(2) Past Production
The Smelter/Refinery of Bor started production in 1961 using one reverberatory furnace.
In 1971, the plant began using 2 reverberatory furnaces and its capacity was expanded to 175,000
tons.
In 1990, the country was in a civil war and with the imposition of international economic
sanctions, production dropped drastically (because they were unable to import spare parts). The
economic sanctions were lifted in 1993 but production has continued to decline.
The greatest copper production from a mine in Serbia (RTB Bor) was 100,000 t/y. The copper
concentrate imported today is mainly from Bulgaria and is handled by East Point Co., Ltd. of
Cyprus.
(3) Operating Costs
The copper production capacity is 160,000 tons but in recent years, the production has
only been 10 to 20% of this capacity. Because of this, the operating costs are becoming high.
We estimated the operating costs based on past operation results.
(4) Estimation of Operating Costs under Full Capacity Operation
We received basic data on operating costs from 1991 to 2006 and calculated operating
costs versus production. Fig.4.32 shows the calculated operating costs (cents/lb) by production
amount.
Fig.4.31 Past Production
Fig.4.32 Operating Cost by production

112
At 165,000 t/y production, the direct operating cost is 6.9¢/lb. The minimum production to
have a profit under current concentrate purchase price of 31.75 ¢/lb is 19,500 t/y. However, this is
on a direct cost basis and this minimum production quantity will increase when indirect costs are
included. (For example, when a desulfurization plant and wastewater treatment facilities are installed
for pollution control, approx. 1.5 ¢/lb has to be added to this operating cost. Total 8.4 ¢/lb)
The graph below shows the average operating costs of smelters in the world, comparing
operating cost of the Bor.
The operating costs of Bor will be the cheapest in the world if the plant is operated at full
capacity. However, this calculation is based on the actual costs in 2005.
Electric power 0.3C/kwh
Fuel 120US$/t
Labor cost US$5,000 per man per year
These costs are low compared to international level and will likely increases the economy grows.
Thus, operating costs will likely rise in the future.
(5) Quality of Copper Concentrate
Smelter operation is based on the quantity of concentrate. A large portion of cost derives
from the quantity of the concentrate. When the copper content in this concentrate is low, the
production cost based on copper quantity becomes high. The quality of concentrate used at RTB Bor
is quite low compared to the average world concentrate of 28%. Copper, silver and gold content in
concentrate from the mines of RTB Bor is as tabulated below.
BOR 10~12 % Cu 12~18g/t Au 150~350 g/t Ag
Veliki Krivelj 16~22 % Cu 50~200g/t Au 600~1500 g/t Ag
Majdanpek 10~16 % Cu 4~7g/t Au 30~60 g/t Ag
International trading of copper concentrate is normally with Cu 20% or higher. The copper
content in concentrate of BOR is lower than this international trading quality. Therefore, it is
difficult to sell copper concentrate from RTB Bor mine on the international market so RTB Bor
needs to have a smelter of its own. It is an important task for the TIR Bor and indispensable for cost
cutting to improve the floatation process in order to produce copper concentrate with a copper
content of at least 20%.
Fig.4.33 Operating Cost for
Smelting and Refining

113
CuncentateCombined TC/RC TC RC Cu recoveryCu % C/lb C/lb C/lb Contract %
TC $/t 100 10 60.4 50.4 10.0 90.0RC C/lb 10 15 42.4 32.4 10.0 93.3
20 33.9 23.9 10.0 95.028 26.8 16.8 10.0 96.4
TC $/t 90 10 54.4 45.4 9.0 90.0RC C/lb 9 15 38.2 29.2 9.0 93.3
20 30.5 21.5 9.0 95.028 24.1 15.1 9.0 96.4
TC $/t 80 10 48.3 40.3 8.0 90.0RC C/lb 8 15 33.9 25.9 8.0 93.3
20 27.1 19.1 8.0 95.028 21.4 13.4 8.0 96.4
TC $/t 70 10 42.3 35.3 7.0 90.0RC C/lb 7 15 29.7 22.7 7.0 93.3
20 23.7 16.7 7.0 95.028 18.8 11.8 7.0 96.4
TC $/t 60 10 36.2 30.2 6.0 90.0RC C/lb 6 15 25.4 19.4 6.0 93.3
20 20.3 14.3 6.0 95.028 16.1 10.1 6.0 96.4
TC $/t 50 10 30.2 25.2 5.0 90.0RC C/lb 5 15 21.2 16.2 5.0 93.3
20 16.9 11.9 5.0 95.028 13.4 8.4 5.0 96.4
Meanwhile, gold and silver are saleable when the content is 1g/t or higher for gold and
30g/t or higher for silver. Silver content in copper concentrate of Majdanpek is 30 to 60 g/t and
when sold outside, silver below 30g/t is not evaluated in the price. Even when it is 60g/t, the
evaluation is only 30g/t.
The copper content in blended concentrate is adjusted to 20 to 22% Cu by blending with
imported concentrate having a higher copper content. However, since 2000, the quality of imported
copper has dropped down to approx. 15%. However, there is some sign of recovery in 2005 with
the use of imported concentrate. Matte grade is within the range of 35% to 45%. Slag is kept at
around the 0.5% level. The figure below shows copper content in copper concentrate, in matte and in
slag.
4.4.3 Copper Smelting/Refining Business
(1) TC/RC and Operating Costs
TC/RC is a processing cost which is borne by the smelter/refinery. Therefore, in order to
have a profit, the total operating costs should be lower than TC/RC.
TC is a unit cost per quantity of concentrate and is expressed as ¢/lb of copper quantity.
Therefore, it varies depending on the copper content in concentrate. The following table shows
conversion values for various concentrations. For example, at TC70$/t, the TC will be 11.8¢/lb with
copper content of 28% but when it is 10%, TC will become 35.3¢/lb as a copper base.
Table 4.13 List for TC/RC
Fig.4.34 Cu Grade Trend of
Concentrate, Matte and Slag

114
Profit is indicated as (TC/RC – production cost). Fig.4.35 shows both TC and TC/RC
together, along with operating costs.
Fig.4.35 Relation between TC/RC and Operating Cost
Past trends in TC/RC are shown in Fig.4.36. The standard for copper content in
concentrate is 28% Cu. According to this figure, TC/RC is changed by LMC prices. TC/RC in the
RTB Bor is unknown, but sale and cost should be managed according to the international standard.
Fig. 4.37 Relation between LME Price and TC/RC
Fig.4.36 Trend of LME Copper Price and TC/RC (US /lb in 2002)

115
There is no specific relationship because it is determined by the supply and demand
conditions of concentrate and the relation between the seller (mining side) and the buyer (smelter
side). However, the maximum was something like 35¢/lb (TC/RC=130/13) and the minimum was
10¢/lb (TC/RC=40/4). Also other sources of smelter profit are described as follows..
(2) Margin Profit/Loss from Copper Recovery
Transactions in copper concentrate are based on the copper content minus 1%. In other
words, if the actual recovery is higher than that, there will be a profit. Profit/loss per % of recovery
is shown in Table 4.14.
Table 4.14 Marginal Profit/Loss from Copper Recovery (at 160,000t/year)
Copper recovery rate at TIR Bor is shown below.
Fig.4.38 Copper Recovery Trend of the TIR Bor
The copper recovery rate has been 93% since 1980. When the copper content in
concentrate is 20%, the contract recovery rate is 95%, meaning there is a loss of about 2%. At a
typical smelter, the copper recovery rate is about 98% so unlike Bor, it is making a profit from
copper recovery. The loss that can be measured is the slag from the reverbertory furnace, which is
estimated to be 2.3%. In order to improve the copper recovery rate, Bor has been dressing the
accumulated reverberatory furnace slag and recovering about 50% copper from the slag since 2001.
It is necessary to investigate in detail the causes of copper loss and take proper measures to maintain
at least the contract recovery rate as soon as possible.
(3) Profit from Sulfuric Acid
Sulfuric acid is produced from sulfur in the copper concentrate but sulfur is not included
in the concentrate price. If it can be sold at a price higher than the operating cost, it will produce a

116
profit. However, sulfuric acid has been in over-supply recently and it is difficult to sell it under
favorable conditions. At present, the operating cost is 20 euros per ton of sulfuric acid while the sales
price is 0.5 euros per ton, meaning the loss is increased when more is produced. Therefore, it is
needed to use sulfuric acid. If it is viable to introduce SXEW method to extract copper from tailings
which is under investigation in this study, it may be linked with a solution of the sulfuric acid
problem. There are 3 sulfuric acid plants but because of the unavailability of spare parts, 2 plants are
not operating.
(4) Profit/Loss from Gold and Silver Recovery
The average grades of Au and Ag in concentrate in the past were 5.5g/t and 36.7g/t,
respectively. Assuming that the cut-off is 1g/t Au and 30g/t Ag, the contract recovery rate will
become 82% Au and 18% Ag. The actual recovery rate is approximately 95% Au and 88% Ag,
meaning there is a profit from this difference in recovery. It is linked with improvement of
management to manage this profit/loss from gold and silver recovery.
4.4.4 Pollution Control Measures
Present status of pollution (with low rate of operation) was studied based on
“ Environment Assessment of RTB Bor Operation, August 2006".
(1) Gas
Gas treatment methods
Roaster Treated in sulfuric acid plant
Reverb. furnace Only dust is recovered in EP.
Converter furnace Sulfuric acid plant
Refining furnace Not treated
Fig.4.39 Gas Flow and Gas Treatment Methods
1) SO2 gas
a. Estimation of exhaust gas from sulfuric acid plant (not operating at full capacity)
Exhaust gas from the acid plant is discharged from a 60m high smokestack (point 4 in
Fig.4.39).

117
Fig.4.40 Emission of SO2 Gas
b. Reverbaratory furnace gas
Table 4.15 Gas Emission from Reverbaratory Furnace
Exhaust gas from the reverbaratory furnace is discharged from a 100m high
smokestack (point 2 in Fig.4.39). SO2 emission standard is 2,000 mg/m3 (as 700ppm)
in EU, and 1,200 mg/m3 (as 420ppm) in Serbia.
2) Dust
The design specifications of electrostatic precipitators for reverberatory furnaces are
100,000Nm3/hr (for 2 furnaces) and an outlet concentration of 0.5 g/Nm3. However, the discharged
concentration is more than twice this value despite the fact that gas flow is half of the design rate.
Fig.4.39 shows the relationship between gas volume and gas density. At present, the operations
involve only 1 furnace and the gas volume is 55,000 Nm3/hr; therefore, under normal operation, the
concentration should be about 0.012 g/Nm3. But the measured figure is 1.23 g/Nm3. This
indicates that maintenance is insufficient.
.
Fig.4.41 Relation between Gas Volume and Gas Density
Further, in terms of copper loss, the copper discharged as dust will become 55,000 Nm3/hr
x 1.23 g/Nm3 x 10% x 24 hours 360 days = 60t/y when the copper concentration in dust is 10%.
At a copper price of $7,000/t, it will become a loss of $420,000/y. It is assumed that the
Gas volume SO2 DustNm3/h % g/Nm3
Roaster 34,211 8.8 0.04Converter 92,905 5.6 0.52Total 127,116 6.5 0.39
Sulfuric acd plantConversion efficiency 95%
S.A plant out 120,760 0.34
Gas volume SO2 DustNm3/h % g/Nm3
Rev. furnace 55,146 0.58 1.23

118
recovery profit will be higher than the maintenance cost. This electrostatic precipitator is
scheduled for repair in September 2007.
3) Other SO2 gas sources
Refining furnace exhaust gases are gas emitted when transporting the molten metal, and
fugitive gas from converter furnace in power plant. These gases are also harmful and give impact to
environment. Therefore, they have to be treated.
Regulation limit Serbia 150 μg/m3 (as 0.053ppm)
EU 125 μg/m3 (as 0.044ppm)
Fig.4.42 Example of SO2 Landing (Near the Bor Smelter)
The municipal government has so far installed ground level concentration meters at 3
locations around the smelter. There is also a concentration meter is installed in the central control
room of the smelter. When the concentration rises above the specified level, the operation rate is
decreased. There are 3 production lines in the sulfuric acid plant but at present, only line #2 is in
operation.
(2) Wastewater
Emission standard and discharged locations are shown in Fig.4.43, and Serbian emission
standards and guideline of the World Bank is listed in Table 4.16.
Fig.4.43 Emission Standard and Discharged locations
Year 1991 1992 1993 1994 1995 1996 1997 1998 1999 2000 2001 2002 2003Smelter production 000t.y 95.8 ? 70 69 70 59.9 59 50 54 45 34 42 18
Rafinate Acid plant TotalEffluent m3/day 80 360 440
PH 1.92Zn g/l 0.16 0.057 0.076As g/l 0.16 0.12 0.127Cu g/l 10 0.07 1.875Cd g/l 0.002Pb g/l 0.0061 0.0087 0.008Fe g/l 0.4 1.18 1.038
S.S g/lHg g/lMn g/lMn g/lCl g/l 0.025
H2SO4 g/l 100 0.54 18.624Total salt g/l
Soluble substance g/l 0.48 1.5 1.315

119
Table 4.16 Serbian Emission Standards and Guideline of the World Bank
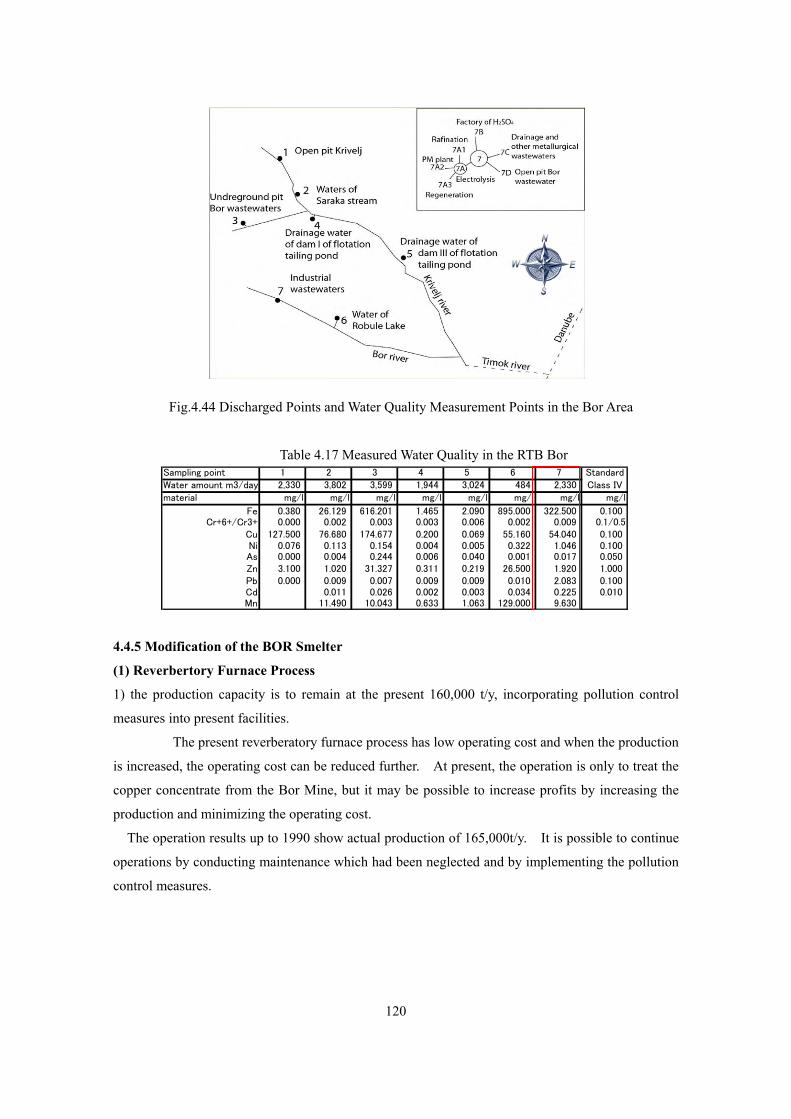
120
Sampling point 1 2 3 4 5 6 7 StandardWater amount m3/day 2,330 3,802 3,599 1,944 3,024 484 2,330 Class IVmaterial mg/l mg/l mg/l mg/l mg/l mg/l mg/l mg/l
Fe 0.380 26.129 616.201 1.465 2.090 895.000 322.500 0.100Cr+6+/Cr3+ 0.000 0.002 0.003 0.003 0.006 0.002 0.009 0.1/0.5
Cu 127.500 76.680 174.677 0.200 0.069 55.160 54.040 0.100Ni 0.076 0.113 0.154 0.004 0.005 0.322 1.046 0.100As 0.000 0.004 0.244 0.006 0.040 0.001 0.017 0.050Zn 3.100 1.020 31.327 0.311 0.219 26.500 1.920 1.000Pb 0.000 0.009 0.007 0.009 0.009 0.010 2.083 0.100Cd 0.011 0.026 0.002 0.003 0.034 0.225 0.010Mn 11.490 10.043 0.633 1.063 129.000 9.630
Fig.4.44 Discharged Points and Water Quality Measurement Points in the Bor Area
Table 4.17 Measured Water Quality in the RTB Bor
4.4.5 Modification of the BOR Smelter
(1) Reverbertory Furnace Process
1) the production capacity is to remain at the present 160,000 t/y, incorporating pollution control
measures into present facilities.
The present reverberatory furnace process has low operating cost and when the production
is increased, the operating cost can be reduced further. At present, the operation is only to treat the
copper concentrate from the Bor Mine, but it may be possible to increase profits by increasing the
production and minimizing the operating cost.
The operation results up to 1990 show actual production of 165,000t/y. It is possible to continue
operations by conducting maintenance which had been neglected and by implementing the pollution
control measures.
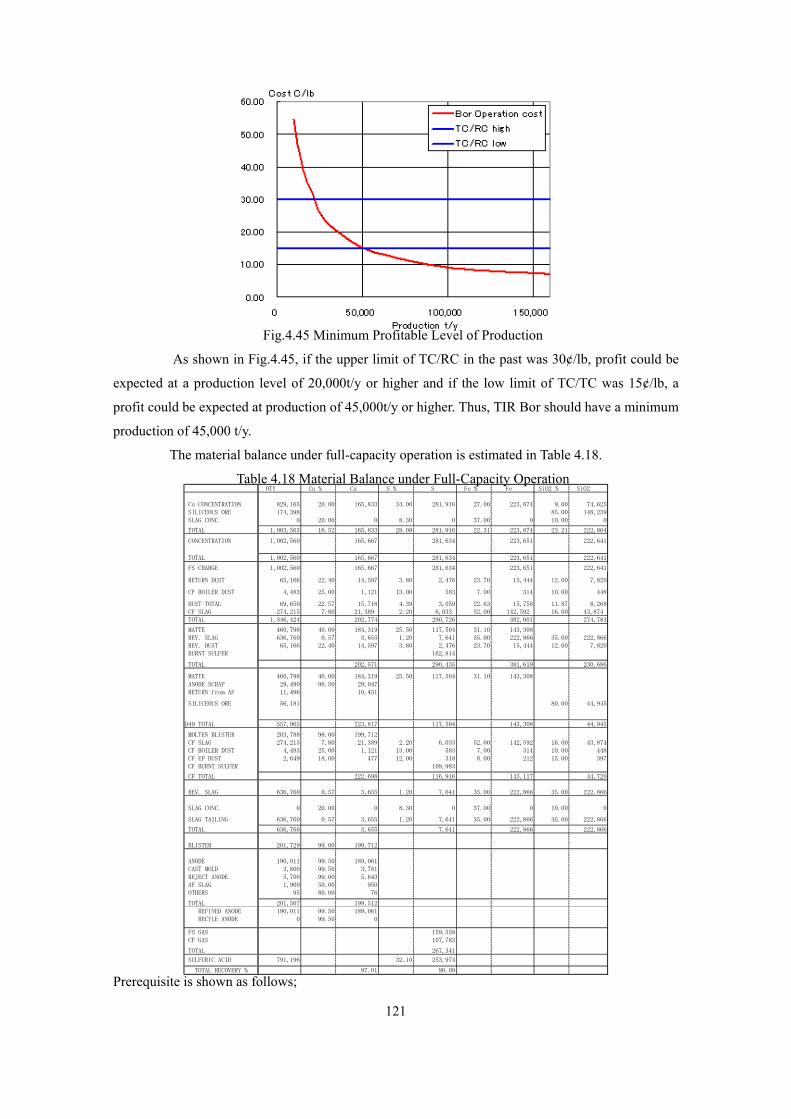
121
OTY Cu % Cu S % S Fe % Fe SiO2 % SiO2
Cu CONCENTRATION 829,165 20.00 165,833 34.00 281,916 27.00 223,874 9.00 74,625 SILICEOUS ORE 174,398 85.00 148,239 SLAG CONC. 0 20.00 0 8.30 0 37.00 0 10.00 0
TOTAL 1,003,563 16.52 165,833 28.09 281,916 22.31 223,874 22.21 222,864
CONCENTRATION 1,002,560 165,667 281,634 223,651 222,641
TOTAL 1,002,560 165,667 281,634 223,651 222,641
FS CHARGE 1,002,560 165,667 281,634 223,651 222,641
RETURN DUST 65,166 22.40 14,597 3.80 2,476 23.70 15,444 12.00 7,820
CF BOILER DUST 4,483 25.00 1,121 13.00 583 7.00 314 10.00 448
DUST TOTAL 69,650 22.57 15,718 4.39 3,059 22.63 15,758 11.87 8,268 CF SLAG 274,215 7.80 21,389 2.20 6,033 52.00 142,592 16.00 43,874 TOTAL 1,346,424 202,774 290,726 382,001 274,783
MATTE 460,798 40.00 184,319 25.50 117,504 31.10 143,308 REV. SLAG 636,760 0.57 3,655 1.20 7,641 35.00 222,866 35.00 222,866 REV. DUST 65,166 22.40 14,597 3.80 2,476 23.70 15,444 12.00 7,820 BURNT SULFER 162,814
TOTAL 202,571 290,435 381,619 230,686
MATTE 460,798 40.00 184,319 25.50 117,504 31.10 143,308 ANODE SCRAP 29,490 98.50 29,047 RETURN from AF 11,496 10,451
SILICEOUS ORE 56,181 80.00 44,945
D49 TOTAL 557,965 223,817 117,504 143,308 44,945
MOLTEN BLISTER 203,788 98.00 199,712 CF SLAG 274,215 7.80 21,389 2.20 6,033 52.00 142,592 16.00 43,874 CF BOILER DUST 4,483 25.00 1,121 13.00 583 7.00 314 10.00 448 CF EP DUST 2,649 18.00 477 12.00 318 8.00 212 15.00 397 CF BURNT SULFER 109,983
CF TOTAL 222,698 116,916 143,117 44,720
REV. SLAG 636,760 0.57 3,655 1.20 7,641 35.00 222,866 35.00 222,866
SLAG CONC. 0 20.00 0 8.30 0 37.00 0 10.00 0
SLAG TAILING 636,760 0.57 3,655 1.20 7,641 35.00 222,866 35.00 222,866
TOTAL 636,760 3,655 7,641 222,866 222,866
BLISTER 201,729 99.00 199,712
ANODE 190,011 99.50 189,061 CAST MOLD 3,800 99.50 3,781 REJECT ANODE 5,700 99.00 5,643 AF SLAG 1,900 50.00 950 OTHERS 95 80.00 76
TOTAL 201,507 199,512 REFINED ANODE 190,011 99.50 189,061 RECYLE ANODE 0 99.50 0
FS GAS 159,558 CF GAS 107,783
TOTAL 267,341
SULFURIC ACID 791,196 32.10 253,974
TOTAL RECOVERY % 97.01 90.09
Fig.4.45 Minimum Profitable Level of Production
As shown in Fig.4.45, if the upper limit of TC/RC in the past was 30¢/lb, profit could be
expected at a production level of 20,000t/y or higher and if the low limit of TC/TC was 15¢/lb, a
profit could be expected at production of 45,000t/y or higher. Thus, TIR Bor should have a minimum
production of 45,000 t/y.
The material balance under full-capacity operation is estimated in Table 4.18.
Table 4.18 Material Balance under Full-Capacity Operation
Prerequisite is shown as follows;

122
• Desulfurization system
The specifications of desulfurization system for 160,000 t/y production are estimated in the
following table.
• Construction cost (Lime/Gypsum process) US$30 million
• Operating cost US$ 2.1 million /y including indirect costs
0.59 ¢/lb as 160,000 t/y copper production
(These are very rough figures.)
• Wastewater treatment system
At present, there is 440m3/day waste water discharge and that at full capacity operation is
assumed to be 530m3/day.
Construction cost (Neutralization + iron coprecipitation process) US$3.5 million
Operating cost US$ 3 million /y including indirect costs
0.85¢/lb as 160,000 t/y copper production
• Grand total for pollution control measures
Construction cost US$33.5 million
Operating cost 1.44 ¢/lb
It should be noted that in the World Bank Report(Environmental Assessment of RTB Bor
Operation, the investment is reported as 63 million euros. This is based on the switch from
reverbertory furnace to electric furnace to minimize gas generation and to do gas desulfurization.
(2) Smelting Process
The copper smelting has a long history, and there are many processes developed. Basically,
the process is divided to two steps, which are primary smelting and converting.
Many types of furnaces are used for primary smelting, but currently in most cases PS
converter is used for converting.
1) The first Step of Copper Smelting
A. Reverberatory Furnace
This furnace is used in RTB Bor.
The huge amount of exhaust gas is generated. And SO2 concentration in the gas is less than
Nm3/hr SO2 % SO2 Nm3/hReverberatory gas 140,872 0.75 1057Sulfuric acid exhaust gas 278,650 0.32 900Total 419,522 0.47 1957
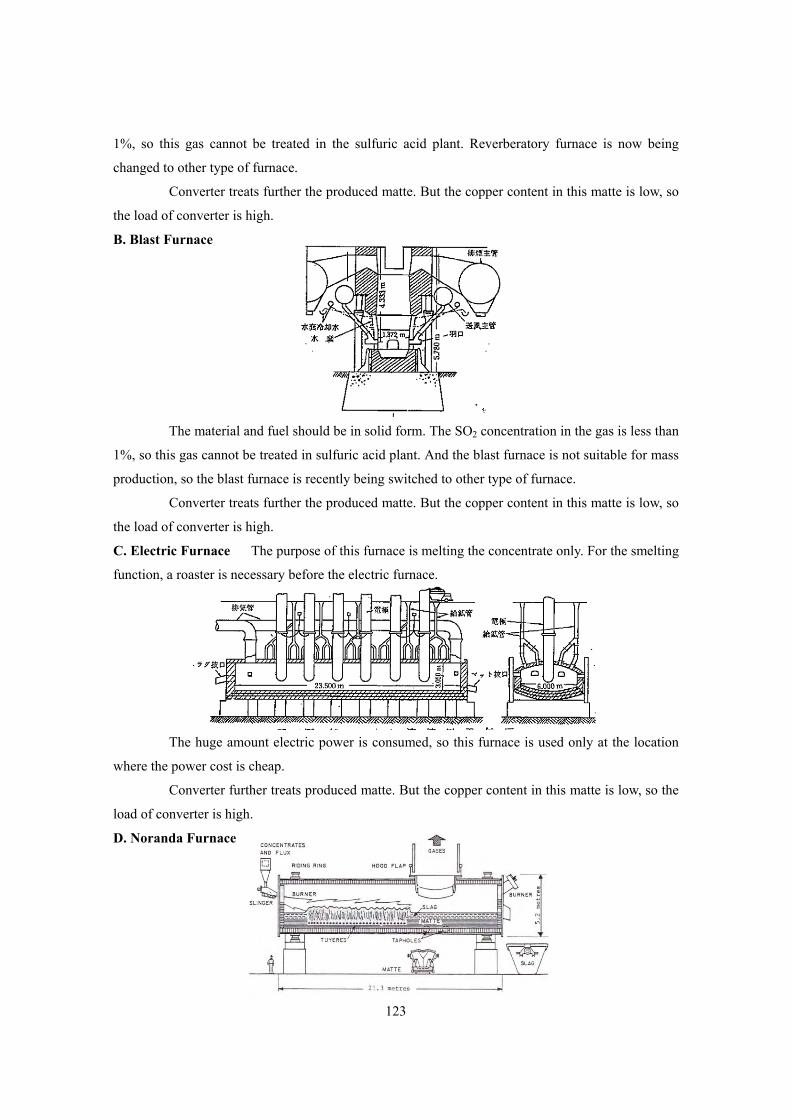
123
1%, so this gas cannot be treated in the sulfuric acid plant. Reverberatory furnace is now being
changed to other type of furnace.
Converter treats further the produced matte. But the copper content in this matte is low, so
the load of converter is high.
B. Blast Furnace
The material and fuel should be in solid form. The SO2 concentration in the gas is less than
1%, so this gas cannot be treated in sulfuric acid plant. And the blast furnace is not suitable for mass
production, so the blast furnace is recently being switched to other type of furnace.
Converter treats further the produced matte. But the copper content in this matte is low, so
the load of converter is high.
C. Electric Furnace The purpose of this furnace is melting the concentrate only. For the smelting
function, a roaster is necessary before the electric furnace.
The huge amount electric power is consumed, so this furnace is used only at the location
where the power cost is cheap.
Converter further treats produced matte. But the copper content in this matte is low, so the
load of converter is high.
D. Noranda Furnace

124
The SO2 concentration in the exhaust gas is high, so this gas can be treated in the double
contact type sulfuric acid plant. (Refer to 5.1.2.3)
Converter further treats produced matte. The copper content in this matte is high, so the
load of converter is low.
E. CMT It is very similar to Noranda furnace.
The SO2 concentration in the exhaust gas is high, so this gas can be treated in the double
contact type sulfuric acid plant.
Converter further treats produced matte. The copper content in this matte is high, so the
load of converter is low.
F. OKO Flash Furnace This furnace is most popular now in the world for primary smelting.
The SO2 concentration in the exhaust gas is high, so this gas can be treated in the double
contact type sulfuric acid plant.
Converter further treats produced matte. The copper content in this matte is high, so the
load of converter is low.
G. INCO Flash Furnace
100% oxygen is used for the blast. The SO2 concentration in the exhaust gas is high, so

125
this gas can be treated in the double contact type sulfuric acid plant.
Converter further treats produced matte. The copper content in this matte is high, so the
load of converter is low.
H. MI Process
This process is operated continuously from the primary smelting to the anode furnace. The
SO2 concentration in the exhaust gas is high, so this gas can be treated in the double contact type
sulfuric acid plant. C-furnace has converting function.
The continuous operation means that no fugitive gas is generated from ladle of molten
matte and blister. MI process is the most environmental friendly at present.
I. ISASMELT furnace(Refer to Fig. 4.46)
The SO2 concentration in the exhaust gas is high, so this gas can be treated in the double
contact type sulfuric acid plant. The copper content in this matte is high, so the load of converter is
low.
J. AUSMELT Furnace It is very similar to ISASMELT.
The SO2 concentration in the exhaust gas is high, so this gas can be treated in the double
contact type sulfuric acid plant. The copper content in this matte is high, so the load of converter is
low.
2) Second Step (Converting)

126
PS converter is most typical furnace for converting. This furnace is used in RTB Bor.
Recently, C-furnace of MI process, Flash converter, ISASMELT and AUSMELT are being
used instead of PS converter for the converting process.
3) Sulfuric Acid Plant
There are tow types, namely, single contact type and double contact type. The SO2 gas in
the smelting gas reacts with oxygen and turns to SO3 at over 410 ℃ condition. This reaction
generates heat. 95% of SO2 turns to SO3. SO3 is absorbed in water and turns to sulfuric acid.
The reaction heat keeps the reaction temperature. If the SO2 concentration in the gas is
too low, the reaction temperature cannot be maintained due to a lack of generated heat. This is called
as a single contact system.
Remaining 90% SO2 gas after absorbing SO3 can react with oxygen again and generates
SO3. This SO3 gas is absorbed in the water and turns to sulfuric acid. This process is called as a
double contact system. Total 99.5 % SO2 gas is removed by the double contact system.
SO2 gas concentration is required to be 4% or more for single contact and 6% or more for
double contact to maintain the reaction temperature without out side heat. In case of 6% SO2
concentration in the material gas, the treated SO2 gas concentration is 3,000ppm by single contact
system sulfuric acid plant and 300ppm SO2.by double contact system sulfuric acid plant. The exhaust
gas from rebervertory furnace contains only 1 % or less SO2, so this gas cannot be treated in the
sulfuric acid plant. The sulfuric acid plant at Bor is a single contact system and the materials are the
exhaust gas from roaster and converter.
The treatment of 1% or less SO2 concentration gas such as reverberatory furnace gas is
done in a desulfurization plant, which fixes SO2 by alkali. .
(3) Implementing a New Copper Smelting Process
Table 4.19 shows a comparison of operating costs among smelting processes. The areas
are divided because the labor cost and energy cost are different in each area.
The smelting cost of reverbertory furnaces is the second highest in all areas following
blast furnaces. At Bor, there is a special situation in that the smelting cost is low because of the
low unit costs of energy and manpower, but as internationalization progresses, there is a likelihood
that smelting costs will increase.

127
Smelting cost C/lb 1993Africa Asia Australia W Europe Latan America N.America
Reverberatory 8.8 25.1 28.2 10 16.6OKO Flash 17.8 5.7 16.4 11.3Inco flash 12.6Noranda 13.6MI 20.1 9.9ISASMELT 12.4 12.6Blast 27.6 39.8Electric 7.6 10.6 23.4Noranda 12.6CMT 9.7
Table 4.19 Comparison of Operating Costs by Smelting Process (direct cost)
1) New Smelting Process
In the new smelting process, the functions of the roasting furnace and reverbertory
furnace of the Bor will be performed by only one furnace. This will eliminate production of
low-concentration SO2 gas from the reverbertory furnace and will allow the use of a double contact
system sulfuric acid plant that requires rich SO2 gas. In this double contact system sulfuric acid
plant, the conversion rate to sulfuric acid can be improved by a single contact system from the
present 95% to approximately 99.5%, thus eliminating the need for a separate desulfurization plant.
The mainstream smelting process has been transitioning from Flash -> MI-> CMT->ISASMELT or
AUSMEL (Fig.4.46).
Fig.4.46 Trends in the Use of the New Smelting Process
The TIR Bor was planning to convert to the new process in 1979, 1990 and 1998, but it
still has not been materialized. Its reason was not known. The large investment needed for this
undertaking requires the approval of RTB Bor, which means government approval. Therefore, it was
guessed that the TIR Bor could not attain the government approval.
2) Example of ISASMELT
a. Process Flowchart is shown in Fig.4.47.

128
Fig.4.47 Flow Sheet of ISASMELT
b. Main operating parameters
Table 4.20 Main Operating Parameters Parameter Rate Unit
Concentrate Rate 160 tph Dry Concentrate Assay 23.8 %Cu Silica Flux 3.4 tph Reverts 1.6 tph Coke Breeze 0.7 tph Natural Gas 706 Nm3/h Lance Air 20,210 Nm3/h Lance Oxygen (95%) 23,580 Nm3/h Lance Oxygen Enrichment 60.8 % Bath Temperature 1172 degC Matte Grade 57.0 %
c. Operating costs
It is reported that this process is the one with lowest operating costs. (Approx. 10¢/lb vs.
BOR Smelter 21.7¢/lb)
Fig.4.48 ISASMELT-years of continuous evolution; July 2005 by P.S.Artur, S.P.Hunt
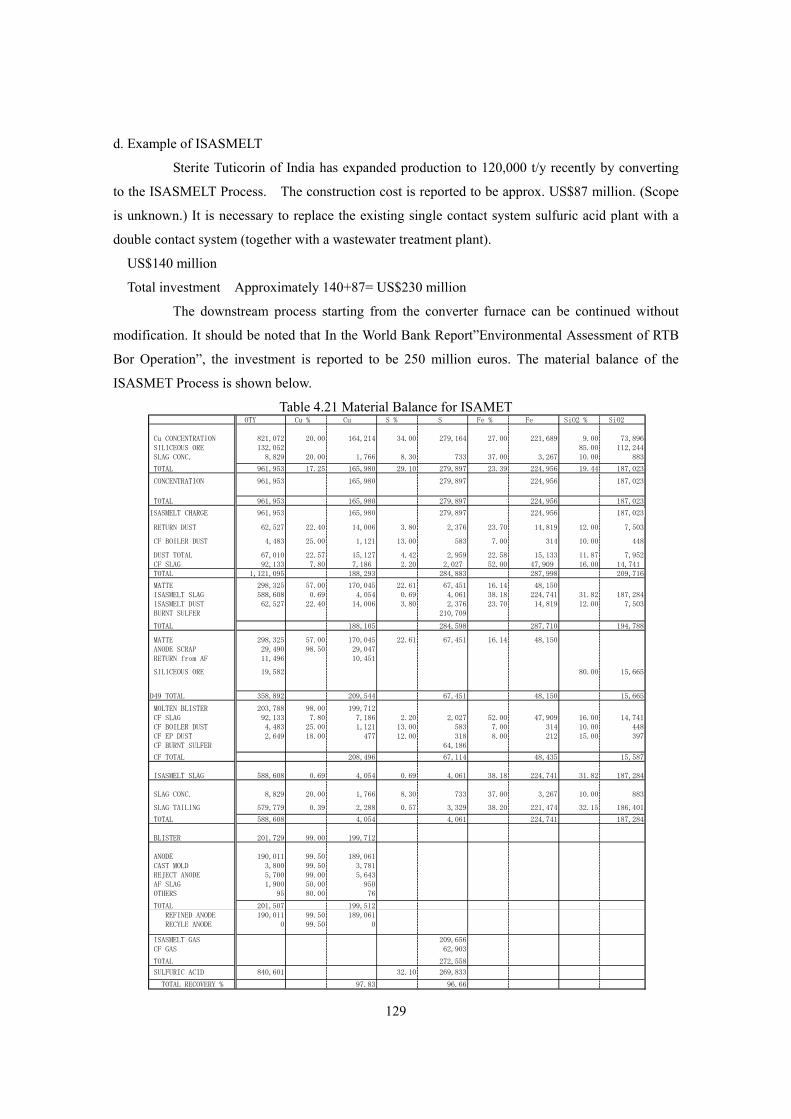
129
OTY Cu % Cu S % S Fe % Fe SiO2 % SiO2
Cu CONCENTRATION 821,072 20.00 164,214 34.00 279,164 27.00 221,689 9.00 73,896 SILICEOUS ORE 132,052 85.00 112,244 SLAG CONC. 8,829 20.00 1,766 8.30 733 37.00 3,267 10.00 883
TOTAL 961,953 17.25 165,980 29.10 279,897 23.39 224,956 19.44 187,023
CONCENTRATION 961,953 165,980 279,897 224,956 187,023
TOTAL 961,953 165,980 279,897 224,956 187,023
ISASMELT CHARGE 961,953 165,980 279,897 224,956 187,023
RETURN DUST 62,527 22.40 14,006 3.80 2,376 23.70 14,819 12.00 7,503
CF BOILER DUST 4,483 25.00 1,121 13.00 583 7.00 314 10.00 448
DUST TOTAL 67,010 22.57 15,127 4.42 2,959 22.58 15,133 11.87 7,952 CF SLAG 92,133 7.80 7,186 2.20 2,027 52.00 47,909 16.00 14,741 TOTAL 1,121,095 188,293 284,883 287,998 209,716
MATTE 298,325 57.00 170,045 22.61 67,451 16.14 48,150 ISASMELT SLAG 588,608 0.69 4,054 0.69 4,061 38.18 224,741 31.82 187,284 ISASMELT DUST 62,527 22.40 14,006 3.80 2,376 23.70 14,819 12.00 7,503 BURNT SULFER 210,709
TOTAL 188,105 284,598 287,710 194,788
MATTE 298,325 57.00 170,045 22.61 67,451 16.14 48,150 ANODE SCRAP 29,490 98.50 29,047 RETURN from AF 11,496 10,451
SILICEOUS ORE 19,582 80.00 15,665
D49 TOTAL 358,892 209,544 67,451 48,150 15,665
MOLTEN BLISTER 203,788 98.00 199,712 CF SLAG 92,133 7.80 7,186 2.20 2,027 52.00 47,909 16.00 14,741 CF BOILER DUST 4,483 25.00 1,121 13.00 583 7.00 314 10.00 448 CF EP DUST 2,649 18.00 477 12.00 318 8.00 212 15.00 397 CF BURNT SULFER 64,186
CF TOTAL 208,496 67,114 48,435 15,587
ISASMELT SLAG 588,608 0.69 4,054 0.69 4,061 38.18 224,741 31.82 187,284
SLAG CONC. 8,829 20.00 1,766 8.30 733 37.00 3,267 10.00 883
SLAG TAILING 579,779 0.39 2,288 0.57 3,329 38.20 221,474 32.15 186,401
TOTAL 588,608 4,054 4,061 224,741 187,284
BLISTER 201,729 99.00 199,712
ANODE 190,011 99.50 189,061 CAST MOLD 3,800 99.50 3,781 REJECT ANODE 5,700 99.00 5,643 AF SLAG 1,900 50.00 950 OTHERS 95 80.00 76
TOTAL 201,507 199,512 REFINED ANODE 190,011 99.50 189,061 RECYLE ANODE 0 99.50 0
ISASMELT GAS 209,656 CF GAS 62,903
TOTAL 272,558
SULFURIC ACID 840,601 32.10 269,833
TOTAL RECOVERY % 97.83 96.66
d. Example of ISASMELT
Sterite Tuticorin of India has expanded production to 120,000 t/y recently by converting
to the ISASMELT Process. The construction cost is reported to be approx. US$87 million. (Scope
is unknown.) It is necessary to replace the existing single contact system sulfuric acid plant with a
double contact system (together with a wastewater treatment plant).
US$140 million
Total investment Approximately 140+87= US$230 million
The downstream process starting from the converter furnace can be continued without
modification. It should be noted that In the World Bank Report”Environmental Assessment of RTB
Bor Operation”, the investment is reported to be 250 million euros. The material balance of the
ISASMET Process is shown below.
Table 4.21 Material Balance for ISAMET

130
4.4.6 Plan for Improving the Program
Assuming privatization, tentative improving program and scheduling is shown as follows;
(1) Countermeasure against Pollution
1) Air Pollution
As a first step, the priority should be given to re-starting of existing sulfuric acid plants
that have been shut down due to lack of spare parts.
At present, Bor has two reverberatory furnaces and one is in operation, but only one
sulfuric acid plant out of three is operated. The gas processing capacity is not in proportion to
production amount of copper, but to the number of reverberatory furnaces in operation. It seems that
the operation of two sulfuric acid plants is necessary. It is very likely that a part of the exhaust gas
(about 5 or 6 % of SO2) from a roaster and from converter is discharged from a stack without being
treated because of lack of capacity of sulfuric acid plant.
The air antipollution measure should be given priority to in terms of time, and it is
necessary therefore to return to the original design capacity of the existing facilities, and to settle the
deficiency of the existing facilities ability.
As a second stage, it is necessary to reduce the SO2 discharge from the smelting facilities
in operation. In the first stage, the lack of capacity of existing facilities should be determined and
decide the remodeling specifications. Based on the current information, the desulfurization
processing objective is mainly the reverberatory furnace exhaust gas (55,146Nm3/hr, 0.58% SO2)
and sulfuric acid plant exhaust gas (120,760Nm3/hr, 0.34% SO2). As for the desulfurization method,
the process that matches the geographical convenience of BOR should be chosen.
Generally, the SO2 removal rate of desuslfurization plant is expected to be around 90%,
therefore, the ground level SO2 concentration can be expected to become 1/10 of that shown in
Fig.4.41 by installation and it can be expected to become lower than EU regulation value. (The
above gas specifications should be decided based on a future rate of operation.)
In the third stage, the establishment of the SO2 removal facilities matched with
remodeling of smelting process is necessary. A long construction period may become necessary in
order to make a decision of the plant capacity, the choice of smelting process, preparation of a large
amount of investment. So, it is desirable to carry out this stage in two steps.
Meanwhile, if the production cost by a reverberatory furnace process does not have a
problem, the reverberatory furnace process may be continued, but in that case, the investment for the
pollution prevention facilities that matches the increase of production capacity is necessary.
2) Effluent
An existing plant has only wastewater treatment facilities for #3 sulfuric acid plant. It is
necessary to expedite the decision on the quantity and the quality of wastewater of sulfuric acid
plants, refinery and others, and it is necessary to start the construction of wastewater treatment
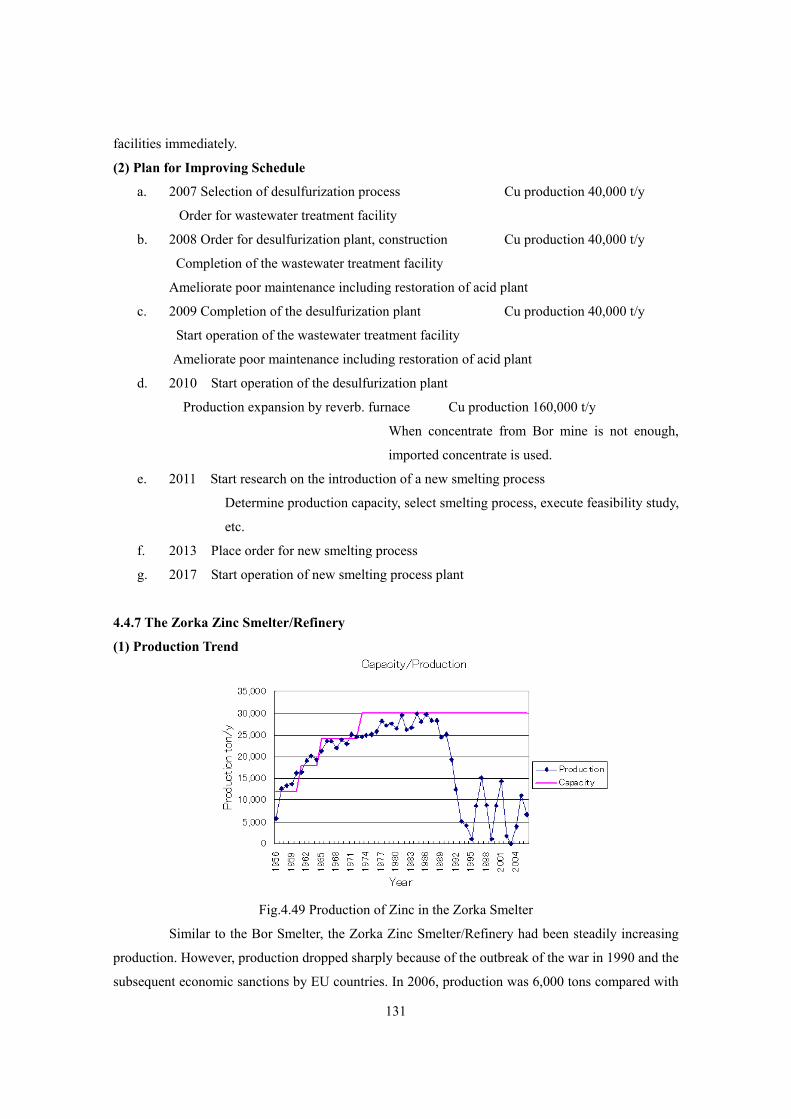
131
facilities immediately. (2) Plan for Improving Schedule
a. 2007 Selection of desulfurization process Cu production 40,000 t/y
Order for wastewater treatment facility
b. 2008 Order for desulfurization plant, construction Cu production 40,000 t/y
Completion of the wastewater treatment facility
Ameliorate poor maintenance including restoration of acid plant
c. 2009 Completion of the desulfurization plant Cu production 40,000 t/y
Start operation of the wastewater treatment facility
Ameliorate poor maintenance including restoration of acid plant
d. 2010 Start operation of the desulfurization plant
Production expansion by reverb. furnace Cu production 160,000 t/y
When concentrate from Bor mine is not enough,
imported concentrate is used.
e. 2011 Start research on the introduction of a new smelting process
Determine production capacity, select smelting process, execute feasibility study,
etc.
f. 2013 Place order for new smelting process
g. 2017 Start operation of new smelting process plant
4.4.7 The Zorka Zinc Smelter/Refinery
(1) Production Trend
Fig.4.49 Production of Zinc in the Zorka Smelter
Similar to the Bor Smelter, the Zorka Zinc Smelter/Refinery had been steadily increasing
production. However, production dropped sharply because of the outbreak of the war in 1990 and the
subsequent economic sanctions by EU countries. In 2006, production was 6,000 tons compared with

132
an annual production capacity of 30,000 tons.
(2) Process
Steam from the roaster boiler is sold to an electric power company. SO2 is sold to a
fertilizer company. The residue treatment system is a jarosite process.
(3) Issues
1) Cannot procure concentrate
2) 10% zinc remains in residue and the zinc recovery rate is 87%.
4.4.8 Current State and Task of Metallurgical Education
In Serbia, metallurgical education is provided at the Faculty of Metallurgy in the
University of Beograd and at Technical Faculty of the University of Beograd in Bor.
Beograd HQ Student capacity 80/year, faculty- 5 years
Professors (including assistant and associate professors) 19 (12 are
women) In 1995, it was a big organization with 55 professors, 29
assistant professors, 27 associate professors, 90 assistants. There are
8,058 graduates.
Bor faculty 3 professors, 3 assistant professors, 0 associate professors,
3 assistants, 5 students
The Technical Faculty in Bor offers 6 courses, namely Mining, Metallurgy, Technology,
Management, Information and Electrotechnique, with 15 professors, 12 assistant professors, 10
associate professors, 19 assistants, and 21 others. Thus there are many instructors, but recently, there
has been much more interest in popular courses like management and there are only a few students
in metallurgy. Thinking of the Bor Smelter in the future, improvement shown in 4.4.6 should be
implemented to recover production, and it would be linked with employment of students and
fosterage of successors. It is necessary to restudy appropriate scale of metallurgical education
(professors, staffs, student), based on the current state smelters (TIR Bor and Sabac) as well as
application fields of metallurgy.
Concentrates
BlendingSteam Power plant
Roater 1 set SO2 gas Sulfuric acid plant
Leaching Jarosite leaching
Elecrolysis Residue
Casting
Zn inngotFig.4.50 Process of the Zorka Smelter