Embed Size (px)
Citation preview

73
CHAPTER 4
ANALYSIS, PRESENTATION AND DESCRIPTION OF THE RESEARCH FINDINGS
4.1 INTRODUCTION
The researcher conducted quantitative, descriptive research to investigate various aspects related to
computer assisted instruction at a particular nursing college. Structured data collection was aimed at
determining:
• how computer assisted instruction was applied at the time of data collection
• the benefits of computer assisted instruction and computer-based learning for the learners
• the problems that the learners encountered during computer-based learning.
The methods of data collection and data analysis have been discussed in chapter three (refer to
section 3.3). In this chapter, the research findings are discussed. The findings were utilised to
formulate recommendations to optimise the utilisation of information communication technologies
and associated educational principles in nursing education.
4.2 RESEARCH RESULTS
The results of this research are discussed by referring to the following aspects:
• sample characteristics
• the frequency to which the respondents have been exposed to the different types of computer
software (packages)
• the frequency to which the respondents have engaged in the activities associated with
computer assisted instruction
• how the respondents benefited from computer assisted instruction
• the problems that the respondents have experienced with computer assisted instruction
• the respondents’ preference between computer assisted instruction and traditional teaching
strategies.

74 4.2.1 Sample characteristics
4.2.1.1 Second year respondents
The sample size was 172, and its characteristics are discussed below.
• Age
Table 4.1 Age distribution (n=164)
How old are you? Valid 164 N Missing 8
Mean 29.4207 Std. Deviation 7.12809 Minimum 19.00 Maximum 52.00
The second year respondents’ ages ranged between 19 and 52 years of age. The mean age was 29
years. The standard deviation was 7, which indicates that the sample was heterogeneous in terms of
age. There were eight missing values.
• Gender
Figure 4.1 Gender distribution (n=172)
Figure 4.1 indicates that 158 (91.9%) were females, and 14 (8.1%) were males. The mode score was
2.0. The majority (91.9%) of respondents were therefore female.

75
• Level of computer expertise
Figure 4.2 Level of computer expertise (n=172)
Figure 4.2 indicates that 15 (8.7%) respondents were proficient in computer use, 113 (65.7%) were
reasonably computer literate, and 44 (25.6%) were not computer literate. The mode score was 2.0.
Most respondents (65.7%) were therefore reasonably computer literate, while some were not
computer literate.
• Main means of obtaining computer skills
Figure 4.3 Main means of obtaining computer skills (n=161)

76 Figure 4.3 indicates that 45 (26.2%) respondents completed, and 54 (31.4%) partly completed a
computer literacy course while 24 (14.0%) taught themselves, and 22 (12.8%) were taught by a
friend, and 16 (9.3%) were taught by a family member. There were 11 (6.4%) missing values. This
may be due to a lack of opinion in respondents. Another possible reason is failure, on the part of the
researcher, to include an option which reflected their unique circumstances. The mode score was
2.0. Therefore, most respondents (57.6%) either partly completed or completed a computer literacy
course.
• Where respondents mainly engaged in computer-based learning
Figure 4.4 Where respondents mainly engaged in computer-based learning (n=171)
Figure 4.4 indicated that 109 (63.4%) respondents utilised the media-centre at the college, 49
(28.5%) utilised their own computers at home, and 13 (7.6%) utilised computer facilities in a
clinical setting. There was 1 (0.6%) missing value. The mode score was 1.0. Most respondents
(63.4%) therefore utilised the media-centre at the college.

77
• The main means through which respondents engaged in computer-based learning
Figure 4.5 The main means through which respondents engaged in computer-based
learning (n=165)
Figure 4.5 indicates that 77 (44.8%) respondents worked individually through educational computer
packages, and 88 (51.2%) worked through educational packages with other learners. There were 7
(4.1%) missing values. The mode score was 2.0. A slight majority of the respondents (51.2%)
therefore collaboratively worked through educational packages, while a substantial percentage
(44.8%) did so individually.
4.2.1.2 Third year respondents
The sample size was 119, and its characteristics are discussed below.

78
• Age
Table 4.2 Age distribution (n=114)
How old are you?
Valid 114 N Missing 5
Mean 28.8421 Std. Deviation 7.19953
Minimum 15.00 Maximum 48.00
The third year respondents’ ages ranged between 15 and 48 years. The mean age was 29 years. The
standard deviation was 7, which indicates that the sample was heterogeneous in terms of age. One
respondent indicated that she/he is 15 years old. The researcher doubted the accuracy of this
response, since it is impossible for a third year nursing learner to be this young. There were 5
(4.2%) missing values.
• Gender
Figure 4.6 Gender distribution (n=118)
Figure 4.6 indicates that 15 (12.6%) respondents were males and 103 (86.6%) were females. The
mode score was 2.0. The majority (86.6%) were therefore female. There was 1 (0.8%) missing
value.

79
• Level of computer expertise
Figure 4.7 Level of computer expertise (n-119)
Figure 4.7 indicates that 12 (10.1%) respondents were proficient in computer use, 83 (69.7%) were
reasonably computer literate, and 24 (20.2%) respondents were not computer literate. The mode
score was 2.0. Most respondents (69.7%) were therefore reasonably computer literate.
• Main means of obtaining computer skills
Figure 4.8 Main means of obtaining computer skills (n=105)

80 Figure 4.8 indicates that 31 (26.1%) respondents completed a computer literacy course, and 32
(26.9%) respondents partly completed a computer literacy course. Twenty (16.8%) taught
themselves, 14 (11.8%) were taught by a friend, and 8 (6.7%) were taught by a family member.
There were 14 (11.8%) missing values. This may be due to a lack of opinion in respondents.
Another possible reason is failure, on the part of the researcher, to include an option which reflected
their unique circumstances. The mode score was 1.0. Most respondents (53.0%) therefore either
partly completed or completed a computer literacy course.
• Where respondents mainly engaged in computer-based learning
Figure 4.9 Where respondents mainly engaged in computer-based learning (n=116)
Figure 4.9 indicated that 86 (72.3%) respondents utilised the media-centre at the college, 23
(19.3%) utilised their own computers at home, and 6 (5.0%) used computer facilities in clinical
setting. There were 3 (2.5%) missing values. The mode score was 1.0. Most respondents (72.3%)
therefore utilised the media-centre at the college.

81
• Main means through which respondents engaged in computer-based learning.
Figure 4.10 Main means through which respondents engaged in computer-based learning
(n=115)
Figure 4.10 indicates that 44 (37.0%) respondents worked individually through educational
computer packages, and 71 (59.7%) worked through educational packages with other learners.
There were 4 (3.4%) missing values. The mode score was 2.0. While most respondents (59.7%)
collaboratively worked through educational computer packages, a substantial number, (37.0%),
individually worked through educational computer packages.
4.2.2 Exposure to different types of computer software
Section B of the questionnaire comprised 9 items pertaining to the frequency to which the
respondents had been exposed to specified computer software which are associated with computer
assisted instruction. The researcher discusses the results of both second and third year respondents.
The researcher regarded non-exposure of more than 25.0% of the respondents to be problematic.

82 4.2.2.1 Second year respondents
The research findings pertaining to the second year respondents are presented in the following
section. The colour codes for the responses in the pie diagrams are as follows:
Daily; Weekly; Monthly; Never; Missing values.
• Reading skills computer packages
Figure 4.11 Reading skills computer packages (n=171)
Figure 4.11 indicates the frequency of respondents’ exposure to reading skills computer packages;
namely 52 (30.2%) never, 96 (55.8%) monthly, 20 (11.6%) weekly, and 3 (1.7%) daily. There was 1
(0.6%) missing value. The median score was 2.0 (monthly). Most of the respondents (69.1%) had
been exposed monthly or more frequently. However, a substantial number (30.2%) had never been
exposed. These results indicated under-utilisation of this learning resource.
• Typing skills computer packages
Figure 4.12 Typing skills computer packages (n=169)

83 Figure 4.12 indicates the frequency of respondents’ exposure to typing skills computer packages;
namely 58 (33.7%) never, 85 (49.4%) monthly, 21 (12.2%) weekly, and 5 (2.9%) daily. There were
3 (1.7%) missing values. The median score was 2.0 (monthly). Most respondents (65.5%) therefore
had been exposed on a monthly basis or more frequently. However, a substantial number (33.7%)
had never been exposed. These results indicated under-utilisation of this learning resource.
• Computer literacy packages
Figure 4.13 Computer literacy packages (n=166)
Figure 4.13 indicates the frequency of respondents’ exposure to computer literacy packages; namely
73 (42.4%) never, 76 (44.2%) monthly, 14 (8.1%) weekly, and 3 (1.7%) daily. There were 6 (3.5%)
missing values. The median score was 2.0 (monthly). Although most respondents (54.0%) enjoyed
monthly or more frequent exposure, it should be noted that a substantial number of respondents
(42.4%) had never been exposed. These results indicated under-utilisation of this learning resource.
• Text-based course content computer packages
Figure 4.14 Text-based course content computer packages (n=163)

84
Figure 4.14 indicates the frequency of respondents’ exposure to text-based course content computer
packages; namely 90 (52.3%) never, 59 (34.3%) monthly, 12 (7.0%) weekly, and 2 (1.2%) daily.
There were 9 (5.2%) missing values. The median score was 1.0 (never). Most respondents (52.3%)
have never been exposed, while some (42.5%) had exposure on a monthly or more frequent basis.
These results indicated non-utilisation, or at best, under-utilisation of this learning resource.
• Multimedia course content computer packages
Figure 4.15 Multimedia course content computer packages (n=168)
Figure 4.15 indicates the frequency of respondents’ exposure to multimedia course content
computer packages; namely 100 (58.1%) never, 48 (27.9%) monthly, 18 (10.5%) weekly, and 2 (1.2
%) daily. There were 4 (2.3%) missing values. The median score was 1.0 (never). Most of the
respondents (58.1%) had never been exposed, while some (39.6%) had exposure on a monthly or
more frequent basis. These results indicated non-utilisation, or at best, under-utilisation of this
learning resource.
85
• Text-based computer packages which provide scenarios that develop my problem-
solving skills
Figure 4.16 Text-based computer packages, which provide scenarios that develop
respondents’ problem-solving skills (n=172)
Figure 4.16 indicates the frequency of respondents’ exposure to text-based computer packages,
which provide scenarios that develop their problem-solving skills; namely 101 (58.7%) never, 57
(33.1%) monthly, 13 (7.6%) weekly, and 1 (0.6%) daily. There was 1 (0.6%) missing value. The
median score was 1.0 (never). Most of the respondents (58.7%) had never been exposed, while
some (41.3%) exposure on a monthly or more frequent basis. These results indicated non-utilisation,
or at best, under-utilisation of this learning resource.
• Multimedia computer packages, which provide scenarios that develop my problem-
solving skills
Figure 4.17 Multimedia computer packages, which provide scenarios that develop
respondents’ problem-solving skills (n=171)

86 Figure 4.17 indicates the frequency of respondents’ exposure to multimedia computer packages,
which provide scenarios that develop their problem-solving skills; namely 114 (66.3%) never, 44
(25.6%) monthly, 11 (6.4%) weekly, and 2 (1.2%) daily. There was 1 (0.6%) missing value. The
median score was 1.0 (never). Most of the respondents (66.3%) had never been exposed, while
some (33.2%) had exposure on a monthly or more frequent basis. These results indicated non-
utilisation, or at best, under-utilisation of this learning resource.
• Computer packages simulating clinical situations which develop my decision-making
skills
Figure 4.18 Computer packages simulating clinical situations which develop respondents’
decision-making skills (n=170)
Figure 4.18 indicates the frequency of respondents’ exposure to computer packages simulating
clinical situations, which develop their decision-making skills; namely 108 (62.8%) never, 50
(29.1%) monthly, 11 (6.4%) weekly, and 2 (1.2%) daily. There was 1 (0.6%) missing value. The
median score was 1.0 (never). Most of the respondents (62.8%) had never been exposed, while
some (36.7%) had exposure on a monthly or more frequent basis. These results indicated non-
utilisation, or at best, under-utilisation of this learning resource.
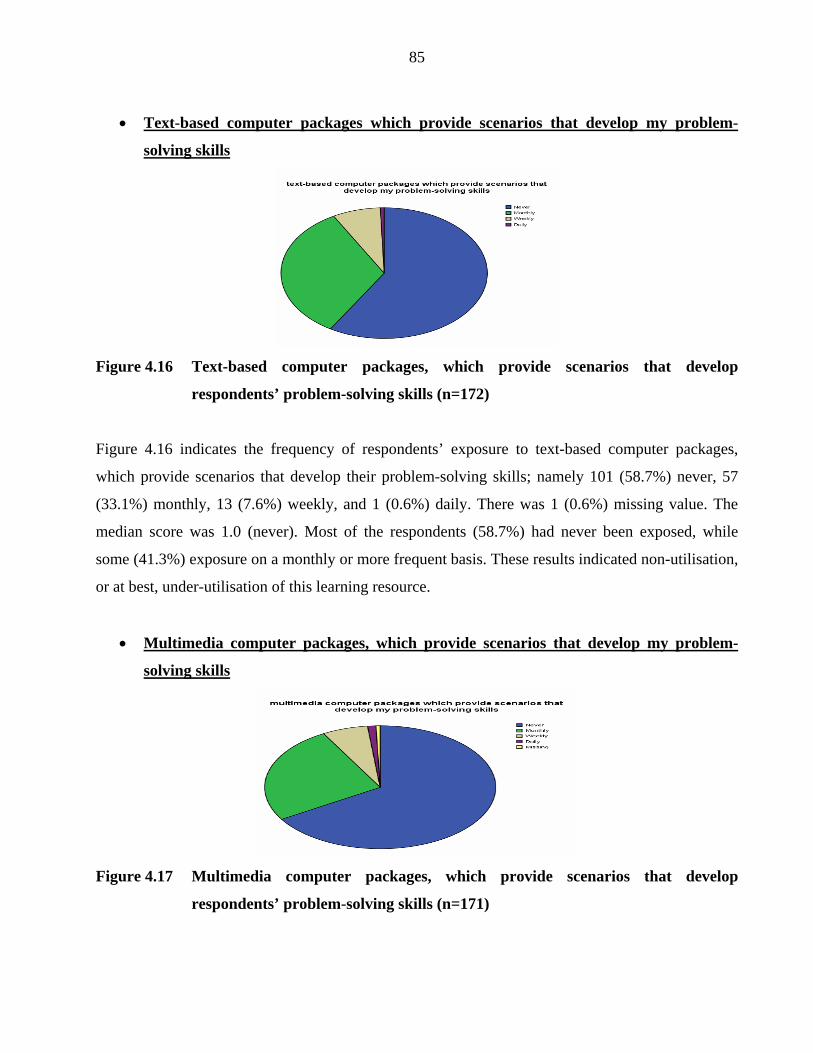
87 Computer packages which enable me to achieve my learning objectives though game-playing
Figure 4.19 Computer packages which enable respondents’ to achieve their learning
objectives though game-playing (n=172)
Figure 4.19 indicates the frequency of respondents’ exposure to computer packages, which enable
them to achieve their learning objectives though game-playing; namely 75 (43.6%) never, 67
(39.0%) monthly, 21 (12.2%) weekly, and nine (5.2%) daily. The median score was 2.0 (monthly).
A slight majority (56.4%) indicated monthly or more frequent exposure, while a substantial number
(43.6%) had never been exposed. These results indicated under-utilisation of this learning resource.
4.2.2.2 Third year respondents
The research findings pertaining to the third year respondents are presented in the following section.
The colour codes for the responses in the pie diagrams are as follows:
Daily; Weekly; Monthly; Never; Missing values.
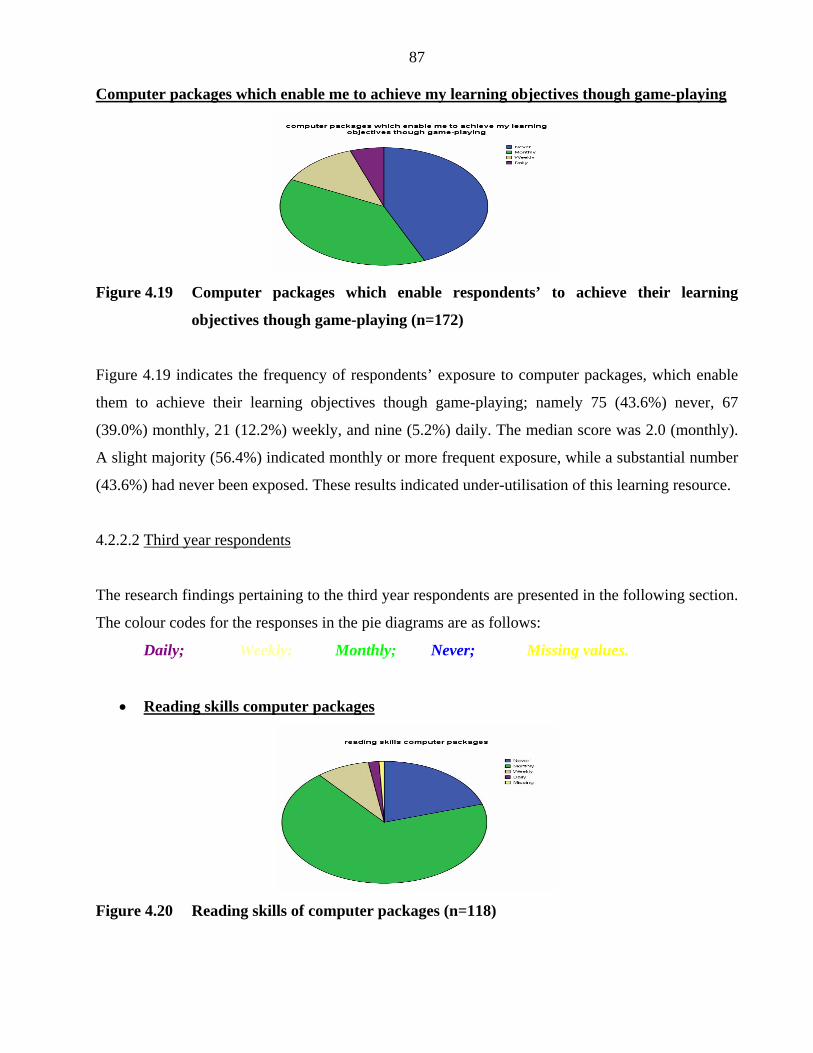
• Reading skills computer packages
Figure 4.20 Reading skills of computer packages (n=118)

88 Figure 4.20 indicates the frequency of respondents’ exposure to reading skills of computer
packages; namely 24 (20.2%) never, 82 (68.9%) monthly, 10 (8.4%) weekly, and 2 (1.7%) daily.
There was 1 (0.8%) missing value. The median score was 2.0 (monthly). A substantial majority of
the respondents (79.0%) had been exposed monthly or more frequently. There is therefore evidence
of respondents having access to computer assisted remedial reading assistance.
• Typing skills computer packages
Figure 4.21 Typing skills computer packages (n=119)
Figure 4.21 indicates the frequency of respondents’ exposure to typing skills computer packages;
namely 32 (26.9%) never, 72 (60.5%) monthly, 11 (9.2%) weekly, and 4 (3.4%) daily. The median
score was 2.0 (monthly). Most of the respondents (73.1%) had been exposed monthly or more
frequently. A reasonable number (26.9%) indicated that they had never been exposed. These results
indicated under-utilisation of this learning resource.
• Computer literacy packages
Figure 4.22 Computer literacy packages (n=118)

89 Figure 4.22 indicates the frequency of respondents’ exposure to computer literacy packages; namely
44 (37.0%) never, 62 (52.1%) monthly, 5 (4.2%) weekly, and 7 (5.9%) daily. There was 1 (0.6%)
missing value. The median score was 2.0 (monthly). Although most respondents (62.2%) enjoyed
monthly or more frequent exposure, a substantial number (37.0%) had never been exposed. These
results indicated under-utilisation of this learning resource.
• Text-based course content computer packages
Figure 4.23 Text-based computer packages, which provide scenarios that develop
respondents’ problem-solving skills (n=117)
Figure 4.23 indicates the frequency of respondents’ exposure to text-based computer packages,
which provide scenarios that develop their problem-solving skills; namely 62 (52.1%) never, 46
(38.7%) monthly, 7 (5.9%) weekly, and 2 (1.7%) daily. There were 2 (1.7%) missing values. The
median score was 1.0 (never). Most of the respondents (52.1%) had never been exposed, while
some (46.3%) had monthly or more frequent exposure. These results indicated non-utilisation, or at
best, under-utilisation of this learning resource.
• Multimedia course content computer packages
Figure 4.24 Multimedia course content computer packages (n=118)

90
Figure 4.24 indicates the frequency of respondents’ exposure to multimedia course content
computer packages; namely 66 (55.5%) never, 39 (32.8%) monthly, 9 (7.6%) weekly, and 4 (3.4%)
daily. There was 1 (0.8%) missing value. The median score was 1.0 (never). Most of the
respondents (55.5%) had never been exposed, while some (43.8%) had monthly or more frequent
exposure. These results indicated non-utilisation, or at best, under-utilisation of this learning
resource.
• Text-based computer packages which provide scenarios that develop my problem-
solving skills
Figure 4.25 Text-based computer packages which provide scenarios that develop
respondents’ problem-solving skills (n=118)
Figure 4.25 indicates the frequency of respondents’ exposure to text-based computer packages,
which provide scenarios that develop their problem-solving skills; namely 59 (49.6%) never, 50
(42.0%) monthly, 5 (4.2%) weekly, and 4 (3.4%) daily. There was 1 (0.8%) missing value. The
median score was 1.0 (never). Most of the respondents (49.6%) had monthly or more frequent
exposure, while almost an equal number (49.6%) had never been exposed. These results indicated
under-utilisation of this learning resource.

91
• Multimedia computer packages which provide scenarios that develop my problem-
solving skills
Figure 4.26 Multimedia computer packages which provide scenarios that develop my
problem-solving skills (n=119)
Figure 4.26 indicates the frequency of respondents’ exposure to multimedia computer packages,
which provide scenarios that develop their problem-solving skills; namely 71 (59.7%) never, 39
(32.8%) monthly, 5 (4.2%) weekly, and 4 (3.4%) daily. The median score was 1.0 (never). Most of
the respondents (59.7%) had never been exposed, while some (40.4%) had monthly or more
frequent exposure. These results indicated non-utilisation, or at best, under-utilisation of this
learning resource.
• Computer packages simulating clinical situations which develop my decision-making
skills
Figure 4.27 Computer packages simulating clinical situations which develop respondents’
decision-making skills (n=119)
Figure 4.27 indicates the frequency of respondents’ exposure to computer packages simulating
clinical situations, which develop their decision-making skills; namely 79 (66.4%) never, 33
(27.7%) monthly, 2 (1.7%) weekly, and 5 (4.2%) daily. The median score was 1.0 (never). Most of

92 the respondents (66.4%) had never been exposed, while some (33.6%) had monthly or more
frequent exposure. These results indicated non-utilisation, or at best, under-utilisation of this
learning resource.
• Computer packages which enable me to achieve my learning objectives though game-
playing
Figure 4.28 Computer packages which enable respondents’ to achieve their learning
objectives though game-playing (n=118)
Figure 4.28 indicates the frequency of respondents’ exposure to computer packages, which enable
them to achieve their learning objectives though game-playing; namely 52 (43.7%) never, 44
(37.0%) monthly, 17 (14.3%) weekly, and five (4.2%) daily. There was 1 (0.8%) missing value. The
median score was 2.0 (monthly). While a slight majority of the respondents (55.5%) had been
exposed monthly or more frequently, a substantial number (43.7%) had never been exposed. These
results indicated under-utilisation of this learning resource.
4.2.2.3 Comparison between the responses of the second and third year respondents
The Mann-Whitney U-test indicated that there were no significant differences between the second
and third year respondents responses on the following items:
• reading skills computer packages (p= 0.279)
• typing skills computer packages (p=0.459)
• computer literacy packages (p=0.310)
• text-based course content computer packages (p=0.787)
• multimedia course content computer packages (p=0.615)

93
• text-based computer packages which provide scenarios that develop my problem-solving
skills (p=0.189)
• multimedia computer packages which provide scenarios that develop my problem-solving
skills (p=0.257)
• computer packages simulating clinical situations which develop my decision-making skills
(p=0.627)
• computer packages which enable me to achieve my learning objectives though game-playing
(p=0.993).
4.2.3 Learner engagement in activities associated with computer assisted instruction.
Section C of the questionnaire comprised 13 items pertaining to the frequency to which respondents
have engaged in specified activities associated with computer assisted instruction. The researcher
discussed the results for both second and third year respondents starting with the second years.
4.2.3.1 Second year respondents
The research findings pertaining to the second year respondents are presented in the following
section. The colour codes for the responses in the pie diagrams are as follows:
Daily; Weekly; Monthly; Never; Missing values.
• Obtaining information from the Internet
Figure 4.29 Obtaining information from the Internet (n=172)

94 Figure 4.29 indicates the frequencies to which respondents obtained information from the Internet;
namely 45 (26.2%) never, 90 (52.3%) monthly, 28 (16.3%) weekly, and 9 (5.2%) daily. The median
score was 2.0 (monthly). While most respondents (73.8%) obtained information from the Internet
on a monthly basis or more frequently, a reasonable number (26.2%) indicated never. While this is
an indication that the Internet is utilised for obtaining information, respondents could be motivated
to utilise this learning resource more frequently.
• Obtaining information from CD-ROM packages
Figure 4.30 Obtaining information from CD-ROM packages (n=170)
Figure 4.30 indicates the frequencies to which respondents obtained information from CD-ROM
packages; namely 102 (59.3%) never, 49 (28.5%) monthly, 16 (9.3%) weekly, and 3 (1.7%) daily.
There were 2 (1.2%) missing values. The median score was 1.0 (never). Most respondents (59.3%)
were never engaged in obtaining information from CD ROM packages, while 39.5% did so monthly
or more frequently. These results indicated non-utilisation, or at best, under-utilisation of CD-ROM
packages for obtaining information.
• Communicating with other learners by e mail
Figure 4.31 Communicating with other learners by email (n=172)

95 Figure 4.31 indicates the frequency to which respondents communicated with their peers by email;
namely 144 (83.7%) never, 16 (9.3%) monthly, 10 (5.8%) weekly and 2 (1.2%) daily. There were 2
(1.2%) missing values. The median score was 1.0 (never). A substantial majority of respondents
(83.7%) were never engaged in electronic communication with their peers. These results indicated
mainly, non-utilisation of this communication resource.
• Communicating with my tutors by email
Figure 4.32 Communicating with my tutors by email (n=172)
Figure 4.32 indicates the frequency to which respondents communicated with their tutors by email;
namely, 171 (99.4%) never, and 1 (0.6%) monthly. The median score was 1.0 (never). These
findings indicated that almost all respondents (99.4%) never communicated with their tutors by
email. These results indicated non-utilisation of this communication resource.
• Communicating with field experts by email
Figure 4.33 Communicating with field experts by email (n=171)
Figure 4.33 indicates the frequency to which respondents communicated with field experts by
email; namely 106 (93.6%) never, 9 (5.2%) monthly, and 1 (0.6%) weekly. There was 1 (0.6%)
missing value. The median score was 1.0 (never). A substantial majority of respondents (93.6%)

96 were never engaged in communicating with field experts by email. These results indicated non-
utilisation of this communication resource.
• Participating in bulletin board discussions with other learners
Figure 4.34 Participating in bulletin board discussions with other learners (n=172)
Figure 4.34 indicates the frequency to which respondents participated in bulletin board discussions
with their peers; namely 115 (90.1%) never, 14 (8.1%) monthly, and 3 (1.7%) weekly. The median
score was 1.0 (never).
A substantial majority of respondents (90.1%) were never engaged in participating in bulletin board
discussions with their peers. These results indicated non-utilisation of this communication resource.
• Participating in on-line chatting with other learners
Figure 4.35 Participating in on-line chatting with other learners (n=172)
Figure 4.35 indicates the frequency to which respondents participated in on-line chatting with their
peers; namely 156 (90.7%) never, 11 (6.4%) monthly, and 3 (1.7%) weekly. The median score was
1.0 (never). A substantial majority of respondents (90.7%) were never engaged in participating in

97 on-line chatting with their peers. These results indicated non-utilisation of this communication
resource.
• Participating in video-conferencing with other learners
Figure 4.36 Participating in video-conferencing with other learners (n=172)
Figure 4.36 indicates the frequency to which respondents participated in video-conferencing with
their peers; namely 115 (87.2%) never, 21 (12.2%) monthly, and 1 (0.6%) weekly. The median
score was 1.0 (never). A substantial majority of respondents (87.2%) were never engaged in
participating in video-conferencing with their peers. These results indicated mainly non-utilisation
of this communication resource.
• Participating in video-conferencing with my tutors
Figure 4.37 Participating in video-conferencing with my tutors (n=172)
Figure 4.37 indicates the frequency to which respondents participated in video-conferencing with
their tutors; namely 149 (86.6%) never, 22 (12.8%) monthly, and 1 (0.6%) weekly. The median
score was 1.0 (never). A substantial majority of respondents (86.6%) were never engaged in
participating in video-conferencing with their tutors. These results indicated mainly non-utilisation
of this communication resource.

98
• Exchanging information with other learners by email
Figure 4.38 Exchanging information with other learners by email (n=172)
Figure 4.38 indicates the frequency to which respondents exchanged information with their peers by
email; namely 153 (89.0%) never, 13 (7.6%) monthly, and 6 (3.5%) weekly. The median score was
1.0 (never). A substantial majority of respondents (89.0%) were never engaged in exchanging
information with their peers by email. These results indicated mainly, non-utilisation of this
communication resource.
• Exchanging information with my tutors by email
Figure 4.39 Exchanging information with my tutors by email (n=172)
Figure 4.39 indicates the frequency to which respondents exchanged information with their tutors
by email, namely 167 (97.1%) never, 3 (1.7%) monthly, and 2 (1.2%) weekly. The median score
was 1.0 (never). A substantial majority of respondents (97.1%) were never engaged in exchanging
information with their tutors by email. These results indicated non-utilisation of this communication
resource.
99
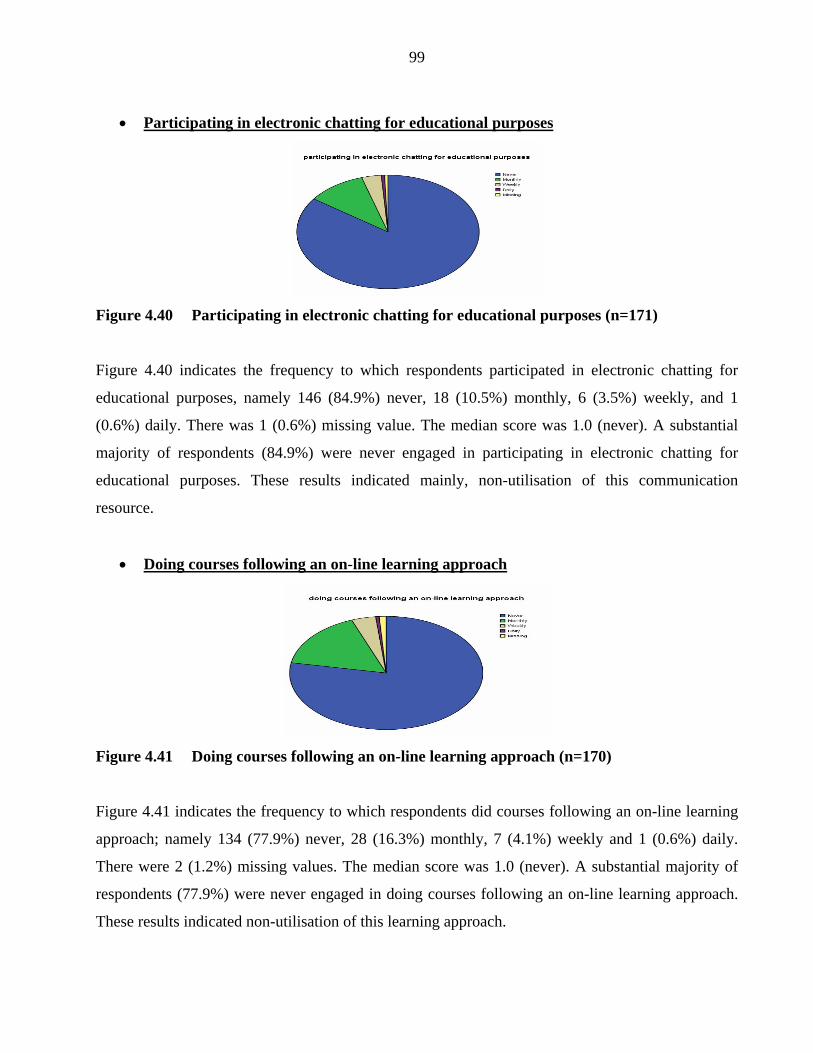
• Participating in electronic chatting for educational purposes
Figure 4.40 Participating in electronic chatting for educational purposes (n=171)
Figure 4.40 indicates the frequency to which respondents participated in electronic chatting for
educational purposes, namely 146 (84.9%) never, 18 (10.5%) monthly, 6 (3.5%) weekly, and 1
(0.6%) daily. There was 1 (0.6%) missing value. The median score was 1.0 (never). A substantial
majority of respondents (84.9%) were never engaged in participating in electronic chatting for
educational purposes. These results indicated mainly, non-utilisation of this communication
resource.
• Doing courses following an on-line learning approach
Figure 4.41 Doing courses following an on-line learning approach (n=170)
Figure 4.41 indicates the frequency to which respondents did courses following an on-line learning
approach; namely 134 (77.9%) never, 28 (16.3%) monthly, 7 (4.1%) weekly and 1 (0.6%) daily.
There were 2 (1.2%) missing values. The median score was 1.0 (never). A substantial majority of
respondents (77.9%) were never engaged in doing courses following an on-line learning approach.
These results indicated non-utilisation of this learning approach.

100 4.2.3.2 Third year respondents
The research findings pertaining to the third year respondents are presented in the following section.
The colour codes for the responses in the pie diagrams are as follows:
Daily; Weekly; Monthly; Never; Missing values.
• Obtaining information from the Internet
Figure 4.42 Obtaining information from the Internet (n=119)
Figure 4.42 indicates the frequency to which respondents obtained information from the Internet;
namely, 30 (25.2%) never, 53 (44.5%) monthly, 25 (21.0%) weekly and 11 (9.2%) daily. The
median score was 2.0 (monthly). Most respondents (74.7%) were engaged in obtaining information
from the Internet monthly or more frequently. A reasonable number (25.2%) indicated never. While
this is an indication that the Internet is utilised for obtaining information, respondents could be
motivated to utilise this learning resource more frequently.
• Obtaining information from CD-ROM packages
Figure 4.43 Obtaining information from CD-ROM packages (n=119)
Figure 4.43 indicates the frequency to which respondents obtain information from CD-ROM
packages; namely 63 (52.9%) never, 38 (31.9%) monthly, 11 (9.2%) weekly, and 7 (5.9%) daily.

101 The median score was 1.0 (never). A slight majority of respondents (52.9%) were never engaged in
obtaining information from CD ROM packages, while (47.0%) did so monthly or more frequently.
These results indicated non-utilisation, or at best, under-utilisation of CD-ROM packages for
obtaining information.
• Communicating with other learners by email
Figure 4.44 Communicating with other learners by email (n=118)
Figure 4.44 indicates the frequency to which respondents communicated with their peers by email;
namely 88 (73.9%) never, 11 (9.2%) monthly, 10 (8.4%) weekly and 9 (7.6%) daily. There was 1
(0.8%) missing value. The median score was 1.0 (never). Most respondents (83.7%) were never
engaged in communicating with their peers by email, while a reasonable number (25.2%) did so
monthly or more frequently. These results indicated non-utilisation of this communication resource.
• Communicating with my tutors by email
Figure 4.45 Communicating with my tutors by email (n=119)
Figure 4.45 indicates the frequency to which respondents communicated with their tutors by email;
namely 115 (96.6%) never, 2 (1.7%) monthly, 1 (0.8%) weekly and 1 (0.8%) daily. The median
102 score was 1.0 (never). A substantial majority of respondents (96.6%) were never engaged in
communicating with their tutors by email. These results indicated non-utilisation of this
communication resource.
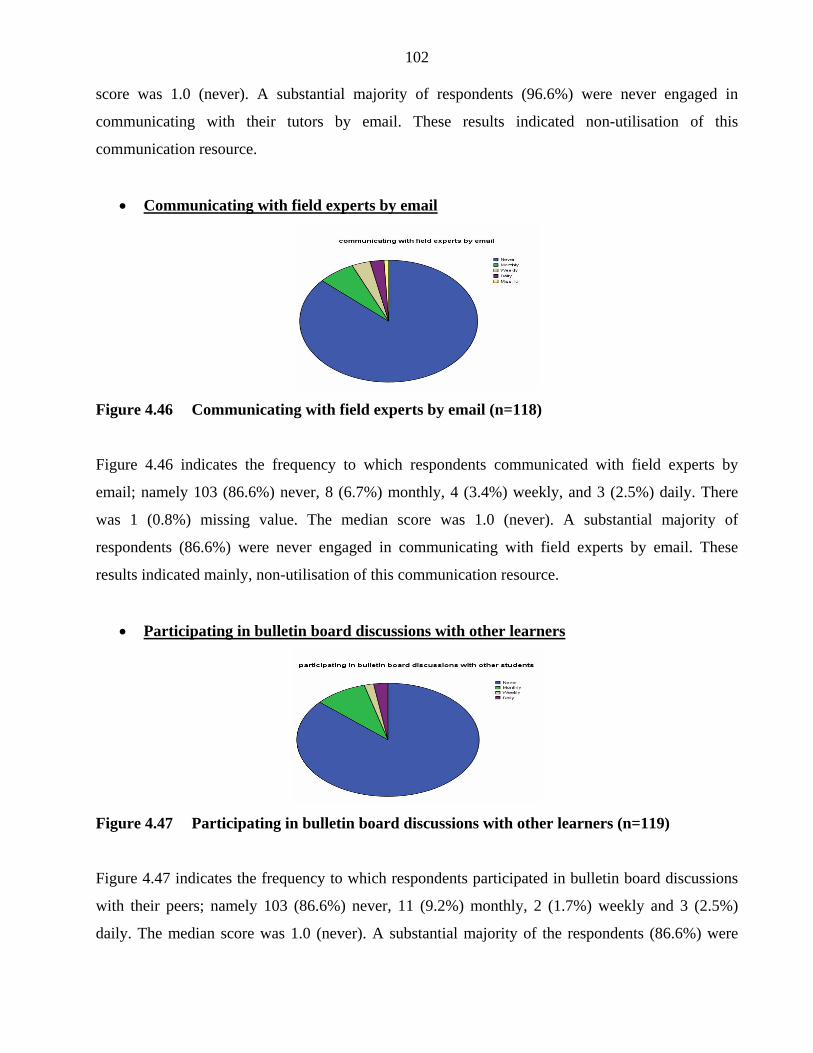
• Communicating with field experts by email
Figure 4.46 Communicating with field experts by email (n=118)
Figure 4.46 indicates the frequency to which respondents communicated with field experts by
email; namely 103 (86.6%) never, 8 (6.7%) monthly, 4 (3.4%) weekly, and 3 (2.5%) daily. There
was 1 (0.8%) missing value. The median score was 1.0 (never). A substantial majority of
respondents (86.6%) were never engaged in communicating with field experts by email. These
results indicated mainly, non-utilisation of this communication resource.
• Participating in bulletin board discussions with other learners
Figure 4.47 Participating in bulletin board discussions with other learners (n=119)
Figure 4.47 indicates the frequency to which respondents participated in bulletin board discussions
with their peers; namely 103 (86.6%) never, 11 (9.2%) monthly, 2 (1.7%) weekly and 3 (2.5%)
daily. The median score was 1.0 (never). A substantial majority of the respondents (86.6%) were
103 never engaged in participating in bulletin board discussions with their peers. These results indicated
non-utilisation of this communication resource.
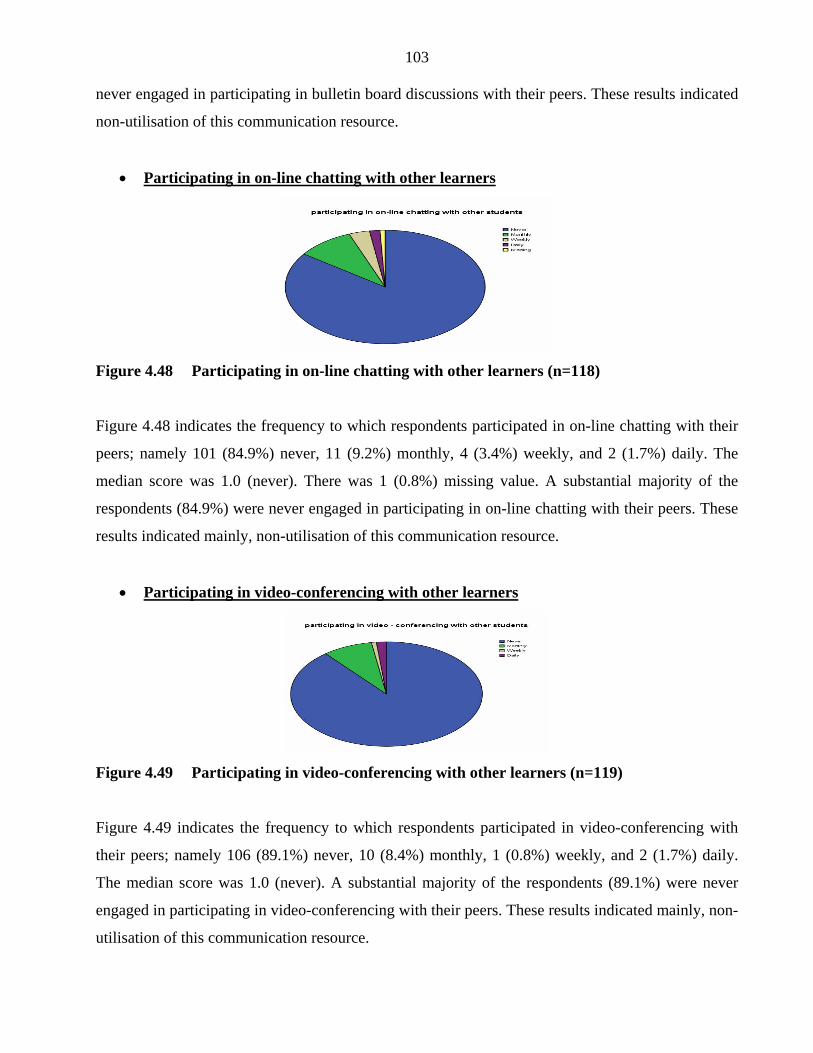
• Participating in on-line chatting with other learners
Figure 4.48 Participating in on-line chatting with other learners (n=118)
Figure 4.48 indicates the frequency to which respondents participated in on-line chatting with their
peers; namely 101 (84.9%) never, 11 (9.2%) monthly, 4 (3.4%) weekly, and 2 (1.7%) daily. The
median score was 1.0 (never). There was 1 (0.8%) missing value. A substantial majority of the
respondents (84.9%) were never engaged in participating in on-line chatting with their peers. These
results indicated mainly, non-utilisation of this communication resource.
• Participating in video-conferencing with other learners
Figure 4.49 Participating in video-conferencing with other learners (n=119)
Figure 4.49 indicates the frequency to which respondents participated in video-conferencing with
their peers; namely 106 (89.1%) never, 10 (8.4%) monthly, 1 (0.8%) weekly, and 2 (1.7%) daily.
The median score was 1.0 (never). A substantial majority of the respondents (89.1%) were never
engaged in participating in video-conferencing with their peers. These results indicated mainly, non-
utilisation of this communication resource.

104
• Participating in video-conferencing with my tutors
Figure 4.50 Participating in video-conferencing with my tutors (n=119)
Figure 4.50 indicates the frequency to which respondents participated in video-conferencing with
their tutors; namely 111 (93.3%) never, 5 (4.2%) monthly, 2 (1.7%) weekly, and 1 (0.8%) daily.
The median score was 1.0 (never). A substantial majority of the respondents (93.3%) were never
engaged in participating in video-conferencing with their tutors. These results indicated non-
utilisation of this communication resource.
• Exchanging information with other learners by email
Figure 4.51 Exchanging information with other learners by email (n=119)
Figure 4.51 indicates the frequency to which respondents exchanged information with other learners
by email; namely 103 (86.6%) never, 9 (7.6%) monthly, 3 (2.5%) weekly, and 4 (3.4%) daily. The
median score was 1.0 (never). A substantial majority of the respondents (86.6%) were never
engaged in exchanging information with their peers by email. These results indicated mainly, non-
utilisation of this communication resource.

105
• Exchanging information with my tutors by email
Figure 4.52 Exchanging information with my tutors by email (n=118)
Figure 4.52 indicates the frequency to which respondents exchanged information with their tutors
by email; namely 115 (96.6%) never, 1 (0.8%) monthly, 1 (0.8%) weekly, and 1 (0.8%) daily. There
was 1 (0.8%) missing value. The median score was 1.0 (never). A substantial majority of the
respondents (96.6%) were never engaged in exchanging information with their tutors by email.
These results indicated non-utilisation of this communication resource.
• Participating in electronic chatting for educational purposes
Figure 4.53 Participating in electronic chatting for educational purposes (n=119)
Figure 4.53 indicates the frequency to which respondents participated in electronic chatting for
educational purposes; namely 93 (78.2%) never, 20 (16.8%) monthly, 1 (0.8%) weekly, and 5
(4.2%) daily. The median score was 1.0 (never). A substantial majority of the respondents (78.2%)
were never engaged in participating in electronic chatting for educational purposes. These results
indicated mainly, non-utilisation of this communication resource.

106
• Doing courses following an on-line learning approach
Figure 4.54 Doing courses following an on-line learning approach (n=119)
Figure 4.54 indicates the frequency to which respondents did courses following an on-line learning
approach; namely 97(81.5%) never, 12 (10.1%) monthly, 6 (5.0%) weekly, and 4 (3.4%) daily. The
median score was 1.0 (never). A substantial majority of respondents (81.5%) were never engaged in
doing courses following an on-line learning approach. These results indicated mainly, non-
utilisation of this communication resource.
4.2.3.3 Comparison between the responses of the second and third year respondents
The Mann-Whitney U-test indicated that there were no significant differences between the second
and third year respondents’ responses on the following items:
• obtaining information from the Internet (p=0.234)
• obtaining information from CD-ROM packages (p=0.179)
• communicating with my tutors by email (p=0.072)
• participating in bulletin board discussions with other learners (p=0.318)
• participating in on-line chatting with other learners (p=0.176)
• participating in video-conferencing with other learners (p=0.681)
• participating in video-conferencing with my tutors (p=0.085)
• exchanging information with other learners by email (p=0.488)
• exchanging information with my tutors by email (p=0.864)
• participating in electronic chatting for educational purposes (p=0.114)
• doing courses following an on-line learning approach (p=0.729).

107 The Mann-Whitney U-test indicated that there were significant differences between the second and
third year respondents’ responses on the following items:
• communicating with other learners by e mail (p=0.032).
The third year respondents (mean=1.49) appeared to communicate with other learners by
email more frequently than second year respondents (mean=1.24).
• communicating with field experts by email (p=0.034).
The third year respondents (mean=1.21) appeared to communicate with field experts by
email more frequently than second year respondents (mean=1.06).
4.2.4 Benefits of computer assisted instruction
Section D of the questionnaire comprised 41 items pertaining to how respondents benefited from
computer assisted instruction. The researcher discussed the results of both second and third year
respondents starting with the second year responses.
4.2.4.1 Second year respondents
The research findings pertaining to the second year respondents are presented in the following
section. The colour codes for the responses in the pie diagrams are as follows:
Strongly agree; Agree; Disagree; Strongly disagree; Missing value
• Enhancing my’ motivation to learn
Figure 4.55 Enhancing my motivation to learn (n=169)
108 Figure 4.55 indicates the level of agreement on the statement that computer assisted instruction
enhanced their motivation to learn; namely 12 (7.0%) strongly disagreed, 23 (13.4%) disagreed, 92
(53.5%) agreed, and 42 (24.4%) strongly agreed. There were 3 (1.8%) missing values. The median
score was 3.0 (agree). A substantial majority of the respondents (77.9%) strongly agreed or agreed.
Most respondents therefore benefited from enhanced motivation to learn.
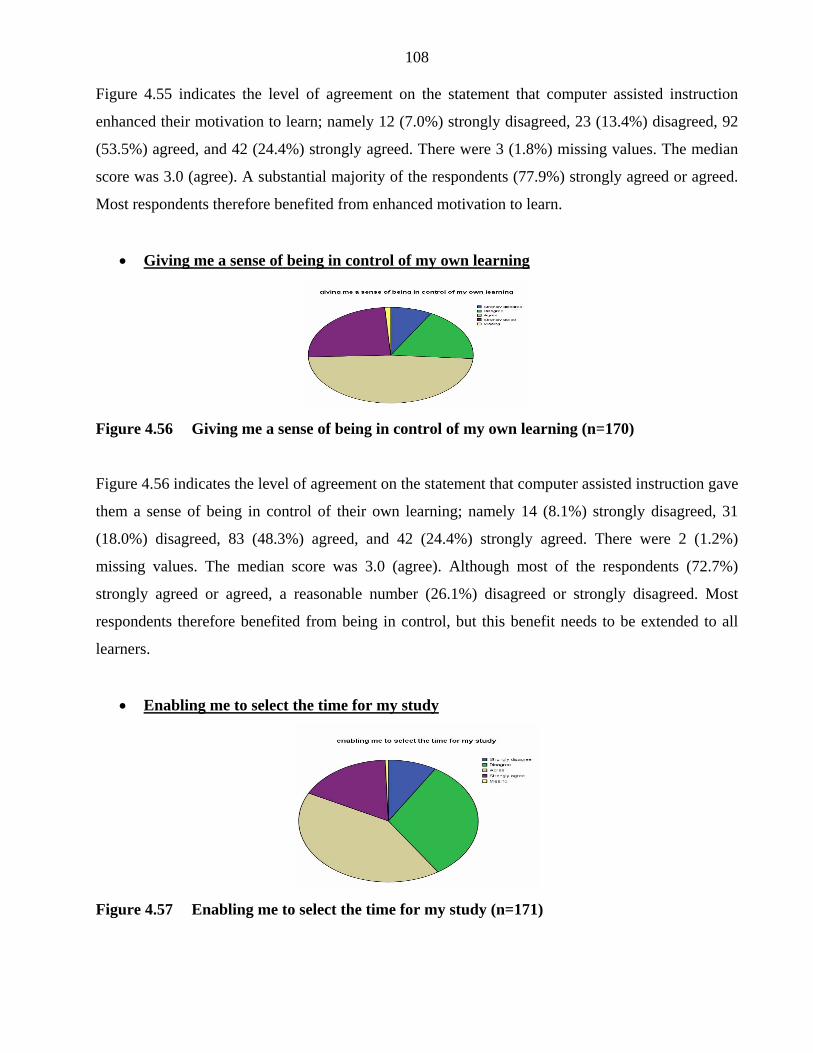
• Giving me a sense of being in control of my own learning
Figure 4.56 Giving me a sense of being in control of my own learning (n=170)
Figure 4.56 indicates the level of agreement on the statement that computer assisted instruction gave
them a sense of being in control of their own learning; namely 14 (8.1%) strongly disagreed, 31
(18.0%) disagreed, 83 (48.3%) agreed, and 42 (24.4%) strongly agreed. There were 2 (1.2%)
missing values. The median score was 3.0 (agree). Although most of the respondents (72.7%)
strongly agreed or agreed, a reasonable number (26.1%) disagreed or strongly disagreed. Most
respondents therefore benefited from being in control, but this benefit needs to be extended to all
learners.
• Enabling me to select the time for my study
Figure 4.57 Enabling me to select the time for my study (n=171)

109 Figure 4.57 indicates the level of agreement on the statement that computer assisted instruction
enabled them to select the time for their study; namely 15 (8.7%) strongly disagreed, 50 (32.0%)
disagreed, 72 (42.0%) agreed, and 29 (17.0%) strongly agreed. There was 1 missing value. The
median score was 3.0 (agree). Although a slight majority respondents (59.0%) agreed or strongly
agreed, a substantial number (40.7%) disagreed or strongly disagreed. The respondents therefore
generally benefited inadequately from flexibility in terms of study time.
• Enabling me to establish my own pace of learning
Figure 4.58 Enabling me to establish my own pace of learning (n=172)
Figure 4.58 indicates the level of agreement on the statement that computer assisted instruction
enabled them to establish their own pace of learning; namely 14 (8.1%) strongly disagreed, 39
(22.7%) disagreed, 81 (47.1%) agreed, and 38 (22.1%) strongly agreed. The median score was 3.0
(agree). Although the majority of the respondents (69.2%) agreed or strongly agreed, a substantial
number (30.8%) disagreed or strongly disagreed. The majority of respondents therefore benefited
from flexibility in terms of learning pace, but this benefit needs to be extended to all learners.
• Enabling me to discontinue learning when my concentration wavers
Figure 4.59 Enabling me to discontinue learning when my concentration wavers (n=172)

110 Figure 4.59 indicates the level of agreement on the statement that computer assisted instruction
enabled them to discontinue learning when their concentration wavers; namely 21 (12.2%) strongly
disagreed, 38 (22.1%) disagreed, 72 (41.9%) agreed, and 41 (23.8%) strongly agreed. The median
score was 3.0 (agree). Although the majority of the respondents (65.7%) agreed or strongly agreed,
a substantial number (34.3%) disagreed or strongly disagreed. The majority of respondents therefore
benefited from flexibility in terms of resting time, but this benefit needs to be extended to all
learners.
• Enabling me to repeatedly study sections of the learning material until I gain
understanding
Figure 4.60 Enabling me to repeatedly study sections of the learning material until I gain
understanding (n=171)
Figure 4.60 indicates the level of agreement on the statement that computer assisted instruction
enabled them to repeatedly study sections of the learning material until they gained understanding;
namely 17 (10.0%), strongly disagreed, 27 (15.7%) disagreed, 81 (47.1%) agreed, and 46 (26.7%)
strongly agreed. There was 1 (0.6%) missing value. The median score was 3.0 (agree). Although the
majority of the respondents (73.8%) agreed or strongly agreed, a reasonable number (25.7%)
disagreed or strongly disagreed. Most respondents therefore benefited from repetitive learning, but
this benefit needs to be extended to all learners.

111 • Giving me the freedom to make mistakes and learn from it
Figure 4.61 Giving me the freedom to make mistakes and learn from it (n=172)
Figure 4.61 indicates the level of agreement on the statement that computer assisted instruction gave
them freedom to make mistakes and learn form it; namely 12 (7.0%) strongly disagreed, 20 (11.6%)
disagreed, 81 (47.1%) agreed, and 59 (34.3%) strongly agreed. The median score was 3.0 (agree). A
substantial majority of the respondents (81.4%) agreed or strongly agreed. Respondents therefore
generally benefited from a learning climate supportive of learning from mistakes.
• Decreasing pressure placed on me by other learners
Figure 4.62 Decreasing pressure placed on me by other learners (n=171)
Figure 4.62 indicates the level of agreement on the statement that computer assisted instruction
decreased pressure placed on them by other learners; namely 22 (12.8%) strongly disagreed, 52
(30.2%) disagreed, 63 (36.6%) agreed, and 34 (19.8%) strongly agreed. There was 1 (0.6%) missing
value. The median score was 3.0 (agree). Although the majority of the respondents (56.4%) agreed
or strongly agreed, a slight minority (43.0%) disagreed or strongly disagreed. The respondents
therefore did not adequately benefit from experiencing decreased peer pressure.

112 • Decreasing pressure placed on me by my tutors
Figure 4.63 Decreasing pressure placed on me by my tutors (n=170)
Figure 4.63 indicates the level of agreement on the statement that computer assisted instruction
decreased pressure placed on them by their tutors; namely 25 (14.5%) strongly disagreed, 55
(32.0%) disagreed, 64 (37.2%) agreed, and 26 (15.1%) strongly agreed. There was 1 (0.6%) missing
value. The median score was 3.0 (agree). Although the majority of the respondents (52.3%) agreed
or strongly agreed, a minority (46.5%) disagreed or strongly disagreed. The respondents therefore
did not adequately benefit from decreased educator pressure.
• Enabling me to achieve my learning objectives through reading skills computer
packages
Figure 4.64 Enabling me to achieve my learning objectives through reading skills computer
packages (n=172)
Figure 4.64 indicates the level of agreement on the statement that computer assisted instruction
enabled them to achieve their learning objectives through reading skills computer packages; namely
15 (8.7%) strongly disagreed, 43 (25.0%) disagreed, 81 (47.1%) agreed, and 33 (15.1%) strongly
agreed. There was 1 (0.6%) missing value. The median score was 3.0 (agree). Although the majority
of the respondents (62.2%) agreed or strongly agreed, a substantial number (33.7%) disagreed or
113 strongly disagreed. Most respondents therefore benefited from improving their reading skills, but
this benefit needs to be extended to all learners.
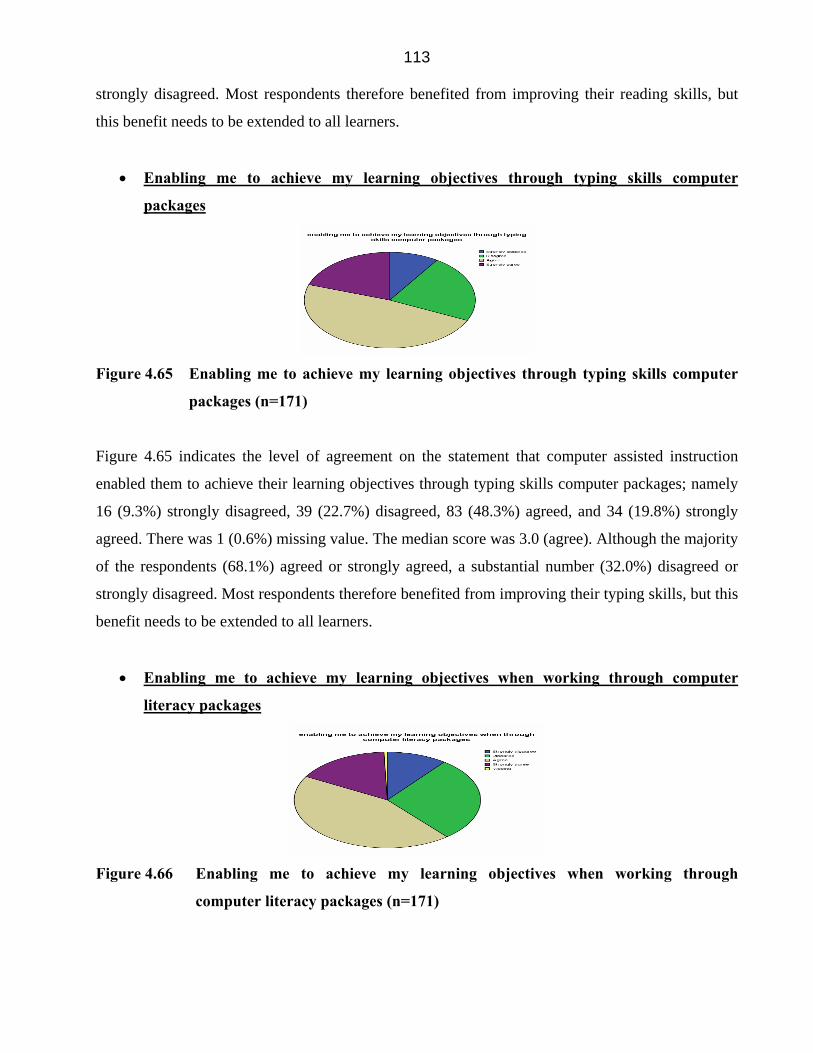
• Enabling me to achieve my learning objectives through typing skills computer
packages
Figure 4.65 Enabling me to achieve my learning objectives through typing skills computer
packages (n=171)
Figure 4.65 indicates the level of agreement on the statement that computer assisted instruction
enabled them to achieve their learning objectives through typing skills computer packages; namely
16 (9.3%) strongly disagreed, 39 (22.7%) disagreed, 83 (48.3%) agreed, and 34 (19.8%) strongly
agreed. There was 1 (0.6%) missing value. The median score was 3.0 (agree). Although the majority
of the respondents (68.1%) agreed or strongly agreed, a substantial number (32.0%) disagreed or
strongly disagreed. Most respondents therefore benefited from improving their typing skills, but this
benefit needs to be extended to all learners.
• Enabling me to achieve my learning objectives when working through computer
literacy packages
Figure 4.66 Enabling me to achieve my learning objectives when working through
computer literacy packages (n=171)

114 Figure 4.66 indicates the level of agreement on the statement that computer assisted instruction
enabled them to achieve their learning objectives when working through computer literacy
packages; namely 16 (9.3%) strongly disagreed, 49 (28.5%) disagreed, 76 (44.2%) agreed, and 28
(16.3%) strongly agreed. There was 1 (0.6%) missing value. The median score was 3.0 (disagree).
Although the majority of the respondents (60.5%) agreed or strongly agreed, a substantial number
(37.8%) disagreed or strongly disagreed. Most respondents therefore benefited from improving their
computer literacy, but this benefit needs to be extended to all learners.
• Enabling me to achieve my learning objectives through text-based course content
computer packages
Figure 4.67 Enabling me to achieve my learning objectives through text-based course
content computer packages (n=172)
Figure 4.67 indicates the level of agreement on the statement computer assisted instruction enabled
them to achieve their learning objectives through text-based course content computer packages;
namely 16 (9.3%) strongly disagreed, 54 (31.4%) disagreed, 70 (40.7%) agreed, and 32 (18.6%)
strongly agreed. The median score was 3.0 (agree). Although the majority of the respondents
(59.3%) agreed or strongly agreed, a substantial number (40.7%) disagreed or strongly disagreed.
The respondents therefore did not adequately benefit from achieving their learning objectives
through text-based course content computer packages.

115
• Enabling me to achieve my learning objectives through multimedia course content
computer packages
Figure 4.68 Enabling me to achieve my learning objectives through multimedia course
content computer packages (n=172)
Figure 4.68 indicates the level of agreement on the statement that computer assisted instruction
enabled them to achieve their learning objectives through multimedia course content computer
packages; namely 16 (9.3%) strongly disagreed, 60 (34.9%) disagreed, 71 (41.3%) agreed, and 25
(14.5%) strongly agreed. The median score was 3.0 (agree). Although the majority of the
respondents (55.8%) agreed or strongly agreed, a slight minority number (44.2%) disagreed or
strongly disagreed. The respondents therefore did not adequately benefit from achieving their
learning objectives through multimedia course content computer packages.
• Enabling me to achieve my learning objectives through text-based computer packages,
which provide scenarios that develop my problem-solving skills
Figure 4.69 Enabling me to achieve my learning objectives through text-based computer
packages which provide scenarios that develop my problem-solving skills
(n=172)

116 Figure 4.69 indicates the level of agreement on the statement that computer assisted instruction
enabled them to achieve their learning objectives through text-based computer packages which
provide scenarios that develop their problem-solving skills; namely 21 (12.2%) strongly disagreed,
46 (26.7%) disagreed, 82 (47.7%) agreed, and 23 (13.4%) strongly agreed. The median score was
3.0 (agree). Although the majority of the respondents (61.1%) agreed or strongly agreed, a
substantial number (38.9%) disagreed or strongly disagreed. Most respondents therefore benefited
from achieving their learning objectives through text-based problem oriented computer packages,
but this benefit needs to be extended to all learners.
• Enabling me to achieve my learning objectives through multimedia computer
packages, which provide scenarios that develop my problem-solving skills
Figure 4.70 Enabling me to achieve my learning objectives through multimedia computer
packages, which provide scenarios that develop my problem-solving skills
(n=172)
Figure 4.70 indicates the level of agreement on the statement that computer assisted instruction
enabled them to achieve their learning objectives through multimedia computer packages which
provide scenarios that develop their problem-solving skills; namely 23 (13.4%) strongly disagreed,
48 (27.9%) disagreed, 76 (44.2%) agreed, and 24 (14.0%) strongly agreed. There was 1 (0.6%)
missing value. The median score was 3.0 (agree). Although the majority of the respondents (58.2%)
agreed or strongly agreed, a slight minority (41.3%) disagreed or strongly disagreed. The
respondents therefore did not adequately benefit from achieving their learning objectives through
multimedia problem oriented computer packages.

117
• Enabling me to achieve my learning objectives through computer packages simulating
clinical situations, which develop my decision making skills
Figure 4.71 Enabling me to achieve my learning objectives through computer packages
simulating clinical situations, which develop my decision making skills (n=170)
Figure 4.71 indicates the level of agreement on the statement that computer assisted instruction
enabled them to achieve their learning objectives through computer packages simulating clinical
situations which develop their decision making skills; namely 16 (9.3%) strongly disagreed, 16
(39.0%) disagreed, 60 (34.9%) agreed, and 27 (15.7%) strongly agreed. There were 2 (1.2%)
missing values. The median score was 3.0 (disagree). Although the majority of the respondents
(50.6%) agreed or strongly agreed, a slight minority (48.3%) disagreed or strongly disagreed. The
respondents therefore did not adequately benefit from achieving their learning objectives through
computer packages simulating clinical situations, which develop their decision-making skills.
• Enabling me to achieve my learning objectives through computer-gaming packages
Figure 4.72 Enabling me to achieve my learning objectives through computer-gaming
packages (n=170)
Figure 4.72 indicates the level of agreement on the statement that computer assisted instruction
enabled them to achieve their learning objectives through computer-gaming packages; namely 16
(9.3%) strongly disagreed, 55 (32.0%) disagreed, 76 (44.2%) agreed, and 23 (13.4%) strongly
118 agreed. There were 2 (1.2%) missing values. The median score was 3.0 (agree). Although the
majority of the respondents (57.6%) agreed or strongly agreed, a slight minority (41.3%) disagreed
or strongly disagreed. The respondents therefore did not adequately benefit from achieving their
learning objectives through computer-gaming packages.
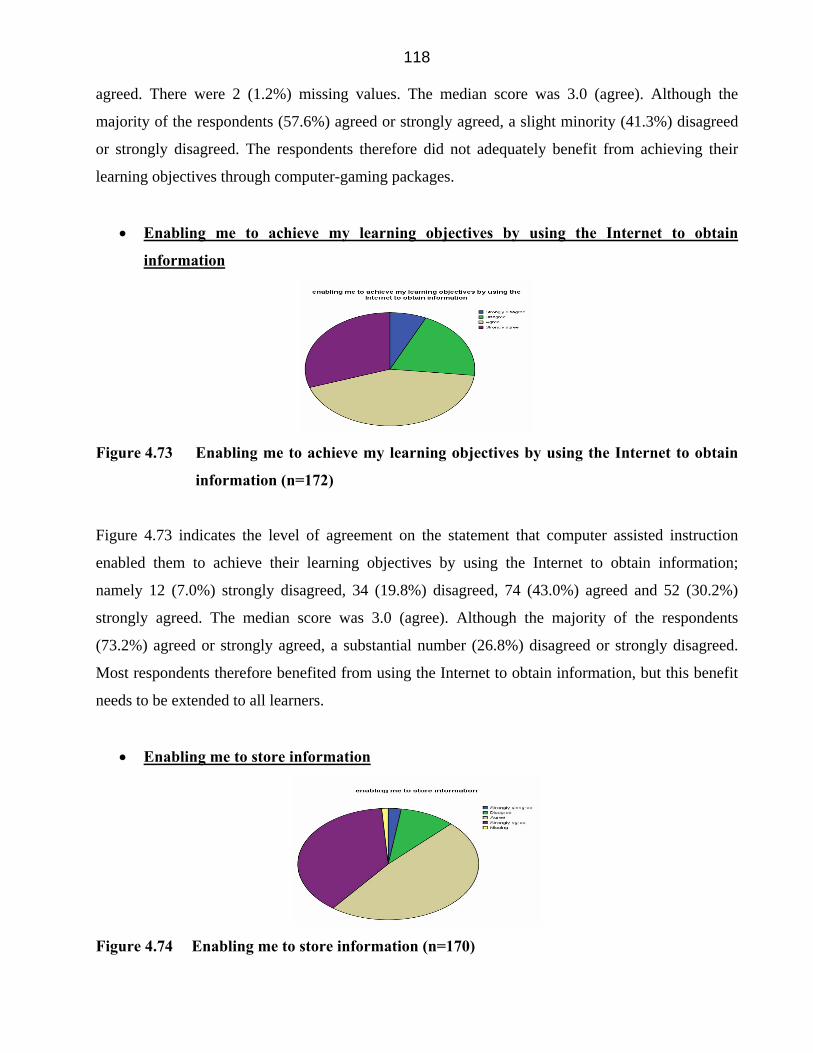
• Enabling me to achieve my learning objectives by using the Internet to obtain
information
Figure 4.73 Enabling me to achieve my learning objectives by using the Internet to obtain
information (n=172)
Figure 4.73 indicates the level of agreement on the statement that computer assisted instruction
enabled them to achieve their learning objectives by using the Internet to obtain information;
namely 12 (7.0%) strongly disagreed, 34 (19.8%) disagreed, 74 (43.0%) agreed and 52 (30.2%)
strongly agreed. The median score was 3.0 (agree). Although the majority of the respondents
(73.2%) agreed or strongly agreed, a substantial number (26.8%) disagreed or strongly disagreed.
Most respondents therefore benefited from using the Internet to obtain information, but this benefit
needs to be extended to all learners.
• Enabling me to store information
Figure 4.74 Enabling me to store information (n=170)

119 Figure 4.74 indicates the level of agreement on the statement that computer assisted instruction
enabled them to store information; namely 4 (2.3%) strongly disagreed, 17 (9.9%) disagreed, 83
(48.3%) agreed, and 66 (38.4%) strongly agreed. There were 3 (1.7%) missing values. The median
score was 3.0 (agree). A substantial majority of the respondents (86.7%) agreed or strongly agreed.
Respondents therefore generally benefited from computer assisted instruction with regard to storing
of information.
• Enabling me to retrieve stored information
Figure 4.75 Enabling me to retrieve stored information (n=171)
Figure 4.75 indicates the level of agreement on the statement that computer assisted instruction
enabled them to retrieve stored information; namely 6 (3.5%) strongly disagreed, 18 (10.5%)
disagreed, 77 (44.8%) agreed, and 70 (40.7%) strongly agreed. There was 1 (0.6%) missing value.
The median score was 3.0 (agree). A substantial majority of the respondents (85.5%) agreed or
strongly agreed. Respondents therefore generally benefited from computer assisted instruction with
regard to retrieval of stored information.
• Enabling me to be actively involved in learning
Figure 4.76 Enabling me to be actively involved in learning (n=171)

120 Figure 4.76 indicates the level of agreement on the statement that computer assisted instruction
enabled them to be actively involved in learning; namely 8 (4.7%) strongly disagreed, 22 (12.8%)
disagreed, 85 (49.4%) agreed, and 56 (32.6%) strongly agreed. There was 1 (0.6%) missing value.
The median score was 3.0 (agree). A substantial majority of the respondents (82.0%) agreed or
strongly agreed. Respondents therefore generally benefited from active involvement during
computer assisted instruction.
• Enabling me to be an independent learner
Figure 4.77 Enabling me to be an independent learner (n=171)
Figure 4.77 indicates the level of agreement on the statement that computer assisted instruction
enabled them to be an independent learner; namely 13 (7.6%) strongly disagreed, 20 (11.6%)
disagreed, 78 (45.3%) agreed, and 60 (34.9%) strongly agreed. There was 1 (0.6%) missing value.
The median score was 3.0 (agree). A substantial majority of the respondents (80.2%) agreed or
strongly agreed. Respondents therefore generally benefited from independence during computer
assisted instruction.
• Enabling me and other learners to engage in collaborative learning
Figure 4.78 Enabling me and other learners to engage in collaborative learning (n=169)

121 Figure 4.78 indicates the level of agreement on the statement that computer assisted instruction
enabled them and their peers to engage in collaborative learning; namely 13 (7.6%) strongly
disagreed, 47 (27.3%) disagreed, 76 (44.2%) agreed, and 33 (19.2%) strongly agreed. There were 3
(1.7%) missing values. The median score was 3.0 (agree). Although the majority of the respondents
(63.4%) agreed or strongly agreed, a substantial number (34.9%) disagreed or strongly disagreed.
The majority of respondents therefore benefited from engaging in collaborative learning, but this
benefit needs to be extended to all learners.
• Enabling me to be up to date with the latest developments in the health sciences
Figure 4.79 Enabling me to be up to date with the latest developments in the health sciences
(n=170)
Figure 4.79 indicates the level of agreement on the statement that computer assisted instruction
enabled them to be up to date with the latest developments in the health sciences, namely 12 (7.0 %)
strongly disagreed, 30 (17.4%) disagreed, 80 (46.5%) agreed, and 48 (27.9%) strongly agreed.
There were 2 (1.2%) missing values. The median score was 3.0 (agree). A substantial majority
(46.5%) of the respondents agreed. Respondents therefore generally benefited from remaining up to
date with the latest developments.
• Making it exciting to discover new knowledge
Figure 4.80 Making it exciting to discover new knowledge (n=171)

122
Figure 4.80 indicates the level of agreement on the statement that computer assisted instruction
made it exciting to discover new knowledge; namely 8 (4.7%) strongly disagreed, 23 (13.4%)
disagreed, 75 (43.6%) agreed, and 65 (37.8%) strongly agreed. There was 1 (0.6%) missing value.
The median score was 3.0 (agree). A substantial majority of the respondents (81.4%) agreed or
strongly agreed. Respondents therefore generally benefited from excitement associated with
discovering new knowledge.
• Relieving the boredom which I previously experienced during exposure to traditional
teaching
Figure 4.81 Relieving the boredom which I previously experienced during exposure to
traditional teaching (n=171)
Figure 4.81 indicates the level of agreement on the statement that computer assisted instruction
relieved the boredom, which they had previously experienced during exposure to traditional
teaching; namely 13 (8.0%) strongly disagreed, 31 (18.0%) disagreed, 73 (42.4%) agreed, and 54
(31.4%) strongly agreed. There was 1 (0.6%) missing value. The median score was 3.0 (agree).
Although the majority of the respondents (73.8%) agreed or strongly agreed, a reasonable number
(26.0%) disagreed or strongly disagreed. The majority of respondents therefore benefited from
decreased boredom, but this benefit needs to be extended to all learners.

123 ● Providing extended interaction with other learners through electronic communication
Figure 4.82 Providing extended interaction with other learners through electronic
communication (n=171)
Figure 4.82 indicates the level of agreement on the statement that computer assisted instruction
provided extended interaction with their peers through electronic communication; namely 17 (9.9%)
strongly disagreed, 62 (36.0%) disagreed, 70 (40.7%) agreed and 22 (12.8%) strongly agreed. There
was 1 (0.6%) missing value. The median score was 3.0 (agree). Although the majority of the
respondents (53.5%) agreed or strongly agreed, a slight minority (45.9%) disagreed or strongly
disagreed. The respondents therefore did not benefit adequately from extended communication with
peers.
• Providing extended interaction with my tutors through electronic communication
Figure 4.83 Providing extended interaction with my tutors through electronic
communication (n=172)
Figure 4.83 indicates the level of agreement on the statement that computer assisted instruction
provided extended interaction with their tutors through electronic communication; namely 21
(12.2%) strongly disagreed, 78 (45.3%) disagreed, 58 (33.7%) agreed, and 15 (8.7%) strongly
agreed. The median score was 3.0 (disagree). The majority of the respondents (57.5%) disagreed or
strongly disagreed and a slight minority (42.4%) agreed or strongly agreed. The respondents
therefore did not benefit adequately from electronic communication with their tutors.

124
• Providing extended interaction with field experts through electronic communication
Figure 4.84 Providing extended interaction with field experts through electronic
communication (n=171)
Figure 4.84 indicates the level of agreement on the statement that computer assisted instruction
provided extended interaction with field experts through electronic communication; namely 20
(11.6%) strongly disagreed, 63 (36.6%) disagreed, 63 (36.6%) agreed, and 25 (14.5%) strongly
agreed. There was 1 (0.6%) missing value. The median score was 3.0 (agree). Although the majority
of the respondents (51.1%) agreed or strongly agreed, a minority (48.2%) disagreed or strongly
disagreed. The respondents therefore did not adequately benefit from extended communication with
field experts.
• Providing extended interaction with the learning material
Figure 4.85 Providing extended interaction with the learning material (n=170)
Figure 4.85 indicates the level of agreement on the statement that computer assisted instruction
provided extended interaction with the learning material; namely 17 (9.9%) strongly disagreed, 41
(23.8%) disagreed, 77 (44.8%) agreed, and 35 (20.3%) strongly agreed. There were 2 (1.2%)
missing values. The median score was 3.0 (agree). Although the majority of the respondents
(65.1%) agreed or strongly agreed, a substantial number (33.7%) disagreed or strongly disagreed.

125 The majority of respondents therefore benefited from extended interaction with the learning
material, but this benefit needs to be extended to all learners.
• Enabling me to master the learning content
Figure 4.86 Enabling me to master the learning content (n=169)
Figure 4.86 indicates the level of agreement on the statement that computer assisted instruction
enabled them to master the learning content; namely 12 (7.0%) strongly disagreed, 42 (24.4%)
disagreed, 79 (45.9%) agreed, and 36 (20.9%) strongly agreed. There were 3 (1.7%) missing values.
The median score was 3.0 (agree). Although the majority of the respondents (66.8%) agreed or
strongly agreed, a substantial number (31.4%) disagreed or strongly disagreed. The majority of
respondents therefore benefited from mastering the learning content, but this benefit needs to be
extended to all learners.
• Enhancing my ability to remember what I have learnt
Figure 4.87 Enhancing my ability to remember what I have learnt (n=170)
Figure 4.87 indicates the level of agreement on the statement that computer assisted instruction
enhanced their ability to remember what they have learnt; namely 11 (6.4%) strongly disagreed, 30
(17.4%) disagreed, 86 (50.0%) agreed, and 43 (25.0%) strongly agreed. There were 2 (1.2%)

126 missing values. The median score was 3.0 (agree). A substantial majority of respondents (75.0%)
agreed or strongly agreed. Respondents therefore generally benefited from increased learning
retention.
• Enabling me to develop my typing skills
Figure 4.88 Enabling me to develop my typing skills (n=170)
Figure 4.88 indicates the level of agreement on the statement that computer assisted instruction
enabled them to develop their typing skills; namely 7 (4.1%) strongly disagreed, 19 (11.0%)
disagreed, 84 (48.8%) agreed and 60 (34.9%) strongly agreed. There were 2 (1.2%) missing values.
The median score was 3.0 (agree). A substantial majority of the respondents (83.7%) agreed or
strongly agreed. The respondents therefore generally benefited from increased typing skills.
• Enabling me to develop my computer skills
Figure 4.89 Enabling me to develop my computer skills (n=172)
Figure 4.89 indicates the level of agreement on the statement that computer assisted instruction
enabled them to develop their computer skills; namely 7 (4.1%) strongly disagreed, 16 (9.3%)
disagreed, 83 (48.3%) agreed, and 66 (38.4%) strongly agreed. The median score was 3.0 (agree). A
substantial majority of the respondents (86.7%) agreed or strongly agreed. The respondents
therefore generally benefited from increased computer skills.
127
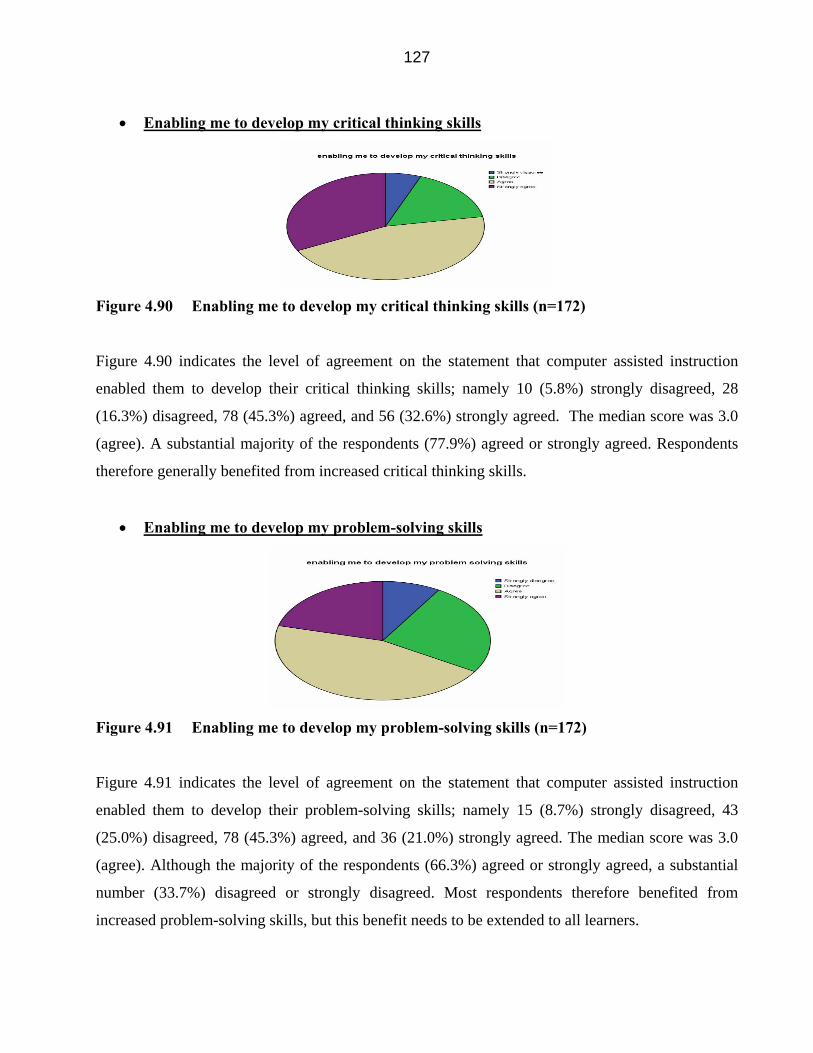
• Enabling me to develop my critical thinking skills
Figure 4.90 Enabling me to develop my critical thinking skills (n=172)
Figure 4.90 indicates the level of agreement on the statement that computer assisted instruction
enabled them to develop their critical thinking skills; namely 10 (5.8%) strongly disagreed, 28
(16.3%) disagreed, 78 (45.3%) agreed, and 56 (32.6%) strongly agreed. The median score was 3.0
(agree). A substantial majority of the respondents (77.9%) agreed or strongly agreed. Respondents
therefore generally benefited from increased critical thinking skills.
• Enabling me to develop my problem-solving skills
Figure 4.91 Enabling me to develop my problem-solving skills (n=172)
Figure 4.91 indicates the level of agreement on the statement that computer assisted instruction
enabled them to develop their problem-solving skills; namely 15 (8.7%) strongly disagreed, 43
(25.0%) disagreed, 78 (45.3%) agreed, and 36 (21.0%) strongly agreed. The median score was 3.0
(agree). Although the majority of the respondents (66.3%) agreed or strongly agreed, a substantial
number (33.7%) disagreed or strongly disagreed. Most respondents therefore benefited from
increased problem-solving skills, but this benefit needs to be extended to all learners.
128
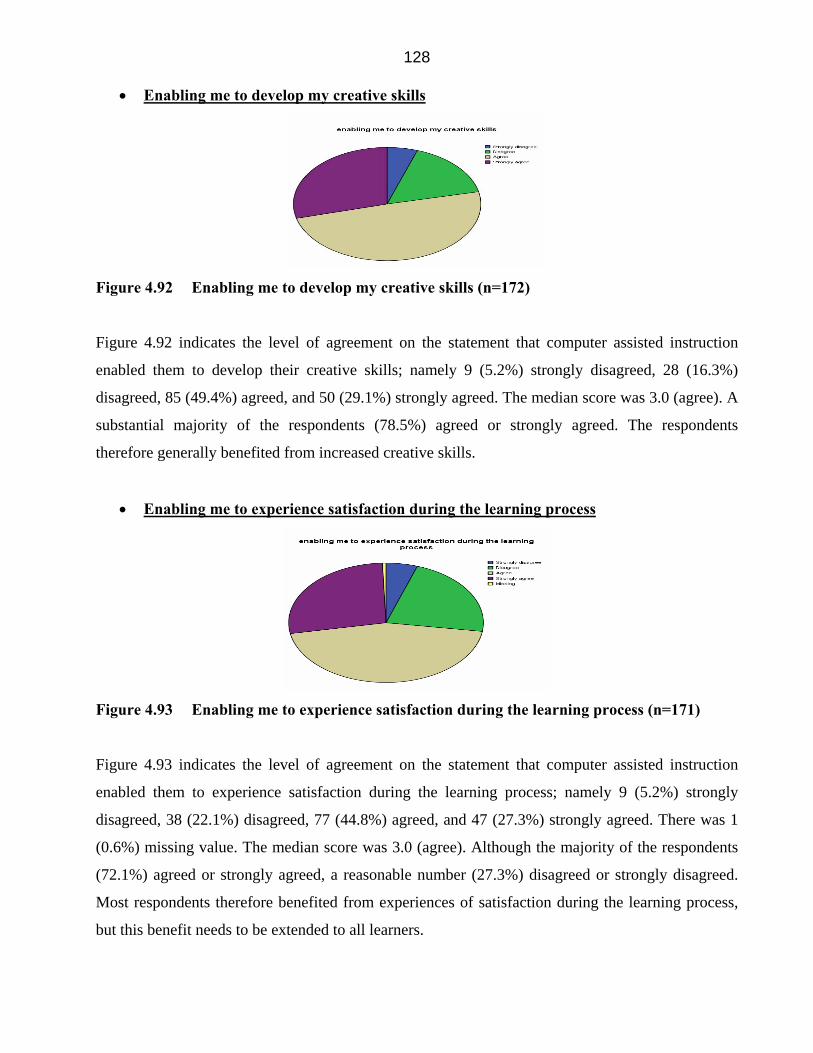
• Enabling me to develop my creative skills
Figure 4.92 Enabling me to develop my creative skills (n=172)
Figure 4.92 indicates the level of agreement on the statement that computer assisted instruction
enabled them to develop their creative skills; namely 9 (5.2%) strongly disagreed, 28 (16.3%)
disagreed, 85 (49.4%) agreed, and 50 (29.1%) strongly agreed. The median score was 3.0 (agree). A
substantial majority of the respondents (78.5%) agreed or strongly agreed. The respondents
therefore generally benefited from increased creative skills.
• Enabling me to experience satisfaction during the learning process
Figure 4.93 Enabling me to experience satisfaction during the learning process (n=171)
Figure 4.93 indicates the level of agreement on the statement that computer assisted instruction
enabled them to experience satisfaction during the learning process; namely 9 (5.2%) strongly
disagreed, 38 (22.1%) disagreed, 77 (44.8%) agreed, and 47 (27.3%) strongly agreed. There was 1
(0.6%) missing value. The median score was 3.0 (agree). Although the majority of the respondents
(72.1%) agreed or strongly agreed, a reasonable number (27.3%) disagreed or strongly disagreed.
Most respondents therefore benefited from experiences of satisfaction during the learning process,
but this benefit needs to be extended to all learners.
129
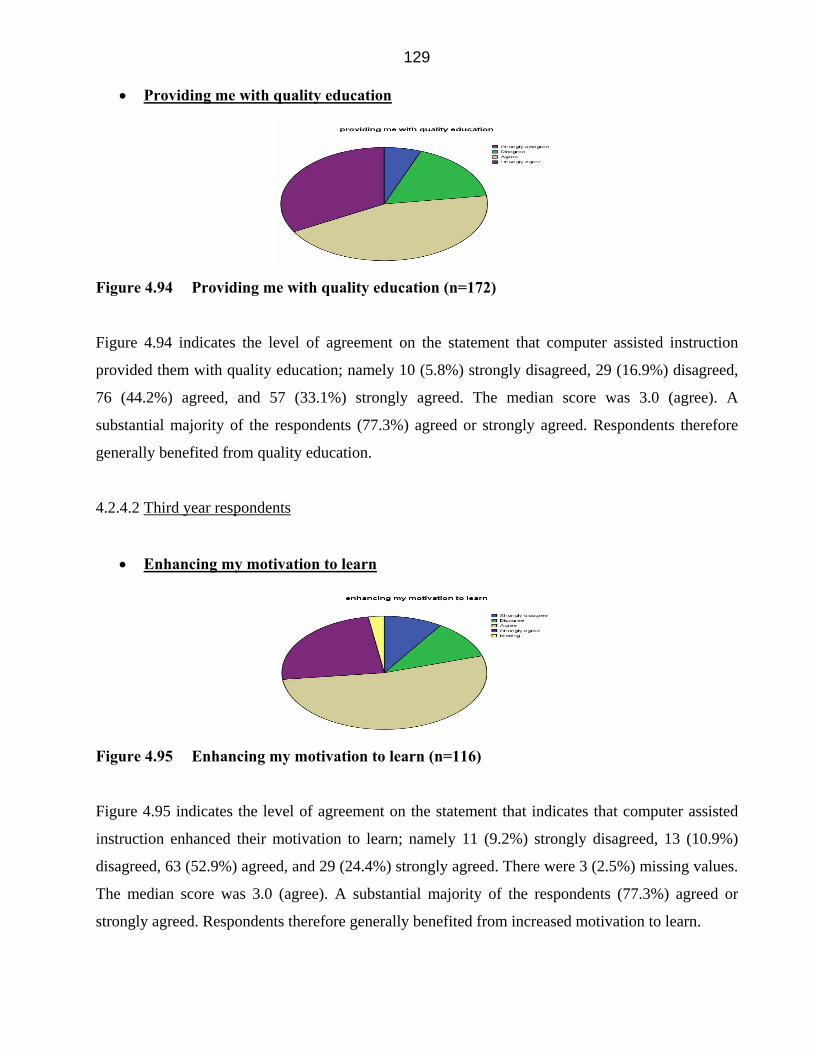
• Providing me with quality education
Figure 4.94 Providing me with quality education (n=172)
Figure 4.94 indicates the level of agreement on the statement that computer assisted instruction
provided them with quality education; namely 10 (5.8%) strongly disagreed, 29 (16.9%) disagreed,
76 (44.2%) agreed, and 57 (33.1%) strongly agreed. The median score was 3.0 (agree). A
substantial majority of the respondents (77.3%) agreed or strongly agreed. Respondents therefore
generally benefited from quality education.
4.2.4.2 Third year respondents
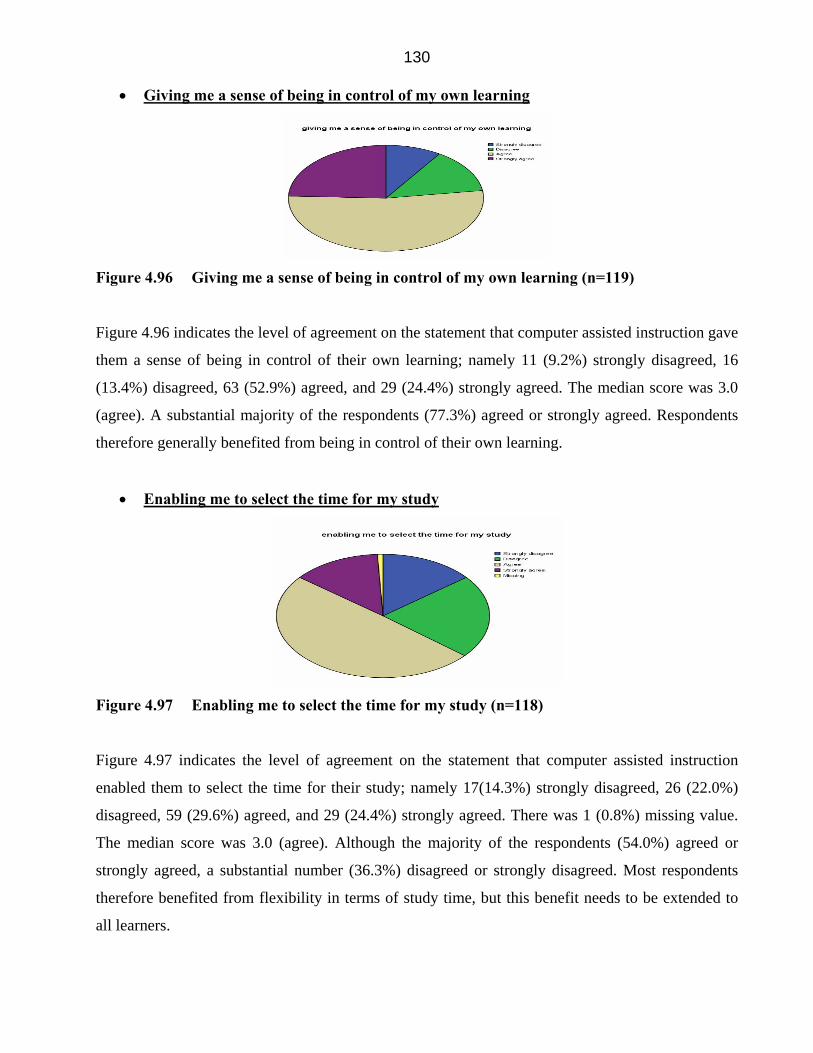
• Enhancing my motivation to learn
Figure 4.95 Enhancing my motivation to learn (n=116)
Figure 4.95 indicates the level of agreement on the statement that indicates that computer assisted
instruction enhanced their motivation to learn; namely 11 (9.2%) strongly disagreed, 13 (10.9%)
disagreed, 63 (52.9%) agreed, and 29 (24.4%) strongly agreed. There were 3 (2.5%) missing values.
The median score was 3.0 (agree). A substantial majority of the respondents (77.3%) agreed or
strongly agreed. Respondents therefore generally benefited from increased motivation to learn.
130
• Giving me a sense of being in control of my own learning
Figure 4.96 Giving me a sense of being in control of my own learning (n=119)
Figure 4.96 indicates the level of agreement on the statement that computer assisted instruction gave
them a sense of being in control of their own learning; namely 11 (9.2%) strongly disagreed, 16
(13.4%) disagreed, 63 (52.9%) agreed, and 29 (24.4%) strongly agreed. The median score was 3.0
(agree). A substantial majority of the respondents (77.3%) agreed or strongly agreed. Respondents
therefore generally benefited from being in control of their own learning.
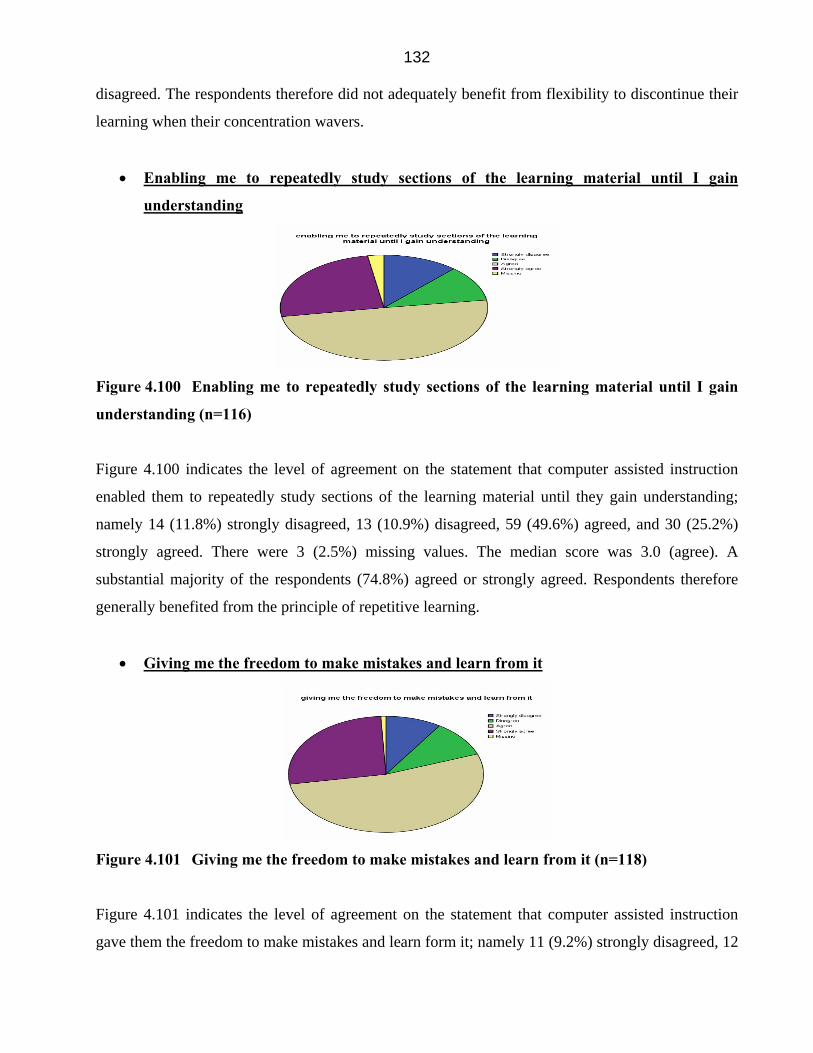
• Enabling me to select the time for my study
Figure 4.97 Enabling me to select the time for my study (n=118)
Figure 4.97 indicates the level of agreement on the statement that computer assisted instruction
enabled them to select the time for their study; namely 17(14.3%) strongly disagreed, 26 (22.0%)
disagreed, 59 (29.6%) agreed, and 29 (24.4%) strongly agreed. There was 1 (0.8%) missing value.
The median score was 3.0 (agree). Although the majority of the respondents (54.0%) agreed or
strongly agreed, a substantial number (36.3%) disagreed or strongly disagreed. Most respondents
therefore benefited from flexibility in terms of study time, but this benefit needs to be extended to
all learners.

131
• Enabling me to establish my own pace of learning
Figure 4.98 Enabling me to establish my own pace of learning (n=118)
Figure 4.98 indicates the level of agreement on the statement that computer assisted instruction
enabled them to establish their own pace of learning; namely 16 (13.4%) strongly disagreed, 27
(2.3%) disagreed, 54 (45.4%) agreed, and 21 (17.6%) strongly agreed. There was 1 (0.8%) missing
value. The median score was 3.0 (agree). Although the majority of the respondents (63.0%) agreed
or strongly agreed, a substantial number (36.3%) disagreed or strongly disagreed. Most respondents
therefore benefited from flexibility in terms of pace of learning, but this benefit needs to be
extended to all learners.
• Enabling me to discontinue learning when my concentration wavers
Figure 4.99 Enabling me to discontinue learning when my concentration wavers (n=118)
Figure 4.99 indicates the level of agreement on the statement that computer assisted instruction
enabled them to discontinue the learning when their concentration wavers; namely 19 (16.0%)
strongly disagreed, 35 (29.4%) disagreed, 46 (38.7%) agreed, and 18 (15.1%) strongly agreed.
There was 1 (0.8%) missing value. The median score was 3.0 (agree). Although the majority of the
respondents (53.8%) agreed or strongly agreed, a slight minority (45.4%) disagreed or strongly
132 disagreed. The respondents therefore did not adequately benefit from flexibility to discontinue their
learning when their concentration wavers.
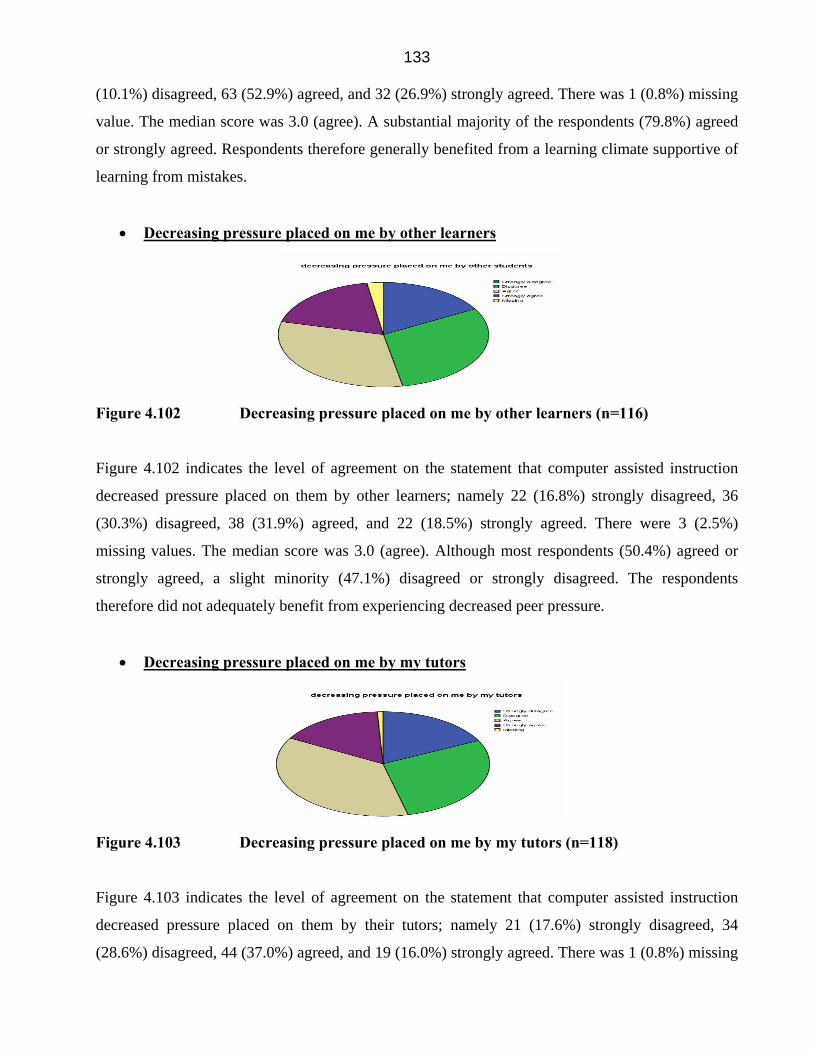
• Enabling me to repeatedly study sections of the learning material until I gain
understanding
Figure 4.100 Enabling me to repeatedly study sections of the learning material until I gain
understanding (n=116)
Figure 4.100 indicates the level of agreement on the statement that computer assisted instruction
enabled them to repeatedly study sections of the learning material until they gain understanding;
namely 14 (11.8%) strongly disagreed, 13 (10.9%) disagreed, 59 (49.6%) agreed, and 30 (25.2%)
strongly agreed. There were 3 (2.5%) missing values. The median score was 3.0 (agree). A
substantial majority of the respondents (74.8%) agreed or strongly agreed. Respondents therefore
generally benefited from the principle of repetitive learning.
• Giving me the freedom to make mistakes and learn from it
Figure 4.101 Giving me the freedom to make mistakes and learn from it (n=118)
Figure 4.101 indicates the level of agreement on the statement that computer assisted instruction
gave them the freedom to make mistakes and learn form it; namely 11 (9.2%) strongly disagreed, 12
133 (10.1%) disagreed, 63 (52.9%) agreed, and 32 (26.9%) strongly agreed. There was 1 (0.8%) missing
value. The median score was 3.0 (agree). A substantial majority of the respondents (79.8%) agreed
or strongly agreed. Respondents therefore generally benefited from a learning climate supportive of
learning from mistakes.
• Decreasing pressure placed on me by other learners
Figure 4.102 Decreasing pressure placed on me by other learners (n=116)
Figure 4.102 indicates the level of agreement on the statement that computer assisted instruction
decreased pressure placed on them by other learners; namely 22 (16.8%) strongly disagreed, 36
(30.3%) disagreed, 38 (31.9%) agreed, and 22 (18.5%) strongly agreed. There were 3 (2.5%)
missing values. The median score was 3.0 (agree). Although most respondents (50.4%) agreed or
strongly agreed, a slight minority (47.1%) disagreed or strongly disagreed. The respondents
therefore did not adequately benefit from experiencing decreased peer pressure.
• Decreasing pressure placed on me by my tutors
Figure 4.103 Decreasing pressure placed on me by my tutors (n=118)
Figure 4.103 indicates the level of agreement on the statement that computer assisted instruction
decreased pressure placed on them by their tutors; namely 21 (17.6%) strongly disagreed, 34
(28.6%) disagreed, 44 (37.0%) agreed, and 19 (16.0%) strongly agreed. There was 1 (0.8%) missing
134 value. The median score was 3.0 (agree). Although the majority of the respondents (53.0%) agreed
or strongly agreed, a slight minority (46.2%) disagreed or strongly disagreed. The respondents
therefore did not adequately benefit from decreased educator pressure.
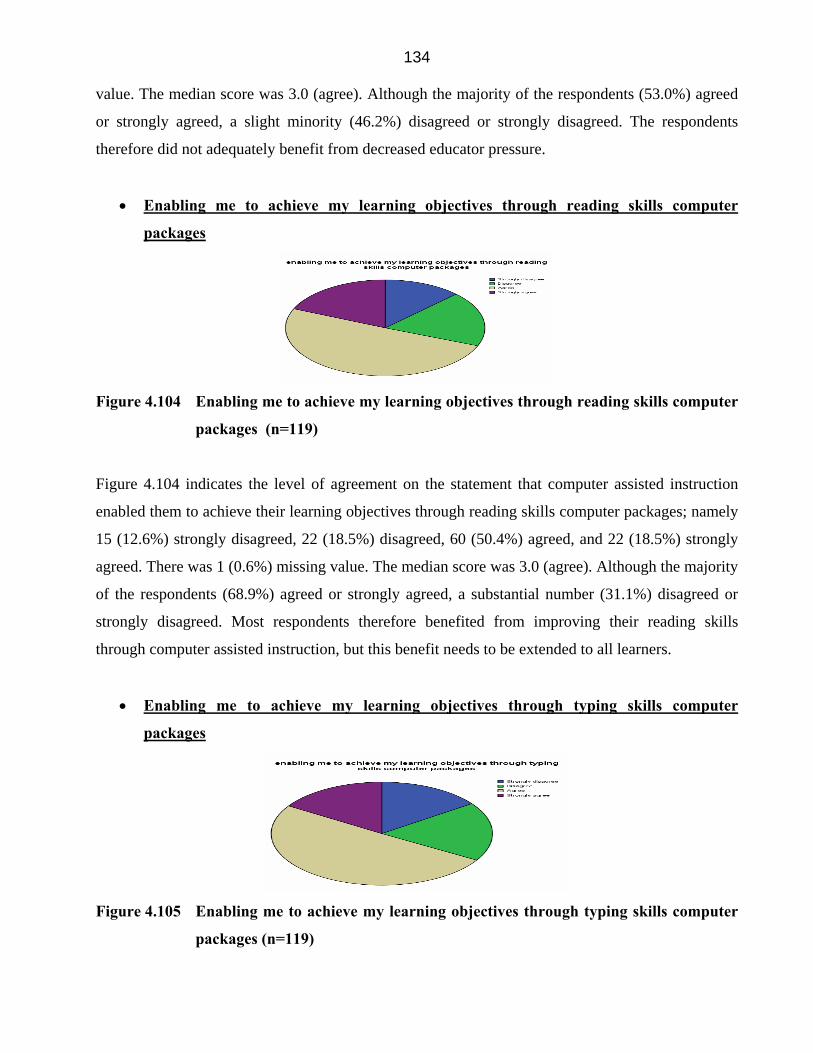
• Enabling me to achieve my learning objectives through reading skills computer
packages
Figure 4.104 Enabling me to achieve my learning objectives through reading skills computer
packages (n=119)
Figure 4.104 indicates the level of agreement on the statement that computer assisted instruction
enabled them to achieve their learning objectives through reading skills computer packages; namely
15 (12.6%) strongly disagreed, 22 (18.5%) disagreed, 60 (50.4%) agreed, and 22 (18.5%) strongly
agreed. There was 1 (0.6%) missing value. The median score was 3.0 (agree). Although the majority
of the respondents (68.9%) agreed or strongly agreed, a substantial number (31.1%) disagreed or
strongly disagreed. Most respondents therefore benefited from improving their reading skills
through computer assisted instruction, but this benefit needs to be extended to all learners.
• Enabling me to achieve my learning objectives through typing skills computer
packages
Figure 4.105 Enabling me to achieve my learning objectives through typing skills computer
packages (n=119)

135 Figure 4.105 indicates the level of agreement on the statement that computer assisted instruction
enabled them to achieve their learning objectives through typing skills computer packages; namely
18 (15.1%) strongly disagreed, 22 (18.5%) disagreed, 60 (50.4%) agreed, and 19 (16.0%) strongly
agreed. The median score was 3.0 (agree). Although the majority of the respondents (66.4%) agreed
or strongly agreed, a substantial number (33.6%) disagreed or strongly disagreed. Most respondents
therefore benefited from improving their typing skills through computer assisted instruction, but this
benefit needs to be extended to all learners.
• Enabling me to achieve my learning objectives when working through computer
literacy packages
Figure 4.106 Enabling me to achieve my learning objectives when working through
computer literacy packages (n=119)
Figure 4.106 indicates the level of agreement on the statement that computer assisted instruction
enabled them to achieve their learning objectives when working through computer literacy
packages; namely 16 (13.4%) strongly disagreed, 20 (16.8%) disagreed, 66 (56.5%) agreed, and 17
(14.3%) strongly agreed. The median score was 3.0 (agree). Although the majority of the
respondents (70.8%) agreed or strongly agreed, a substantial number (30.2%) disagreed or strongly
disagreed. Most respondents therefore benefited from improving their computer literacy through
computer assisted instruction, but this benefit needs to be extended to all learners.

136
• Enabling me to achieve my learning objectives through text-based course content
computer packages
Figure 4.107 Enabling me to achieve my learning objectives through text-based course
content computer packages (n=119)
Figure 4.107 indicates the level of agreement on the statement that computer assisted instruction
enabled them to achieve their learning objectives through text-based course content computer
packages; namely 15 (12.6%) strongly disagreed, 31 (26.1%) disagreed, 61 (51.3%) agreed, and 12
(10.1%) strongly agreed. The median score was 3.0 (agree). Although the majority of the
respondents (61.4%) agreed or strongly agreed, a substantial number (38.7%) disagreed or strongly
disagreed. Most respondents therefore benefited from achieving their learning objectives through
text-based course content computer packages, but this benefit needs to be extended to all learners.
• Enabling me to achieve my learning objectives through multimedia course content
computer packages
Figure 4.108 Enabling me to achieve my learning objectives through multimedia course
content computer packages (n=119)
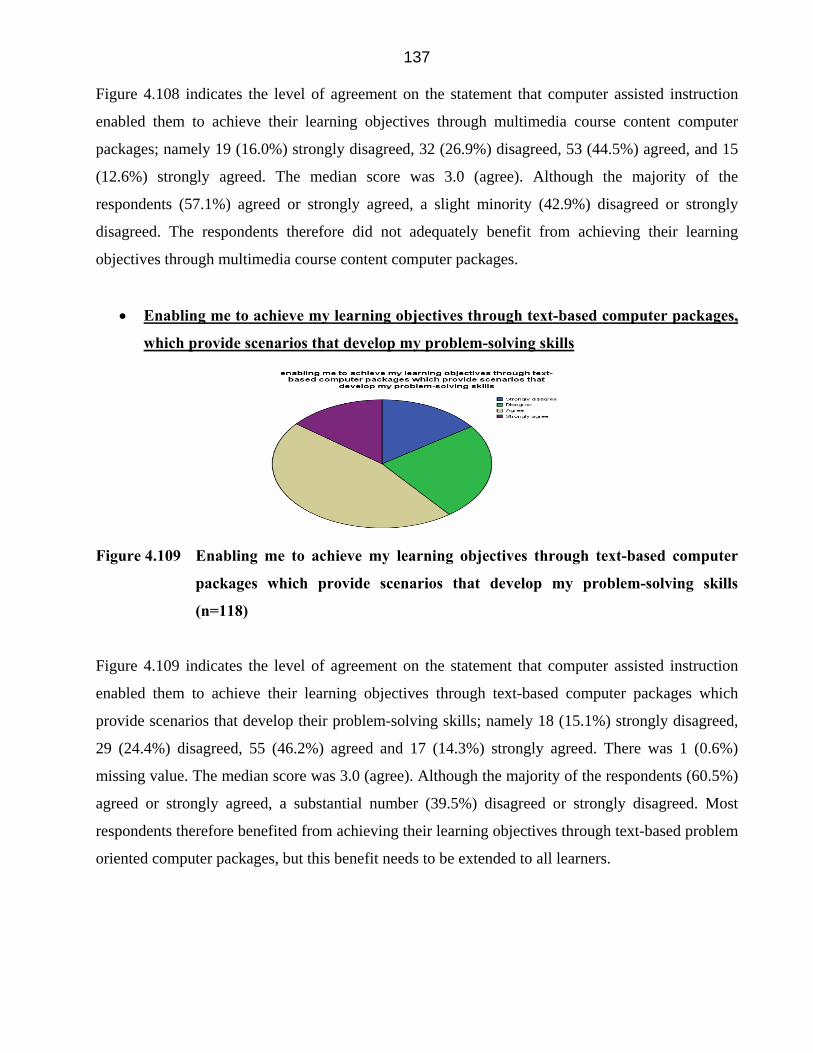
137 Figure 4.108 indicates the level of agreement on the statement that computer assisted instruction
enabled them to achieve their learning objectives through multimedia course content computer
packages; namely 19 (16.0%) strongly disagreed, 32 (26.9%) disagreed, 53 (44.5%) agreed, and 15
(12.6%) strongly agreed. The median score was 3.0 (agree). Although the majority of the
respondents (57.1%) agreed or strongly agreed, a slight minority (42.9%) disagreed or strongly
disagreed. The respondents therefore did not adequately benefit from achieving their learning
objectives through multimedia course content computer packages.
• Enabling me to achieve my learning objectives through text-based computer packages,
which provide scenarios that develop my problem-solving skills
Figure 4.109 Enabling me to achieve my learning objectives through text-based computer
packages which provide scenarios that develop my problem-solving skills
(n=118)
Figure 4.109 indicates the level of agreement on the statement that computer assisted instruction
enabled them to achieve their learning objectives through text-based computer packages which
provide scenarios that develop their problem-solving skills; namely 18 (15.1%) strongly disagreed,
29 (24.4%) disagreed, 55 (46.2%) agreed and 17 (14.3%) strongly agreed. There was 1 (0.6%)
missing value. The median score was 3.0 (agree). Although the majority of the respondents (60.5%)
agreed or strongly agreed, a substantial number (39.5%) disagreed or strongly disagreed. Most
respondents therefore benefited from achieving their learning objectives through text-based problem
oriented computer packages, but this benefit needs to be extended to all learners.

138
• Enabling me to achieve my learning objectives through multimedia computer
packages, which provide scenarios that develop my problem-solving skills
Figure 4.110 Enabling me to achieve my learning objectives through multimedia computer
packages, which provide scenarios that develop my problem-solving skills
(n=119)
Figure 4.110 indicates the level of agreement on the statement that computer assisted instruction
enabled them to achieve their learning objectives through multimedia computer packages, which
provide scenarios that develop their problem-solving skills; namely 19 (16.0%) strongly disagreed,
30 (25.2%) disagreed, 55 (46.2%) agreed, and 15 (12.6%) strongly agreed. The median score was
3.0 (agree). Although the majority of the respondents (58.8%) agreed or strongly agreed, a slight
minority (41.2%) disagreed or strongly disagreed. The respondents therefore did not adequately
benefit from achieving their learning objectives through multimedia problem-oriented computer
packages.
• Enabling me to achieve my learning objectives through computer packages simulating
clinical situations, which develop my decision-making skills
Figure 4.111 Enabling me to achieve my learning objectives through computer packages
simulating clinical situations, which develop my decision-making skills (n=118)

139 Figure 4.111 indicates the level of agreement on the statement that that computer assisted
instruction enabled them to achieve their learning objectives through computer packages simulating
clinical situations, which develop their decision making skills; namely 16 (13.4%) strongly
disagreed, 34 (28.6%) disagreed, 55 (46.2%) agreed, and 13 (10.9%) strongly agreed. There was 1
(0.8%) missing value. The median score was 3.0 (agree). Although the majority of the respondents
(57.1%) agreed or strongly agreed, a slight minority (42.0%) disagreed or strongly disagreed. The
respondents therefore did not adequately benefit from achieving their learning objectives through
computer packages simulating clinical situations, which develop their decision-making skills.
• Enabling me to achieve my learning objectives through computer-gaming packages
Figure 4.112 Enabling me to achieve my learning objectives through computer-gaming
packages (n=119)
Figure 4.112 indicates the level of agreement on the statement that computer assisted instruction
enabled them to achieve their learning objectives through computer-gaming packages; namely 12
(10.1%) strongly disagreed, 40 (33.6%) disagreed, 51 (42.9%) agreed, and 15 (12.6%) strongly
agreed. There was 1 (0.8%) missing value. The median score was 3.0 (agree). Although the majority
of the respondents (55.5%) agreed or strongly agreed, a slight minority (43.7%) disagreed or
strongly disagreed. The respondents therefore did not adequately benefit from achieving their
learning objectives through computer-gaming packages.

140
• Enabling me to achieve my learning objectives by using the Internet to obtain
information
Figure 4.113 Enabling me to achieve my learning objectives by using the Internet to obtain
information (n=119)
Figure 4.113 indicates the level of agreement on the statement that computer assisted instruction
enabled them to achieve their learning objectives by using the Internet to obtain information;
namely 9 (7.6%) strongly disagreed, 10 (8.4%) disagreed, 56 (47.1%) agreed, and 44 (37.0%)
strongly agreed. The median score was 3.0 (agree). The majority of the respondents (84.1%) agreed
or strongly agreed. The respondents therefore generally benefited from using the Internet to obtain
information.
• Enabling me to store information
Figure 4.114 Enabling me to store information (n=118)
Figure 4.114 indicates the level of agreement on the statement that computer assisted instruction
enabled them to store information; namely 7 (5.9%) strongly disagreed, 9 (7.6%) disagreed, 55
(46.2%) agreed, and 47 (39.5%) strongly agreed. There was 1 (0.8%) missing value. The median
score was 3.0 (agree). A substantial majority of the respondents (85.7%) agreed or strongly agreed.

141 Respondents therefore generally benefited from computer assisted instruction with regard to storing
of information.
• Enabling me to retrieve stored information
Figure 4.115 Enabling me to retrieve stored information (n=118)
Figure 4.115 indicates the level of agreement on the statement that computer assisted instruction
enabled them to retrieve stored information; namely 8 (6.7%) strongly disagreed, 8 (6.7%)
disagreed, 51 (42.9%) agreed, and 51 (42.9%) strongly agreed. There was 1 (0.8%) missing value.
The median score was 3.0 (agree). A substantial majority of the respondents (85.8%) agreed and
strongly agreed. Respondents therefore generally benefited from computer assisted instruction with
regard to retrieval of stored information.
• Enabling me to be actively involved in learning
Figure 4.116 Enabling me to be actively involved in learning (n=118)
Figure 4.116 indicates the level of agreement on the statement that computer assisted instruction
enabled them to be actively involved in learning; namely 8 (6.7%) strongly disagreed, 14 (11.8%)
disagreed, 55 (46.2%) agreed, and 41 (34.5%) strongly agreed. There was 1 (0.8%) missing value.
The median score was 3.0 (agree). A substantial majority of the respondents (80.7%) agreed or

142 strongly agreed. Respondents therefore generally benefited from active involvement during
computer assisted instruction.
• Enabling me to be an independent learner
Figure 4.117 Enabling me to be an independent learner (n=118)
Figure 4.117 indicates the level of agreement on the statement that computer assisted instruction
enabled them to be independent learners; namely 8 (6.7%) strongly disagreed, 12 (10.1%)
disagreed, 52 (43.7%) agreed, and 46 (38.7%) strongly agreed. There was 1 (0.8%) missing value.
The median score was 3.0 (agree). A substantial majority of the respondents (82.4%) agreed or
strongly agreed. Respondents therefore generally benefited from independence during computer
assisted instruction.
• Enabling me and other learners to engage in collaborative learning
Figure 4.118 Enabling me and other learners to engage in collaborative learning (n=119)
Figure 4.118 indicates the level of agreement on the statement that computer assisted instruction
enabled them and other learners to engage in collaborative learning; namely 11 (9.2%) strongly
disagreed, 23 (19.3%) disagreed, 54 (45.4%) agreed, and 31 (26.1%) strongly agreed. The median
score was 3.0 (agree). Although the majority of the respondents (71.5%) agreed or strongly agreed,

143 a substantial number (28.5%) disagreed or strongly disagreed. The majority of respondents therefore
benefited from engaging in collaborative learning, but this benefit needs to be extended to all
learners.
• Enabling me to be up to date with the latest developments in the health sciences
Figure 4.119 Enabling me to be up to date with the latest developments in the health sciences
(n=119)
Figure 4.119 indicates the level of agreement on the statement that computer assisted instruction
enabled them to date with the latest developments in the health sciences; namely 6 (5.0%) strongly
disagreed, 13 (10.9%) disagreed, 61 (51.3%) agreed, and 39 (32.8%) strongly agreed. The median
score was 3.0 (agree). A substantial majority of the respondents (84.1%) agreed or strongly agreed.
Respondents therefore generally benefited from remaining up to date with the latest developments.
• Making it exciting to discover new knowledge
Figure 4.120 Making it exciting to discover new knowledge (n=117)
Figure 4.120 indicates the level of agreement on the statement that computer assisted instruction
made it exciting to discover new knowledge; namely 5 (4.2%) strongly disagreed, 11 (9.2%)
disagreed, 52 (43.7%) agreed, and 49 (41.2%) strongly agreed. There were 2 (1.7%) missing values.

144 The median score was 3.0 (agree). A substantial majority of the respondents (84.9%) agreed or
strongly agreed. Respondents therefore generally benefited from excitement associated with
discovering new knowledge.
• Relieving the boredom which I previously experienced during exposure to traditional
teaching
Figure 4.121 Relieving the boredom which I previously experienced during exposure to
traditional teaching (n=119)
Figure 4.121 indicates the level of agreement on the statement that that computer assisted
instruction relieved the boredom, which they previously experienced during exposure to traditional
teaching; namely 9 (7.6%) strongly disagreed, 18 (15.1%) disagreed, 56 (47.1%) agreed, and 36
(30.3%) strongly agreed. The median score was 3.0 (agree). A substantial majority of the
respondents (77.4%) agreed or strongly agreed. The respondents therefore generally benefited from
decreased boredom.
• Providing extended interaction with other students through electronic communication
Figure 4.122 Providing extended interaction with other learners through electronic
communication (n=118)
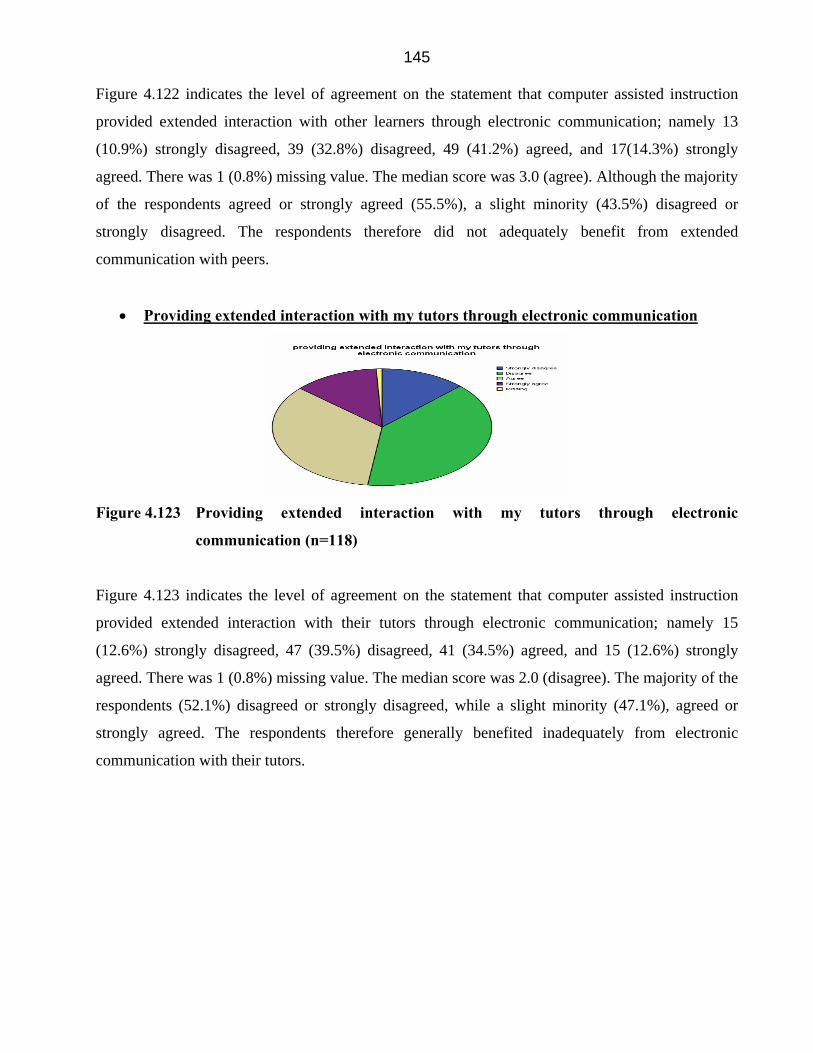
145 Figure 4.122 indicates the level of agreement on the statement that computer assisted instruction
provided extended interaction with other learners through electronic communication; namely 13
(10.9%) strongly disagreed, 39 (32.8%) disagreed, 49 (41.2%) agreed, and 17(14.3%) strongly
agreed. There was 1 (0.8%) missing value. The median score was 3.0 (agree). Although the majority
of the respondents agreed or strongly agreed (55.5%), a slight minority (43.5%) disagreed or
strongly disagreed. The respondents therefore did not adequately benefit from extended
communication with peers.
• Providing extended interaction with my tutors through electronic communication
Figure 4.123 Providing extended interaction with my tutors through electronic
communication (n=118)
Figure 4.123 indicates the level of agreement on the statement that computer assisted instruction
provided extended interaction with their tutors through electronic communication; namely 15
(12.6%) strongly disagreed, 47 (39.5%) disagreed, 41 (34.5%) agreed, and 15 (12.6%) strongly
agreed. There was 1 (0.8%) missing value. The median score was 2.0 (disagree). The majority of the
respondents (52.1%) disagreed or strongly disagreed, while a slight minority (47.1%), agreed or
strongly agreed. The respondents therefore generally benefited inadequately from electronic
communication with their tutors.

146
• Providing extended interaction with field experts through electronic communication
Figure 4.124 Providing extended interaction with field experts through electronic
communication (n=118)
Figure 4.124 indicates the level of agreement on the statement that computer assisted instruction
provided extended interaction with field experts through electronic communication; namely 11
(9.2.%) strongly disagreed, 42 (35.3%) disagreed, 44 (37.0%) agreed, and 21 (17.6%) strongly
agreed. There was 1 (0.8%) missing value. The median score was 3.0 (agree). Although the majority
of the respondents (54.6%) agreed or strongly agreed, a slight minority (44.5%) disagreed or
strongly disagreed. The respondents therefore generally benefited inadequately from extended
communication with field experts, and this benefit needs to be extended to all learners.
• Providing extended interaction with the learning material
Figure 4.125 Providing extended interaction with the learning material (n=117)
Figure 4.125 indicates the level of agreement on the statement that computer assisted instruction
provided extended interaction with the learning material; namely 7 (5.9%) strongly disagreed, 22
(18.5%) disagreed, 62 (52.1%) agreed, and 26 (21.8%) strongly agreed. There were 2 (1.7%)
missing values. The median score was 3.0 (agree). The majority of the respondents (73.9%) agreed

147 or strongly agreed. Respondents therefore generally benefited from extended interaction with the
learning material.
• Enabling me to master the learning content
Figure 4.126 Enabling me to master the learning content (n=117)
Figure 4.126 indicates the level of agreement on the statement that computer assisted instruction
enabled them to master the learning content; namely 8 (6.7%) strongly disagreed, 23 (19.3%)
disagreed, 59 (49.6%) agreed and 27 (22.7%) strongly agreed. There were 2 (1.7%) missing values.
The median score was 3.0 (agree). Although the majority of the respondents (72.3%) agreed or
strongly agreed, a reasonable number (26.0%) disagreed or strongly disagreed. The majority of
respondents therefore benefited from mastering the learning content, but this benefit needs to be
extended to all learners.
• Enhancing my ability to remember what I have learnt
Figure 4.127 Enhancing my ability to remember what I have learnt (n=119)
Figure 4.127 indicates the level of agreement on the statement that computer assisted instruction
enhanced their ability to remember what they have learnt; namely 8 (8.7%) strongly disagreed, 17
(14.3%) disagreed, 61 (51.3%) agreed, and 33 (27.7%) strongly agreed. The median score was 3.0

148 (agree). A substantial majority of the respondents (79.0%) agreed or strongly agreed. Respondents
therefore generally benefited from increased learning retention.
• Enabling me to develop my typing skills
Figure 4.128 Enabling me to develop my typing skills (n=119)
Figure 4.128 indicates the level of agreement on the statement that computer assisted instruction
enabled them to develop their typing skills; namely 6 (5.0%) strongly disagreed, 8 (6.7%) disagreed,
63 (52.9%) agreed, and 42 (35.3%) strongly agreed. The median score was 3.0 (agree). A
substantial majority of the respondents (88.2%) agreed or strongly agreed. Respondents therefore
generally benefited from increased typing skills.
• Enabling me to develop my computer skills
Figure 4.129 Enabling me to develop my computer skills (n=119)
Figure 4.129 indicates the level of agreement on the statement that computer assisted instruction
enabled them to develop their computer skills; namely 4 (3.4%) strongly disagreed, 7 (5.9%)
disagreed, 64 (53.8%) agreed, and 44 (37.0%) strongly agreed. The median score was 3.0 (agree). A
substantial majority of the respondents (90.8%) agreed or strongly agreed. The respondents
therefore generally benefited from increased computer skills.

149
• Enabling me to develop my critical thinking skills
Figure 4.130 Enabling me to develop my critical thinking skills (n=119)
Figure 4.130 indicates the level of agreement on the statement that computer assisted instruction,
enabled them to develop their critical thinking skills; namely, 8 (6.7%) strongly disagreed, 14
(11.8%) disagreed, 62 (52.1%) agreed, and 35 (29.4%) strongly agreed. The median score was 3.0
(agree). A substantial majority of the respondents (81.5%) agreed or strongly agreed. Respondents
therefore generally benefited from increased critical thinking skills.
• Enabling me to develop my problem-solving skills
Figure 4.131 Enabling me to develop my problem–solving skills (n=119)
Figure 4.131 indicates the level of agreement on the statement that computer assisted instruction,
enabled them to develop their problem-solving skills; namely 10 (8.4%) strongly disagreed, 17
(14.3%) disagreed, 64 (53.8%) agreed, and 28 (23.5%) strongly agreed. The median score was 3.0
(agree). A substantial majority of the respondents (77.3%) agreed or strongly agreed. The
respondents therefore generally benefited from increased problem-solving skills.

150
• Enabling me to develop my creative skills
Figure 4.132 Enabling me to develop my creative skills (n=119)
Figure 4.132 indicates the level of agreement on the statement that computer assisted instruction
enabled them to develop their creative skills; namely 8 (6.7%) strongly disagreed, 20 (16.8%)
disagreed, 59 (49.6%) agreed, and 32 (26.9%) strongly agreed. The median score was 3.0 (agree). A
substantial majority of the respondents (76.5%) agreed or strongly agreed. Respondents therefore
generally benefited from increased creative skills.
• Enabling me to experience satisfaction during the learning process
Figure 4.133 Enabling me to experience satisfaction during the learning process (n=119)
Figure 4.133 indicates the level of agreement on the statement that computer assisted instruction
enabled them to experience satisfaction during the learning process; namely 10 (8.4%) strongly
disagreed, 16 (13.4%) disagreed, 62 (52.1%) agreed, and 31 (26.1%) strongly agreed. The median
score was 3.0 (agree). A substantial majority of the respondents (78.2%) agreed or strongly agreed.
Most respondents therefore generally benefited from experiences of satisfaction during the learning
process.
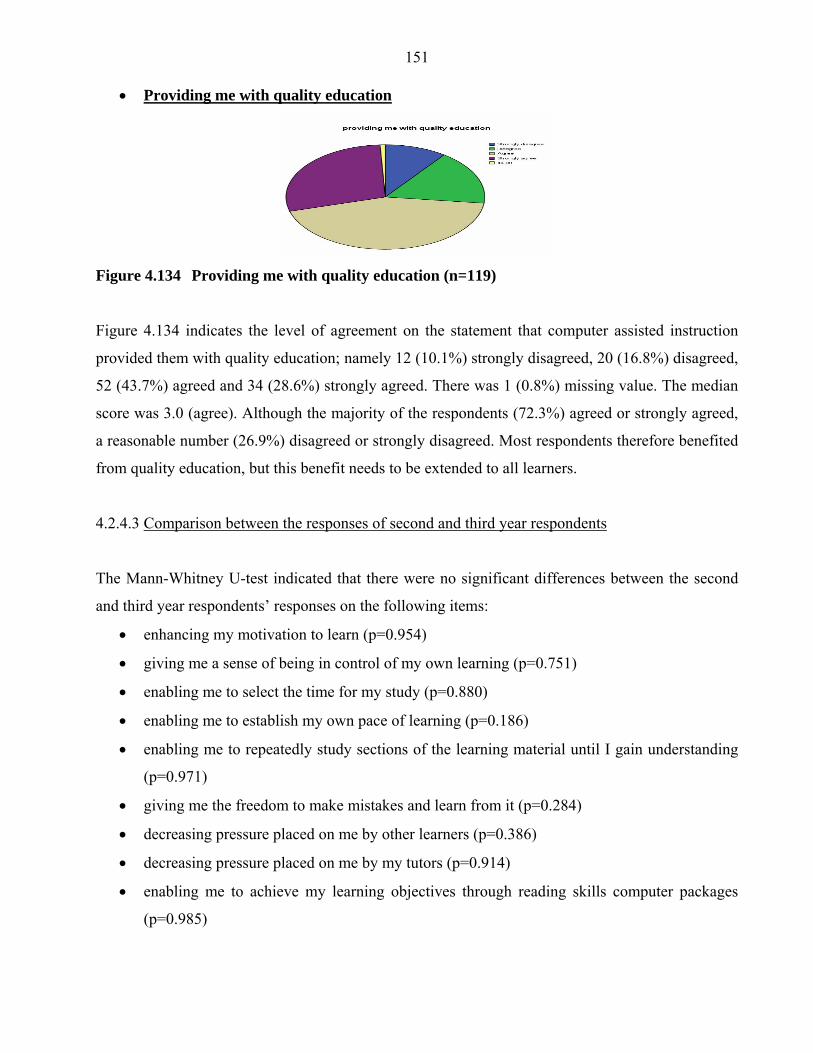
151
• Providing me with quality education
Figure 4.134 Providing me with quality education (n=119)
Figure 4.134 indicates the level of agreement on the statement that computer assisted instruction
provided them with quality education; namely 12 (10.1%) strongly disagreed, 20 (16.8%) disagreed,
52 (43.7%) agreed and 34 (28.6%) strongly agreed. There was 1 (0.8%) missing value. The median
score was 3.0 (agree). Although the majority of the respondents (72.3%) agreed or strongly agreed,
a reasonable number (26.9%) disagreed or strongly disagreed. Most respondents therefore benefited
from quality education, but this benefit needs to be extended to all learners.
4.2.4.3 Comparison between the responses of second and third year respondents
The Mann-Whitney U-test indicated that there were no significant differences between the second
and third year respondents’ responses on the following items:
• enhancing my motivation to learn (p=0.954)
• giving me a sense of being in control of my own learning (p=0.751)
• enabling me to select the time for my study (p=0.880)
• enabling me to establish my own pace of learning (p=0.186)
• enabling me to repeatedly study sections of the learning material until I gain understanding
(p=0.971)
• giving me the freedom to make mistakes and learn from it (p=0.284)
• decreasing pressure placed on me by other learners (p=0.386)
• decreasing pressure placed on me by my tutors (p=0.914)
• enabling me to achieve my learning objectives through reading skills computer packages
(p=0.985)

152
• enabling me to achieve my learning objectives through typing skills computer packages
(p=0.382)
• enabling me to achieve my learning objectives when through computer literacy packages
(p=0.522)
• enabling me to achieve my learning objectives through text-based course content computer
packages (p=0.446)
• enabling me to achieve my learning objectives through multimedia course content computer
packages (p=0.643)
• enabling me to achieve my learning objectives through text-based computer packages which
provide scenarios that develop my problem-solving skills (p=0.879)
• enabling me to achieve my learning objectives through multimedia computer packages
which provide scenarios that develop my problem-solving skills (p=0.734)
• enabling me to achieve my learning objectives through computer packages simulating
clinical situations which develop my decision-making skills (p=0.963)
• enabling me to achieve my learning objectives through computer-gaming packages
(p=0.692)
• enabling me to achieve my learning objectives by using the Internet to obtain information
(p=0.073)
• enabling me to obtain information (p=0.633)
• enabling me to store information(p=0.966)
• enabling me to retrieve stored information (p=0.780)
• enabling me to be actively involved in learning (p=0.926)
• enabling me to be an independent learner (p=0.468)
• enabling me and my other students to engage in collaborative learning (p=0.181)
• enabling me to be up to date with the latest developments in the health sciences (p=0.0.134)
• making it exciting to discover new knowledge (p=0.365)
• relieving the boredom which I previously experienced during exposure to traditional
teaching (p=892)
• providing extended interaction with other students through electronic communication
(p=0.761)
• providing extended interaction with my tutors through electronic communication (p=0.407)

153
• providing extended interaction with field experts through electronic communication
(p=0.405)
• providing extended interaction with the learning material (p=0.167)
• enabling me to master the learning content (p=0.422)
• enhancing my ability to remember what I have learnt (p=0.538)
• enabling me to develop my typing skills (p=0.750)
• enabling me to develop my computer skills (p=0.840)
• enabling me to develop my critical thinking skills (p=0.946)
• enabling me to develop my problem–solving skills(p=0.135)
• enabling me to develop my creative skills (0.598)
• enabling me to experience satisfaction during the learning process (p=0.769)
• providing me with quality education (p=0.342)
The Mann-Whitney U-test indicated that there was a significant difference between the second and
third year respondents’ responses on the following item:
• enabling me to discontinue learning when my concentration wavers (p=0.030).The second
year respondents (mean=2.77) were significantly more inclined to agree than the third year
respondents (mean=2.53), that computer assisted instruction enabled them to discontinue
learning when their concentration wavers.
4.2.5 Problems experienced by the respondents with computer assisted instruction
Section E of the questionnaire comprised 30 items pertaining to the problems the respondents
experienced with computer assisted instruction. The researcher discussed the results of both second
and third year respondents starting with the second year responses.
4.2.5.1 Second year respondents
The research findings pertaining to the second year respondents are presented in the following
section. The colour codes for the responses in the pie diagrams are as follows:
Strongly agree; Agree; Disagree; Strongly disagree; Missing value

154
• I struggle to operate the computer equipment
Figure 4.135 I struggle to operate the computer equipment (n=170)
Figure 4.135 indicates the level of agreement on the statement that that they struggle to operate the
computer equipment; namely 36 (20.9%) strongly disagreed, 84 (48.5%) disagreed, 24 (14.0%)
agreed, and 26 (15.1%) strongly agreed. There were 2 (1.2%) missing values. The median score was
2.0 (disagree). Although the majority of the respondents (69.4%) disagreed or strongly disagreed, a
reasonable number (29.1%) agreed or strongly agreed. Most respondents therefore appear not to
struggle to operate the computer equipment, but a reasonable number needs assistance in learning to
operate the equipment.
• I struggle to operate the computer software (packages) functions
Figure 4.136 I struggle to operate the computer software (packages) functions (n=171)
Figure 4.136 indicates the level of agreement on the statement that they struggle to operate the
computer software (packages) functions; namely 31 (18.0%) strongly disagreed, 86 (50.0%)
disagreed, 26 (15.1%) agreed, and 28 (16.3%) strongly agreed. There was 1 (0.6%) missing value.
The median score was 2.0 (disagree). Although the majority of the respondents (68.0%) disagreed
or strongly disagreed, a substantial number (31.4%) agreed or strongly agreed. Most respondents
therefore appeared not to struggle to operate the computer software functions, but a reasonable
number needed assistance in learning to operate these functions.

155
• I struggle to remain up-to-date with developments in computer technology
Figure 4.137 I struggle to remain up-to-date with developments in computer technology
(n=170)
Figure 4.137 indicates the level of agreement on the statement that they struggle to remain up-to-
date with developments in computer technology; namely 14 (8.1%) strongly disagreed, 65 (37.8%)
disagreed, 52 (30.2%) agreed, and 39 (22.7%) strongly agreed. There were 2 (1.2%) missing values.
The median score was 3.0 (agree). A slight majority of the respondents (52.9%) agreed or strongly
agreed, and (45.9%) disagreed or strongly disagreed. Helping respondents to remain up-to-date with
developments in computer technology therefore requires priority attention.
• I feel insecure during the learning process
Figure 4.138 I feel insecure during the learning process (n=171)
Figure 4.138 indicates the level of agreement on the statement that they feel insecure during the
learning process; namely 80 (46.5%) strongly disagreed, 50 (29.1%) disagreed, 24 (14.0%) agreed,
and 17 (9.9%) strongly agreed. There was 1 (0.6%) missing value. The median score was 2.0
(strongly disagree). A substantial majority of the respondents (75.6%) disagreed or strongly
disagreed. The respondents therefore generally felt secure during the learning process.

156
• I cannot afford the necessary computer equipment
Figure 4.139 I cannot afford the necessary computer equipment (n=168)
Figure 4.139 indicates the level of agreement on the statement that they cannot afford the necessary
computer equipment; namely 17 (9.9%) strongly disagreed, 42 (24.4%) disagreed, 39 (22.7%)
agreed, and 69 (40.1%) strongly agreed. There were 4 (2.3%) missing values. The median score was
3.0 (strongly agree). The majority of the respondents (62.8%) agreed or strongly agreed, and a
substantial number (34.3%) disagreed or strongly disagreed. While some respondents appeared to
be able to afford the necessary computer equipment, most were unable to do so. Such a state of
affairs may lead to inequity with regard to respondents’ ability to engage in computer assisted
instruction activities at home.
• A lack of computer facilities hamper my access to computer assisted instruction
Figure 4.140 A lack of computer facilities hamper my access to computer assisted instruction
(n=169)
Figure 4.140 indicates the level of agreement on the statement that a lack of computer facilities
hamper their access to computer assisted instruction; namely 12 (7.0%) strongly disagreed, 42
(24.4%) disagreed, 43 (25.0%) agreed, and 72 (41.9%) strongly agreed. There were 3 (1.7%)
missing values. The median score was 3.0 (strongly agree). The majority of the respondents (66.9%)
agreed or strongly agreed, and a substantial number (31.4%) disagreed or strongly disagreed. While

157 some respondents appeared to have had adequate access to computer facilities, most did not have
this access. Such a state of affairs may lead to inequity with regard to respondents’ ability to engage
in computer assisted instruction activities.
• I am hampered by frequent power failures
Figure 4.141 I am hampered by frequent power failures (n=170)
Figure 4.141 indicates the level of agreement on the statement that that they are hampered by
frequent power failures; namely 87 (50.6%) strongly disagreed, 47 (27.3%) disagreed, 21 (12.2%)
agreed, and 15 (8.7%) strongly agreed. There were 2 (1.2%) missing values. The median score was
1.0 (strongly disagree). A substantial majority of the respondents (77.9%) disagreed or strongly
disagreed. Frequent power failures therefore do not appear to be of major concern.
• I am hampered in utilising the Internet due to unreliable telephone connection
Figure 4.142 I am hampered in utilising the Internet due to an unreliable telephone
connection (n=168)
Figure 4.142 indicates the level of agreement on the statement that they are hampered in utilising
the Internet due to unreliable telephone connections; namely 77 (44.8%) strongly disagreed, 39
(22.7%) disagreed, 17 (9.9%) agreed, and 35 (20.3%) strongly agreed. There were 4 (2.3%) missing
values. The median score was 2.0. (strongly disagree). The majority of the respondents (67.5%)

158 disagreed or strongly disagreed, while a substantial number (30.2%) agreed or strongly agreed.
Although the majority of the respondents were not hampered by unreliable telephone connections, it
appeared to be problematic for many of the respondents.
• The computer equipments in the media centre are unreliable
Figure 4.143 The computer equipments in the media centre are unreliable (n=171)
Figure 4.143 indicates the level of agreement on the statement that the computer equipment in the
media centres is unreliable; namely 57 (33.1%) strongly disagreed, 51 (29.7%) disagreed, 34
(19.8%) agreed, and 29 (16.9%) strongly agreed. There was 1 (0.6%) missing value. The median
score was 2.0 (strongly disagree). The majority of the respondents disagreed or strongly disagreed
(62.8%), while a substantial number (36.7%) agreed or strongly agreed. Although the majority of
respondents were not hampered by unreliable computer equipment in the media centre, it appeared
to be problematic for many respondents.
• Technical assistance in the media centre is insufficient
Figure 4.144 Technical assistance in the media centre is insufficient (n=172)
Figure 4.144 indicates the level of agreement on the statement that technical assistance in the media
centre is insufficient; namely 45 (26.2%) strongly disagreed, 58 (34.0%) disagreed, 34 (20%)

159 agreed, and 35 (20.3%) strongly agreed. The median score was 2.0 (disagree). The majority of the
respondents (60.2%) disagreed or strongly disagreed, while a substantial number (40.3%) agreed or
strongly agreed. Insufficient technical assistance in the media centre appeared to be problematic for
many respondents.
• A learning facilitator is not available when I need assistance
Figure 4.145 A learning facilitator is not available when I need assistance (n=171)
Figure 4.145 indicates the level of agreement on the statement that a learning facilitator is not
available when they need assistance; namely 56 (33%) strongly disagreed, 57 (33.1%) disagreed, 27
(16.0%) agreed, and 31 (18.0%) strongly agreed. The median score was 2.0 (disagree). There was 1
(0.6%) missing value. The majority of the respondents (66.4%) disagreed or strongly disagreed,
while a substantial number (34.0%) agreed or strongly agreed. Although the majority of respondents
were not hampered by the unavailability of a learning facilitator, it appeared to be problematic for
many respondents.
• The learning facilitator is not proficient in computer assisted instruction
Figure 4.146 The learning facilitator is not proficient in computer assisted instruction
(n=170)
Figure 4.146 indicates the level of agreement on the statement that the learning facilitator is not
proficient in computer assisted instruction; namely 94 (54.7%) strongly disagreed, 39 (22.7%)

160 disagreed, 22 (12.8%) agreed, and 15 (8.7%) strongly agreed. There were 2 (1.2%) missing values.
The median score was 1.0 (strongly disagree). A substantial majority of the respondents (77.4%)
disagreed or strongly disagreed. The respondents are therefore generally satisfied with the
proficiency of the learning facilitator.
• Computer- assisted instruction is not my preferred way of learning
Figure 4.147 Computer assisted instructions is not my preferred way of learning (n=169)
Figure 4.147 indicates the level of agreement on the statement that computer assisted instruction is
not their preferred way of learning; namely 65 (37.8%) strongly disagreed, 65 (37.8%) disagreed, 21
(12.2%) agreed, and 18 (10.5%) strongly agreed. There were 3 (1.7%) missing values. The median
score was 2.0 (strongly disagree). A substantial majority of the respondents (75.6%) disagreed or
strongly disagreed. Computer assisted instruction was therefore a preferred way of learning for most
respondents.
• Computer- assisted instruction makes me to lose interest in learning
Figure 4.148 Computer assisted instruction makes me to lose interest in learning (n=171)
Figure 4.148 indicates the level of agreement on the statement that computer assisted instruction
made them to lose interest in learning; namely 94 (54.7%) strongly disagreed, 52 (30.2%) disagreed,
12 (7.0%) agreed, and 13 (7.6%) strongly agreed. There was 1 (0.6%) missing value. The median
score was 1.0 (strongly disagree). A substantial majority of the respondents (74.9%) disagreed or

161 strongly disagreed. Computer assisted instructions therefore generally promoted respondents’
interest in their learning.
• My concentration span goes down
Figure 4.149 My concentration span goes down (n=172)
Figure 4.149 indicates the level of agreement on the statement that computer assisted instruction
results in decreased levels of concentration; namely 86 (50.0%) strongly disagreed, 60 (34.9%)
disagreed, 13 (7.6%) agreed, and 13 (7.6%) strongly agreed. The median score was 1.5 (strongly
disagree). A substantial majority of the respondents (84.9%) disagreed or strongly disagreed.
Computer assisted instruction therefore generally promoted respondents’ concentration.
• I struggle to independently obtain information from the Internet
Figure 4.150 I struggle to independently obtain information from the Internet (n=172)
Figure 4.150 indicates the level of agreement on the statement that they struggle to independently
obtain information from the Internet; namely 48 (27.9%) strongly disagreed, 60 (34.9%) disagreed,
28 (16.3%) agreed, and 36 (20.9%) strongly agreed. The median score was 2.0 (disagree). The
majority of the respondents (62.8%) disagreed or strongly disagreed, while a substantial number
(37.2%) agreed or strongly agreed. Although the majority of respondents did not struggle to
independently obtain information from the Internet, it appeared to be problematic for many
respondents.

162
• I struggle to achieve my learning objectives through reading skills computer packages
Figure 4.151 I struggle to achieve my learning objectives through reading skills computer
packages (n=171)
Figure 4.151 indicates the level of agreement on the statement that they struggle to achieve their
learning objectives through reading skills computer packages; namely 56 (32.6%) strongly
disagreed, 63 (36.6%) disagreed, 24 (14.0%) agreed, and 28 (16.3%) strongly agreed. There was 1
(0.6%) missing value. The median score was 2.0 (disagree). The majority of the respondents
(69.2%) disagreed or strongly disagreed, while a substantial number (30.3%) agreed or strongly
agreed. Although the majority of respondents did not struggle to achieve their learning objectives
through reading skills computer packages, it appeared to be problematic for many respondents.
• I struggle to achieve my learning objectives through typing skills computer packages
Figure 4.152 I struggle to achieve my learning objectives through typing skills computer
packages (n=171)
Figure 4.152 indicates the level of agreement on the statement that they struggle to achieve their
learning objectives through typing skills computer packages; namely 62 (36.0%) strongly disagreed,
57 (33.1%) disagreed, 21 (12.2%) agreed, and 31 (18.0%) strongly agreed. There was 1 (0.6%)
missing value. The median score was 2.0 (strongly disagree). The majority of the respondents
(69.1%) disagreed or strongly disagreed, while a substantial number (30.2%) agreed or strongly

163 agreed. Although the majority of respondents did not struggle to achieve their learning objectives
through typing skills computer packages, it appeared to be problematic for many respondents.
• I struggle to achieve my learning objectives computer literacy packages
Figure 4.153 I struggle to achieve my learning objectives through computer literacy
packages (n=172)
Figure 4.153 indicates the level of agreement on the statement that they struggle to achieve their
learning objectives through computer literacy packages; namely 43 (25.0%) strongly disagreed, 76
(44.2%) disagreed, 22 (12.8%) agreed, and 31 (18.0%) strongly agreed. The median score was 2.0
(disagree). The majority of the respondents (69.2%) disagreed or strongly disagreed, while a
substantial number (30.8%) agreed or strongly agreed. Although the majority of respondents did not
struggle to achieve their learning objectives through computer literacy packages, it appeared to be
problematic for many respondents.
• I struggle to achieve my learning objectives through text-based course content
computer packages
Figure 4.154 I struggle to achieve my learning objectives through text-based course content
computer packages (n=172)

164 Figure 4.154 indicates the level of agreement on the statement that they struggle to achieve their
learning objectives through text-based course content computer packages; namely 39 (22.7%)
strongly disagreed, 70 (40.7%) disagreed, 30 (17.4%) agreed, and 33 (19.2%) strongly agreed. The
median score was 2.0 (disagree). The majority of the respondents (63.4%) disagreed or strongly
disagreed, while a substantial number (36.6%) agreed or strongly agreed. Although the majority of
respondents did not struggle to achieve their learning objectives through text-based course content
computer packages, it appeared to be problematic for many respondents.
• I struggle to achieve my learning objectives through multimedia course content
computer packages
Figure 4.155 I struggle to achieve my learning objectives through multimedia course content
computer packages (n=172)
Figure 4.155 indicates the level of agreement on the statement that they struggle to achieve their
learning objectives through multimedia course content computer packages; namely 28 (16.3%)
strongly disagreed, 72 (41.9%) disagreed, 38 (22.1%) agreed, and 34 (19.8%) strongly agreed. The
median score was 2.0 (disagree). A slight majority of the respondents (58.2%) disagreed or strongly
disagreed, while a substantial number (41.9%) agreed or strongly agreed. Helping respondents to
achieve their learning objectives through multimedia course content computer packages requires
priority attention.

165
• I struggle to achieve my learning objectives through text-based computer packages,
which provide scenarios that develop my problem-solving skills
Figure 4.156 I struggle to achieve my learning objectives through text-based computer
packages, which provide scenarios that develop my problem-solving skills
(n=172)
Figure 4.156 indicates the level of agreement on the statement that they struggle to achieve their
learning objectives through text-based computer packages which provide scenarios that develop
their problem-solving skills; namely 31 (18.0%) strongly disagreed, 69 (40.1%) disagreed, 42
(24.4%) agreed, and 30 (17.4%) strongly agreed. The median score was 2.0 (disagree). A slight
majority of the respondents (58.1%) disagreed or strongly disagreed, while a substantial number
(41.8%) agreed or strongly agreed. Helping respondents to achieve their learning objectives through
text-based computer packages that provide scenarios that develop their problem-solving skills,
requires priority attention.
• I struggle to achieve my learning objectives through multimedia computer packages
that provide scenarios that develop my problem-solving skills
Figure 4.157 I struggle to achieve my learning objectives through multimedia computer
packages that provide scenarios that develop my problem-solving skills (n=170)

166
Figure 4.157 indicates the level of agreement on the statement that they struggle to achieve their
learning objectives through multimedia computer packages, which provide scenarios that develop
their problem-solving skills; namely 26 (15.1%) strongly disagreed, 67 (39.0%) disagreed, 42
(24.4%) agreed, and 35 (20.3%) strongly agreed. There were 2 (1.2%) missing values. The median
score was 2.0 (disagree). A slight majority of the respondents (54.1%) disagreed or strongly
disagreed, while a substantial number (44.7%) agreed or strongly agreed. Helping respondents to
achieve their learning objectives through multimedia computer packages that provide scenarios that
develop their problem-solving skills, requires priority attention.
• I struggle to achieve my learning objectives through computer packages simulating
clinical situations, which develop my decision-making skills
Figure 4.158 I struggle to achieve my learning objectives through computer packages
simulating clinical situations that develop my decision-making skills (n=171)
Figure 4.158 indicates the level of agreement on the statement that they struggle to achieve their
learning objectives through computer packages simulating clinical situations which develop their
decision-making skills; namely 32 (18.6%) strongly disagreed, 67 (39.0%) disagreed, 39 (22.7%)
agreed, and 33 (19.2%) strongly agreed. There was 1 (0.6%) missing value. The median score was
2.0 (disagree). A slight majority of the respondents (57.6%) disagreed or strongly disagreed, while a
substantial number (41.9%) agreed or strongly agreed. Helping respondents to achieve their learning
objectives through multimedia computer packages simulating clinical situations that develop their
decision-making skills, requires priority attention.

167
• I struggle to achieve my learning objectives through computer-gaming packages
Figure 4.159 I struggle to achieve my learning objectives through computer gaming
packages (n=171).
Figure 4.159 indicates the level of agreement on the statement that they struggle to achieve their
learning objectives through computer gaming packages; namely 50 (29.1%) strongly disagreed, 67
(37.0%) disagreed, 29 (16.9%) agreed, and 29 (16.9%) strongly agreed. There was 1 (0.6%) missing
value. The median score was 2.0. (disagreed). The majority of the respondents (66.1%) disagreed or
strongly disagreed, while a substantial number (33.8%) agreed or strongly agreed. Although the
majority of respondents did not struggle to achieve their learning objectives through computer
gaming packages, it appears to be problematic for many respondents.
• I struggle to achieve my learning objectives when trying to obtain information on the
Internet
Figure 4.160 I struggle to achieve my learning objectives when trying to obtain information
on the Internet (n=171)
Figure 4.160 indicates the level of agreement on the statement that they struggle to achieve their
learning objectives when trying to obtain information on the Internet; namely 47 (27.3%) strongly
disagreed, 64 (37.2%) disagreed, 28 (16.3%) agreed, and 32 (18.6%) strongly agreed. There was 1
(0.6%) missing value. The median score was 2.0 (disagree). The majority of the respondents

168 (64.5%) disagreed or strongly disagreed, while a substantial number (34.9%) agreed or strongly
agreed. Although the majority of respondents did not struggle to obtain information from the
Internet, it appeared to be problematic for many respondents.
• I am too dependent on the computer for learning purposes
Figure 4.161 I m too dependent on the computer for learning purposes (n=171)
Figure 4.161 indicates the level of agreement on the statement that they are too dependent on the
computer for learning purposes; namely 90 (52.3%) strongly disagreed, 49 (28.5%) disagreed, 20
(11.6%) agreed, and 12 (7.0%) strongly agreed. There was 1 (0.6%) missing value. The median
score was 1.0 (strongly disagree). A substantial majority of the respondents (80.8%) disagreed or
strongly disagreed. The respondents were therefore generally not too dependent on the computer for
learning purposes.
• I loose sight of my learning objectives because I focus too much on the technical
equipment
Figure 4.162 I loose sight of my learning objectives because I focus too much on the technical
equipment (n=172)

169 Figure 4.162 indicates the level of agreement on the statement that they loose sight of their learning
objectives because they focus too much on the technical equipment; namely 95 (55.2%) strongly
disagreed, 44 (25.6%) disagreed, 23 (13.4%) agreed, and 10 (5.8%) strongly agreed. The median
score was 1.0. (strongly disagree). A substantial majority of the respondents (80.8%) disagreed or
strongly disagreed. The respondents therefore generally did not loose sight of their learning
objectives because they focused too much on the technical equipment.
• Personal contact with other learners is too limited
Figure 4.163 Personal contact with other learners is too limited (n=172)
Figure 4.163 indicates the level of agreement on the statement that their personal contact with other
learners is too limited; namely 48 (27.9%) strongly disagreed, 54 (31.4%) disagreed, 33 (19.2%)
agreed, and 37 (21.5%) strongly agreed. The median score was 2.0 (disagree). A slight majority of
the respondents (59.3%) disagreed or strongly disagreed, while a substantial number (40.7%) agreed
or strongly agreed. Helping respondents to increase personal electronic contact with their peers,
requires priority attention.
• Personal contact with my tutors is too limited
Figure 4.164 Personal contact with my tutors is too limited (n=171)

170 Figure 4.164 indicates the level of agreement on the statement that personal contact with their tutors
is too limited; namely 43 (25.0%) strongly disagreed, 57 (33.1%) disagreed, 28 (16.3%) agreed, and
43 (25.0%) strongly agreed. There was 1 (0.6%) missing value. The median score was 2.0
(disagree). A slight majority of the respondents (58.1%) disagreed or strongly disagreed, and a
substantial number (41.3%) agreed or strongly agreed. Helping respondents to increase personal
electronic contact with their tutors requires attention.
4.2.5.2 Third year respondents
The research findings pertaining to the third year respondents are presented in the following section.
The colour codes for the responses in the pie diagrams are as follows:
Strongly agree; Agree; Disagree; Strongly disagree; Missing value
• I struggle to operate the computer equipment
Figure 4.165 I struggle to operate the computer equipment (n=119)
Figure 4.165 indicates the level of agreement on the statement that that they struggle to operate the
computer equipment; namely 19 (16.0%) strongly disagreed, 64 (53.8%) disagreed, 16 (13.4%)
agreed, and 20 (16.8%) strongly agreed. The median score was 2.0 (disagree). Although the
majority of the respondents (69.8%) disagreed or strongly disagreed, a substantial number (30.2%)
agreed or strongly agreed. Most respondents therefore appeared not to struggle to operate the
computer equipment, but a reasonable number needed assistance in learning to operate the
equipment.

171
• I struggle to operate the computer software (packages) functions
Figure 4. 166 I struggle to operate the computer software (packages) functions (n=119)
Figure 4.166 indicates the level of agreement on the statement that they struggle to operate the
computer software (packages) functions; namely 20 (16.8%) strongly disagreed, 58 (48.7%)
disagreed, 20 (16.8%) agreed, and 21 (17.6%) strongly agreed. The median score was 2.0
(disagree). The majority of the respondents (65.5%) disagreed or strongly disagreed, while a
substantial number (34.4%) agreed or strongly agreed. Most respondents therefore appeared not to
struggle to operate the computer software functions, but a reasonable number needed assistance in
learning to operate these functions.
• I struggle to remain up-to-date with developments in computer technology
Figure 4.167 I struggle to remain up-to-date with developments in computer technology
(n=118)
Figure 4.167 indicates the level of agreement on the statement that they struggle to remain up-to-
date with developments in computer technology; namely 14 (11.8%) strongly disagreed, 37 (31.1%)
disagreed, 32 (26.9%) agreed, and 35 (29.4%) strongly agreed. There was 1 (0.8%) missing value.
The median score was 3.0 (disagree). Although the majority of the respondents (56.3%) agreed or

172 strongly agreed, a substantial number (42.9%) disagreed or strongly disagreed. Helping respondents
to remain up-to-date with developments in computer technology therefore requires attention.
• I feel insecure during the learning process
Figure 4.168 I feel insecure during the learning process (n=119)
Figure 4.168 indicates the level of agreement on the statement that they feel insecure during the
learning process; namely 46 (38.7%) strongly disagreed, 43 (36.1%) disagreed, 14 (11.8%) agreed,
and 16 (13.4%) strongly agreed. The median score was 2.0 (strongly disagree). The majority of the
respondents (74.8%) disagreed or strongly disagreed, while a reasonable number (25.2%) agreed or
strongly agreed. Although the majority of respondents were not hampered by feelings of insecurity,
it appeared to be problematic for some of the respondents.
• I cannot afford the necessary computer equipment
Figure 4.169 I cannot afford the necessary computer equipment (n=117)
Figure 4.169 indicates the level of agreement on the statement that they cannot afford the necessary
computer equipment; namely 27 (22.7%) strongly disagreed, 14 (11.8%) disagreed, 31 (26.1%)
agreed, and 45 (37.8%) strongly agreed. There were 2 (1.7%) missing values. The median score was

173 3.0 (strongly agreed). The majority of the respondents (63.9%) agreed or strongly agreed, and a
substantial number (34.5%) disagreed or strongly disagreed. While some respondents appeared to
be able to afford the necessary computer equipment, most were unable to do so. This state of affairs
may lead to inequity with regard to respondents’ ability to engage in computer assisted instruction
activities at home.
• A lack of computer facilities hamper my access to computer assisted instruction
Figure 4.170 A lack of computer facilities hamper my access to computer assisted instruction
(n=119)
Figure 4.170 indicates the level of agreement on the statement that a lack of computer facilities
hamper their access to computer assisted instruction; namely 12 (10.1%) strongly disagreed, 21
(17.6%) disagreed, 35 (29.4%) agreed, and 51 (42.9%) strongly agreed. The median score was 3.0
(strongly disagreed). The majority of the respondents (72.3%) agreed or strongly agreed, and a
reasonable number (27.7%) disagreed or strongly disagreed. While some respondents appeared to
have had access to computer equipment at home, most did not have this access. This state of affairs
may lead to inequity with regard to the respondents’ ability to engage in computer assisted
instruction activities.
• I am hampered by frequent power failures
Figure 4.171 I am hampered by frequent power failures (n=117)
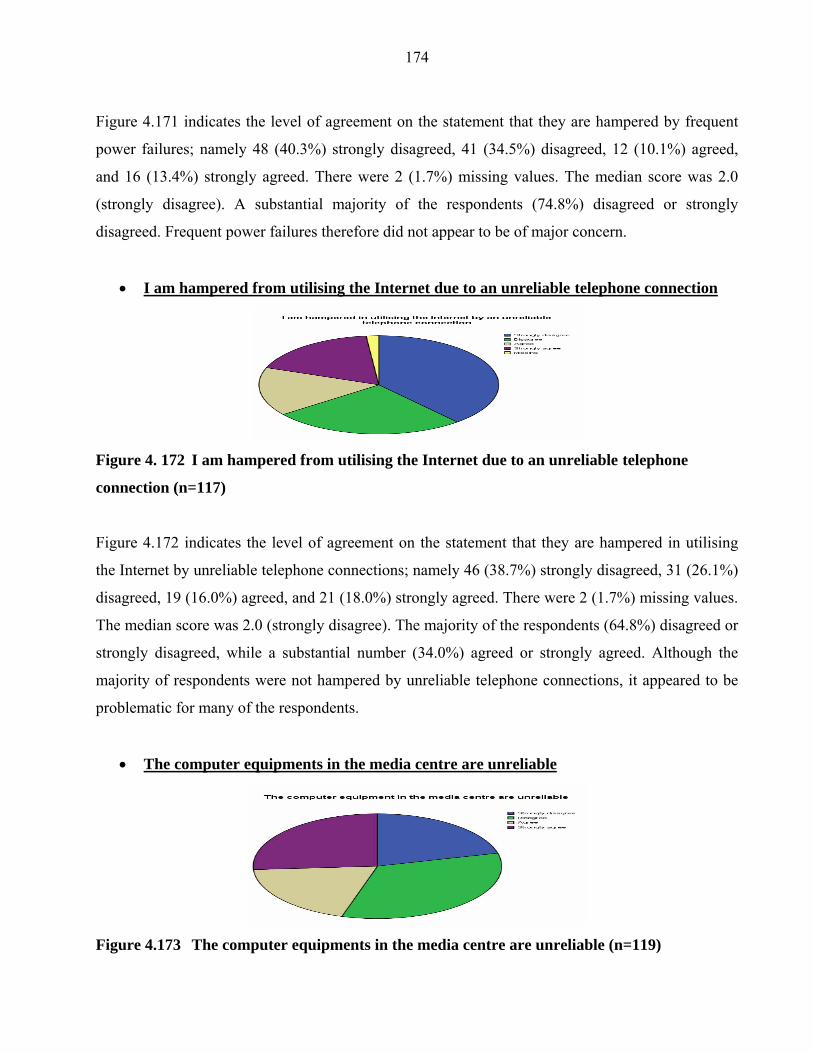
174
Figure 4.171 indicates the level of agreement on the statement that they are hampered by frequent
power failures; namely 48 (40.3%) strongly disagreed, 41 (34.5%) disagreed, 12 (10.1%) agreed,
and 16 (13.4%) strongly agreed. There were 2 (1.7%) missing values. The median score was 2.0
(strongly disagree). A substantial majority of the respondents (74.8%) disagreed or strongly
disagreed. Frequent power failures therefore did not appear to be of major concern.
• I am hampered from utilising the Internet due to an unreliable telephone connection
Figure 4. 172 I am hampered from utilising the Internet due to an unreliable telephone
connection (n=117)
Figure 4.172 indicates the level of agreement on the statement that they are hampered in utilising
the Internet by unreliable telephone connections; namely 46 (38.7%) strongly disagreed, 31 (26.1%)
disagreed, 19 (16.0%) agreed, and 21 (18.0%) strongly agreed. There were 2 (1.7%) missing values.
The median score was 2.0 (strongly disagree). The majority of the respondents (64.8%) disagreed or
strongly disagreed, while a substantial number (34.0%) agreed or strongly agreed. Although the
majority of respondents were not hampered by unreliable telephone connections, it appeared to be
problematic for many of the respondents.
• The computer equipments in the media centre are unreliable
Figure 4.173 The computer equipments in the media centre are unreliable (n=119)
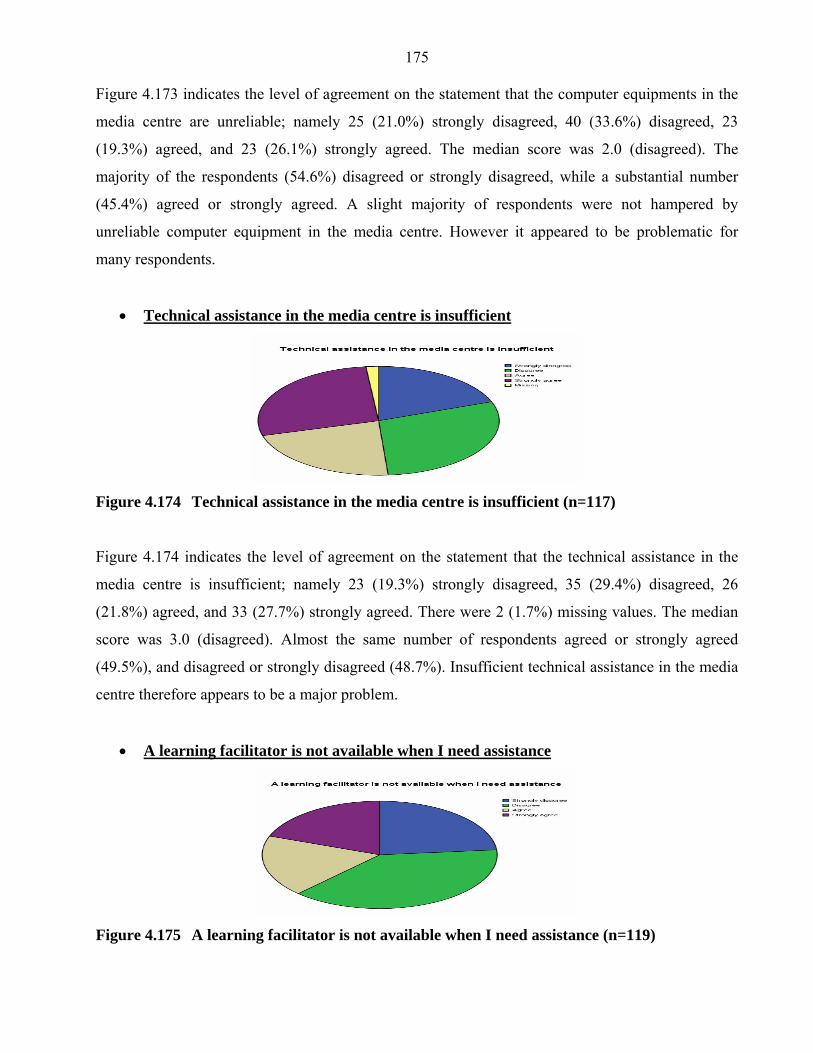
175 Figure 4.173 indicates the level of agreement on the statement that the computer equipments in the
media centre are unreliable; namely 25 (21.0%) strongly disagreed, 40 (33.6%) disagreed, 23
(19.3%) agreed, and 23 (26.1%) strongly agreed. The median score was 2.0 (disagreed). The
majority of the respondents (54.6%) disagreed or strongly disagreed, while a substantial number
(45.4%) agreed or strongly agreed. A slight majority of respondents were not hampered by
unreliable computer equipment in the media centre. However it appeared to be problematic for
many respondents.
• Technical assistance in the media centre is insufficient
Figure 4.174 Technical assistance in the media centre is insufficient (n=117)
Figure 4.174 indicates the level of agreement on the statement that the technical assistance in the
media centre is insufficient; namely 23 (19.3%) strongly disagreed, 35 (29.4%) disagreed, 26
(21.8%) agreed, and 33 (27.7%) strongly agreed. There were 2 (1.7%) missing values. The median
score was 3.0 (disagreed). Almost the same number of respondents agreed or strongly agreed
(49.5%), and disagreed or strongly disagreed (48.7%). Insufficient technical assistance in the media
centre therefore appears to be a major problem.
• A learning facilitator is not available when I need assistance
Figure 4.175 A learning facilitator is not available when I need assistance (n=119)

176 Figure 4.175 indicates the level of agreement on the statement that a learning facilitator is not
available when they need assistance; namely 28 (23.5%) strongly disagreed, 46 (38.7%) disagreed,
22 (18.5%) agreed, and 23 (19.3%) strongly agreed. The median score was 2.0 (disagree). The
majority of the respondents (62.2%) disagreed or strongly disagreed, while a substantial number
(37.8%) agreed or strongly agreed. Although the majority of respondents were not hampered by the
unavailability of a learning facilitator, it appeared to be problematic for many respondents.
• The learning facilitator is not proficient in computer assisted instruction
Figure 4.176 The learning facilitator is not proficient in computer assisted instruction (n=116)
Figure 4.176 indicates the level of agreement on the statement that the learning facilitator is not
proficient in computer assisted instruction; namely 62 (52.1%) strongly disagreed, 23 (19.3%)
disagreed, 17 (14.3%) agreed, and 14 (11.8%) strongly agreed. There were 3 (2.5%) missing values.
The median score was 1.0 (strongly disagree). The majority of the respondents (71.4%) disagreed or
strongly disagreed, while a reasonable number (26.1%) agreed or strongly agreed. Although most of
the respondents appeared to be satisfied with the proficiency of the learning facilitator, this appeared
to be problematic for some respondents.
• Computer- assisted instruction is not my preferred way of learning
Figure 4.177 Computer assisted instruction is not my preferred way of learning (n=119)

177 Figure 4.177 indicates the level of agreement on the statement that computer assisted instruction is
not their preferred way of learning; namely 58 (48.7%) strongly disagreed, 30 (25.2%) disagreed, 17
(14.3%) agreed, and 14 (11.8%) strongly agreed. The median score was 2.0 (strongly disagree). The
majority of the respondents (73.9%) disagreed or strongly disagreed, while a reasonable number
(26.1%) agreed or strongly agreed. Computer assisted instruction was therefore a preferred way of
learning for most respondents, but some stated the contrary.
• Computer assisted instruction makes me to loose interest in learning
Figure 4.178 Computer assisted instruction makes me to loose interest in learning (n=118)
Figure 4.178 indicates the level of agreement on the statement that computer assisted instruction
makes them to lose interest in learning; namely 73 (61.3%) strongly disagreed, 35 (29.4%)
disagreed, 2 (1.7%) agreed, and 8 (6.7%) strongly agreed. There was 1 (0.8%) missing item. The
median score was 1.0 (strongly disagree). A substantial majority of the respondents (90.7%)
disagreed or strongly disagreed. Computer assisted instruction therefore generally promoted the
respondents’ interest in learning.
• My concentration span goes down
Figure 4.179 My concentration span goes down (n=117)

178 Figure 4.179 indicates the level of agreement on the statement that their concentration span goes
down; namely 52 (43.7%) strongly disagreed, 48 (40.3%) disagreed, 6 (5.0%) agreed, and 11 (9.2%)
strongly agreed. There were 2 (1.7%) missing values. The median score was 2.0 (strongly disagree).
A substantial majority of the respondents (84.0%) disagreed or strongly disagreed. Computer
assisted instruction therefore generally promoted respondents’ concentration.
• I struggle to independently obtain information from the Internet
Figure 4.180 I struggle to independently obtain information from the Internet (n=119)
Figure 4.180 indicates the level of agreement on the statement that they struggle to independently
obtain information from the Internet; namely 23 (19.3%) strongly disagreed, 61 (51.3%) disagreed,
11 (9.2%) agreed, and 24 (20.2%) strongly agreed. The median score was 2.0 (disagreed). The
majority of the respondents (70.6%) disagreed or strongly disagreed, while a reasonable number
(29.4%) agreed or strongly agreed. Although the majority of respondents did not struggle to
independently obtain information from the Internet, it appeared to be problematic for some
respondents.
• I struggle to achieve my learning objectives through reading skills computer packages
Figure 4.181 I struggle to achieve my learning objectives through reading skills computer
packages (n=119)

179
Figure 4.181 indicates the level of agreement on the statement that they struggle to achieve their
learning objectives through reading skills computer packages; namely 29 (24.4%) strongly
disagreed, 54 (45.4%) disagreed, 13 (10.9%) agreed, and 23 (19.3%) strongly agreed. The median
score was 2.0 (disagree). The majority of the respondents (69.8%) disagreed or strongly disagreed,
while a substantial number (30.2%) agreed or strongly agreed. Although the majority of respondents
did not struggle to achieve their learning objectives through reading skills computer packages, it
appeared to be problematic for many respondents.
• I struggle to achieve my learning objectives through typing skills computer packages
Figure 4.182 I struggle to achieve my learning objectives through typing skills computer
packages (n=119)
Figure 4.182 indicates the level of agreement on the statement that they struggle to achieve their
learning objectives through typing skills computer packages; namely 37 (24.4%) strongly disagreed,
44 (37.0%) disagreed, 17 (14.3%) agreed, and 21 (18.0%) strongly agreed. The median score was
2.0 (disagree). The majority of the respondents (61.4%) disagreed or strongly disagreed, while a
substantial number (32.3%) agreed or strongly agreed. Although the majority of respondents did not
struggle to achieve their learning objectives through typing skills computer packages, it appeared to
be problematic for many respondents.

180
• I struggle to achieve my learning objectives computer literacy packages
Figure 4.183 I struggle to achieve my learning objectives computer literacy packages (n=119)
Figure 4.183 indicates the level of agreement on the statement that they struggle to achieve their
learning objectives through computer literacy packages; namely 32 (26.9%) strongly disagreed, 54
(45.4%) disagreed, 12 (10.1%) agreed, and 21 (18.0%) strongly agreed. The median score was 2.0
(disagreed). The majority of the respondents (72.3%) disagreed or strongly disagreed, while a
substantial number (28.1%) agreed or strongly agreed. Although the majority of respondents did not
struggle to achieve their learning objectives through computer literacy packages, it appeared to be
problematic for some respondents.
• I struggle to achieve my learning objectives through text-based course content
computer packages
Figure 4.184 I struggle to achieve my learning objectives through text-based course content
computer packages (n=118)
Figure 4.184 indicates the level of agreement on the statement that they struggle to achieve their
learning objectives through text-based course content computer packages; namely 26 (21.8%)
strongly disagreed, 54 (45.4%) disagreed, 18 (15.1%) agreed, and 20 (16.8%) strongly agreed.

181 There was 1 (0.8%) missing value. The median score was 2.0 (disagree). The majority of the
respondents (67.2%) disagreed or strongly disagreed, while a substantial number (31.9%) agreed or
strongly agreed. Although the majority of respondents did not struggle to achieve their learning
objectives through text-based course content computer package, it appeared to be problematic for
many respondents.
• I struggle to achieve my learning objectives through multimedia course content
computer packages
Figure 4.185 I struggle to achieve my learning objectives through multimedia course content
computer packages (n=118)
Figure 4.185 indicates the level of agreement on the statement that they struggle to achieve their
learning objectives through multimedia course content computer packages; namely 20 (16.8)
strongly disagreed, 52 (43.7%) disagreed, 18 (15.1%) agreed, and 28 (23.5%) strongly agreed.
There was 1 (0.8%) missing value. The median score was 2.0 (disagree). The majority of the
respondents (60.5%) disagreed or strongly disagreed, while a substantial number (38.6%) agreed or
strongly agreed. Although the majority of respondents did not struggle to achieve their learning
objectives through multimedia course content computer packages, it appeared to be problematic for
many respondents.

182 ● I struggle to achieve my learning objectives through text-based computer packages that
provide scenarios that develop my problem-solving skills
Figure 4.186 I struggle to achieve my learning objectives through text-based computer
packages that provide scenarios that develop my problem-solving skills (n=119)
Figure 4.186 indicates the level of agreement on the statement that they struggle to achieve their
learning objectives through text-based computer packages, which provide scenarios that develop
their problem-solving skills; namely 28 (23.5) strongly disagreed, 46 (38.7%) disagreed, 18 (15.1%)
agreed, and 27 (22.7%) strongly agreed. The median score was 2.0 (disagree). The majority of the
respondents (62.2%) disagreed or strongly disagreed, while a substantial number (37.8%) agreed or
strongly agreed. Although a slight majority of respondents did not struggle to achieve their learning
objectives through text-based computer packages that provide scenarios that develop their problem-
solving skills, it appeared to be problematic for many respondents.
• I struggle to achieve my learning objectives through multimedia computer packages
that provide scenarios that develop my problem-solving skills
Figure 4.187 I struggle to achieve my learning objectives through multimedia computer
packages that provide scenarios that develop my problem-solving skills
(n=119)
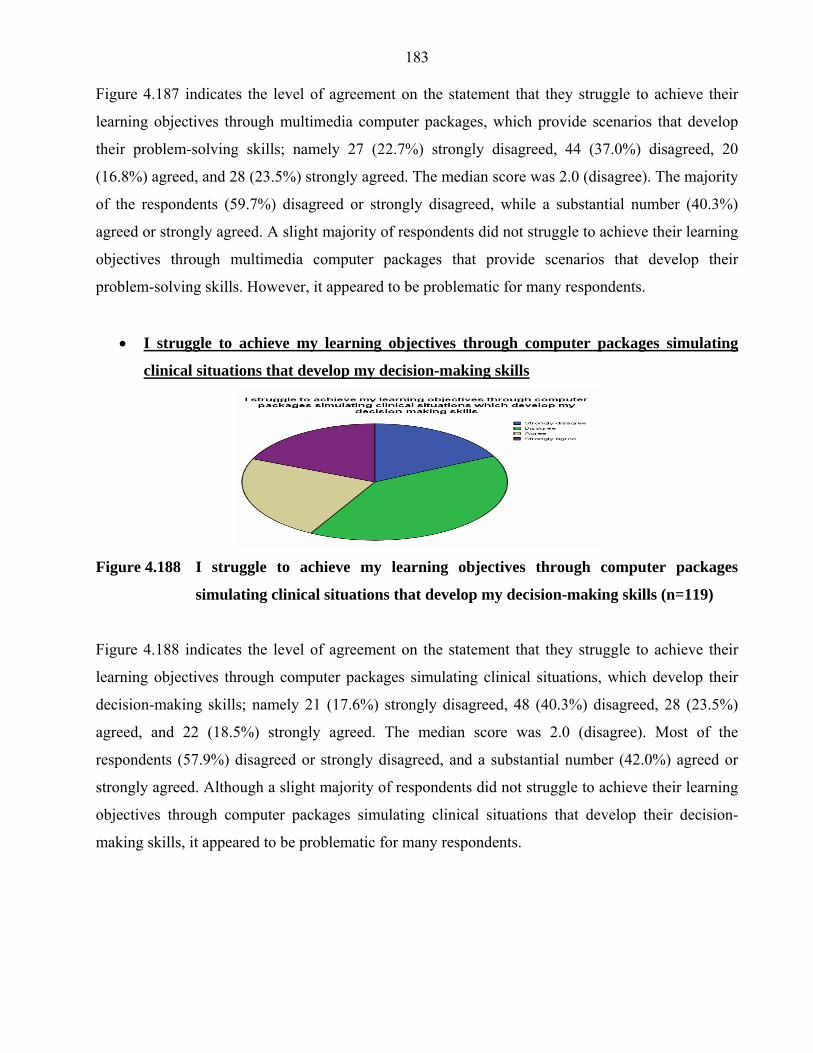
183 Figure 4.187 indicates the level of agreement on the statement that they struggle to achieve their
learning objectives through multimedia computer packages, which provide scenarios that develop
their problem-solving skills; namely 27 (22.7%) strongly disagreed, 44 (37.0%) disagreed, 20
(16.8%) agreed, and 28 (23.5%) strongly agreed. The median score was 2.0 (disagree). The majority
of the respondents (59.7%) disagreed or strongly disagreed, while a substantial number (40.3%)
agreed or strongly agreed. A slight majority of respondents did not struggle to achieve their learning
objectives through multimedia computer packages that provide scenarios that develop their
problem-solving skills. However, it appeared to be problematic for many respondents.
• I struggle to achieve my learning objectives through computer packages simulating
clinical situations that develop my decision-making skills
Figure 4.188 I struggle to achieve my learning objectives through computer packages
simulating clinical situations that develop my decision-making skills (n=119)
Figure 4.188 indicates the level of agreement on the statement that they struggle to achieve their
learning objectives through computer packages simulating clinical situations, which develop their
decision-making skills; namely 21 (17.6%) strongly disagreed, 48 (40.3%) disagreed, 28 (23.5%)
agreed, and 22 (18.5%) strongly agreed. The median score was 2.0 (disagree). Most of the
respondents (57.9%) disagreed or strongly disagreed, and a substantial number (42.0%) agreed or
strongly agreed. Although a slight majority of respondents did not struggle to achieve their learning
objectives through computer packages simulating clinical situations that develop their decision-
making skills, it appeared to be problematic for many respondents.
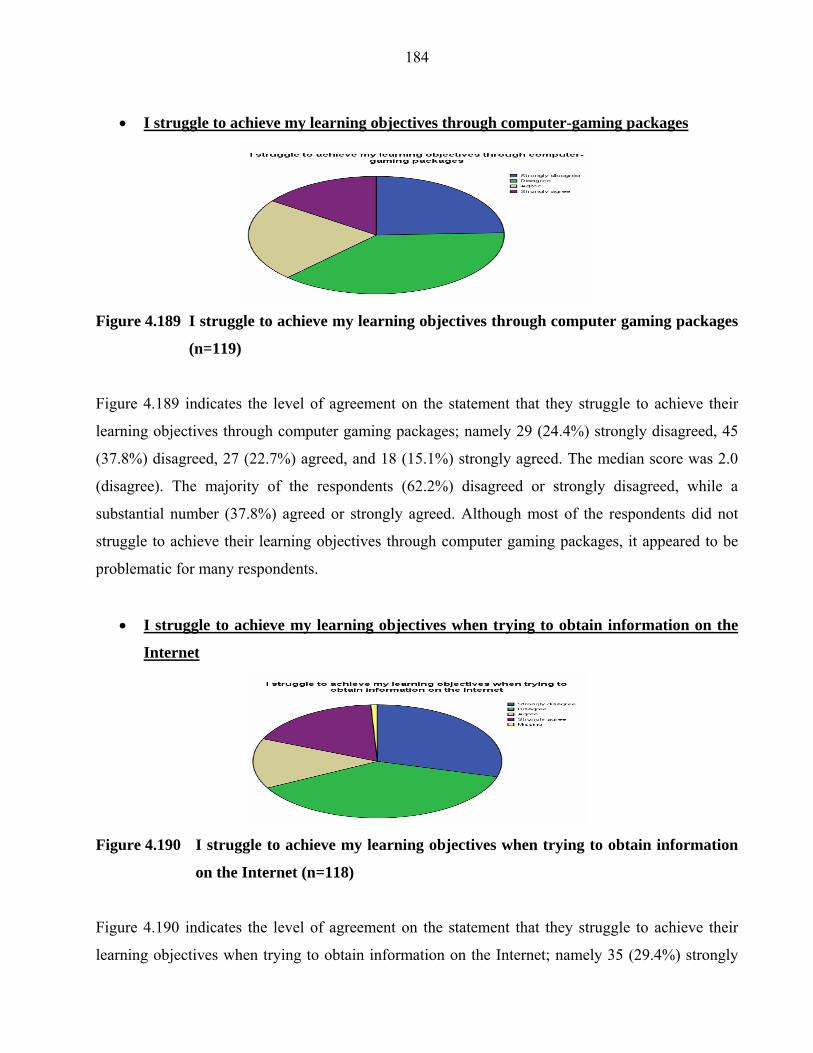
184
• I struggle to achieve my learning objectives through computer-gaming packages
Figure 4.189 I struggle to achieve my learning objectives through computer gaming packages
(n=119)
Figure 4.189 indicates the level of agreement on the statement that they struggle to achieve their
learning objectives through computer gaming packages; namely 29 (24.4%) strongly disagreed, 45
(37.8%) disagreed, 27 (22.7%) agreed, and 18 (15.1%) strongly agreed. The median score was 2.0
(disagree). The majority of the respondents (62.2%) disagreed or strongly disagreed, while a
substantial number (37.8%) agreed or strongly agreed. Although most of the respondents did not
struggle to achieve their learning objectives through computer gaming packages, it appeared to be
problematic for many respondents.
• I struggle to achieve my learning objectives when trying to obtain information on the
Internet
Figure 4.190 I struggle to achieve my learning objectives when trying to obtain information
on the Internet (n=118)
Figure 4.190 indicates the level of agreement on the statement that they struggle to achieve their
learning objectives when trying to obtain information on the Internet; namely 35 (29.4%) strongly

185 disagreed, 45 (37.8%) disagreed, 17 (14.3%) agreed, and 21 (17.6%) strongly agreed. There was 1
(0.8%) missing value. The median score was 2.0 (disagree). The majority of the respondents
(67.2%) disagreed or strongly disagreed, a substantial number (31.9%) agreed or strongly agreed.
Although most of the respondents did not struggle to obtain information on the Internet it appeared
to be problematic for many respondents.
• I am too depended on the computer for learning purposes
Figure 4.191 I am too depended on the computer for learning purposes (n=117)
Figure 4.191 indicates the level of agreement on the statement that they are too depended on the
computer for learning purposes; namely 67 (56.3%) strongly disagreed, 35 (29.4%) disagreed, 7
(5.9%) agreed, and 8 (6.7%) strongly agreed. There were 2 (1.7%) missing values. The median
score was 1.0 (strongly disagreed). A substantial majority of the respondents disagreed or strongly
disagreed (85.7%). The respondents were therefore generally not too dependent on the computer for
learning purposes.
• I loose sight of my learning objectives because I focus too much on the technical
equipment
Figure 4.192 I loose sight of my learning objectives because I focus too much on the technical
equipment (n=119)

186 Figure 4.192 indicates the level of agreement on the statement that they lose sight of their learning
objectives because they focus too much on the technical equipment; namely 62 (52.1%) strongly
disagreed, 32 (26.9%) disagreed, 15 (12.6%) agreed, and 10 (8.4%) strongly agreed. The median
score was 1.0 (strongly disagree). A substantial majority (79.0%) disagreed or strongly disagreed.
The respondents therefore generally did not loose sight of their learning objectives because they
focused too much on the technical equipment.
• Personal contact with other learners is too limited
Figure 4.193 Personal contact with other learners is too limited (n=119)
Figure 4.193 indicates the level of agreement on the statement that personal contact with other
learners is too limited; namely, 34 (28.6%) strongly disagreed, 38 (31.9%) disagreed, 25 (21.0%)
agreed, and 22 (18.5%) strongly agreed. The median score was 2.0 (disagree). The majority of the
respondents (60.5%) disagreed or strongly disagreed, and a substantial number (39.5%) agreed or
strongly agreed. Although most respondents did not believe that personal electronic contact with
their peers was too limited, it is problematic for many.
• Personal contact with my tutors is too limited
Figure 4.194 Personal contact with my tutors is too limited (n=119)
187 Figure 4.194 indicates the level of agreement on the statement that personal contact with their tutors
is too limited; namely 30 (25.2%) strongly disagreed, 40 (33.6%) disagreed, 23 (19.3%) agreed, and
26 (21.8%) strongly agreed. The median score was 2.0 (disagree). A slight majority of the
respondents (58.8%) disagreed or strongly disagreed, but a substantial number (41.1%) agreed or
strongly agreed. Helping respondents to increase personal electronic contact with their tutors
therefore requires attention.
4.2.5.3 Comparison between the responses of the second and third year respondents
The Mann-Whitney U-test indicated that there were no significant differences between the second
and third year respondents’ responses on the following items:
• I struggle to operate the computer equipment (p=0.466)
• I struggle to operate the computer software (packages) functions (p=0.619)
• I struggle to remain up-to-date with developments in computer technology (p=0.531)
• I feel insecure during the learning process (p=0.244)
• I cannot afford the necessary computer equipment (p=0.660)
• A lack of computer facilities hamper my access to computer assisted instruction (p=0.837)
• I am hampered by frequent power failures (p=0.117)
• I am hampered in utilising the Internet by an unreliable telephone connection (p=0.477)
• Technical assistance in the media centre is insufficient (p=0.060)
• A learning facilitator is not available when I need assistance (p=0.204)
• The learning facilitator is not proficient in computer assisted instruction (p=0.534)
• Computer assisted instruction is not my preferred way of learning (p=0.345)
• Computer assisted instruction makes me to lose interest in learning (p=0.174)
• My concentration span goes down (p=0.454)
• I struggle to independently obtain information from the Internet (p=0.865)
• I struggle to achieve my learning objectives through reading skills computer packages
(p=0.310)
• I struggle to achieve my learning objectives through typing skills computer packages
(p=0.529)
• I struggle to achieve my learning objectives computer literacy packages (p=0.624)

188
• I struggle to achieve my learning objectives through text-based course content computer
packages (p=0.649)
• I struggle to achieve my learning objectives through multimedia course content computer
packages (p=0. 931)
• I struggle to achieve my learning objectives through text-based computer packages, which
provide scenarios that develop my problem-solving skills (p=0.583)
• I struggle to achieve my learning objectives through multimedia computer packages, which
provide scenarios that develop my problem-solving skills (p=0.373)
• I struggle to achieve my learning objectives through computer packages simulating clinical
situations, which develop my decision-making skills (p=0.0.973)
• I struggle to achieve my learning objectives through computer-gaming packages (p=0.478)
• I struggle to achieve my learning objectives when trying to obtain information on the
Internet (p=0.619)
• I am too depended on the computer for learning purposes (p=0.323)
• I lose sight of my learning objectives because I focus too much on the technical equipment
(p=0.550)
• Personal contact with other learners is too limited (p=0.737)
• Personal contact with my tutors is too limited (p=0.812)
The Mann-Whitney U-test indicated that there was a significant difference between the second and
third year respondents’ responses on the following item:
• The computer equipments in the media centre are unreliable (p=0.021) The third year
respondents (mean=2.50) were more inclined than the second year respondents (mean=2.20)
to agree that the computer equipments in the media centre are unreliable
4.2.6 Learner preference with regard to teaching strategy
Sections F of the questionnaire dealt with whether the respondents preferred computer assisted
instruction or traditional teaching strategies.

189 4.2.6.1 Second year respondents
The research findings pertaining to the second year respondents are presented in the following
section. The colour codes for the responses in the pie diagrams are as follows:
Prefer computer assisted instruction; Prefer traditional teaching;
Missing value
• Respondents’ teaching strategy preference
Figure 4.195 Indication of preferences between computer assisted instruction and traditional
teaching as teaching strategies (n=153)
Figure 4.195 indicates that 106 (61.6%) of the respondents preferred computer assisted instruction
as a teaching strategy, and 47 (27.3%) preferred traditional teaching. There were 19 (12.4%)
missing values. The mode is 1.00 respondents (prefer computer assisted instruction). Although the
majority of respondents (61.6%) preferred computer assisted instruction as a teaching strategy,
some (27.3%) indicated the contrary.
4.2.6.2 Third year respondents
The research findings pertaining to the second year respondents are presented in the following
section. The colour codes for the responses in the pie diagrams are as follows:
Prefer computer assisted instruction; Prefer traditional teaching;
Missing value

190
• Respondents’ teaching strategy preference
Figure 4.196 Indication of preferences between computer assisted instruction and traditional
teaching as teaching strategies (n=108)
Figure 4.196 indicates that 89 (74.8%) of the respondents preferred computer assisted instruction as
a teaching strategy and 19 (16.0%) preferred traditional teaching. There were 11 (9.2%) missing
values. The mode is 1.00 (prefer computer assisted instruction). A substantial majority of
respondents (74.8%) therefore preferred computer assisted instruction as a teaching strategy.
4.3 CONCLUSION
Chapter four constitutes the research findings. Although the respondents indicated that they
preferred computer assisted instruction as a teaching strategy to the traditional method, the findings
revealed evidence of ineffective of this teaching strategy. In the next chapter, the researcher
discusses the research results, the limitation of the study, recommendations and conclusions.