Embed Size (px)
Citation preview
1
Chapter 3: Functions
Index: A: Introduction to Functions 1 Page 2 B: Introduction to Functions 2 (U3 L1) Page 8 C: Function Notation (U3 L2) Page 13 D: Graphs of Functions (U3 L3) Page 18 E: Graphical Features (U3 L4) Page 23 F: Exploring Functions Using the Graphing Calculator (U3 L5) Page 27 G: Average Rate of Change (U3 L6) Page 31 H: The Domain and Range of a Function (U3 L7) Page 36

2
Name:_____________________________________________________ Date:_________________ Period:_________ Algebra I Introduction to Functions 1 3A
Relations & Functions A relation is a set of ordered pairs. Example
The domain is the set of all of the x-coordinates from the ordered pairs.
Ex: __________________________
The range is the set of all of the y-coordinates from the ordered pairs.
Ex: __________________________ The graph of a relation is the set of points on a graph equivalent to the ordered pairs in the relation.
Options for representing a relation 1) ____________________________________ 2) ____________________________________ 3) ____________________________________ 4) ____________________________________ 5) ____________________________________ ____________________________________ Ex:

3
Exercise 1:Using the provided graph, which mapping represents the relation? a) b) c) d) Exercise 2: Express the relation below as a graph.
Relations vs. Functions Relations: A relation is simply a set of ordered pairs. A relation can be any set of ordered pairs and no special rules are applied. Functions: A function is a set of ordered pairs (relation), in which each x – element has ONE y – element associated with it. (no x repeats)
Exercise 3: Identify each of the following as a relation or function.
1) ___________________________ 2) ___________________________ 3) ___________________________

4
4) ___________________________ 5) ___________________________ 6) ___________________________
Exercise 4: Answer the following questions: _____ 1) Given the relation Which of the following values for x will make relation B a function? (1) 7 (2)9 (3) 4 (4) 5 _____ 2) The following relation is a function. (1) true (2) false _____ 3) Is the relation depicted in the chart below a function?
0 1 3 5 3 9 8 9 10 6 11 7
(1) yes (2) no Vertical Line Test: When examining a graph to determine if it is a relation or function, a vertical line can be drawn through the graph. If the vertical line intersects the graph once, then the graph is a function and if the vertical line intersects the graph more than once, the graph is a relation. Exercise 5: Identify each of the following as a relation or function.
1) ___________________________ 2) ___________________________ 3) ___________________________
Domain Range -4 5 -2 7 0 9 2 11

5
4) ___________________________ 5) ___________________________

6
Name:_____________________________________________________ Date:_________________ Period:_________ Algebra I Introduction to Functions 1 3A HW
_____ 1) Is the relation depicted in the chart below a function?
1 2 3 4 5 6 4 5 6 7 8 9
(1) yes (2) no
_____ 2) Which of the relations is a function?
(1)
(2)
(3)
(4) _____ 3) Which of the relations is not a function?
(1)
(2)
(3)
(4)
_____ 4) In 2013, the United States Postal Service charged $0.46 to mail a letter weighing up to 1 oz. and $0.20 per ounce for each additional ounce. Which function would determine the cost, in dollars, c(z), of mailing a letter weighting z ounces where z in an integer greater than 1? (1) c(z) = 0.46z + 0.20 (2) c(z) = 0.20x + 0.46 (3) c(z) = 0.46(z-1) + 0.20 (4) c(z) = 0.20(z – 1) + 0.46 _____ 5) Which of the ordered pairs is not a function? (1) (2) (3) (4) _____ 6) If the function represents the number of full hours that it takes a person to assemble x sets
of tires in a factory, which would be an appropriate domain for the function? (1) the set of real numbers (2) the set of negative numbers (3) the set of integers (4) the set of non-negative integers

7
7) Use the vertical line test to determine if it is a function. (a) (b) (c) Review Section: 8) (a) Solve the following inequality: (b) What is the smallest value of x to make this inequality true?

8
Name:_____________________________________________________ Date:_________________ Period:_________ Algebra I Introduction to Functions 2 3B The concept of the function ranks near the top of the list in terms of important Algebra concepts. Almost all of higher-level mathematical modeling is based on the concept. Like most important ideas in math, it is relatively simple:
THE DEFINITION OF A FUNCTION A function is a clearly defined rule that converts an input into at most one output.
These rules often come in the form of: (1) equations, (2) graphs, (3) tables, and (4) verbal descriptions. Exercise #1: Consider the function rule: multiply the input by two and then subtract one to get the output. (a) Fill in the table for the inputs and outputs. Inputs (c) Graph the function rule on the graph paper are often designated by and outputs by . shown below. Use your table in part a to help. (b) Write an equation that gives this rule in symbolic form. Exercise #2: In the function rule from #1, what input would be needed to produce an output of 17? Why is it harder to find an input when you have an output than finding an output when you have an input? Exercise #3: A function rule takes an input, n, and converts it into an output, y, by increasing one half of the input by 10. Determine the output for this rule when the input is 50 and then write an equation for the rule in symbolic form.

9
Exercise #4: Function rules do not always have to be numerical in nature, they simply have to return a single output for a given input. The table below gives a rule that takes as an input a neighborhood child and gives as an output the month he or she was born in. (a) Why can we consider this rule a function? (b) What is the output when the input is Rosie? (c) Find all inputs that give an output of May. Why does this not violate the definition of a function even though there are two answers?
Functions are useful because they can often be used to model things that are happening in the real world. The next exercises illustrates a function given only in graphical form. Exercise #5: Charlene heads out to school by foot on a fine spring day. Her distance from school, in blocks, is given as a function of the time, in minutes, she has been walking. This function is represented by the graph given below. (a) How far does Charlene start off from school? (b) What is her distance from school after she has been walking for 4 minutes? (c) After walking for six minutes, Charlene stops to look for her subway pass. How long does she stop for? (d) Charlene then walks to a subway station before (e) How long did it take for her to get to school once heading to school on the subway (a local). How she got on the train? many blocks did she walk to the subway?

10
Name:_____________________________________________________ Date:_________________ Period:_________ Algebra I Introduction to Functions 2 3B HW 1.) Decide whether each of the following relations is a function. Explain your answer.
Input Output Function? States Capitals
States Cities
Families Pets
Families Last names
2.) In each of the following examples, use an input-output chart to decide if the following relation is a function. (a) Consider the following relation: multiply the (b) Consider the following table: input by five and then subtract seven to get the output. Function? Yes or No? Function? Yes or No? (c) Consider the following graph. (d) Consider the following graph. Function? Yes or No? Function? Yes or No?

11
3.) Andrew has a new job at the local pizza store as a delivery boy. The following graph shows one of his deliveries he made. Analyze the graph and answer the following questions. (a) How long was the entire delivery trip? (b) If he arrived at the house after 4 minutes, how far away was the house from the pizza place? (c) Why might Andrew have stopped 3 times for 1 minute? (d) Was Andrew’s trip longer going to the house or coming back? 4.) Given the following scenario, graph a function that would map Liza’s distance away from her house according to the time elapsed. Liza has a few items she needs to pick up from a grocery store 8 blocks away. Liza travels as a constant rate of 2 blocks per minute when not stopped at a light. On her way to the grocery store she doesn’t hit any red lights and the trip takes her 4 minutes. She spends 8 minutes in the grocery store and then starts to head home. When she’s halfway home she hits a red light that lasts 3 minutes. After the light ends, she then drives the second half of the way home.

12
Review Section:
5.) Which value of x is the solution of
?
[1]
[2]
[3]
[4]
6.) The product of a number and 3, increased by 5, is 7 less than twice the number. Which equation can be used to find this number, ? [1] [2] [3] [4] 7.) Which value of x is a solution of the inequality ? [1] 13 [2] 14 [3] 15 [4] 16 8.) A total of 1680 ounces of pet food have to be packed in 5-pound bags. How many 5-pound bags of pet food can be packed?
[1] 21 [2] 28 [3] 105 [4] 336 9.) The equation illustrates the use of which property? [1] distributive property [2] associative property of addition [3] associative property of multiplication [4] commutative property of multiplication 2 10.) If , what is the value of ? [1] 6 [2] 5 [3] 3 [4] 7

13
Name:_____________________________________________________ Date:_________________ Period:_________ Algebra I Function Notation 3C Since functions are rules that convert inputs (typically x-values) into outputs (typically y-values), it makes sense that they must have their own notation to indicate what the what the rule is, what the input is, and what the output is. In the first exercise, your teacher will explain how to interpret this notation.
Exercise #1: For each of the following functions, find the outputs for the given inputs.
(a) (b)
(c)
Function notation can be very, very confusing because it really looks like multiplication due to the parentheses. But, there is no multiplication involved. The notation serves two purposes: (1) to tell us what the rule is and (2) to specify an output for a given input.
Exercise #2: Given the function
do the following.
(a) Explain what the function rule does to convert (b) Evaluate and . the input into an output. (c) Find the input for which . Show the (d) If then what is ? Show work that leads to your answer the work that leads to your answer.

14
Recall that function rules commonly come in one of three forms: (1) equations (as in Exercise #1), (2) graphs, and (3) tables. The next few exercises will illustrate function notation with these three forms. Exercise #3: Boiling water at 212 degrees Fahrenheit is left in a room that is at 65 degrees Fahrenheit and begins to cool. Temperature readings are taken each hour and are given in the table below. In this scenario, the temperature, T, is a function of the number of hours, h.
(a) Evaluate and (b) For what value of is (c) Between what two consecutive hours will Explain how you arrived at your answer.
Exercise #4: The function is defined by the graph shown below. It is known as piecewise linear because it is made up of straight line segments. Answer the following questions based on this graph. (a) Evaluate each of the following: (b) Solve each of the following for all values of the input, , that make them true. (c) What is the largest output achieved by the function? At what value is it hit?

15
Name:_____________________________________________________ Date:_________________ Period:_________ Algebra I Function Notation 3C HW 1.) Given the function defined by the formula find the following:
(a) (b) (c) (d)
2.) Given the function defined by the formula
find the following:
(a) (b) (c) (d) 3.) Given the function defined by the formula find the following: (a) (b) (c) (d)
4.) If the function is defined by
then which of the following is the value of
[1] [2] 2 [3] 14 [4] 7
5.) If the function and
then which of the following is a true statement?
[1] [2] [3] [4]

16
6.) Based on the graph of the function shown below, answer the following questions. (a) Evaluate each of the following. Illustrate with a point on the graph. (b) What values of x solve the equation ? These are called the zeros of the function. (c) How many values of x solve the equation How can you illustrate your answer on the graph?

17
7.) Physics students drop a ball from the top of a 100 foot high building and model its height above the ground as a function of time with the equation . The height, , is measured in feet and time, , is measured in seconds. Be careful with all calculations in this problem and remember to do the exponent first! (a) Find the value of Include proper units (b) Calculate Does our equation predict that What does this output represent? the ball has hit the ground at 2 seconds? Explain. 8.) If you knew that , then what coordinate point must lie on the graph of ? Explain your reasoning. Review Section: 9.) The length of a rectangle is represented by and the width is represented by . (a) Express the perimeter of the rectangle as a trinomial. (b) Express the area of the rectangle as a trinomial.

18
10.) The product of and is: [1] [2] [3] [4] 11.) It takes a snail 500 hours to travel 15 miles. At this rate, how many hours will it take the snail to travel 6 mi? [1] 0.18 [2] 5.56 [3] 150 [4] 200 12.) What is the solution of [1] [2] [3] [4] 13.) Is the following considered a function? Explain why or why not. {(3,4),(-1,3),(3,5),(6,-1)}

19
Name:_____________________________________________________ Date:_________________ Period:_________ Algebra I Graphs of Functions 3D Graphs are one of the most powerful ways of visualizing a function’s rule because you can quickly read outputs given inputs. You can also easily see features such as maximum and minimum output values. Let’s review some of those skills in Exercise #1. Exercise #1: Given the function defined by the graph below, answer the following questions. (a) Find the value of each of the following: (b) For what values of x does ? Illustrate on the graph. (c) State the minimum and maximum values of the function. So, if we can read a graph to produce outputs (y-values) if we are given inputs (x-values), then we should be able to reverse the process and produce a graph of the function from its algebraically expressed rule.
Exercise #2: Consider the function given by the rule (a) Fill out the table below for the inputs given. (b) Draw a graph of the function on the graph.
20
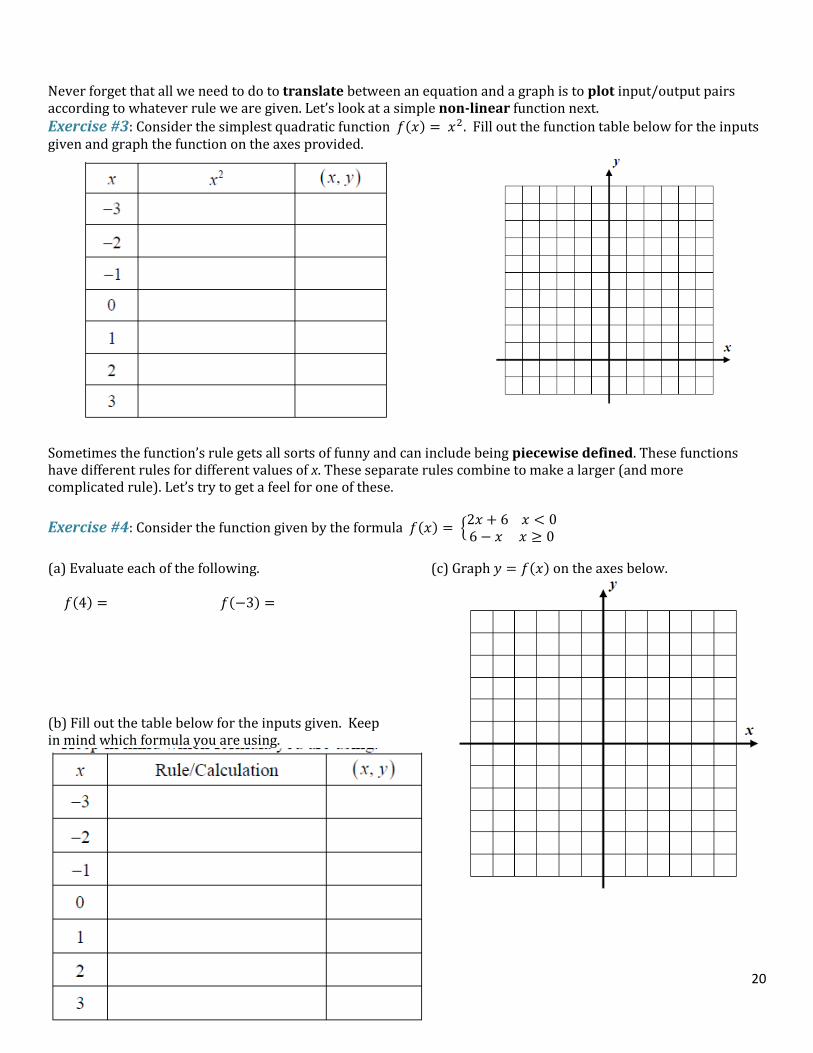
Never forget that all we need to do to translate between an equation and a graph is to plot input/output pairs according to whatever rule we are given. Let’s look at a simple non-linear function next.
Exercise #3: Consider the simplest quadratic function . Fill out the function table below for the inputs given and graph the function on the axes provided. Sometimes the function’s rule gets all sorts of funny and can include being piecewise defined. These functions have different rules for different values of x. These separate rules combine to make a larger (and more complicated rule). Let’s try to get a feel for one of these.
Exercise #4: Consider the function given by the formula
(a) Evaluate each of the following. (c) Graph on the axes below. (b) Fill out the table below for the inputs given. Keep in mind which formula you are using.

21
Name:_____________________________________________________ Date:_________________ Period:_________ Algebra I Graphs of Functions 3D HW 1.) Using the graph of the function shown below, answer the following questions. (a) Find the value of each of the following: (b) For how many values of x does Illustrate on the graph. (c) What is the intercept of this relation? (d) State the maximum and minimum values the graph obtains. (e) Explain why the graph above represents a function. 2.) Consider the function . Fill out the function table below for the inputs given and graph the function on the axes provided.

22
3.) The following graph represents the cost of a phone plan after a certain number of text messages used in a month. Analyze the graph to answer the following questions. (a) How much would you have to pay if you used: 500 text messages ________________________ 1800 text messages _________________________ (b) Interpret (c) What might have caused the graph to begin increasing at 800 text messages?
4.) Consider the following relationship given by the formula
(a) Evaluate each of the following: (d) Graph on the axes below. (b) Carefully evaluate (c) Fill out the table below for the inputs given. Keep in mind which formula you are using.
(e) What is the minimum value of the function? Circle the point that indicates this value on the graph.

23
Review Section: 5.) An example of an algebraic equation is: [1] [2] [3] [4] 6.) What is the value of the expression when ? [1] [2] [3] 21 [4] 45 7.) Which relation is a function? [1] [2] [3] [4] 8.) When is subtracted from the result is: [1] [2] [3] [4] 9.) Three times the sum of a number and four is equal to five times the number, decreased by two. If x represents the number, which equation is a correct translation of the statement? [1] [2] [3] [4] 10.) Which value of x is the solution of the equation [1] 1 [2] 2 [3] 6 [4] 0

24
Name:_____________________________________________________ Date:_________________ Period:_________ Algebra I Graphical Features 3E There is a lot of terminology associated with the graph of a function. Many of the terms have names that are descriptive, but still, work is needed to master the ideas.
Exercise #1: The Function is shown graphed below over the interval . (a) Find the maximum and minimum values of the function. State the values of x where they occur as well. (b) What is the y-intercept of the function? Explain why a function cannot have more than one y-intercept. (c) Give the x-intercepts of the function. These are also known as the function’s zeroes because they are where (d) Would you characterize the function as (e) one additional interval over which the function increasing or decreasing on the domain is increasing and one over which it is decreasing. interval . Explain your answer Increasing: __________________________________________ Decreasing: _________________________________________ (f) The following points are known as turning points. Each can be classified as a relative maximum or a relative minimum. State which you think each point is:

25
Let’s get some more practice with piecewise defined functions and mix in our function terminology while we are at it.
Exercise #2: Consider the piecewise linear function given the equation
(a) Create a table of values for this function below over the interval . Then create a graph on the axes for this function.
(b) State the zeros of the function. (c) State the function intercept (d) Give the interval over which the function is increasing (e) Give the coordinates of the one turning point and Give the interval over which it is decreasing classify it as a relative minimum or maximum. Increasing: __________________________________ Decreasing: _________________________________ (f) Use your graph to find all solutions to the equation (g) State the interval over which this function is Illustrate your solution graphically and positive. How can you tell this quickly from the find evidence in the table you created. graph?

26
Name:_____________________________________________________ Date:_________________ Period:_________ Algebra I Graphical Features 3E HW 1.) The function is shown graphed over the interval (a) Evaluate each of the following: (b) Find all the relative maximum and minimum values of the function. State the values of x where they occur as well. (c) What are the absolute maximum and minimum values of the function? At what values do they occur? (d) What are the x and intercept(s) of the function? List each of the following as an ordered pair interecept (s): _______________________________ intercept(s): _____________________________________ (zeros) (e) Give an interval over which the function is increase and one interval which it is decreasing. Increasing: __________________________________ Decreasing: ________________________________________ (f) Use your graph to find all solutions to the equation Illustrate your solution graphically. (g) Is the function positive or negative on the interval ? How can you tell quickly?

27
2.) On the following set of axis, create the graph of a function with the following characteristics: Passes through the points: and Has an absolute maximum at Has an absolute minimum at Decreasing on the interval 3.) The following graph shows the height, h, above the ground of a toy rocket t seconds after it was fired. Use the graph of to answer the following questions. (a) What was the maximum height the rocket reached? After how many seconds? (b) How many seconds was the rocket in flight? (c) Interpret (d) Give the interval for t over which the height of the rocket is decreasing. Review Section: 4.) Which expression represents “5 less than twice x”? [1] 2x – 5 [2] 2(5 – x) [3] 5 – 2x [4] 2(x – 5)
5.) A soda container holds
gallons of soda. How many ounces of soda does this container hold?
[1] 44 [2] 176 [3] 640 [4] 704 6.) If the expression is equivalent to , what is the value of a? [1] 12 [2] 32 [3] 2 [4] 4 7.) When is subtracted from , the result is [1] [2] [3] [4] 8.) Solve the inequality algebraically for x.

28
Name:_____________________________________________________ Date:_________________ Period:_________ Algebra I Exploring Functions 3F Graphing calculators are powerful tools in our exploration of functions and the rules that define them. Because calculators are so good at doing calculations, it is fairly easy to have them evaluate expressions that are the rules for generating the outputs for the functions. Throughout this entire lesson, we will assume that you have a calculator that can do the following:
We can use our calculator to help us produce tables that are very useful in plotting graphs and exploring functions.
Exercise #1: Consider the linear function
. Do the following by using your graphing calculators
table function. (a) Evaluate and . (b) Explore the table to determine the value of x for which . (c) Use the table to fill out the following table and graph the function on the grid for the interval . (d) Graph the linear function on the same set of axes and find where the two lines intersect. (e) Show that the point you found in part d is a solution to both equation:
and

29
The calculator can do the heavy lifting with the calculations, while we examine the results. Always be careful when entering algebraic expressions on your calculator. Let’s take a look at a quadratic function using the graphing calculator. Exercise #2: Consider the function over the interval Do the following with the use of tables on your graphing calculator. (a) Create a table of values for this function. (b) Create a graph of your function on the axes below. (c) What are the function’s minimum and maximum values on this interval? (d) Over what interval is the function negative? (e) For your graph, state the interval over which the function is increasing. (f) How can this graph help to solve the equation ? Can you solve this by looking at your table?
Exercise #3: Which of the following is a point where
and intersect?
[1] [2] [3] [4]

30
Name:_____________________________________________________ Date:_________________ Period:_________ Algebra I Exploring Functions 3F HW 1.) Consider the function Evaluate the following using your graphing calculator. (a) (b) (c) (d) 2.) Given the function fill in the missing values in the table then using the table graph the function on the grid for the interval. Use your calculator. 3.) Which of the following values of x will make the equation true? Show the table on your calculator that justifies your choice. [1] [2] [3] [4] 4.) Profits for the upcoming year for a shipping company have been quantified and put into the equation
where x is the number of packages shipped in thousands and is the corresponding
profit in millions of dollars. (a) Use your calculator to fill out the following table and graph the function on the grid to the right.

31
(b) Over what interval is What does this interval represent? (c) Evaluate What might this stand for? (d) Explore the table to determine the value of x for which What might this stand for? 5.) After placing an equation into his calculator Rob got the following table. He then determines that when . Is he correct? Explain your answer.
Review Section: 6.) Oatmeal is packaged in a cylindrical container, as shown in the diagram. The diameter of the container is 13 centimeters and its height is 24 centimeters. Determine, in terms of , the volume of the cylinder .
7.) What is the quotient of:
8.) Marcy determined that her father’s age is four less than three times her age. If x represents Marcy’s age, which expression represents her father’s age? [1] [2] [3] [4]

32
Name:_____________________________________________________ Date:_________________ Period:_________ Algebra I Average Rate of Change 3G Functions are rules that give us outputs when we supply them with inputs. Very often, we want to know how fast the outputs are changing compared to a change in the input values. This is referred to as the average rate of change of a function.
Exercise #1: Max and his younger sister Evie are having a race in the backyard. Max gives his sister a head start and they run for 20 seconds. The distance they are along in the race, in feet, is given below with Max’s distance given by the function and Evie’s distance given by the function (a) How do you interpret the fact that Illustrate your response by using your graph. (b) If both runners start at how much of a head start does Max give his little sister? How can you tell? (c) Does Max catch up to his sister? How can you tell? (d) How far does Max run during the 20 second race? How far does Evie run? What calculation can you do to find Evie’s distance? (e) How fast do both Evie and Max travel? In other words, how many feet do each of them run per second? Express your answer in decimals and attach units.
MAX’S SPEED EVIE’S SPEED
(FEET PER SECOND) (FEET PER SECOND)

33
In the first exercise we were calculating the rate that the function’s output (y-values) were changing compared to the function’s input (or x-values). This is known as finding the average rate of change of the function. You might think you’ve seen this before. And you have.
Exercise #2: Finding the average rate of change is the same as finding the _____________ of a line. There is, of course, a formula for finding average rate of change. Let’s get it out of the way.
Exercise #3: Consider the function given by Find its average rate of change from to Carefully show the work that leads to your final answer.
Exercise #4: The function is given in the table below. Which of the following gives its average rate of change over the interval ? Show your calculations that lead to your answer.
[1]
[2]
[3]
[4]
Exercise #5: A function is represented by the table provided. What is the average rate of change for the table provided?
Exercise #6: Frances is selling glasses of lemonade. The function
models the number of glasses she
has sold after hours. What is the average rate at which she is selling lemonade between and hours. Include proper units in your answer.

34
Name:_____________________________________________________ Date:_________________ Period:_________ Algebra I Average Rate of Change 3G HW 1.) Consider the function given by . Find its average rate of change between the following points. Carefully show the work that leads to your final answer. (a) to (b) to (c) to 2.) The function is given in the table below. Find its average rate of change between the following points. Show the calculations that lead to your answer. (a) to (b) to 3.) The function is given in the graph below. Find its average rate of change between the following points. Show the calculations that lead to your answer. (a) to (b) to

35
4.) The following table shows the number of points the Arlington girls team scored in their last basketball game where t is the time passed in minutes and the total number of points scored after t minutes. (a) What was the average rate they were shooting in the first half of the game? Be sure to include proper units in your answer. (b) What was their average rate over the whole game? (c) Given your answers above which half of the game do you feel they had a better rate of scoring? Explain. 5.) Consider the function given by (a) Find its average rate of change from to (b) Find its average rate of change from to (c) The average rate of change for this function is always 6 (as you should have found in the first two parts of the problem). What type of function has a constant average rate of change? What do we call this

36
average rate of change in this case? Search the Internet if needed. Review Section: 6.) What is the product of and ? [1] [2] [3] [4] 7.) If five times a number is less than 55, what is the greatest possible integer value of the number? [1] 12 [2] 11 [3] 10 [4] 9 8.) The length of one side of a square is 13 feet. What is the length, to the nearest foot, of a diagonal of the square? [1] 13 [2] 18 Hint: All sides in a square are the same length. Use the [3] 19 [4] 26 Pythagorean Theorem to find the length of the diagonal. 9.) If n is an odd integer, which equation can be used to find three consecutive odd integers whose sum is [1] [2] [3] [4] 10.) When is subtracted from , the result is: [1] [2] [3] [4]

37
Name:_____________________________________________________ Date:_________________ Period:_________ Algebra I Domain & Range of a Function 3H Ultimately, all functions do is convert inputs into outputs. So, each function has two sets associated with it. Those things that serve as inputs and those things that serve as outputs. These sets are given names.
Exercise #1: Consider the function shown on the graph. (a) Evaluate each of the following: (b) Can the function rule, given by the graph, give you a value when If so, what is it? If not, why not? (c) Is in the domain of the function? (d) Give two other values of x that are not in the (e) Circle the following y-values that are in the domain of the function. range of the function? Show evidence on your
graph.
(f) Write the domain and range of this function using a single inequality.
DOMAIN RANGE

38
Exercise #2: Given the function
and the domain shown below, fill in the range. Write the set in
roster notation.
Exercise #3: Which of the following values is not in the domain of the function shown below? Illustrate your thinking by marking points on the graph [1] [2] [3] [4]
Exercise #4: Consider the piecewise linear function given by the formula
Determine the functions range.

39
Name:_____________________________________________________ Date:_________________ Period:_________ Algebra I Domain & Range of a Function 3H HW 1.) In each of the following, state the domain and range; then decide if it’s a function or not. Be sure to explain using words such as input, output, domain and range! (a) (b)
Domain: _______________________________ Domain: _______________________________
Range: _______________________________ Range: _______________________________
Function (yes/no): Function (yes/no):
2.) Consider the piecewise linear function given by the formula
. Determine the
function’s domain and range. Draw a graph of the function to fully justify your answer. Use tables on your calculator to help graph. 3.) The graph below represents the height of a ball over the interval After how many seconds was the ball 12 feet off of the ground? Explain your answer. What does your answer indicate about the range of this function?

40
4.) The following graph represents the height above the ground versus time at a resort as Thomas rides his favorite ski slope. (a) State the domain and, in your own words, what the domain represents. (b) State range and, in your own words, what the range represents. (c) What might Thomas have been doing for the interval ? What was his average rate of change? Use proper units in your answer. (d) What might Thomas have been doing for the interval ? What was his average rate of change? Use proper units in your answer and compare to what you found in (c). Review Section: 5.) Solve algebraically for x: 6.) Carla bought a dress at a sale for 20% off the original price. The sale price of the dress was $28.80. Find the original price of the dress, in dollars.

41
7.) A model rocket is launched into the air from ground level. The height, in feet, is modeled by , where x is the number of elapsed seconds. What is the total number of seconds the model rocket will be in the air?
[1] 1 [2] 2 [3] 0 [4] 16
8.) Last year, Nick rode his bicycle a total of 8000 miles. To the nearest yard, Nick rode an average of how many yards per day?
9.) Given the relation Which of the following values for x will make relation B a function? [1] 7 [2] 9 [3] 4 [4] 5
10.) The table below shows the average diameter of a pupil in a person’s eye as he or she grows older. What is the average rate of change, in millimeters per year, of a person’s pupil diameter from age 20 to age 80? [1] 2.4 [2] 0.04 [3] -2.4 [4] -0.04


![Halfway Around the World [and back]](https://img.dokumen.tips/doc/110x75/568c38dd1a28ab0235a05075/halfway-around-the-world-and-back.jpg)

