Embed Size (px)
Citation preview

Chapter 2: Trends and Conditions13
IntroductionPolicies, demographics, economic conditions, land use, environmental factors, and travel patterns all change continuously, and each has an influence on which strategies will be effective in providing travelers in Redmond with safe, reliable travel choices. This chapter examines the changes that have influenced this update of the TMP, reports on the current state of the City of Redmond and, where possible, forecasts the conditions that will affect our transportation system in the future.
Policy Developments
Key Trends
In 2011 Mayor John Marchione unveiled his vision for the City of Redmond:
“Redmond is a city with two vibrant urban centers — Downtown and Overlake — and connected neighborhoods, providing high quality, responsive services to an engaged citizenry.”
Since adoption of the first Transportation Master Plan in 2005, policy actions by the City and regional agencies have refined and reinforced Redmond’s urban center strategy, as well as its goal of increasing the diversity and sustainability of the transportation system.
City Vision
The vision is intended to influence all City work, from the biennial budget process to Comprehensive Plan updates, and was a guiding force for the TMP. The TMP responds to the community vision through its urban centers strategy, its attention to neighborhood connections, and its investments to improve mobility citywide for all users. The vision also influenced the development process of the TMP, which included a robust public outreach and engagement component. The comments and opinions voiced by participants were key to establishing the direction of the plan, which is a refinement of the direction established in the 2005 TMP.
Chapter 2:
Trends and Conditions
Development of multi‑story, mixed land uses with residential spaces above commercial spaces will spur the local market for retail and for other commercial activities.

Chapter 2: Trends and Conditions14
Four principles express the policy direction of the 2005 TMP:
1. The TMP should support the land use vision of the City of Redmond.
2. A full range of travel choices, including personal vehicles, walking, bicycling, transit, and truck freight will be needed for Redmond’s transportation system to meet future personal mobility and freight movement needs.
3. New connections will be essential to completing the multimodal network in Downtown, Overlake, and throughout the city.
4. East Link light rail from Seattle to Overlake and Downtown Redmond will be critical for connecting Redmond regionally and for organizing the local multimodal transportation networks.
For the 2013 TMP, these principles have evolved into a strategic framework, described in Chapter 1.
Designation of Overlake as a Regional Growth Center
In 2007 the Puget Sound Regional Council designated part of the Overlake neighborhood as a Regional Growth Center, prioritizing it for increased housing and employment growth, as well as additional infrastructure funding to help accommodate that growth. Redmond’s vision for the area calls for a thriving neighborhood with 16,000 residents and 70,000 employees. Overlake will continue to be home to internationally known companies and corporate headquarters, high technology research and development firms, and many other businesses, large and small.
The transformation of Overlake will require a transportation system that supports this development with convenient regional access, an efficient network for internal circulation, and a multimodal approach to facility design and intermodal connections. These transportation improvements will be paired with amenities, including landscaping, protected natural features, and enhanced opportunities for social connections. City staff and the community have planned this future transportation system through the Overlake Neighborhood Plan Update process, and this TMP update incorporates the results of that plan.
Sustainability
The Redmond Comprehensive Plan, which sets the overall direction for the City, used sustainability as an organizing theme in its 2011 update and named six principles to help guide Redmond toward its vision (for more information, see the City of Redmond Comprehensive Plan, Chapter 1: Introduction). The 2013 update of the TMP is an opportunity to incorporate these principles into the City’s transportation vision.
Complete Streets
In 2007 the Redmond City Council adopted an ordinance stating that the City will “plan for, design and construct all new transportation projects to provide appropriate accommodation for bicyclists, pedestrians, transit users and persons of all abilities in comprehensive and connected networks” (RMC 12.06.10). This “Complete Streets” ordinance is meant to ensure that Redmond’s transportation system meets the needs of all users, and states that safety, public health, and the needs of pedestrians, bicyclists, and transit users are as important as vehicular mobility and access. The Complete Streets principle has been incorporated as a fundamental value in the TMP update.
148t
h AV
E N
E
NE 40th ST
156t
h AV
E N
E
NE 24th ST
BEL-
RED
RD
BEL-
RED R
D
0 0.25 Miles
520
Overlake Urban Center
In recent years the City of Redmond has increasingly recognized the importance of sustainability in its planning documents, with sustainability defined as the meeting of the social, economic, and environmental needs of the present without compromising the ability of future generations to meet their own needs.
Chapter 2: Trends and Conditions15
Economy
Environment
Sustainability
Society
Economy
Environment
Sustainability
Society
Transportation 2040
Developed by the Puget Sound Regional Council, Transportation 2040 is an action plan for transportation in the central Puget Sound region for the next 30 years. The plan is expected to support the projected growth in this region and associated travel demand while sustainably addressing the region’s environmental, economic, transportation, safety, and overall quality-of-life objectives.
In addition to serving other important purposes, the Transportation 2040 plan guides future regional transportation funding decisions and sets a course for implementation of key regional projects and programs, affecting Redmond projects and programs of regional significance. Consistency between Redmond’s TMP and the Transportation 2040 plan is an important contributor to Redmond’s ability to leverage regional and federal funding for transportation projects. The TMP update incorporates relevant policies and projects of the Transportation 2040 plan.
Light Rail
In 2008 central Puget Sound region voters approved a transportation package that included funding for East Link, a light rail corridor extension from Downtown Seattle to Overlake via Bellevue. Once completed, East Link will connect the largest population and employment centers on the Eastside, with stations serving Seattle, Mercer Island, Bellevue, and Bel-Red, as well as Overlake in Redmond. East Link is scheduled to begin service by 2023, and by 2030 will carry about 50,000 daily riders through one of the region’s most congested travel corridors.
While East Link initially will terminate at the Overlake Transit Center, Sound Transit’s long-range plan calls for extending light rail to Downtown Redmond. Due to East Link’s ability to provide significant mobility and travel choices, this TMP update establishes East Link light rail as an important pillar in the local and regional transportation systems and identifies the infrastructure and services required to fully leverage the public investment in this major regional transportation asset.
A complete street in Redmond with facilities for pedestrians, bicyclists, and drivers

Chapter 2: Trends and Conditions16
Key Trends
• Redmond’s population and employment are forecasted to grow significantly by 2030. By that year there will be 41,000 more jobs than residents in the city, making regional transportation connections increasingly important.
• Most of the new development will be accommodated in Redmond’s urban centers — Downtown and Overlake — where mixed–use land use patterns favor lower driving rates and trips will be shorter than elsewhere in the city.
• Demand will increase for housing in walkable neighborhoods, but most Redmond residents will continue to live in single-family homes.
• Income data suggests that most Redmond residents and employees are likely to base their travel decisions on convenience and quality rather than economic necessity; a smaller proportion relies on public transit to access jobs and services.
People and the Economy
Overlake Village in 2030 will feature light rail and mixed-use development

Chapter 2: Trends and Conditions17
Figure 2. Population, employment, and dwellings in Redmond, 1980–2030
An artist’s rendition of Cleveland Street after its planned improvements in 2014
The Economic Downturn
In 2007 the U.S. entered a severe recession, resulting in reduced revenues for government services in Redmond and in communities across the nation. Private sector development in Redmond nearly halted, reducing the impact fee revenues that support local transportation system growth and maintenance. The recession officially ended in 2009, but recovery has been slow; development is not projected to recover to pre-recession levels until 2018, although the City is forecasting modest growth in the next six years.
The consequences of the economic downturn have been significant for the development and maintenance of Redmond’s transportation system. Shrinking budgets required cutbacks in current and near-term capital investments, and reduced long-term revenue forecast will require the City to carefully weigh new investments against the need for system preservation. Because the demand for transportation services will continue to grow, careful Transportation Facilities Plan project selection to advance strategic goals will be essential. This was a particularly strong consideration in this update (see Chapters 2 and 6).
Growth and Land Use
Despite the recent recession, population and employment in Redmond continue to grow. Since the 1960s Redmond’s population has increased by about 10,000 people per decade, reaching 55,000 in 2011. Employment has grown even faster — the number of jobs reached almost 79,000 that year, driven in large part by the expanding information technology sector
0
20,000
40,000
60,000
80,000
100,000
120,000
140,000 Dwellings
Population
Employment
Chapter 2: Trends and Conditions18
(see Figure 3). Note that the 2009-2010 drop in employment was affected by two factors: 1) a change in Microsoft’s job reporting methodology and 2) actual job losses. Actual job losses within Redmond totaled 6,000, while a change in Microsoft’s job location reporting procedure reassigned 8,000 jobs outside of Redmond, although no physical relocations took place.
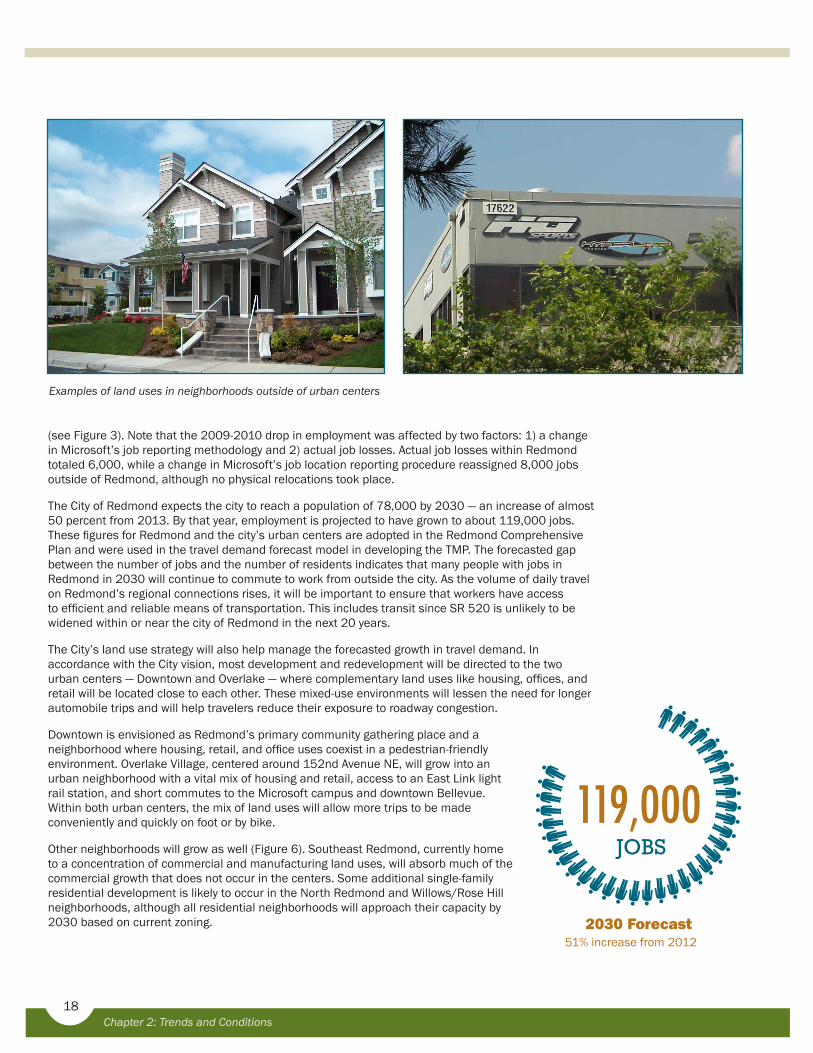
The City of Redmond expects the city to reach a population of 78,000 by 2030 — an increase of almost 50 percent from 2013. By that year, employment is projected to have grown to about 119,000 jobs. These figures for Redmond and the city’s urban centers are adopted in the Redmond Comprehensive Plan and were used in the travel demand forecast model in developing the TMP. The forecasted gap between the number of jobs and the number of residents indicates that many people with jobs in Redmond in 2030 will continue to commute to work from outside the city. As the volume of daily travel on Redmond’s regional connections rises, it will be important to ensure that workers have access to efficient and reliable means of transportation. This includes transit since SR 520 is unlikely to be widened within or near the city of Redmond in the next 20 years.
The City’s land use strategy will also help manage the forecasted growth in travel demand. In accordance with the City vision, most development and redevelopment will be directed to the two urban centers — Downtown and Overlake — where complementary land uses like housing, offices, and retail will be located close to each other. These mixed-use environments will lessen the need for longer automobile trips and will help travelers reduce their exposure to roadway congestion.
Downtown is envisioned as Redmond’s primary community gathering place and a neighborhood where housing, retail, and office uses coexist in a pedestrian-friendly environment. Overlake Village, centered around 152nd Avenue NE, will grow into an urban neighborhood with a vital mix of housing and retail, access to an East Link light rail station, and short commutes to the Microsoft campus and downtown Bellevue. Within both urban centers, the mix of land uses will allow more trips to be made conveniently and quickly on foot or by bike.
Other neighborhoods will grow as well (Figure 6). Southeast Redmond, currently home to a concentration of commercial and manufacturing land uses, will absorb much of the commercial growth that does not occur in the centers. Some additional single-family residential development is likely to occur in the North Redmond and Willows/Rose Hill neighborhoods, although all residential neighborhoods will approach their capacity by 2030 based on current zoning.
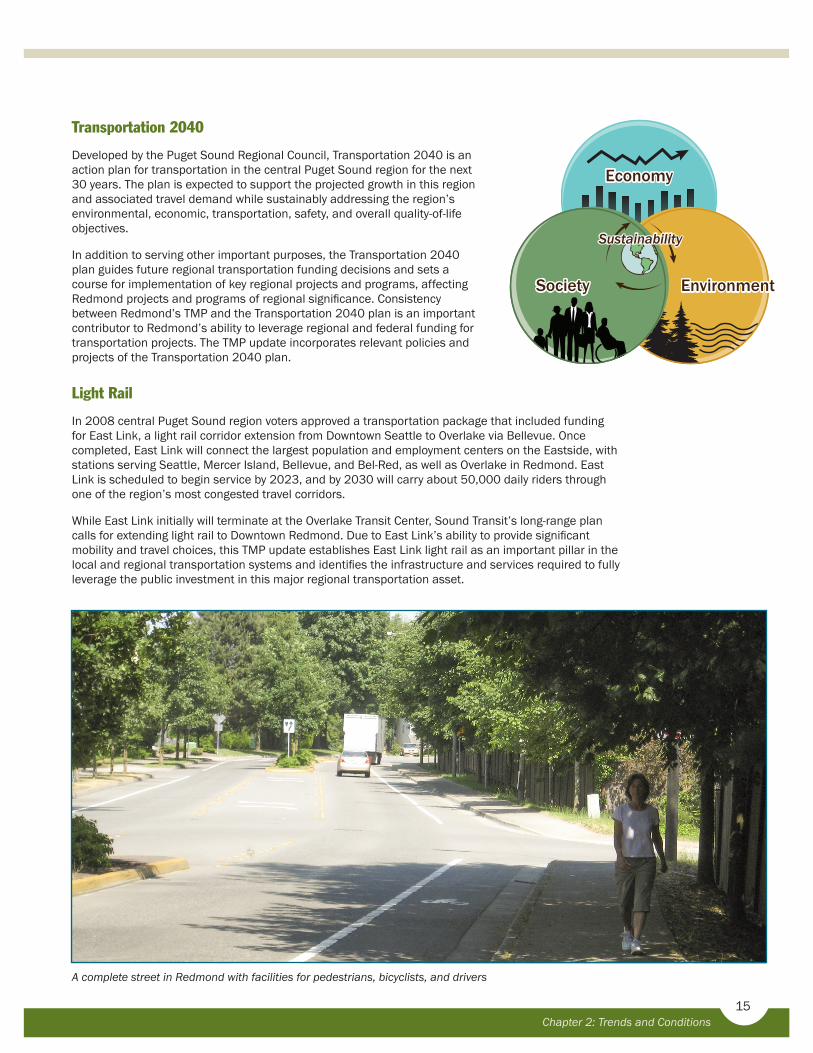
Examples of land uses in neighborhoods outside of urban centers
119,000
51% increase from 2012
JOBS
2030 Forecast

Chapter 2: Trends and Conditions19
Age and Household Size
While the median age of population in Washington State and the United States is rising due to the aging of the baby boomer generation and their children (the “Millenials”), Redmond’s median age of 34 years has remained unchanged over the past decade. Compared to Washington State and the U.S., Redmond has a younger working population and a smaller proportion of workers who are 65 years or older. Additionally, households in Redmond tend to be smaller than in the state as a whole. Between 2005 and 2010 the average household size in Redmond was 2.3, compared to 2.5 in Washington State.
National studies show that the children of the baby boomers are more likely than members of other age brackets to prefer housing in urban, walkable communities, which suggests that demand for multifamily housing in the urban centers will continue to grow, along with use of local pedestrian, bicycle, and transit connections. At the same time, many will choose detached single-family housing in Redmond’s neighborhoods, reaffirming the need for multimodal connections among neighborhoods and the urban centers. Retiring baby boomers are more likely to choose urban living than their parents’ generation, but market data suggests that most will remain where they were living before turning 50, which in Redmond is predominantly single-family housing. The automobile will remain the primary source of mobility for this group in the short term, but alternatives to driving, especially quality, all-day transit connections can ease the transition to a car-free lifestyle as baby boomers enter their 70s and 80s. Youth, who are in Redmond represented at rates similar to those in King County and Washington State, are reliant on transit, pedestrian, and bicycle connections for their independent mobility. Continued development of these networks gives youth mobility and eliminates some automobile trips.
Income
Median household income for Redmond households is higher than in Washington State or the United States as a whole. Median household income in Redmond is also growing faster. The 2009-2011 median annual household income in Redmond was $93,000, compared to $68,000 in King County. This amounts to a difference of over $25,000 in income per year. In 2000 that difference was $18,000 in 2010 dollars.
Thus, most Redmond households can afford to drive, and the choice to use public transportation or to walk or drive is likely made on the basis of comfort and convenience. A smaller proportion of Redmond residents rely on public transit to access jobs and services. Public transit and pedestrian infrastructure should be developed to a high standard to attract customers from across the income spectrum.
$92,851Median Household
$46,748Per Capita
Income $
0%
10%
20%
30%
40%
50%
60%
Under 15Years
15-44Years
45-64Years
65 Yearsand Older
Redmond
King County
Washington
Figure 3. Population by age group in Redmond, King County, and Washington State

Chapter 2: Trends and Conditions20
Environment
Water Quality
Once called “Salmonberg” due to its abundant salmon runs, Redmond has witnessed declines in the ability of its streams to support life and be safe for human contact. This is common throughout the Puget Sound region. Redmond is 71 percent developed with impervious surfaces, mainly pavement and roofs, and this developed land generates much more runoff than the wetlands and forest that preceded it. Developed lands also generate pollution, which ends up in local streams and rivers. Most of the city was developed prior to 1991, when Redmond began introducing stormwater controls, so most of the developed land does not have infrastructure to manage runoff beyond simply piping it to local water bodies.
The transportation system is a contributor to these challenges: roads cover 16 percent of Redmond’s developed land and most roads were built without stormwater management infrastructure. Without treatment or detention, stormwater from roadways surges into local streams, destroying stream habitat and bringing pollution that makes it difficult for salmon and other organisms to survive. For example, Coho salmon spend their first year of life in our local streams before returning to the ocean. Copper (which is released from car brake pads), other pollutants, and unnatural fluctuations in stream flows due to development make it hard for Coho to survive.
Addressing this existing condition will take unprecedented investment in stormwater treatment infrastructure, including major capital projects. However, as the City of Redmond continues to upgrade the transportation system, there are incremental steps that it can take to improve the quality of local waters. These are outlined in Chapter 4 — The Multimodal Transportation System, under the “Street Design Framework” section. Additionally, Redmond has adopted regulations that require private developers to include stormwater treatment facilities when buildings are constructed or substantially renovated. It will take many years, but as older buildings are replaced and roads are built to higher standards, the health of local streams and rivers will improve.
It will take many years, but as older buildings are replaced and roads are built to higher standards, the health of local streams and rivers will improve.
Key Trends
• Runoff from roads carries automobile-generated pollution into local waterways and can damage habitat if not properly managed.
• Historical development in Redmond generally did not include facilities to treat and control stormwater. As new roads and buildings replace older development, the health of Redmond’s waters will gradually improve, since new development will include treatment, employ runoff reduction strategies, and detain runoff.
• Air quality in Redmond is good and improving.

Chapter 2: Trends and Conditions21
Air Quality
Internal combustion vehicles, which include most cars and trucks, emit gases and particles in the course of their normal operation. Some of these emissions, like water vapor, are harmless. Others can seriously damage human health, as well as the health of the ecosystems we depend on for life. Some of the most serious pollutants from vehicles are:
• Carbondioxide(CO2):Nontoxic to humans, but contributes to the greenhouse effect, which disrupts climate patterns by raising the average global temperature.
• Carbonmonoxide(CO): Reduces oxygen delivery to the body’s tissues and organs, including the heart and brain.
• Particulatematter(PM): Linked to respiratory illnesses, heart attacks, and premature death in people with heart or lung disease.
• Nitrogenoxides(NOx)andsulfuroxides(SOx): Worsen respiratory diseases such as emphysema and bronchitis. Can aggravate existing heart disease, leading to increased hospital admissions and premature death. Additionally, these pollutants contribute to acid rain.
• OrganicGases: Are irritating to the eyes, nose, and throat. Can cause liver, kidney, and central nervous system damage. Can react with NOx to form smog.
The Leary Stormwater Treatment Wetland treats runoff from 18 acres of commercial development

Chapter 2: Trends and Conditions22
Health impacts from vehicle emissions are most severe among those who live, work, or go to school within about 700 feet of heavily trafficked roadways; but some pollutants, like PM 2.5, can cause harm at greater distances. The Washington State Department of Ecology estimates at least 1,100 premature deaths in the state due to PM 2.5 every year.
There are no continuous public air quality monitoring stations within Redmond, but sites throughout the Eastside show that air quality in the area is good today and is gradually improving. At the closest station, in Bellevue, the average annual concentration of PM 2.5 decreased by over 30 percent between 2005 and 2012, and values are well below the U.S. Environmental Protection Agency’s standard of 12 micrograms per cubic meter, which was recently strengthened from 15 micrograms per cubic meter (see Figure 4). Visibility in King County, which is influenced by particulates, NOx, and SOx, increased from a yearly average of 47 miles in 1991 to 81 miles in 2009.
By most measures, air quality is likely to continue to improve into the future as the motor vehicle fleet becomes more efficient. The Redmond travel model forecasts significant reductions in four of the five most important pollutant classes between 2010 and 2030, attributable mostly to technological improvements to automobile emissions systems (see Figure 5). PM 2.5 levels will likely increase slightly, as the increase in total driving will offset the anticipated improvements in emissions reduction technology for that particular pollutant.
Individuals can help improve the air in Redmond by choosing to live closer to work or school; walking, biking, or taking transit when possible; and by buying cleaner vehicles.
Figure 4. Average annual PM 2.5 at Bellevue NE 4th Street monitoring station
Figure 5. Projected trends for major automobile pollutants: 2010-2030
-70%
-60%
-50%
-40%
-30%
-20%
-10%
0%
10%2010 2030
Total organicgasesCarbon monoxide
Nitrogen oxides
Particulate matter (≤ 2.5 µ) Carbon dioxide
0
5
10
15
20
2005 2006 2007 2008 2009 2010 2011 2012 2013
Aver
age
Annu
al P
M 2
.5 c
once
ntra
tion
(m
icro
gram
s pe
r cub
ic m
eter
) Federal standard

Chapter 2: Trends and Conditions23
PopulationSingleOccupant
Vehicle(%)
HighOccupant Vehicle, including
carpool(%) Transit(%) Walk(%) Bike/Other(%)
Puget Sound Household –Daily Trips (2006) 44 40 4 8 5
Redmond – Daily Household Trips (2010) 47 41 4 7 1
Redmond – All Daily Trips (2010) 56 33 2 8 1
Redmond – All Daily Trips (2030) 47 33 6 13 1
Redmond – All Daily Trips (Long-range goal) 42 31 7 15 5
Travel Patterns
Mode Share
The term travel mode refers to the manner of travel and includes transit, walking, bicycling, carpooling, and driving alone. Mode share is the percentage of travel conducted by each of these modes. The success of Redmond’s urban centers and their compact growth patterns depends on achieving a more diverse mix of travel choices, with greater reliance on bicycling, walking, and transit than occurs today. In the future, the mode share in Redmond will also indicate how successful the City and other transportation agencies have been in improving the attractiveness and functionality of alternatives to single occupant vehicle travel.
Key Trends
• Observed traffic volumes have decreased between 2001 and 2010, despite increases in population and employment. Computer models predict traffic volumes will grow between 2010 and 2030.
• Trips in Redmond take place throughout the day, are mostly for purposes other than work, and are short: 75 percent are five miles or less in length, and 25 percent are less than a mile. Growth in the urban centers will reinforce this pattern of short trips.
• Commutes tend to be longer than other kinds of trips, and are concentrated during the morning and evening peak travel periods.
• Transit provides significant mobility for workers in Overlake, and the arrival of light rail to Southeast Redmond and Downtown will increase transit mode share in those areas.
Table 1. Mode share for Redmond and the Puget Sound region

Chapter 2: Trends and Conditions24
In 2010 Redmond residents chose to drive, bike, walk, and take transit at rates comparable to the rest of the region (see Table 1). Driving alone is the most commonly used mode, followed by high occupancy vehicles (including carpools) and walking.
The City’s travel model work forecasts that the percentage of trips taking place by single occupant vehicle (SOV) will drop to 47 percent as the City implements the projects and programs in the TFP, as transit options expand, and as predicted land use changes take place.
Travel Length and Purpose
A mixed, compact land use pattern improves access between housing, jobs, and services by shortening travel distances. Rather than driving several miles to a grocery store, for example, a resident in an urban center might walk a few blocks, avoiding the need to drive in congested conditions or find a parking place at the destination.
Today, three quarters of trips made by Redmond households are five miles or less, and about one quarter are less than a mile. According to results from the 2010 Redmond Household Travel Survey,
Employees arriving at the Overlake Transit Center

Chapter 2: Trends and Conditions25
many of these short trips are made on foot. In fact, when a trip is less than one mile in length, more Redmond residents walk than drive alone (see Figure 6). This pattern of shorter trips by means other than the single occupant vehicle is likely to become even more common as Downtown and Overlake grow in population and employment. Housing, retail shops, parks, and workplaces will be close to each other in these urban centers, facilitating walking, bicycling, and short transit trips.
Compared to Redmond residents, in-commuting employees tend to take longer trips (an average of 10 miles versus 6 miles for Redmond households). They are less likely to walk, and somewhat more likely to bike than the typical Redmond resident. However, employee travel trends can vary based on location. Commuters to Overlake — a transit hub and home of the main Microsoft campus — take the bus at a much higher rate than employees elsewhere: 16 percent for Overlake compared to 4 percent in the rest of the city. Although work-related trips represent just 25 percent of all travel, commuting is a significant contributor to congestion since most trips of this type are compressed into a short period of time (the morning and evening rushes). These peaks in travel demand overwhelm the street network and result in delay. For this reason, travel demand strategies that shift peak period trips to non-single occupant vehicle modes or to other times of the day can reduce the severity of congestion.
Most employees in Redmond live outside the city and commute in for work (see Figure 7), with Overlake as the destination for 40 percent of these trips. Other top destinations for commuters are Downtown (10 percent), Southeast Redmond (9 percent), and Willows (7 percent). Commuting is a significant component of daily travel in the city: Redmond’s population more than doubles during the day due to incoming trips, to an estimated 101,000 in 2011.
The Redmond travel model predicts that by 2030 about 40,000 more employees will be commuting to Redmond than today — a 40 percent increase — with most of those new trips destined for Overlake (61 percent), Southeast Redmond (21 percent), and Downtown (10 percent). The number of workers who both live and work in Redmond will grow to 27,000, or about one fifth of total Redmond commuters.
These data show that regional travel routes are particularly important for Redmond businesses and employees, given the large percentage of workers who commute in from neighboring communities. Redmond will need connections like SR 520, SR 202, and Redmond Way to serve an increasing number of commuters as the city adds jobs faster than it adds housing. Not all of this increased demand must be served by automobile trips, however. As Overlake demonstrates, Redmond employees take transit in large numbers when service is fast, frequent, reliable, and direct to the work site. Transportation demand management programs are also important elements, reducing peak hour loads on the transportation system and better utilizing existing facilities throughout the day. The alternative is widening roadways at great expense to accommodate high volumes of vehicles during peak hours, leaving the roadway system underused for most of the day.
Figure 7. Redmond employee place of residence
Figure 6. Mode split for daily household trips under one mile in Redmond. Forty percent are made on foot
Walk, 40%
Bike, 1%
Drive Alone, 28%
Shared Ride, 30%
Transit, 1%
0%
5%
10%
15%
20%

Chapter 2: Trends and Conditions26
Traffic Volumes
While driving is the most common form of travel in Redmond, traffic volumes and per person driving rates have decreased over the past decade, beginning before the economic downturn in 2008-2009. Figure 8 summarizes the past ten years of observational traffic data in Redmond. Traffic volumes have decreased over the past ten years, even as population and employment increased.
This trend of flat or declining motor vehicle volumes in Redmond is consistent with trends at the county and state levels. Per capita vehicle miles traveled (VMT), a measure of how much the average person drives in a year, is lower than at any time since before 1993 for both King County and Washington State, and total VMT is unchanged since 2000. Estimates of vehicle miles traveled (a measure of total driving) by Redmond’s travel model have also indicated a decline in total vehicle miles traveled between 2000 and 2010. However, the model projects that total driving will increase by about one-third by 2030 based on the City’s adopted land use plan (see Figure 9).
While the overall driving rate decreased in recent years, congestion is still present on Redmond streets during peak periods. Model outputs suggest that congestion will grow modestly between 2010 and 2030.
Transit Ridership
On an average weekday, about 25,000 boardings take place on public bus routes that serve Redmond, including 8,000 boardings within the city limits. Transit carries about 4 percent of all trips in Redmond and 16 percent of trips to Overlake, home of Microsoft and the largest concentration of jobs in the city.
SR 520: a critical regional connection for Redmond
Figure 8. Redmond vehicular volumes, employment, and population (actual)
-10%
-5%
0%
5%
10%
15%
20%
% c
hang
e
Traffic Volume
Employment
Population
Chapter 2: Trends and Conditions27
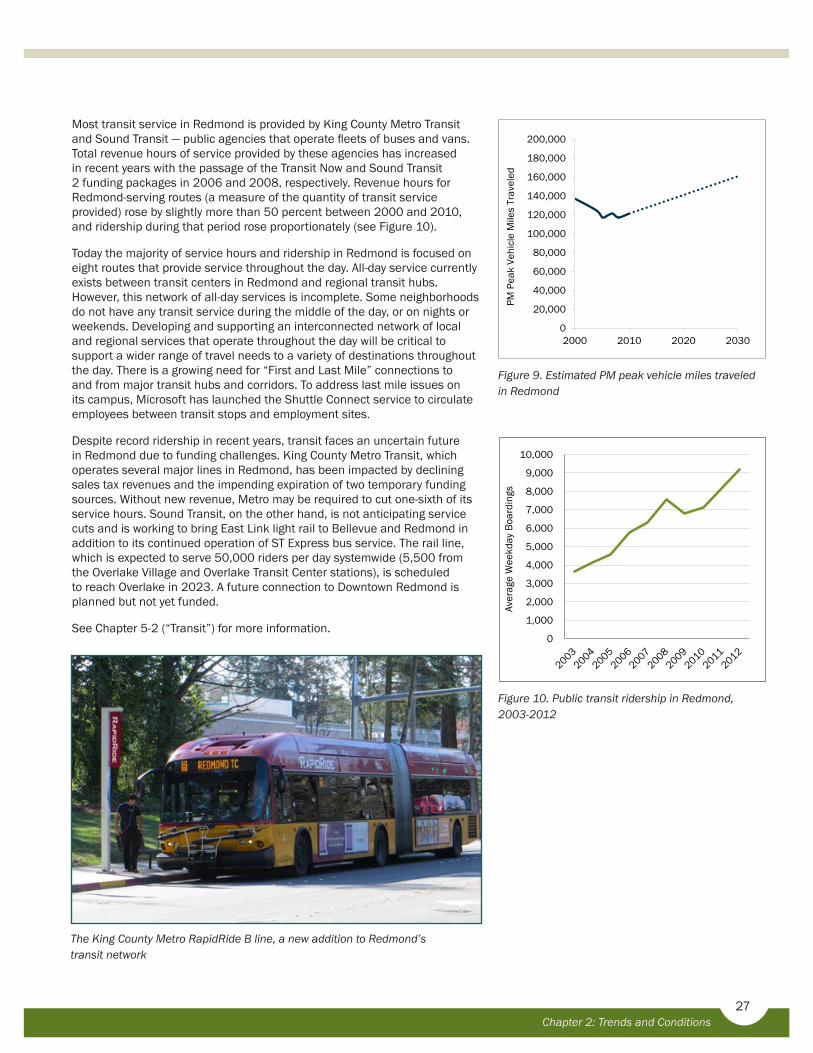
Most transit service in Redmond is provided by King County Metro Transit and Sound Transit — public agencies that operate fleets of buses and vans. Total revenue hours of service provided by these agencies has increased in recent years with the passage of the Transit Now and Sound Transit 2 funding packages in 2006 and 2008, respectively. Revenue hours for Redmond-serving routes (a measure of the quantity of transit service provided) rose by slightly more than 50 percent between 2000 and 2010, and ridership during that period rose proportionately (see Figure 10).
Today the majority of service hours and ridership in Redmond is focused on eight routes that provide service throughout the day. All-day service currently exists between transit centers in Redmond and regional transit hubs. However, this network of all-day services is incomplete. Some neighborhoods do not have any transit service during the middle of the day, or on nights or weekends. Developing and supporting an interconnected network of local and regional services that operate throughout the day will be critical to support a wider range of travel needs to a variety of destinations throughout the day. There is a growing need for “First and Last Mile” connections to and from major transit hubs and corridors. To address last mile issues on its campus, Microsoft has launched the Shuttle Connect service to circulate employees between transit stops and employment sites.
Despite record ridership in recent years, transit faces an uncertain future in Redmond due to funding challenges. King County Metro Transit, which operates several major lines in Redmond, has been impacted by declining sales tax revenues and the impending expiration of two temporary funding sources. Without new revenue, Metro may be required to cut one-sixth of its service hours. Sound Transit, on the other hand, is not anticipating service cuts and is working to bring East Link light rail to Bellevue and Redmond in addition to its continued operation of ST Express bus service. The rail line, which is expected to serve 50,000 riders per day systemwide (5,500 from the Overlake Village and Overlake Transit Center stations), is scheduled to reach Overlake in 2023. A future connection to Downtown Redmond is planned but not yet funded.
See Chapter 5-2 (“Transit”) for more information.
Figure 9. Estimated PM peak vehicle miles traveled in Redmond
Figure 10. Public transit ridership in Redmond, 2003-2012
The King County Metro RapidRide B line, a new addition to Redmond’s transit network
0
20,000
40,000
60,000
80,000
100,000
120,000
140,000
160,000
180,000
200,000
2000 2010 2020 2030
PM P
eak
Vehi
cle
Mile
s Tr
avel
ed
0
1,000
2,000
3,000
4,000
5,000
6,000
7,000
8,000
9,000
10,000
Aver
age
Wee
kday
Boa
rdin
gs

Chapter 2: Trends and Conditions28
Key Trends• Redmond has a lower rate of traffic-related injuries
when compared to neighboring cities, and the rate is dropping. The absolute number of collisions has remained steady since the beginning of the 2000s despite an increase in population and employment.
• Bicycle and pedestrian collisions experienced a spike in 2007 and 2008, but have returned to 2003 levels.
Safety
Collisions, Injuries, and Fatalities
Compared to its neighbors, Redmond has a low rate of traffic-related injuries and fatalities. In 2011 Redmond had 2.7 injuries per 1,000 people (daytime population), compared to an average of 5.6 injuries for surrounding communities (see Figure 19). Furthermore, Redmond’s injury rate has declined over 20 percent since 2002. Likely contributing factors include City of Redmond activities, such as the Targeted Safety Improvement Program, Neighborhood Traffic Calming Program, safety-oriented project design, improvements in vehicle safety technology, traffic safety education, and police enforcement initiatives.
On an absolute basis, total collisions have remained unchanged throughout the 2000s, although injury collisions declined about 20 percent. These were offset by an increase in the number of property damage-only collisions. The apparent drop in collisions in 2009 is most likely due to a change in reporting methodology at the state level: from 2009 on, only officer-reported collisions are entered into the state database.
Like the yearly collision totals shown in Figure 12, collisions involving bicyclists and pedestrians have remained steady over the past ten years despite an increase in population (see Figure 13). The number of bicycle collisions doubled between 2003 and 2008 before falling back — a trend that tracks closely with the cost of gasoline. It may be that increases in gas prices encouraged larger-than-usual numbers of people to try bicycling and walking during that time period. It may also be that the change in reporting methodology mentioned above has reduced the number of collisions that are entered into the state’s database.
Enforcement
Law enforcement is a critical component of traffic safety, and staff throughout the City work together on an ongoing basis to improve traffic safety.
The Traffic Safety Committee is an interdepartmental forum where stakeholders — Police, Public Works, Planning, and others — meet to share information and discuss strategies to improve safety, such as emphasis patrols to reduce distracted driving and to protect vulnerable users such as pedestrians and bicyclists.
Figure 11. Per capita traffic injury rates in Redmond, King County, and surrounding Eastside communities
Figure 12. Collisions in Redmond: 2001–2010
Figure 13. Pedestrian- and bicycle-involved collisions in Redmond: 2001-2010
0.0
1.0
2.0
3.0
4.0
5.0
6.0
7.0
8.0
2001 2003 2005 2007 2009 2011
Inju
ries p
er 1
,000
day
time
popu
latio
n
King County
Surrounding Eastside Communities
Redmond
0
20,000
40,000
60,000
80,000
100,000
120,000
0
200
400
600
800
1,000
1,200
Dayt
ime
Popu
latio
n
Num
ber o
f Col
lisio
ns
Property Damage-Only Collisions
Injury Collisions
Daytime Population
0
20,000
40,000
60,000
80,000
100,000
120,000
0
5
10
15
20
25
30
35
40
45
50
Dayt
ime
Popu
latio
n
Num
ber o
f Col
lisio
ns
Bicycle Collisions
Pedestrian Collisions
Daytime Population

Chapter 2: Trends and Conditions29
Transportation capital projects are also sometimes paired with increased enforcement. For example, the 164th Avenue NE rechannelization will include emphasis patrols with the goal of improving yield and signal compliance by drivers, pedestrians, and bicyclists.
Future Activities and Challenges
The City of Redmond works to ensure that Redmond residents, employees, and visitors can get to their destinations safely and comfortably. Safety is a top consideration in every project design, and staff continually monitor conditions and respond to problems should they arise. Some of the ongoing safety-related work at the City includes a yearly analysis of collision “hot spots,” the Neighborhood Traffic Calming Program, safety education and outreach to citizens in advance of special events, such as the beginning of the school year, and implementation of new technologies such as LED street lights.
Maintenance
Existing Maintenance Activities
Pavement management is the most costly maintenance activity performed by the City, representing about 40 percent of the transportation maintenance budget in 2011, or about $1.3 million per year. Preventative maintenance is highly cost-effective in the context of pavement management, since aged roadways degrade rapidly and eventually require expensive reconstruction. Simple upkeep, like regular overlays of fresh asphalt, minimizes the life cycle cost of a section of roadway (see Figure 14).
Since 2003 the average arterial pavement quality has declined from a Pavement Condition Index (PCI) of 91 (very good) to 73 (adequate) (see Figure 23). At existing funding levels, the average PCI will continue its downward trend, and some roadways will become significantly degraded. Eventually, the cost of bringing the system back to an adequate condition will begin to increase exponentially as roadways degrade and require more intensive repairs.
Figure 14. Preventative pavement maintenance results in substantial savings (Image source: FHWA)
Key Trends• Redmond has so far maintained its transportation system to a high
standard, but as the city ages additional resources will be required to avoid declines in level of service.
• New challenges, such as the maintenance of the City’s new Intelligent Transportation System infrastructure and the aging of the sidewalk network, are emerging.
100
PCI
20
Excellent
Good
Fair
Poor
Failed
Very Poor
0 5 10 15 20
40% Drop in Quality Spending $1 onPreservation here...
...eliminates or delaysspending $6 to $10on rehabilitation orreconstruction here.
40% Drop in Quality
75% of Life
12% of Life

Chapter 2: Trends and Conditions30
Other maintenance activities by the City include curb and gutter maintenance, bridge repair, traffic signal upkeep, street lights, street landscaping, stormwater facilities, and general street maintenance.
Future Issues
Compared to roadways, sidewalks have a long life expectancy — 30 to 40 years. Until recently the City has not needed to devote significant resources to sidewalk upkeep since many of Redmond’s sidewalks are relatively new. Redmond’s pedestrian infrastructure, however, is aging and more sidewalks are reaching the end of their useful lives. As a result, the Department of Public Works is developing a sidewalk inventory and budgeting system to rate the 235 miles of sidewalk that Redmond is responsible for maintaining. Once in place, the sidewalk maintenance program would identify sections needing repair or replacement and undertake a project to fix them every other year. Additionally, the City works to design sidewalks in a way that provides a long useful life, such as removing the brick banding requirement for sidewalks in Downtown, which has reduced the useful life of those sidewalks. The City must meet new federal standards for curb ramps under the Americans with Disabilities Act.
Another emerging maintenance need is the upkeep of the City’s Intelligent Transportation System (ITS) infrastructure. ITS is the system of sensors, cameras, and computers that the City uses to optimize traffic signal timings in real time. Like personal computers, the hardware and software components of this system must be replaced on a regular basis. Redmond’s ITS system was installed throughout the 2000s and is now due for an upgrade.
Figure 15. Pavement management funding scenarios
Redmond Traffic Management Center
0
10
20
30
40
50
60
70
80
90
100
2000 2010 2020 2030 2040
Inadequate
Adequate Proposed
funding
Existing funding
Zero funding

Chapter 3: Performance Measurement and Reporting31
Transportation System Implementation
2005 TMP Delivery
In the seven years since the TMP was adopted, the City, in partnership with the community and a variety of stakeholders, has achieved several significant transportation improvements that were outlined in the TMP and which advance the guiding principles. In Downtown these include the Bear Creek Parkway Extension (see Figure 25), which provided an additional street connection through Downtown Redmond and improved conditions for pedestrians and bicyclists; the 161st Avenue NE and 164th Avenue NE Extensions, which helped complete the Downtown street grid; and the Redmond Central Connector, which provides a high-quality pedestrian and bicycle connection through the heart of Downtown. In Overlake, the NE 36th Street Bridge improved connections across SR 520 and helped prepare the neighborhood for the arrival of light rail. Throughout the city new connections and spot improvements have improved mobility for all travelers. In all of this work, the City of Redmond has sought to maximize the impact of City dollars by leveraging grants and developer contributions. Between 2005 and 2012 Redmond was awarded $39 million in federal and state grants covering 17 percent of capital costs for that period.
Percentage of Network Completion
The 2005 TMP provided several ways to track the City of Redmond’s delivery of transportation improvements. One of those methods is by monitoring the completion of the 2022 Transportation Facilities Plan (TFP), which is the list of transportation projects to be completed in the 18 years following the adoption of the 2005 Plan. Despite a volatile revenue and project cost environment, 55 percent of TFP projects were completed or committed in the six-year Capital Improvement Program by the end of 2011.
Figure 16. The Bear Creek Parkway extension created an important new connection in Downtown
Key Trends
• Since 2005 the City of Redmond has delivered projects at a strong pace, with 55 percent of the 18-Year Transportation Facilities Plan completed or committed within six years.
• Delivery of Downtown pedestrian improvements and citywide bicycle system projects have occurred on pace, while Overlake Village improvements and the citywide pedestrian improvements occurred more slowly than anticipated in 2005.

Chapter 3: Performance Measurement and Reporting32
The 2005 TMP also set goals for improving the pedestrian environment on key multimodal corridors and in the urban centers, and for improving conditions for bicyclists on primary and secondary bicycle corridors. Results as of 2009 are presented in Table 2. The Downtown pedestrian environment and the citywide bicycle system saw improvements at the pace needed to reach their 2022 goals. Overlake Village did not, but is likely to see rapid improvement as the master plan for that area is implemented in coming years. There were not sufficient pedestrian projects to improve the multimodal corridors at the targeted pace.
Four years later, in 2009, 55 percent of the TFP was complete or committed. This update of the Transportation Master Plan also includes an updated TFP. At present 46 percent of total project and program funding has been committed for the next six-year period.
ConclusionSince 2005 when the previous Transportation Master Plan was adopted, the City of Redmond has continued to assume its role as a regional jobs center, and continues to experience both employment and residential growth. In order to maintain a high quality of life and the clean, green character that attracts business and residents to the city, this growth is being targeted to the city’s two urban centers: Downtown and Overlake. For these urban places to be successful, a full range of transportation choices will be needed. Without good alternatives to the single occupancy vehicle, quality of life will suffer. The Transportation Master Plan is part of the City’s work to ensure that we preserve the best aspects of Redmond’s community character, while building great urban centers that function effectively.
Year
MultimodalCorridors(%Pedestrian
SupportiveorBetter)
OverlakeVillage (%Pedestrian
SupportiveorBetter)
Downtown (%Pedestrian
SupportiveorBetter)
BicycleSystem (%CompletedbyMileage)
2007 5 9 45 51
2009 6 10 53 55
Objective (2022) 100 100 100 100
Table 2. Multimodal network completion in the 2005-2018 Transportation Facilities Plan