Embed Size (px)
Citation preview

EXISTING CONDITIONS AND GROWTH TRENDS REPORT
Existing Conditions and Growth Trends Report
Lexington Sustainable Growth Study
July 13, 2021
Prepared for:
The LFUCG Sustainable Growth Task Force
Prepared by:
Stantec Consulting Services Inc. EHI Consultants MXD Development Strategists Urban3

EXISTING CONDITIONS AND GROWTH TRENDS REPORT
Table of Contents
EXECUTIVE SUMMARY .............................................................................................................. 1
1.0 INTRODUCTION ............................................................................................................10
2.0 DEMOGRAPHIC PROFILE ..............................................................................................11
2.1 POPULATION ........................................................................................................................................................... 11
2.2 HOUSEHOLDS .......................................................................................................................................................... 13
2.3 AGE PROFILE ........................................................................................................................................................... 14
2.4 RACE AND ETHNICITY ........................................................................................................................................ 17
2.5 INCOME ...................................................................................................................................................................... 18
3.0 EMPLOYMENT...............................................................................................................19
3.1 EMPLOYMENT ANALYSIS .................................................................................................................................. 19
3.1.1 Fayette County Location Quotient .......................................................................................... 19
3.1.2 Lexington Region (excluding Fayette County) ................................................................... 23
3.2 COMMUTER PATTERNS ...................................................................................................................................... 26
4.0 LAND USE ANALYSIS .....................................................................................................29
4.1 EXISTING LAND ...................................................................................................................................................... 29
4.1.1 Zoning by Class ............................................................................................................................... 29
4.1.2 Existing Land Uses by Description .......................................................................................... 35
4.2 VACANT LAND ........................................................................................................................................................ 45
4.2.1 Vacant Land by Zoning Classification .................................................................................... 45
4.2.2 Vacant Land by Land Use Description ................................................................................... 50
4.2.3 Vacant Land by Land Use Description and Subarea ........................................................ 53
5.0 HOUSING OVERVIEW ....................................................................................................54
5.1 EXISTING HOUSING STOCK ............................................................................................................................... 54
5.2 REAL ESTATE STATISTICS ................................................................................................................................ 58
5.3 HOUSING OCCUPANCY AND COST ................................................................................................................. 65
5.4 AFFORDABLE HOUSING NEEDS ASSESSMENT ......................................................................................... 67
5.4.1 Affordable Housing Subsidies ................................................................................................... 67

EXISTING CONDITIONS AND GROWTH TRENDS REPORT
5.4.2 Market Based Housing Affordability ...................................................................................... 68
6.0 COMMERCIAL DEVELOPMENT ......................................................................................69
6.1 INDUSTRIAL ANALYSIS....................................................................................................................................... 69
6.2 6.2 OFFICE ANALYSIS .......................................................................................................................................... 73
6.3 RETAIL ANALYSIS ................................................................................................................................................. 76
7.0 FISCAL PROFILE ............................................................................................................79
7.1 REVENUE................................................................................................................................................................... 79
7.2 EXPENDITURES ...................................................................................................................................................... 83
8.0 INFRASTRUCTURE AND COMMUNITY FACILITIES ........................................................86
8.1 TRANSPORTATION ............................................................................................................................................... 86
8.1.1 Roads ................................................................................................................................................... 86
8.1.2 Transit................................................................................................................................................. 86
8.2 WATER AND SEWER ............................................................................................................................................ 87
8.3 SCHOOLS ................................................................................................................................................................ ... 89
8.4 PUBLIC SAFETY ...................................................................................................................................................... 90
8.5 PARKS AND RECREATION ................................................................................................................................. 92
9.0 POPULATION GROWTH TRENDS ..................................................................................93
10.0 COMMERCIAL GROWTH TRENDS .................................................................................95
10.1 INDUSTRIAL GROWTH TRENDS ..................................................................................................................... 95
10.1.1 Considerations Moving Forward ............................................................................................. 95
10.1.2 Trendline Analysis ......................................................................................................................... 95
10.2 OFFICE GROWTH TRENDS ................................................................................................................................ 96
10.2.1 Considerations Moving Forward ............................................................................................. 96
10.2.2 Trendline Analysis ......................................................................................................................... 97
10.3 RETAIL GROWTH TRENDS ................................................................................................................................ 97
10.3.1 Considerations Moving Forward ............................................................................................. 97
10.3.2 Trendline Analysis ......................................................................................................................... 98

EXISTING CONDITIONS AND GROWTH TRENDS REPORT
LIST OF TABLES
Table 2.1 Fayette and Regional Population ................................................................................................................ 12
Table 2.2 Fayette and Regional Households .............................................................................................................. 14
Table 2.3 2019 Age Cohort Distribution ...................................................................................................................... 15
Table 2.4 Median Age by County ..................................................................................................................................... 15
Table 2.5. Fayette Age Cohorts by Year ........................................................................................................................ 16
Table 2.6 Racial and Ethnic Population ........................................................................................................................ 17
Table 2.7 Fayette Racial and Ethnic Composition by Year ................................................................................... 17
Table 2.8 Income and Poverty Rates by County ....................................................................................................... 18
Table 2.9 Distribution of Household Income ............................................................................................................. 19
Table 3.1 Fayette County – Employment Sector Location Quotient (LQ) Analysis .................................... 20
Table 3.2 Fayette County – Economic Base & Shift-Share Analysis: 2008 - 2018 ...................................... 22
Table 3.3 Surrounding Region Employment Sector Location Quotient (LQ) Analysis ............................. 23
Table 3.4 Surrounding Region Economic Base & Shift-Share Analysis: 2008 - 2018 ............................... 25
Table 3.5 Primary Job Commutes within the Urban Service Boundary .......................................................... 26
Table 3.6 USB Commuter Inflow and Outflow ........................................................................................................... 28
Table 4.1 Existing Parcel Count, Acreage and LivUnits by Zoning Class within the USB, 2020 ............ 31
Table 4.2 Analysis of the Built Environment of Non-Residential Zoning Classes ....................................... 32
Table 4.3 Summary of Existing Industrial Zoning and Uses within the USB, 2020 .................................... 34
Table 4.4 Existing Parcel Count, Acreage, and LivUnits by Land Use within the USB, 2020 .................. 36
Table 4.5 Existing Land Uses by Subarea .................................................................................................................... 43
Table 4.6 Apartment Land Use and LivUnits by Subarea, 2020 ......................................................................... 44
Table 4.7 Summary of Vacant Land and Land in Transition by Zoning Class ............................................... 47
Table 4.8 Summary of Vacant Land and Land in Transition by Land Use Description ............................ 52
Table 4.9 Vacant Land by Land Use Description and Subarea ............................................................................ 53
Table 5.1 Housing Units by County ................................................................................................................................ 54
Table 5.2 Housing Units by Year of Construction..................................................................................................... 55
Table 5.3 Fayette County Single and Multi-unit Development ........................................................................... 57
EXISTING CONDITIONS AND GROWTH TRENDS REPORT
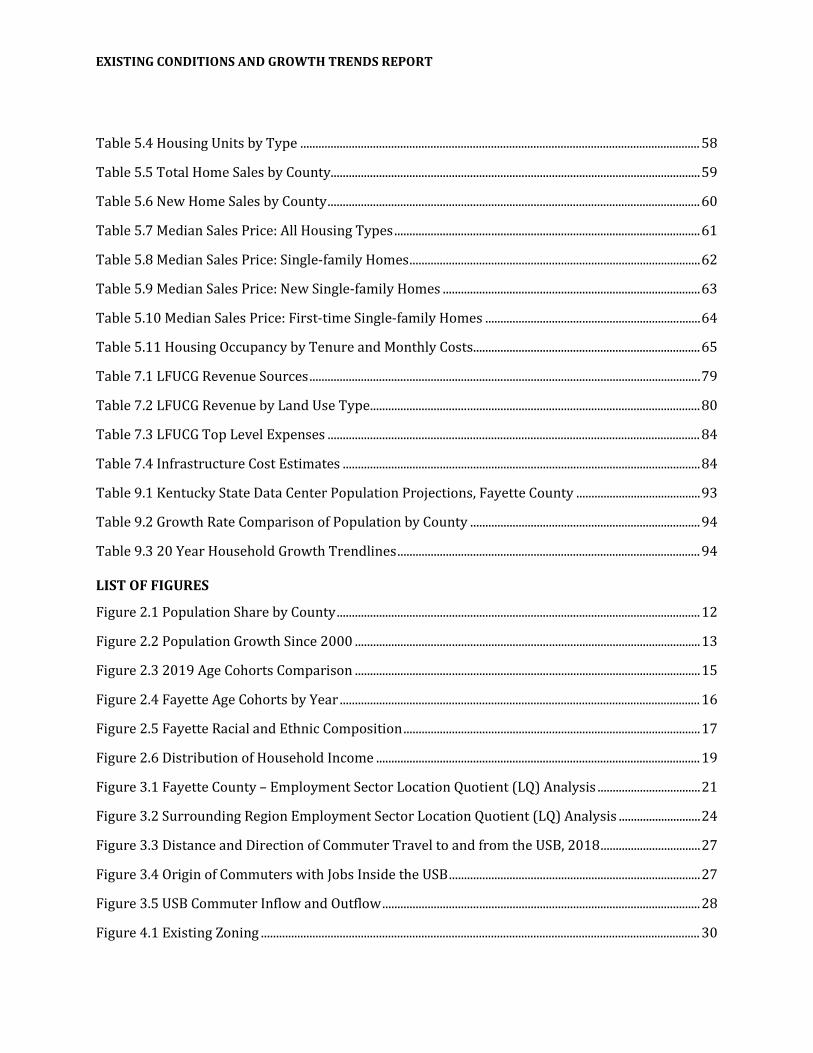
Table 5.4 Housing Units by Type .................................................................................................................................... 58
Table 5.5 Total Home Sales by County.......................................................................................................................... 59
Table 5.6 New Home Sales by County ........................................................................................................................... 60
Table 5.7 Median Sales Price: All Housing Types ..................................................................................................... 61
Table 5.8 Median Sales Price: Single-family Homes ................................................................................................ 62
Table 5.9 Median Sales Price: New Single-family Homes ..................................................................................... 63
Table 5.10 Median Sales Price: First-time Single-family Homes ....................................................................... 64
Table 5.11 Housing Occupancy by Tenure and Monthly Costs........................................................................... 65
Table 7.1 LFUCG Revenue Sources ................................................................................................................................. 79
Table 7.2 LFUCG Revenue by Land Use Type ............................................................................................................. 80
Table 7.3 LFUCG Top Level Expenses ........................................................................................................................... 84
Table 7.4 Infrastructure Cost Estimates ...................................................................................................................... 84
Table 9.1 Kentucky State Data Center Population Projections, Fayette County ......................................... 93
Table 9.2 Growth Rate Comparison of Population by County ............................................................................ 94
Table 9.3 20 Year Household Growth Trendlines .................................................................................................... 94
LIST OF FIGURES
Figure 2.1 Population Share by County ........................................................................................................................ 12
Figure 2.2 Population Growth Since 2000 .................................................................................................................. 13
Figure 2.3 2019 Age Cohorts Comparison .................................................................................................................. 15
Figure 2.4 Fayette Age Cohorts by Year ....................................................................................................................... 16
Figure 2.5 Fayette Racial and Ethnic Composition .................................................................................................. 17
Figure 2.6 Distribution of Household Income ........................................................................................................... 19
Figure 3.1 Fayette County – Employment Sector Location Quotient (LQ) Analysis .................................. 21
Figure 3.2 Surrounding Region Employment Sector Location Quotient (LQ) Analysis ........................... 24
Figure 3.3 Distance and Direction of Commuter Travel to and from the USB, 2018 ................................. 27
Figure 3.4 Origin of Commuters with Jobs Inside the USB ................................................................................... 27
Figure 3.5 USB Commuter Inflow and Outflow ......................................................................................................... 28
Figure 4.1 Existing Zoning ................................................................................................................................................. 30

EXISTING CONDITIONS AND GROWTH TRENDS REPORT
Figure 4.2 Existing Zoning within the USB by Major Use Category, 2020 ..................................................... 33
Figure 4.3 Summary of Existing Residential Zoning Acreages within the USB, 2020 ............................... 33
Figure 4.4 Existing Land Uses........................................................................................................................................... 35
Figure 4.5 Existing Land by Use Description, Acreage and Percent of Total ................................................ 37
Figure 4.6 Existing Industrial with a Land Use Code 410 by Parcel Size Range, 2020 ............................. 38
Figure 4.7 Other Land Uses ............................................................................................................................................... 39
Figure 4.8 Sub Area Descriptions .................................................................................................................................... 42
Figure 4.9 Vacant Land by Zoning Classification ...................................................................................................... 45
Figure 4.10 Vacant Land by Zoning 2020 .................................................................................................................... 46
Figure 4.11 Locations of Vacant Industrial Parcels by Acreage Range, 2020 ............................................... 48
Figure 4.12 Locations of Vacant Residential Parcels by Acreage Range ........................................................ 49
Figure 4.13 Vacant land by Land Use ............................................................................................................................ 51
Figure 5.1 Fayette County Single and Multi-Family Development ................................................................... 56
Figure 5.2 Total Home Sales by County ........................................................................................................................ 59
Figure 5.3 New Home Sales by County ......................................................................................................................... 60
Figure 5.4 Median Sales Price: All Housing Types ................................................................................................... 61
Figure 5.5 Median Sales Price: Single-family Homes .............................................................................................. 62
Figure 5.6 Median Sales Price: New Single-family Homes.................................................................................... 63
Figure 5.7 Median Sales Price: First-time Single-family Homes ........................................................................ 64
Figure 5.8 Housing Tenure by County .......................................................................................................................... 65
Figure 5.9 Monthly Housing Costs by County ............................................................................................................ 66
Figure 5.10 Households with High Housing Costs by County ............................................................................. 67
Figure 6.1 Regional Analysis Submarkets ................................................................................................................... 69
Figure 6.2 Regional Industrial Inventory by Submarket (Q4 2020) ................................................................ 70
Figure 6.3 Regional Industrial Vacancy Rates by Submarket (Q4 2020) ....................................................... 71
Figure 6.4 Fayette County Industrial Annual Inventory and Vacancy Rate .................................................. 72
Figure 6.5 Regional Office Inventory by Submarket (Q4 2020) ......................................................................... 74
Figure 6.6 Regional Office Vacancy Rates by Submarket (Q4 2020) ................................................................ 74

EXISTING CONDITIONS AND GROWTH TRENDS REPORT
Figure 6.7 Fayette County Office Annual Inventory and Vacancy Rate ........................................................... 75
Figure 6.8 Regional Retail Inventory by Submarket (Q4 2020) ......................................................................... 77
Figure 6.9 Fayette County Retail Annual Inventory and Vacancy Rate........................................................... 77
Figure 7.1 LFUCG Revenue by Land Use Type ........................................................................................................... 81
Figure 7.2 Property Tax Value per Acre ....................................................................................................................... 82
Figure 7.3 Occupational License Fee Value per Acre .............................................................................................. 82
Figure 7.4 Combined Property Tax and Occupational License Fee Revenue ............................................... 83
Figure 7.5 Revenue Related to Average Per Acre Cost ........................................................................................... 85
Figure 8.1 .................................................................................................................................................................................. 87
Figure 8.2 Water Service Coverage ................................................................................................................................ 88
Figure 8.3 Sewer Service Coverage ................................................................................................................................ 89
Figure 8.4 FCPS School Locations ................................................................................................................................... 90
Figure 8.5 Police and Fire Coverage .............................................................................................................................. 91
Figure 8.6 LFUCG Parks ...................................................................................................................................................... 92
Figure 10.1 20 Year Industrial Growth Trendline for Fayette County (Cumulative SF) .......................... 96
Figure 10.2 20 Year Office Growth Trendline for Fayette County (Cumulative SF) .................................. 97
Figure 10.3 20 Year Retail Growth Trendline for Fayette County (Cumulative SF) .................................. 98
Figure 10.4 Example ................................................................................................ Error! Bookmark not defined.
EXISTING CONDITIONS AND GROWTH TRENDS REPORT
Introduction
1
Executive Summary
During the development of the current Imagine Lexington Comprehensive Plan adopted in early 2019, the question of expanding the USB was much discussed, resulting in a fundamental debate over what criteria and indicators, if any, would be sufficient to demonstrate the need for expansion. The Lexington Sustainable Growth Study was born from that discussion and debate, codified in Theme E, Goal 4 of the plan:
“Protect Lexington’s invaluable rural resources and inform long-range planning for infrastructure, community facilities and economic development through the creation of a new process for determining long-term land use decisions involving the Urban Service Boundary and Rural Activity Centers.
A. Establish the process via a study, involving diverse stakeholders and constituents, that meets the projected needs of the agricultural and development communities, by preserving key agricultural resources from development pressures and identifying land for future urban development.
B. Ensure the study designates rural land for long-term preservation, identifies land for potential future urban development and specifies triggers, thresholds and timing for the addition of the identified urban land into the Urban Service Boundary, keeping infill and land use efficiency as the continued primary objectives.”
To address the first part of that process, the Existing Conditions and Growth Trends Report identifies the foundational data for evaluating a set of growth scenarios designed to establish a plan for the type of development necessary to allow the USB to accommodate growth for as long as possible. This report evaluates demographics, employment, land use, housing, commercial (office, retail, and industrial) development, LFUCG finances, infrastructure, and community facilities as they relate to development patterns and decision making about the USB. The report also presents growth trends for populations and commercial growth to understand the demand for development within the USB.
The growth in and around Lexington have been consistent for many decades and in recent years increasingly interconnected, particularly within the housing and employment markets. Figure E.1 illustrates how many people commute into the USB for work, whether due to Lexington’s large job market or to take advantage of the new housing that is rapidly developing outside Fayette County.

EXISTING CONDITIONS AND GROWTH TRENDS REPORT
Introduction
2
Figure E.1 USB Commuter Inflow and Outflow
Understanding vacant and underutilized land within the USB along with projected demand and financial impacts are one set of key elements for making decisions about expansion. The amount of vacant land within the USB is approximately 5,117 acres all of which has an assigned zoning classification. Table E.1 and Figure E.2 illustrate the current status of vacant land within the USB. In Transition Acreage includes areas where development proposals are currently in process with LFUCG, recently approved, or under construction.

EXISTING CONDITIONS AND GROWTH TRENDS REPORT
Introduction
3
Table E.1 Summary of Vacant Land and Land in Transition by Land Use Description
Land Use Code Description Count Acres In Transition
Acreage Total
100, 105 F- Agricultural Vacant Land/Development Land Farm 26 689.1 91.9
101, 103 F- Farm <10 ac/General Purpose Farm 32 1,449.7 86.0
102 F- Horse Farms 15 911.2
Subtotal 73 3,050.0 177.9
400, 405 C- Commercial Vacant Land/Dev Land Commercial 713 1,009.9 228.8
450 C- Golf courses, Hospitality/Recreation 3 6.9
430 C- Retail 6 18.6
450 C- Governmental 260.6
499 C - Other Commercial Structures 4 1.0
Subtotal 726 1,036.4 489.5
402 M- Apartments 20-39 units 1 2.6
503 R- Rural <10 acres/Rural Residential 3 4.2
500, 504 R- Residential Vacant Land, Lot/Rural Res Vacant 2,002 472.8
505 R- Development Land Residential 56 531.6 94.9
510 R- Single Family Dwelling, Platted Lot 40 7.1
550, 551 R- Condominium/Townhomes 20 2.5
590, 591 R- Transfer/Non-Qualifying 2 2.0 13.4
Subtotal 2,124 1,020.2 108.3
700 HOA/Ret Basin/OS/Greenway 3.9
751 Land Only 13 8.3
2,937 5,117.0 779.5 5,896.9

EXISTING CONDITIONS AND GROWTH TRENDS REPORT
Introduction
4
Figure E.2 Vacant land by Land Use
Growth trends for population, industrial development, office development, and retail development were developed to project demand for land through 2040. Conservative and Full growth trends were projected for each of these primary land use categories based on the most recent ten year (conservative) and 20 year (full) periods. The benefit of this approach is that it reflects both medium-term and recent events in these sectors and provides a transparent and easily replicable method for revising the respective trend lines with future data as it becomes available for future analyses. Population projections from the Kentucky State Data Center and recent population trends estimated from the United State Census American Community Survey were used to project the total number of households within Fayette County in 2040. Ten and 20-year trends for the development of new commercial (retail, office, and industrial) inventory, were extrapolated to project the total square footage of new space needed by 2040 in these categories.
EXISTING CONDITIONS AND GROWTH TRENDS REPORT
Introduction
5
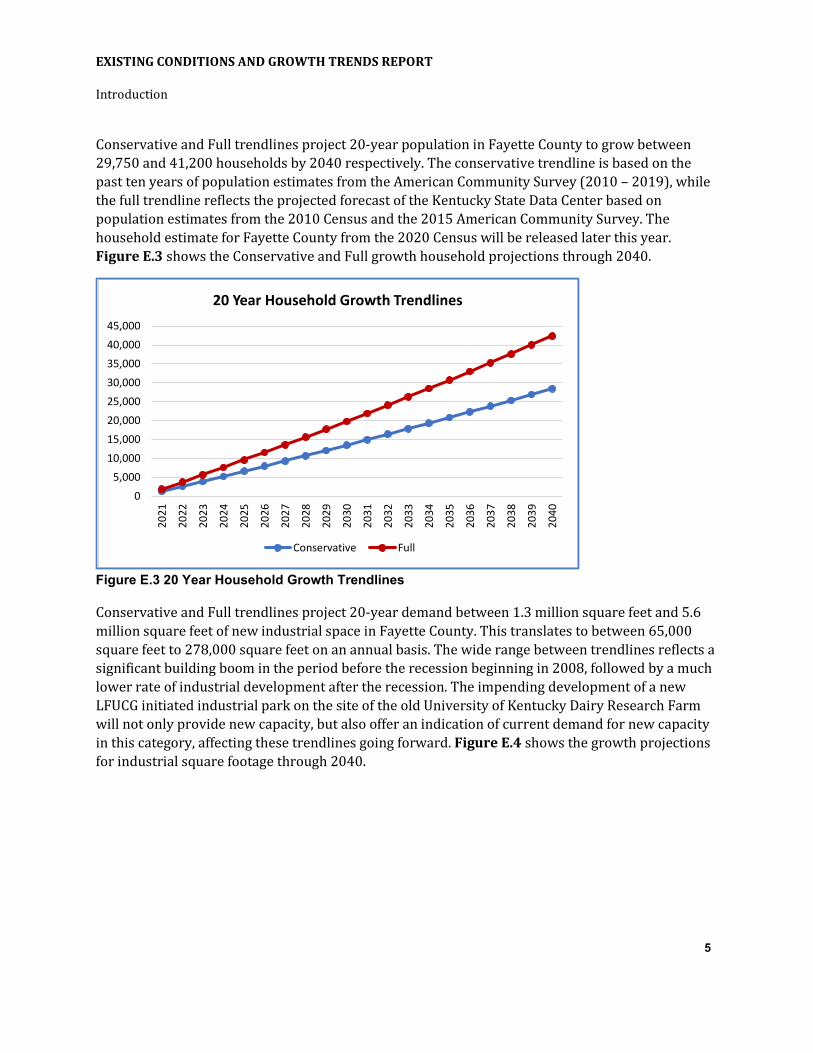
Conservative and Full trendlines project 20-year population in Fayette County to grow between 29,750 and 41,200 households by 2040 respectively. The conservative trendline is based on the past ten years of population estimates from the American Community Survey (2010 – 2019), while the full trendline reflects the projected forecast of the Kentucky State Data Center based on population estimates from the 2010 Census and the 2015 American Community Survey. The household estimate for Fayette County from the 2020 Census will be released later this year. Figure E.3 shows the Conservative and Full growth household projections through 2040.
Figure E.3 20 Year Household Growth Trendlines
Conservative and Full trendlines project 20-year demand between 1.3 million square feet and 5.6 million square feet of new industrial space in Fayette County. This translates to between 65,000 square feet to 278,000 square feet on an annual basis. The wide range between trendlines reflects a significant building boom in the period before the recession beginning in 2008, followed by a much lower rate of industrial development after the recession. The impending development of a new LFUCG initiated industrial park on the site of the old University of Kentucky Dairy Research Farm will not only provide new capacity, but also offer an indication of current demand for new capacity in this category, affecting these trendlines going forward. Figure E.4 shows the growth projections for industrial square footage through 2040.
0
5,000
10,000
15,000
20,000
25,000
30,000
35,000
40,000
45,000
2021
2022
2023
2024
2025
2026
2027
2028
2029
2030
2031
2032
2033
2034
2035
2036
2037
2038
2039
2040
20 Year Household Growth Trendlines
Conservative Full

EXISTING CONDITIONS AND GROWTH TRENDS REPORT
Introduction
6
Figure E.4 20 Year Industrial Growth Trendline for Fayette County (Cumulative SF)
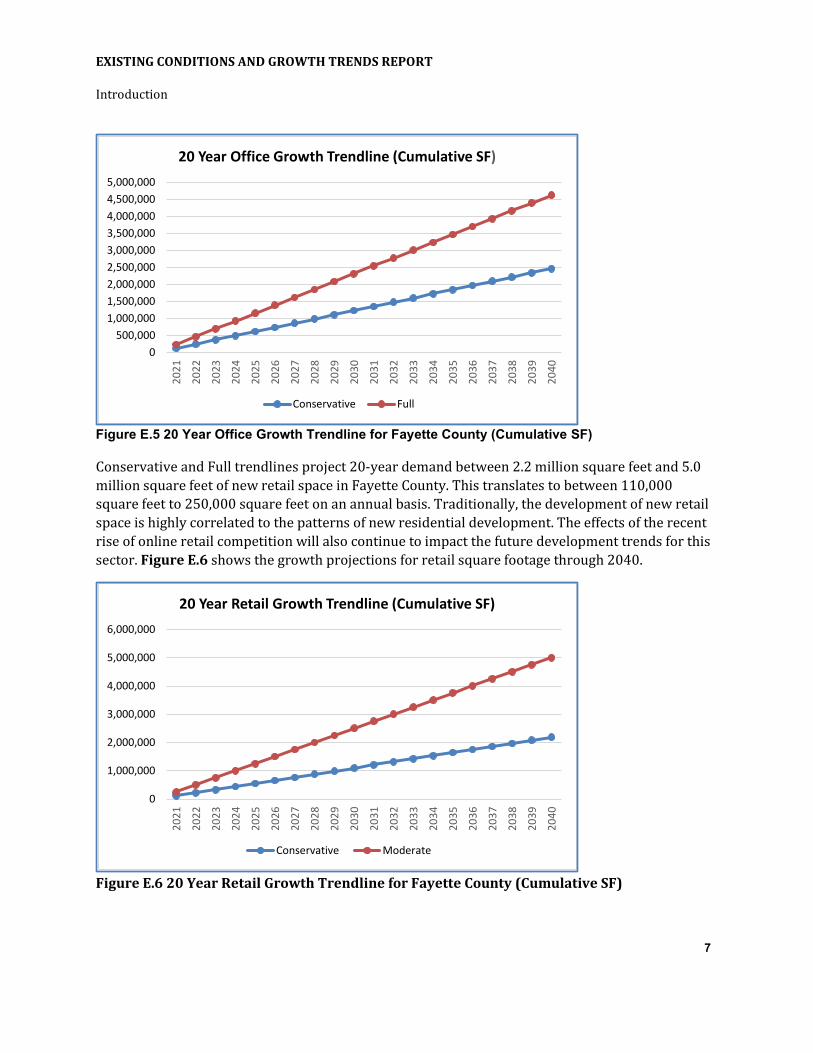
Conservative and Full trendlines of medium-term and recent office development project 20-year demand between 2.5 million square feet and 4.6 million square feet of new office space in Fayette County. This translates to between 123,000 square feet to 231,000 square feet on an annual basis. The Lexington office market has demonstrated itself to be a stable market, with less speculative development occurring than in the larger office markets in Louisville and Northern Kentucky, resulting in comparatively low vacancy rates. The lasting effects of the current shift to remote office work due to the COVID pandemic, whether large or small, will be reflected in the development of new space in the near future. This near-term development will in turn affect the future trends for office demand going forward. Figure E.5 shows the growth projections for office square footage through 2040.
0
1,000,000
2,000,000
3,000,000
4,000,000
5,000,000
6,000,00020
21
2022
2023
2024
2025
2026
2027
2028
2029
2030
2031
2032
2033
2034
2035
2036
2037
2038
2039
2040
20 Year Industrial Growth Trendline (Cumulative SF)
Conservative Full
EXISTING CONDITIONS AND GROWTH TRENDS REPORT
Introduction
7
Figure E.5 20 Year Office Growth Trendline for Fayette County (Cumulative SF)
Conservative and Full trendlines project 20-year demand between 2.2 million square feet and 5.0 million square feet of new retail space in Fayette County. This translates to between 110,000 square feet to 250,000 square feet on an annual basis. Traditionally, the development of new retail space is highly correlated to the patterns of new residential development. The effects of the recent rise of online retail competition will also continue to impact the future development trends for this sector. Figure E.6 shows the growth projections for retail square footage through 2040.
Figure E.6 20 Year Retail Growth Trendline for Fayette County (Cumulative SF)
0500,000
1,000,0001,500,0002,000,0002,500,0003,000,0003,500,0004,000,0004,500,0005,000,000
2021
2022
2023
2024
2025
2026
2027
2028
2029
2030
2031
2032
2033
2034
2035
2036
2037
2038
2039
2040
20 Year Office Growth Trendline (Cumulative SF)
Conservative Full
0
1,000,000
2,000,000
3,000,000
4,000,000
5,000,000
6,000,000
2021
2022
2023
2024
2025
2026
2027
2028
2029
2030
2031
2032
2033
2034
2035
2036
2037
2038
2039
2040
20 Year Retail Growth Trendline (Cumulative SF)
Conservative Moderate

EXISTING CONDITIONS AND GROWTH TRENDS REPORT
Introduction
8
Impact to LFUCG finances should be an important consideration in deciding if, when, where and how the USB will be expanded. Knowing how different types of development patterns translate to revenue and expenditures should be considered alongside how they meet demand and how they meet LFUCG goals such as the provision of affordable housing, accessibility, or preservation of green space. LFUCG’s revenues are significantly weighted towards the collection of occupational license fees, which represent a payroll tax on work performed inside the county. As a result, offices with many workers per square foot of space produce the most revenue per acre for LFUCG of any land use. Conversely, single family residential and agricultural uses, from which LFUCG primarily collects property taxes, generate the least amount of direct revenue. However, these land uses directly support the land uses where higher revenues are generated. Figure E.7 illustrates the revenue generated by the various land use types.
Figure E.7 LFUCG Revenue by Land Use Type
$-
$50
$100
$150
$200
$250
$300
$350
$400
Business Fee/Acre Property Tax/Acre

EXISTING CONDITIONS AND GROWTH TRENDS REPORT
Introduction
9
Understanding the relationship between revenue and cost of services should help make decisions about what types of development should occur when the USB is expanded. Figure E.8 illustrates where in Fayette County generates revenues that exceed the average per acre government expenditures and by how much. Areas in green illustrate the essential sources of land use-based revenue generation for LFUCG. That is not to imply that all development patterns should generate high revenues for the city, however there must be an appropriate balance of the revenue base for city finances to be sustainable.
Figure E.8 Revenue Related to Average Per Acre Cost
General Government, $379,000,000
Pipes, $69,800,990
Roads, $71,937,989
Business License Fees, $208,250,000
Property Tax, 25,975,000
Other Revenue,
144,775,000
Expenses
Revenue

EXISTING CONDITIONS AND GROWTH TRENDS REPORT
Introduction
10
1.0 INTRODUCTION
Land use planning in Lexington and Fayette County is inextricably linked with the nation’s first adopted Urban Service Boundary (USB), which creates Lexington’s uniquely distinctive balance of urban and rural landscapes and economies. The USB designates more than 85 square miles of Fayette County for urban uses, with the remaining 200 square miles of the county reserved for agriculture and other natural and rural land uses. The USB was last amended in 1996, adding 5,329 acres within three new expansion areas governed by an Expansion Area Master Plan. Since 1996, the metropolitan area of Lexington has continued to grow and expand, both within the USB and in the counties that surround it, which are increasingly interconnected with it. During the development of the current Imagine Lexington Comprehensive Plan adopted in early 2019, the question of again expanding the USB was much discussed, resulting in a fundamental debate over what criteria and indicators demonstrated the need for expansion. This Sustainable Growth Study was born from that discussion and debate, codified in Theme E, Goal 4 of the plan:
“Protect Lexington’s invaluable rural resources and inform long-range planning for infrastructure, community facilities and economic development through the creation of a new process for determining long-term land use decisions involving the Urban Service Boundary and Rural Activity Centers.
C. Establish the process via a study, involving diverse stakeholders and constituents, that meets the projected needs of the agricultural and development communities, by preserving key agricultural resources from development pressures and identifying land for future urban development.
D. Ensure the study designates rural land for long-term preservation, identifies land for potential future urban development and specifies triggers, thresholds and timing for the addition of the identified urban land into the Urban Service Boundary, keeping infill and land use efficiency as the continued primary objectives.”
The primary purpose of the Lexington Sustainable Growth Study is to establish an objective data-driven framework for evaluating the growth trends and projections that will determine whether Lexington has the land resources available to meet the needs of a continually growing community and economy. This Existing Conditions and Growth Trends report identifies and analyzes the data-points that are necessary to include in that evaluation framework. These data points cover demographics and economic activity, housing and commercial inventory, fiscal and infrastructure considerations, and most importantly, the analytics of the land available to accommodate the future growth of the community.
This document informs the other primary task of the study, the development of the evaluation framework, which will be tested and refined in this study via the evaluation of three potential

EXISTING CONDITIONS AND GROWTH TRENDS REPORT
Demographic Profile
11
development scenarios. The existing conditions presented in this report, along with the growth trends identified will be the starting point for these development scenarios.
An important aspect of this study and the development of the evaluation framework is the ability to regularly repeat evaluation scenarios. Data sources must be readily available and consistently updated to reflect current conditions and to establish consistent analyses. In addition to census data and other primary sources for understanding and developing trends, this study has relied on LFUCG’s parcel-level GIS databases covering zoning and PVA information related to land development. While there are many areas covered in this report, the most critical database is this GIS database, which the study will return to LFUCG, along with detailed guidance for future use.
It should be noted that although this report covers similar ground, it is not intended to be a thorough reexamining or replacement of the comprehensive land use planning and housing analyses performed in previous studies. It attempts to identify data points and trends with a focus on the parcel level zoning and land use data essential to the study.
2.0 DEMOGRAPHIC PROFILE
2.1 POPULATION
Fayette County is Kentucky’s second most populous county behind only Jefferson County. Its population growth continues to rank among the fastest growing counties in Kentucky, particularly among large counties with populations over 100,000 people. Fayette County is the primary county within the Lexington–Fayette, KY Metropolitan Statistical Area, which comprises five of the six adjacent counties, excluding Madison County. As an adjacent county, Madison County is included in this analysis and included in a seven-county region. Table 2.1 presents a comparison of the total population growth in Fayette and its neighboring counties over the past 20 years, beginning with the 2000 Census through the latest available estimates collected by the United States Census as part of the 2019 American Community Survey (ACS). (County-level data from the 2020 Census will be available later this year.)
As illustrated in Figures 2.1 and 2.2, Fayette County comprises slightly more than half of the population of the seven-county region and represents 50 percent of the growth that has occurred in the region since 2000. Outside of Fayette County, Madison, Scott and Jessamine counties represent the largest and fastest growing counties, with the largest increment of growth occurring between 2005 and 2010. As of 2019, Fayette County makes up more than seven percent of the state population and almost 15 percent of the state’s growth since 2000. Approximately 97 percent of Fayette County’s population resides within the USB.

EXISTING CONDITIONS AND GROWTH TRENDS REPORT
Demographic Profile
12
Table 2.1 Fayette and Regional Population
County 2000 Census
2005 (Cens. Est.)
2010 Census 2015 ACS 2019 ACS Growth
(2000-2019)% Growth
(2000-2019)Fayette County 260,512 273,601 295,803 314,488 323,152 62,640 24.0%Madison County 70,872 73,534 82,916 85,838 90,802 19,930 28.1%Scott County 33,061 39,524 47,173 50,178 54,667 21,606 65.4%Jessamine County 39,041 43,381 48,586 50,328 53,032 13,991 35.8%Clark County 33,144 34,860 35,613 35,657 35,971 2,827 8.5%Woodford County 23,208 24,167 24,939 25,317 26,318 3,110 13.4%Bourbon County 19,360 19,797 19,985 20,013 20,058 698 3.6%7 County Region 479,198 508,864 555,015 581,819 604,000 124,802 26.0%Kentucky 4,041,769 4,173,405 4,339,367 4,425,092 4,467,673 425,904 10.5%Source: United States Census; American Community Survey
Figure 2.1 Population Share by County

EXISTING CONDITIONS AND GROWTH TRENDS REPORT
Demographic Profile
13
Figure 2.2 Population Growth Since 2000
2.2 HOUSEHOLDS
The composition of households represents the fundamental building block of residential development and includes all residents living outside group quarter arrangements, such as nursing homes, school dormitories, and prisons. Household composition affects the type and quantity of the housing stock necessary to accommodate the household population, particularly regarding household size and the age of householders. Households can include single persons, non-related persons living together, and families with both related and non-related members.
Table 2.2 compares Fayette County’s households with the adjacent counties. Fayette County has a slightly lower average household size than the region and state, but its average family size is close to regional and state averages. The proportion of households in families in notably lower in Fayette County than surrounding counties, as well as the proportion of households that include minors under 18 years of age and adults over 60 years of age. This reflects Fayette County’s role as a regional metropolitan center, which tend to have a larger contingent of younger, working-aged adult households. The presence of the University of Kentucky and Transylvania University also contribute to the consistent influx of younger householders who come to Lexington for school and stay for career opportunities. Adjacent counties with a higher proportion of families and minors partially reflect their role as bedroom communities for Lexington. It is also typical to find higher proportions of households with older adults in rural areas with slower growth and fewer non-agricultural employment opportunities, which comprise much of the neighboring counties.
-50,000 50,000 150,000 250,000 350,000
Fayette County
Madison County
Scott County
Jessamine County
Clark County
Woodford County
Bourbon County
Population by Year by County
2000 2005 2010 2015 2019
0
5,000
10,000
15,000
20,000
25,000
30,000
Fayette County 6 Surrounding Counties
Population Growth: 2000-2019
2000-05 2005-10 2010-15 2015-19

EXISTING CONDITIONS AND GROWTH TRENDS REPORT
Demographic Profile
14
Table 2.2 Fayette and Regional Households
County Households Household Population
Avg. Hshd. Size
Families % Familes
Avg. Family
Size
Hshds. with
minors
Hshlds. with 60+
Fayette County 129,784 308,140 2.37 73,062 56.3% 3.02 28.4% 31.1%Madison County 33,359 84,215 2.52 22,219 66.6% 3.03 30.0% 35.5%Scott County 20,551 53,322 2.59 15,073 73.3% 2.97 38.1% 31.4%Jessamine County 18,821 51,163 2.72 13,726 72.9% 3.14 34.2% 38.8%Clark County 14,509 35,530 2.45 9,943 68.5% 2.88 32.0% 42.1%Woodford County 10,355 25,953 2.51 7,295 70.4% 2.97 31.6% 43.8%Bourbon County 8,106 19,804 2.44 5,445 67.2% 2.92 33.5% 43.9%7 County Region 235,485 578,127 2.46 146,763 62.3% 3.01 30.5% 34.0%Kentucky 1,734,618 4,317,164 2.49 1,129,276 65.1% 3.06 31.1% 39.3%Source: United States Census; American Community Survey
2.3 AGE PROFILE
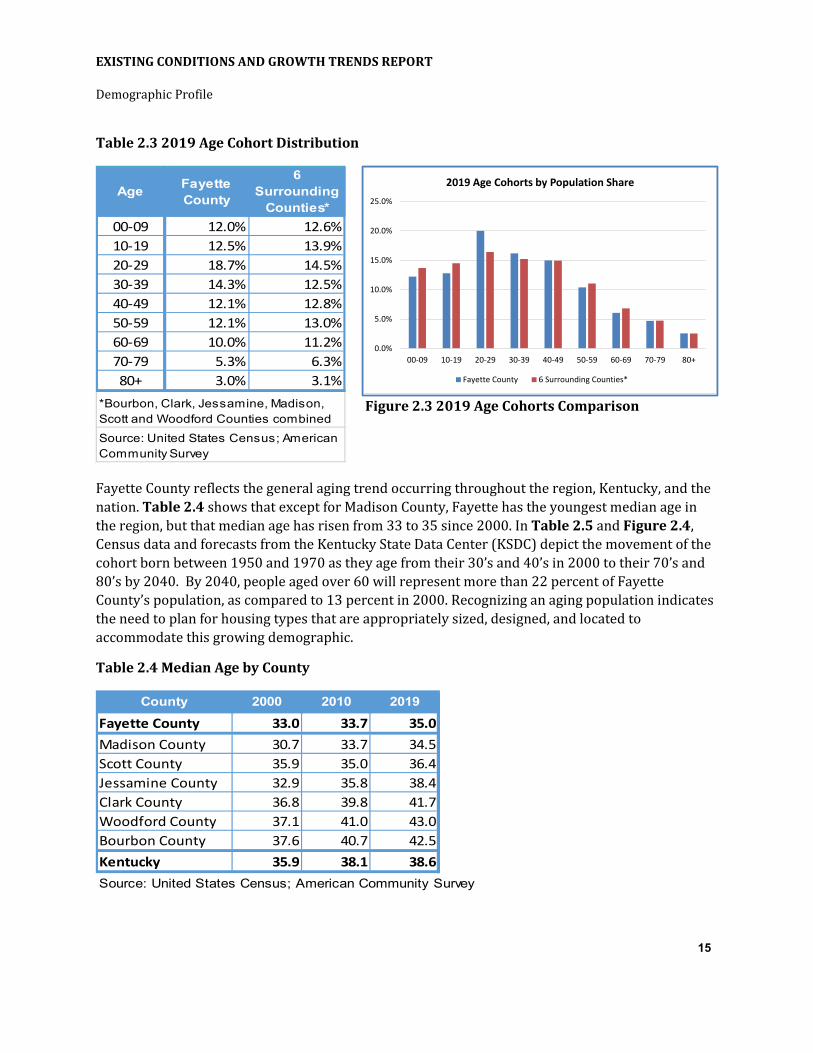
A comparison of the age profile of Fayette County with the combined population profile of the six surrounding counties reiterates the demographic distinctions between Fayette County and its neighbors. As shown in Table 2.3 and Figure 2.3 the surrounding counties have higher proportions of minors and older adults while Fayette County has a notably higher percentage of people in their twenties and slightly higher percentage of people in their thirties. Ideally, Fayette County’s housing stock should reflect the additional demand for the type of housing units that are most compatible in size and affordability for this outsized age group.
EXISTING CONDITIONS AND GROWTH TRENDS REPORT
Demographic Profile
15
Table 2.3 2019 Age Cohort Distribution
Age Fayette County
6 Surrounding
Counties*00-09 12.0% 12.6%10-19 12.5% 13.9%20-29 18.7% 14.5%30-39 14.3% 12.5%40-49 12.1% 12.8%50-59 12.1% 13.0%60-69 10.0% 11.2%70-79 5.3% 6.3%80+ 3.0% 3.1%
Source: United States Census; American Community Survey
*Bourbon, Clark, Jessamine, Madison, Scott and Woodford Counties combined
Fayette County reflects the general aging trend occurring throughout the region, Kentucky, and the nation. Table 2.4 shows that except for Madison County, Fayette has the youngest median age in the region, but that median age has risen from 33 to 35 since 2000. In Table 2.5 and Figure 2.4, Census data and forecasts from the Kentucky State Data Center (KSDC) depict the movement of the cohort born between 1950 and 1970 as they age from their 30’s and 40’s in 2000 to their 70’s and 80’s by 2040. By 2040, people aged over 60 will represent more than 22 percent of Fayette County’s population, as compared to 13 percent in 2000. Recognizing an aging population indicates the need to plan for housing types that are appropriately sized, designed, and located to accommodate this growing demographic.
Table 2.4 Median Age by County
County 2000 2010 2019Fayette County 33.0 33.7 35.0Madison County 30.7 33.7 34.5Scott County 35.9 35.0 36.4Jessamine County 32.9 35.8 38.4Clark County 36.8 39.8 41.7Woodford County 37.1 41.0 43.0Bourbon County 37.6 40.7 42.5Kentucky 35.9 38.1 38.6Source: United States Census; American Community Survey
Figure 2.3 2019 Age Cohorts Comparison
0.0%
5.0%
10.0%
15.0%
20.0%
25.0%
00-09 10-19 20-29 30-39 40-49 50-59 60-69 70-79 80+
2019 Age Cohorts by Population Share
Fayette County 6 Surrounding Counties*

EXISTING CONDITIONS AND GROWTH TRENDS REPORT
Demographic Profile
16
Table 2.5. Fayette Age Cohorts by Year
Age 2000 2019 204000-09 12.2% 12.0% 12.1%10-19 12.8% 12.5% 11.2%20-29 20.0% 18.7% 18.2%30-39 16.2% 14.3% 14.3%40-49 15.0% 12.1% 11.9%50-59 10.4% 12.1% 10.3%60-69 6.1% 10.0% 9.0%70-79 4.7% 5.3% 7.3%80+ 2.6% 3.0% 5.8%
Source: United States Census; American Community Survey; Kentucky State Data Center
0.0%
5.0%
10.0%
15.0%
20.0%
25.0%
00-09 10-19 20-29 30-39 40-49 50-59 60-69 70-79 80+
Fayette County Age Cohorts by Year
2000 2019 2040
Figure 2.4 Fayette Age Cohorts by Year

EXISTING CONDITIONS AND GROWTH TRENDS REPORT
Demographic Profile
17
2.4 RACE AND ETHNICITY
Table 2.6 indicates that Fayette County reflects a more diverse racial and ethnic population than the rest of the region and Kentucky. Fayette County’s minority population is more than double the state average and nearly three times greater than its neighboring counties. Table 2.7 and Figure 2.5 illustrate how minority populations in Fayette County have grown within the total population since 2000, with the number of residents identifying as Hispanic or two or more races doubling in share. Given historical and existing inequities and barriers to housing experienced by minority communities, particular emphasis should be placed on ensuring that sufficient and equitable housing options are available to accommodate these growing communities.
Table 2.6 Racial and Ethnic Population
Race / Ethnicity Fayette County
% of Total
6 Surrounding Counties*
% of Total Kentucky % of
TotalNon-Hispanic
White alone 227,629 71.0% 248,077 88.3% 3,761,855 84.6%Black alone 46,338 14.5% 12,862 4.6% 353,997 8.0%Asian alone 12,004 3.7% 2,678 1.0% 64,764 1.5%Some other race alone 1,622 0.5% 1,200 0.4% 16,954 0.4%Two or more races 9,945 3.1% 5,405 1.9% 88,488 2.0%
Hispanic (All Races) 23,063 7.2% 10,626 3.8% 162,994 3.7%*Bourbon, Clark, Jessamine, Madison, Scott and Woodford Counties combined Source: United States Census; American Community Survey
Table 2.7 Fayette Racial and Ethnic Composition by Year
Race / Ethnicity 2000 2010 2019Non-Hispanic
White alone 79.1% 72.4% 71.0%Black alone 13.4% 14.3% 14.5%Asian alone 2.4% 3.5% 3.7%Some other race alone 0.4% 0.4% 0.5%Two or more races 1.4% 2.5% 3.1%
Hispanic (All Races) 3.3% 6.9% 7.2%Source: United States Census; American Community Survey
0
50,000
100,000
150,000
200,000
250,000
300,000
350,000
2000 2010 2019
Racial and Ethnic Composition by Year
White Alone Black Alone Asian Alone
Some Other Race Alone Two of More Races Hispanic (All Races)
Figure 2.5 Fayette Racial and Ethnic Composition

EXISTING CONDITIONS AND GROWTH TRENDS REPORT
Demographic Profile
18
2.5 INCOME
The connection between income and housing costs is indicative of the relative affordability of housing in the community. Of particular concern is recognizing the extent of those who are most vulnerable to housing insecurity as reflected by their income or poverty status. Table 2.8 shows that Fayette County has the highest per capita income in the region, as would be expected as the largest employment center with a high concentration of higher paying employment opportunities. Scott County and Woodford County have higher median household incomes, suggesting a higher concentration of multiple income family households in Scott County and overall higher affluence among Woodford County’s smaller household population. Poverty rates in Fayette County are within the range of the other counties and lowest for children living in poverty. Fayette County matches the state average for seniors living in poverty.
Table 2.8 Income and Poverty Rates by County
CountyPer
Capita Income
Median Household
Income
Persons in
Poverty
Children in
Poverty
Seniors (65+) in Poverty
Fayette County 34,947$ 58,356$ 15.6% 17.6% 9.4%Madison County 26,387$ 49,421$ 18.3% 20.1% 11.0%Scott County 32,796$ 70,817$ 11.6% 18.2% 6.0%Jessamine County 31,146$ 58,245$ 16.9% 25.0% 8.7%Clark County 28,802$ 54,953$ 14.7% 19.6% 10.9%Woodford County 32,264$ 63,820$ 13.0% 23.6% 4.7%Bourbon County 27,802$ 49,637$ 15.3% 22.7% 18.5%Kentucky 29,029$ 52,295$ 16.3% 21.7% 9.4%Source: United States Census; American Community Survey
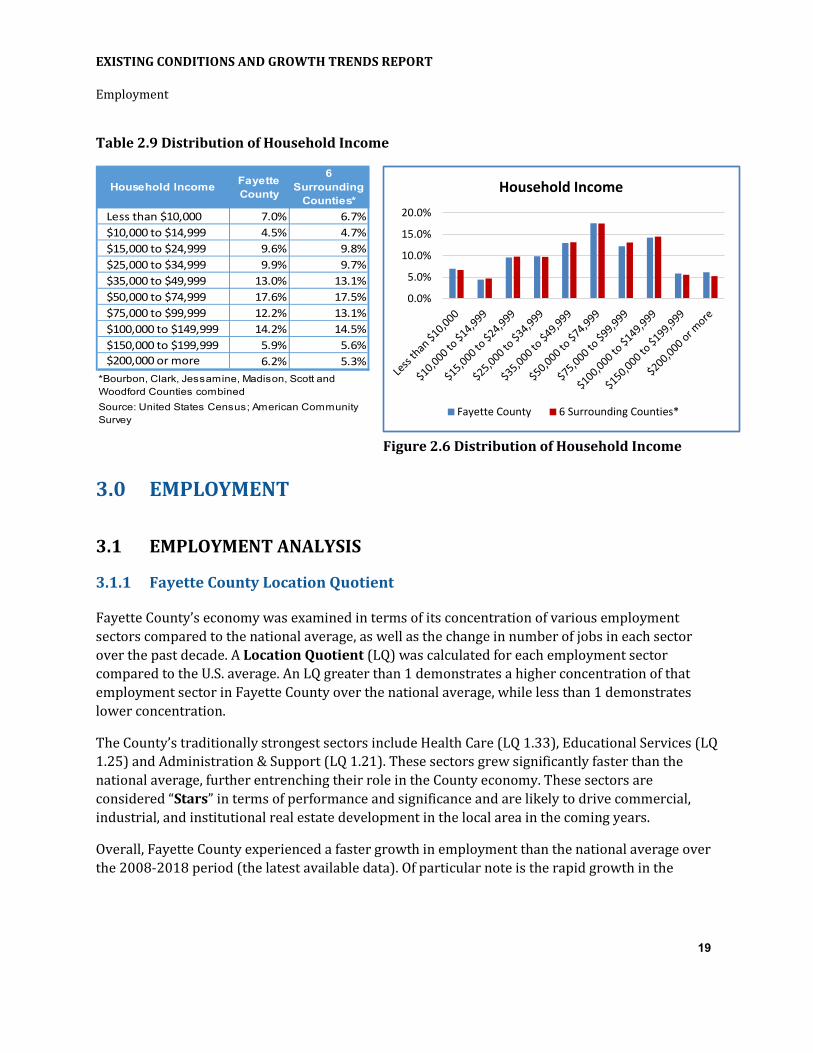
Table 2.9 and Figure 2.6 compare the distribution of household income within Fayette County with the combined households of the six surrounding counties. It demonstrates a relative uniformity between Fayette County and its neighbors, indicating the connections of the counties within a shared regional economy.
As a method for categorizing households for the analysis of housing affordability, the 2017 Fayette County Housing Demand Study set 50% of the medium income and 80% of median income as the upper thresholds for low and moderate households. The income range for workforce housing was set between 80% and 120%. According to these thresholds, households in Fayette County with less than $29,200 in annual income qualify as low-income households, households with incomes up to $46,700 qualify as moderate income households, and households with incomes up to $70,000 qualify as middle income workforce housing.
EXISTING CONDITIONS AND GROWTH TRENDS REPORT
Employment
19
Table 2.9 Distribution of Household Income
Household Income Fayette County
6 Surrounding
Counties*Less than $10,000 7.0% 6.7%$10,000 to $14,999 4.5% 4.7%$15,000 to $24,999 9.6% 9.8%$25,000 to $34,999 9.9% 9.7%$35,000 to $49,999 13.0% 13.1%$50,000 to $74,999 17.6% 17.5%$75,000 to $99,999 12.2% 13.1%$100,000 to $149,999 14.2% 14.5%$150,000 to $199,999 5.9% 5.6%$200,000 or more 6.2% 5.3%
*Bourbon, Clark, Jessamine, Madison, Scott and Woodford Counties combined Source: United States Census; American Community Survey
3.0 EMPLOYMENT
3.1 EMPLOYMENT ANALYSIS
3.1.1 Fayette County Location Quotient
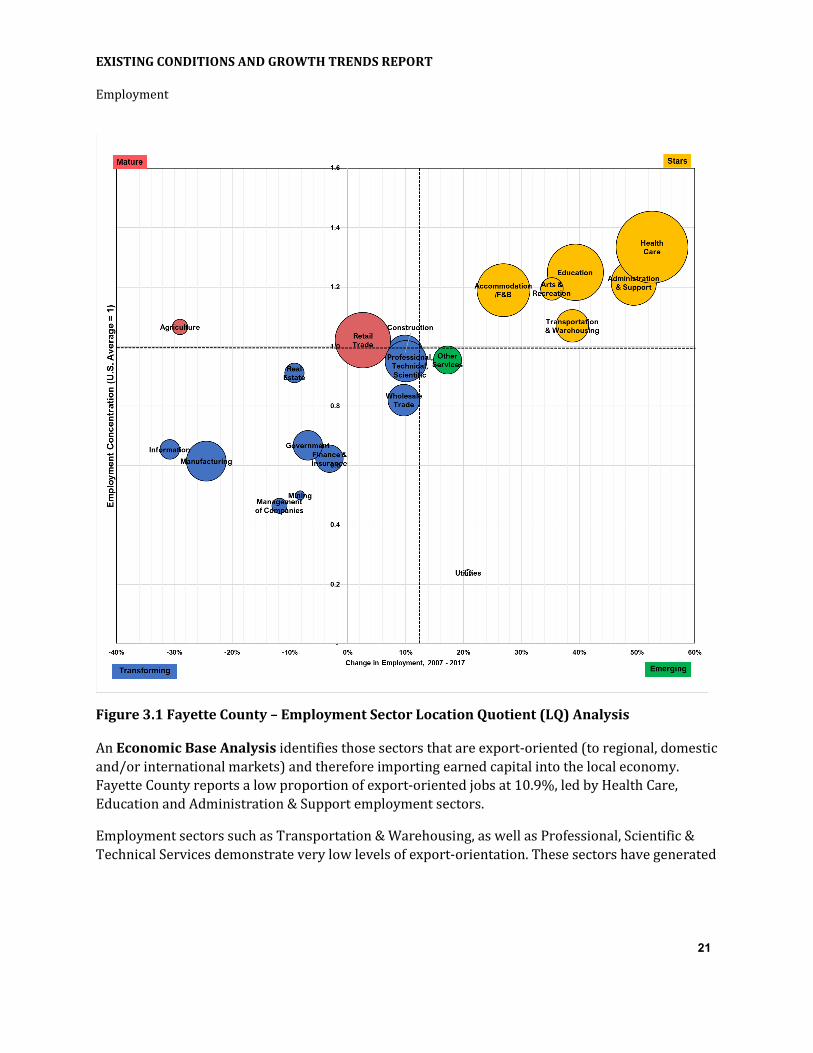
Fayette County’s economy was examined in terms of its concentration of various employment sectors compared to the national average, as well as the change in number of jobs in each sector over the past decade. A Location Quotient (LQ) was calculated for each employment sector compared to the U.S. average. An LQ greater than 1 demonstrates a higher concentration of that employment sector in Fayette County over the national average, while less than 1 demonstrates lower concentration.
The County’s traditionally strongest sectors include Health Care (LQ 1.33), Educational Services (LQ 1.25) and Administration & Support (LQ 1.21). These sectors grew significantly faster than the national average, further entrenching their role in the County economy. These sectors are considered “Stars” in terms of performance and significance and are likely to drive commercial, industrial, and institutional real estate development in the local area in the coming years.
Overall, Fayette County experienced a faster growth in employment than the national average over the 2008-2018 period (the latest available data). Of particular note is the rapid growth in the
0.0%
5.0%
10.0%
15.0%
20.0%
Household Income
Fayette County 6 Surrounding Counties*
Figure 2.6 Distribution of Household Income

EXISTING CONDITIONS AND GROWTH TRENDS REPORT
Employment
20
Transportation & Warehousing employment sector, which is associated with significant large scale industrial real estate development such as Logistics centers.
Conversely, sectors where Fayette County has not demonstrated a strong concentration of, such as Manufacturing, Finance and Wholesale Trade further lost ground to the national average. These sectors are considered “Transforming” and are likely consolidate for many years before emerging in local concentration.
Retail Trade and Agricultural-related employment are well-represented in Fayette County but have lost ground vis-à-vis other employment sectors in the local area. These are considered “Mature” employment sectors unlikely to generate significant new employment and related real estate development over the forecast horizon.
Only a single sector, Other Services, considered as an “Emerging” employment sector in Fayette County. Emerging employment sectors have lower representation locally than the national average but are growing relatively quickly and likely to generate significant real estate development in coming years.
Table 3.1 Fayette County – Employment Sector Location Quotient (LQ) Analysis
Source: U.S. Census
Employment Employment Employment Employment LQ LQ
Employment Sector 2008 2018 Change 2008 2018 Change 2008 2018
Agriculture, Forestry, Fishing & Hunting 920,239 1,041,689 13.2% 2,514 1,785 -29.0% 1.77 1.07
Mining, Quarrying, and Oil & Gas Extraction 524,102 720,870 37.5% 631 579 -8.2% 0.78 0.50
Utilities 744,869 784,345 5.3% 250 302 20.8% 0.22 0.24
Construction 6,327,293 6,150,010 -2.8% 8,808 9,679 9.9% 0.90 0.98
Manufacturing 13,575,714 12,138,869 -10.6% 15,874 11,990 -24.5% 0.76 0.61
Wholesale Trade 5,431,941 5,715,032 5.2% 6,868 7,535 9.7% 0.82 0.82
Retail Trade 13,330,251 14,046,782 5.4% 22,481 23,071 2.6% 1.09 1.02
Transportation & Warehousing 3,997,468 4,630,244 15.8% 5,735 7,961 38.8% 0.93 1.07
Information 2,827,293 2,785,734 -1.5% 4,231 2,930 -30.7% 0.97 0.65
Finance & Insurance 5,371,702 5,649,363 5.2% 5,840 5,656 -3.2% 0.71 0.62
Real Estate 1,933,399 1,970,936 1.9% 3,181 2,888 -9.2% 1.07 0.91
Professional, Scientific & Technical Services 6,407,770 8,392,778 31.0% 11,662 12,834 10.0% 1.18 0.95
Management of Companies & Enterprises 1,717,970 2,280,235 32.7% 1,930 1,702 -11.8% 0.73 0.46
Administration & Support 6,667,408 7,759,631 16.4% 10,141 15,155 49.4% 0.99 1.21
Educational Services 10,535,982 11,887,247 12.8% 17,137 23,881 39.4% 1.06 1.25
Health Care & Social Assistance 13,705,464 18,168,563 32.6% 25,542 38,977 52.6% 1.21 1.33
Arts, Entertainment & Recreation 1,694,430 2,003,713 18.3% 2,843 3,846 35.3% 1.09 1.19
Accommodation & Food Services 8,949,179 11,002,947 22.9% 16,583 21,047 26.9% 1.20 1.19
Other Services 3,639,306 3,860,788 6.1% 5,054 5,925 17.2% 0.90 0.95
Public Administration 4,829,484 6,052,431 25.3% 6,981 6,499 -6.9% 0.94 0.67
TOTAL 113,131,264 127,042,207 12.3% 174,286 204,242 17.2% 1.00 1.00
United States Study Area
EXISTING CONDITIONS AND GROWTH TRENDS REPORT
Employment
21
Figure 3.1 Fayette County – Employment Sector Location Quotient (LQ) Analysis
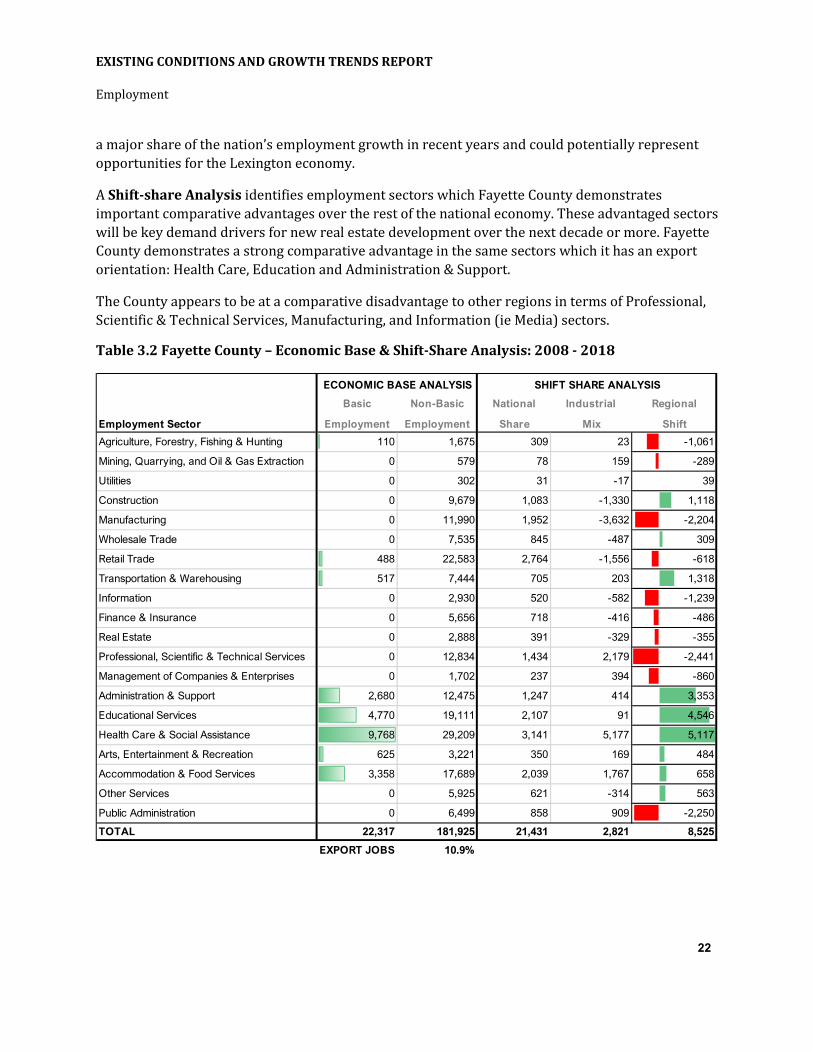
An Economic Base Analysis identifies those sectors that are export-oriented (to regional, domestic and/or international markets) and therefore importing earned capital into the local economy. Fayette County reports a low proportion of export-oriented jobs at 10.9%, led by Health Care, Education and Administration & Support employment sectors.
Employment sectors such as Transportation & Warehousing, as well as Professional, Scientific & Technical Services demonstrate very low levels of export-orientation. These sectors have generated
EXISTING CONDITIONS AND GROWTH TRENDS REPORT
Employment
22
a major share of the nation’s employment growth in recent years and could potentially represent opportunities for the Lexington economy.
A Shift-share Analysis identifies employment sectors which Fayette County demonstrates important comparative advantages over the rest of the national economy. These advantaged sectors will be key demand drivers for new real estate development over the next decade or more. Fayette County demonstrates a strong comparative advantage in the same sectors which it has an export orientation: Health Care, Education and Administration & Support.
The County appears to be at a comparative disadvantage to other regions in terms of Professional, Scientific & Technical Services, Manufacturing, and Information (ie Media) sectors.
Table 3.2 Fayette County – Economic Base & Shift-Share Analysis: 2008 - 2018
Basic Non-Basic National Industrial Regional
Employment Sector Employment Employment Share Mix Shift
Agriculture, Forestry, Fishing & Hunting 110 1,675 309 23 -1,061
Mining, Quarrying, and Oil & Gas Extraction 0 579 78 159 -289
Utilities 0 302 31 -17 39
Construction 0 9,679 1,083 -1,330 1,118
Manufacturing 0 11,990 1,952 -3,632 -2,204
Wholesale Trade 0 7,535 845 -487 309
Retail Trade 488 22,583 2,764 -1,556 -618
Transportation & Warehousing 517 7,444 705 203 1,318
Information 0 2,930 520 -582 -1,239
Finance & Insurance 0 5,656 718 -416 -486
Real Estate 0 2,888 391 -329 -355
Professional, Scientific & Technical Services 0 12,834 1,434 2,179 -2,441
Management of Companies & Enterprises 0 1,702 237 394 -860
Administration & Support 2,680 12,475 1,247 414 3,353
Educational Services 4,770 19,111 2,107 91 4,546
Health Care & Social Assistance 9,768 29,209 3,141 5,177 5,117
Arts, Entertainment & Recreation 625 3,221 350 169 484
Accommodation & Food Services 3,358 17,689 2,039 1,767 658
Other Services 0 5,925 621 -314 563
Public Administration 0 6,499 858 909 -2,250
TOTAL 22,317 181,925 21,431 2,821 8,525
EXPORT JOBS 10.9%
ECONOMIC BASE ANALYSIS SHIFT SHARE ANALYSIS

EXISTING CONDITIONS AND GROWTH TRENDS REPORT
Employment
23
3.1.2 Lexington Region (excluding Fayette County)
The six counties surrounding Fayette County experienced modest employment growth from 2008-2018. Overall employment grew by 7.9% during this period, compared to 12.3% nationally and 17.2% in Fayette County.
This area has benefitted from a relative concentration in Manufacturing employment historically (LQ 1.6), and despite losing nearly 1,000 jobs in this sector, it has performed better than the national average.
The outlying counties have a strong representation of “back office” type employment sectors including “Administration & Support” and “Management of Companies”. These sectors have grown in significance in recent years and are considered “Stars” in terms of future office real estate development potential. Emerging sectors relate to Professional, Health Care and Government, as well as growth in Accommodation/Food & Beverage employment. Retail Trade employment has been above the national average in the suburban counties but has declined in relative concentration, much as it has nationally.
Table 3.3 Surrounding Region Employment Sector Location Quotient (LQ) Analysis
Source: U.S. Census
Employment Employment Employment Employment LQ LQ
Employment Sector 2008 2018 Change 2008 2018 Change 2008 2018
Agriculture, Forestry, Fishing & Hunting 920,239 1,041,689 13.2% 2,525 2,871 13.7% 4.28 1.60
Mining, Quarrying, and Oil & Gas Extraction 524,102 720,870 37.5% 237 115 -40.0% 0.70 0.26
Utilities 744,869 784,345 5.3% 387 338 -12.7% 0.81 0.70
Construction 6,327,293 6,150,010 -2.8% 3,128 2,881 -7.9% 0.77 0.76
Manufacturing 13,575,714 12,138,869 -10.6% 20,420 19,651 -3.8% 2.34 1.60
Wholesale Trade 5,431,941 5,715,032 5.2% 2,966 3,183 7.3% 0.85 0.90
Retail Trade 13,330,251 14,046,782 5.4% 8,527 9,269 8.7% 1.00 1.07
Transportation & Warehousing 3,997,468 4,630,244 15.8% 2,193 2,161 -1.5% 0.85 0.76
Information 2,827,293 2,785,734 -1.5% 990 832 -16.0% 0.55 0.48
Finance & Insurance 5,371,702 5,649,363 5.2% 1,244 1,248 0.3% 0.36 0.36
Real Estate 1,933,399 1,970,936 1.9% 548 473 -13.7% 0.44 0.39
Professional, Scientific & Technical Services 6,407,770 8,392,778 31.0% 1,409 2,197 55.9% 0.34 0.42
Management of Companies & Enterprises 1,717,970 2,280,235 32.7% 769 1,518 60.0% 0.70 1.08
Administration & Support 6,667,408 7,759,631 16.4% 3,656 5,937 60.0% 0.85 1.24
Educational Services 10,535,982 11,887,247 12.8% 8,245 7,136 -13.5% 1.22 0.97
Health Care & Social Assistance 13,705,464 18,168,563 32.6% 4,901 6,514 32.9% 0.56 0.58
Arts, Entertainment & Recreation 1,694,430 2,003,713 18.3% 1,269 1,081 -14.8% 1.17 0.88
Accommodation & Food Services 8,949,179 11,002,947 22.9% 5,067 6,266 23.7% 0.88 0.92
Other Services 3,639,306 3,860,788 6.1% 1,167 1,379 18.2% 0.50 0.58
Public Administration 4,829,484 6,052,431 25.3% 2,949 3,264 10.7% 0.95 0.87
TOTAL 113,131,264 127,042,207 12.3% 72,597 78,314 7.9% 1.00 1.00
United States Study Area

EXISTING CONDITIONS AND GROWTH TRENDS REPORT
Employment
24
Several sectors in these counties are considered “Transforming” in that they are neither highly concentrated in the local economy or growing. These include a wide range of sectors.
13.2% of jobs in the surrounding region counties are classified as export-oriented, with Manufacturing demonstrating a high LQ and high proportion of export jobs.
.
Figure 3.2 Surrounding Region Employment Sector Location Quotient (LQ) Analysis
Shift-share analysis indicates that the surrounding counties have a significant comparative advantage in Manufacturing and Administration & Support. However, it does lack strength in the Education Services sector, Arts, Entertainment and Recreation, and Public Administration.

EXISTING CONDITIONS AND GROWTH TRENDS REPORT
Employment
25
Overall the surrounding region appears to be a slow-growing employment area generally dependent on its established Manufacturing enterprises for a significant portion of its employment market and is not well engaged with rising employment sectors such as Professional, Scientific & Technical Services.
Table 3.4 Surrounding Region Economic Base & Shift-Share Analysis: 2008 - 2018
Source: U.S. Census
In summary, Metro Lexington’s employment has increasingly concentrated in Fayette County in recent years. Employment growth in the surrounding counties has been modest and largely concentrated in manufacturing and “back office support” type activity. No industrial-related employment sectors have demonstrated strong new employment growth outside of Fayette County.

EXISTING CONDITIONS AND GROWTH TRENDS REPORT
Employment
26
3.2 COMMUTER PATTERNS
Using U.S. Census data and its on-line tool, OnTheMap, users can upload spatial geography and aggregate Longitudinal Employer-Household Dynamics (LEHD) Origin-Destination Employment data. These tools provide information on the worker age, earnings, jobs in industry NAICS sector, race, ethnicity, education attainment and worker sex. Using the USB as the analysis area, several statistics relating to local and regional commuting patterns were developed. The area profile report indicates that in 2018, 131,595 people living in the USB commuted to a primary job, which could be located anywhere. Further, 141,414 people commuted to a job located inside the USB. and are classified as having a private primary job. Table 3.5 identifies the distance these workers commute for their jobs, indicating that a higher share of commuters to work traveled longer distances than residents within USB.
Table 3.5 Primary Job Commutes within the Urban Service Boundary
Live Inside Work InsideJobs Share Jobs Share
Total Primary Jobs 131,595 100.0% 141,414 100.0%Less than 10 miles 93,001 70.7% 67,712 47.9%
10 to 24 miles 13,754 10.5% 24,989 17.7%25 to 50 miles 3,615 2.7% 13,288 9.4%
Greater than 50 miles 21,225 16.1% 35,425 25.1%Source: US Census, OntheMap
All Primary Jobs
The OnTheMap tool also analyzes the distance and direction of jobs. This permits us to identify and visualize the magnitude of employment by direction workers’ travel. Figure 3.3 illustrates the information in radar charts for workers commuting from within the USB to work and workers commuting to work within the USB. While the LEHD data does not distinguish the mode of commuter travel, it is presumed that inter-county travel is overwhelmingly via private occupancy vehicles. The highest proportion of residents traveling outside the USB tend to have destinations toward the west to the north, while commuters traveling into the USB travel from further distance and have a higher concentration of travel from west, south, and east. Figure 3.4 presents a heat map of the home location of commuters working inside the USB, illustrating both the concentration of resident workers inside the USB as well as the distribution of long-distance commuters throughout the region.

EXISTING CONDITIONS AND GROWTH TRENDS REPORT
Employment
27
Source: US Census, OntheMap Figure 3.3 Distance and Direction of Commuter Travel to and from the USB, 2018
Source: US Census, OntheMap Figure 3.4 Origin of Commuters with Jobs Inside the USB

EXISTING CONDITIONS AND GROWTH TRENDS REPORT
Employment
28
Another OnTheMap tool is the inflow outflow analysis. This analysis compares the number of workers who live and work inside the USB with those who commute into and out of theUSB. Table 3.6 presents the commute totals between 2002 and 2018 and indicated that while the share of workers living outside and commuting to the USB has significantly increased since 2002 and now outnumber residents of the USB working inside the USB. Twice as many workers commute to the USB as commute from the USB. Figure 3.5 presents the visualizations of the inflow and outflow pattern for 2018.
Table 3.6 USB Commuter Inflow and Outflow
Jobs Share 2002 2010 2018 2002 2010 2018
Live inside / Work inside 86,364 71,095 87,046 46% 37% 38%Live inside / Work outside 39,495 37,068 44,549 21% 19% 20%Live outside / Work inside 60,563 82,013 95,470 32% 43% 42%Source: US Census, OntheMap
All Primary Jobs
Figure 3.5 USB Commuter Inflow and Outflow

EXISTING CONDITIONS AND GROWTH TRENDS REPORT
Land Use Analysis
29
4.0 LAND USE ANALYSIS
4.1 EXISTING LAND
The USB totals approximately 85.3 square miles or 54,630 acres divided into primary octants by Leestown-Richmond Road-Athens Boonsboro Rd northwest to southeast, Harrodsburg-Broadway southwest to northeast, Versailles-Winchester west to east, Nicholasville Road-Newtown Pike south to north. According to the information provided LFUCG, there are 36 zoning classes, eleven of which are for residential uses, eight business zoning classes and the balance a mixture of expansion area residential, commercial, office, industrial and agricultural and farmland.
4.1.1 Zoning by Class
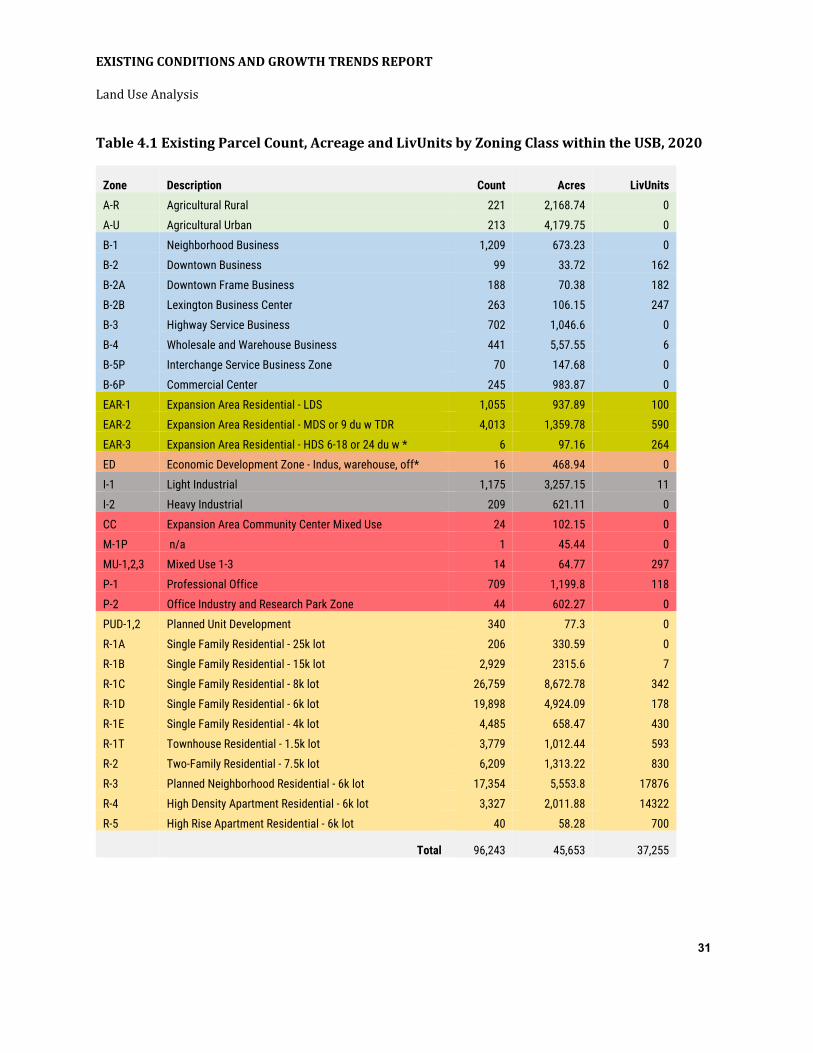
Figure 4.1 illustrates the distribution of zoning throughout the USB and Table 4.1 summarizes the count of parcels and acreage within each class and a value for the reported number of living units for zones with multiple dwelling units per parcel. Residentially zoned property dominates the USB. Residential property constitutes 89% of all parcels and 59% of land area. If the values recorded in the “LivUnits” field of the PVA data are reliable, the developed density of R-3 zoning equates to 3.2 dwellings per acre, 7.1 dwellings per acre in R-4 and 12.0 dwellings per acre in R-5. In addition to the Planned Unit Development and residential zones, LivUnits were tallied in the Downtown Business, Frame Business, Lexington Business Center, all three Expansion Areas, Mixed Use, and the Professional Office zones for a total of 37,255 units in these zones. A great deal of multi-family zoning is located near the University of Kentucky campus and on the north side of the downtown business district. However, pockets of multi-family development are often located adjacent to the R-3 zoning classes with higher densities near Richmond Road and along Man O War Boulevard. Industrial uses are concentrated in the northwest quadrant served by numerous rail lines in the area north of Versailles Road east and north of downtown. Additional industrial uses are located near Winchester Road and along Palumbo Drive, both areas also served by rail. A smaller concentration of industrial land is located on both sides of northwest New Circle Road and east of Nicholasville Road. Commercial and office zoned parcels proliferate along the major corridors with a high concentration along New Circle Road. Farm and agricultural lands are chiefly found along the edges of the USB, most of which are contained within an Expansion Area boundary.

EXISTING CONDITIONS AND GROWTH TRENDS REPORT
Land Use Analysis
30
Figure 4.1 Existing Zoning
EXISTING CONDITIONS AND GROWTH TRENDS REPORT
Land Use Analysis
31
Table 4.1 Existing Parcel Count, Acreage and LivUnits by Zoning Class within the USB, 2020
Zone Description Count Acres LivUnits
A-R Agricultural Rural 221 2,168.74 0
A-U Agricultural Urban 213 4,179.75 0
B-1 Neighborhood Business 1,209 673.23 0
B-2 Downtown Business 99 33.72 162
B-2A Downtown Frame Business 188 70.38 182
B-2B Lexington Business Center 263 106.15 247
B-3 Highway Service Business 702 1,046.6 0
B-4 Wholesale and Warehouse Business 441 5,57.55 6
B-5P Interchange Service Business Zone 70 147.68 0
B-6P Commercial Center 245 983.87 0
EAR-1 Expansion Area Residential - LDS 1,055 937.89 100
EAR-2 Expansion Area Residential - MDS or 9 du w TDR 4,013 1,359.78 590
EAR-3 Expansion Area Residential - HDS 6-18 or 24 du w * 6 97.16 264
ED Economic Development Zone - Indus, warehouse, off* 16 468.94 0
I-1 Light Industrial 1,175 3,257.15 11
I-2 Heavy Industrial 209 621.11 0
CC Expansion Area Community Center Mixed Use 24 102.15 0
M-1P n/a 1 45.44 0
MU-1,2,3 Mixed Use 1-3 14 64.77 297
P-1 Professional Office 709 1,199.8 118
P-2 Office Industry and Research Park Zone 44 602.27 0
PUD-1,2 Planned Unit Development 340 77.3 0
R-1A Single Family Residential - 25k lot 206 330.59 0
R-1B Single Family Residential - 15k lot 2,929 2315.6 7
R-1C Single Family Residential - 8k lot 26,759 8,672.78 342
R-1D Single Family Residential - 6k lot 19,898 4,924.09 178
R-1E Single Family Residential - 4k lot 4,485 658.47 430
R-1T Townhouse Residential - 1.5k lot 3,779 1,012.44 593
R-2 Two-Family Residential - 7.5k lot 6,209 1,313.22 830
R-3 Planned Neighborhood Residential - 6k lot 17,354 5,553.8 17876
R-4 High Density Apartment Residential - 6k lot 3,327 2,011.88 14322
R-5 High Rise Apartment Residential - 6k lot 40 58.28 700
Total 96,243 45,653 37,255

EXISTING CONDITIONS AND GROWTH TRENDS REPORT
Land Use Analysis
32
In order to understand the future potential on vacant parcels within the non-residential zoning classes, an analysis was conducted on the developed landform using the PVA data and attributes for zoning, year built, and reported commercial building square footages. All records that had incomplete data were omitted. The objective was to identify an existing building to land area ratio by zone to ascertain potential square footage for the business, commercial, industrial and office use categories for the build-out scenarios. In all cases, if there was a sufficient sample size of post 2000 and/or 2010 development to use as a guide, that ratio was used to forecast future square footage values. Table 4.2 summarizes the results of this analysis. Instances of n/a reflect an absence of more recent data.
Table 4.2 Analysis of the Built Environment of Non-Residential Zoning Classes
Building Sq Ft/Lot Ratio Zoning Description Citywide >2000
B-1 Neighborhood Business 0.18 0.11
B-2 Downtown Business 0.90 n/a
B-2A Downtown Frame Business 0.38 0.74
B-2B Lexington Business Center 1.73 1.95
B-3 Highway Service Business 0.22 0.16
B-4 Wholesale and Warehouse Business 0.27 n/a B-5P Interchange Service Business Hospitality 0.30 Retail 0.09 B6-P Commercial Center Hospitality 0.11
Retail 0.14
CC Community Commercial 0.07 n/a
I-1 Light Industrial 0.18 0.08
I-2 Heavy Industrial 0.12 0.04
P-1 Professional Office 0.24 0.20
P-2 Office Industry and Research Park 0.21 0.17
Source: PVA Data; Stantec
Figure 4.2 categorizes the 35 zoning classes into major categories and provides a total acreage within each zone. This graphic illustrates the significance of the residential zoning use compared to the employment generating use acreages (41%). The 59% residential zoning ratio doesn’t include the acreage currently designated as Farmland or Agricultural. Many of the acreages in these categories have been identified for future residential uses.
Figure 4.3 depicts the eleven residential zoning classes, which are dominated by the R-1C and R-3 uses. When aggregated, these two zones represent 53% of all residential classes. Since R-3 permits

EXISTING CONDITIONS AND GROWTH TRENDS REPORT
Land Use Analysis
33
higher densities and there are currently very few acres in the R-5 zone, vacant R-3 provides a valuable future resource for new residential units to meet the needs of population growth.
Figure 4.2 Existing Zoning within the USB by Major Use Category, 2020
Figure 4.3 Summary of Existing Residential Zoning Acreages within the USB, 2020
26,928
1,912
3,878
469
2,395
102
3,619
6,348
0 5,000 10,000 15,000 20,000 25,000 30,000
Residential
Mixed Use/Professional Office
Industrial
Economic Development
Expansion Areas
Community Center
Business
Agriculture
Acreage
Zoni
ng D
escr
iptio
n
77 331
2,316
8,673
4,924
6581,012 1,313
5,554
2,012
580
1,000
2,000
3,000
4,000
5,000
6,000
7,000
8,000
9,000
10,000
PUD-1,2 R-1A R-1B R-1C R-1D R-1E R-1T R-2 R-3 R-4 R-5
Acre
age
Residential Zoning

EXISTING CONDITIONS AND GROWTH TRENDS REPORT
Land Use Analysis
34
The count of residentially zoned parcels within the USB is approximately 85,326. As indicated above the predominate zoning class for residential is R-1C followed by R-3. The minimum lot size in R-1C zoning is 8,000 sq ft and 6,000 in R-3 zoning. In recent years, R-3 zoning was modified to permit lot sizes smaller than the 6,000 sq ft and according to staff in the Planning Department, new development ranges between 10-12 dwelling units per acre. As a result, smaller lots for the vacant R-3 zone class were used to calculate future build-out scenarios. See Figure 4.3.
Figure 4.3 Average Parcel Size of Existing Residential Uses within the USB, 2020
Using a similar approach for the two Industrial classes I-1 and I-2 but filtering out those parcels with an industrial zoning but a reported different land use such as retail, commercial, farmland, etc., the numbers change in interesting ways. As shown in Table 4.3, the number of industrial parcels with an explicitly industrial use, drops by 50% as does the total acreage. But the average parcel size increases slightly from 2.77 to 3.48 for I-1 and from 2.97 to 3.14 for I-2. This suggests the existing and future land area needs for industrial uses may be slightly smaller than the reported desirable size of 5.0-acre parcels. Slightly smaller parcel sizes make the valuable inventory of vacant land for industrial uses stretch a bit further.
Table 4.3 Summary of Existing Industrial Zoning and Uses within the USB, 2020
All Parcels I-Zoning + C- Industrial Land Use 410Industrial Zoning
Count Acreage Avg Parcel (ac) Count Acreage Avg Parcel
(ac)Avg Bldg.
Sq Ft
I-1 Light Industrial 1,176 3,257 2.77 539 1,870 3.48 29,341I-2 Heavy Industrial 210 621 2.97 114 355 3.14 18,052

EXISTING CONDITIONS AND GROWTH TRENDS REPORT
Land Use Analysis
35
4.1.2 Existing Land Uses by Description
Figure 4.4 illustrates the distribution of land uses throughout the USB and Table 4.4 summarizes the count of parcels and acreage within each category and a value for the reported number of living units. In the PVA data, the number “LivUnits” has been captured in the R-Duplex/Half Duplex code (520) or M-Apartment codes (401, 402 and 403). The number of units reported for residential units only appears in these categories.
Figure 4.4 Existing Land Uses

EXISTING CONDITIONS AND GROWTH TRENDS REPORT
Land Use Analysis
36
Table 4.4 Existing Parcel Count, Acreage, and LivUnits by Land Use within the USB, 2020
Land Use Code Description Count Acreage LivUnits
100, 105 F- Agricultural Vacant Land/Dev Land Farm 39 910 0
101,102,103 F- Farm<10 ac/General Purpose/Horse 70 2,743 0
199 F- Other Agricultural 6 70 0
510 R- Single Family Dwelling, Platted Lot 80,162 18,661 0
549,550,551 R- Condo Mother/Condominium/Townhome 1,264 822 0
520 R- Duplex/Half Duplex 4,043 895 567
500 R- Residential Vacant Land, Lot 2,000 528 0
502, 503 R- Rural Residential/Rural <10 acres 79 159 0
504, 505 R- Rural Residential Vacant/Development Land Res 90 691 0
590, 591 R- Transfer/Non-Qualifying 15 129 0
401, 402, 403 M- Apartments 4-40+ 1,721 1,982 36,485
400, 405 C- Commercial Vacant Land/Dev Land Comm 775 1,538 0
410 C- Industrial 857 2,556 0
420 C- Office 1,010 1,170 0
430 C- Retail 1,319 2,004 0
440 C- Hospitality/Recreation 483 727 0
450 C- Governmental 206 2,822 5
456 C- Parking Structures 529 262 0
460 C- Healthcare 82 372 0
463 C- Golf Courses 13 904 0
468, 469, 489 C- Telecom w Tower/Telecommunications/Public Svc 153 575 0
499 C- Other Commercial Structures 449 1,721 0
700 HOA/Ret.Basin/Open Space/Greenway 821 3,068 0
725, 750, 751 Air Lot/Improvement Only/Land Only 49 160 0
Blanks 109 184 0
96,344 45,653 37,057 Source: PVA, Stantec

EXISTING CONDITIONS AND GROWTH TRENDS REPORT
Land Use Analysis
37
The information from a land use description perspective is less granular for residential but more granular from a commercial/office/industrial perspective. Interesting to note the tally of LivUnits appears in the Multifamily land uses albeit with slightly different totals (37,255 in zoning; 37,057 with land use).
Visualized as a bar chart in Figure4.5, the land use descriptions that comprise the USB are 52% pure residential uses although residential is permitted in commercial/office/farmland and agriculture, and hospitality/recreation and golf designed parcels. The areas designated as HOA/Retention Basin/Open Space/Greenway or Other were not used in any analysis to accommodate future demands in housing or other services.
SingleFamily
Residential
MultifamilyResidential
VacantResidential
Commercial/Office Industrial Governme
ntalHospitality/Rec/Golf
VacantCommerci
al
Farm/Horse/Other
Agricultural
VacantAgriculture
/Farm
HOA/RetBasin/OS/Greenway
Other
Acreage 20,666 1,982 1,219 5,267 2,556 2822 1,631 1,538 2,813 910 3,068 1,181% of Total 45% 4% 3% 12% 6% 6% 4% 3% 6% 2% 7% 3%
0%
5%
10%
15%
20%
25%
30%
35%
40%
45%
50%
0
5,000
10,000
15,000
20,000
25,000
Acre
age
Land Use Descriptions
Figure 4.5 Existing Land by Use Description, Acreage and Percent of Total

EXISTING CONDITIONS AND GROWTH TRENDS REPORT
Land Use Analysis
38
As shown in Figure 4.6, existing industrial uses total 857 parcels or count with an acreage of 2,556. This data is based upon the PVA land use code 410. However, this land use includes both light and heaving industrial zoning classes in addition to numerous commercial classes such as neighborhood business, wholesale and warehouse, business etc. For purposes of the existing conditions analysis, we assume the PVA assesses the use on the land use and not the zoning. There are a large number of very small parcels and a small number of very large parcels. The decline in the number of parcels with an increasing parcels size is steady.
Figure 4.6 Existing Industrial with a Land Use Code 410 by Parcel Size Range, 2020
0.0-0.99 1.0-1.99 2.0-2.99 3.0-4.99 5.0-9.99 10.0-19.99 20.0-49.99 50 acres+
Count 358 195 92 90 73 33 12 4Acres 161 272 225 350 500 469 311 269
0
100
200
300
400
500
600
Count Acres

EXISTING CONDITIONS AND GROWTH TRENDS REPORT
Land Use Analysis
39
Figure 4.7 illustrates the physical location of the various parcels and their corresponding land use designations that were not considered developable for the build-out scenarios, with the exception of the Land Only category. There are a total of 16 parcels with this designation totally 20.9 acres.
Figure 4.7 Other Land Uses

EXISTING CONDITIONS AND GROWTH TRENDS REPORT
Land Use Analysis
40
Figure 4.8 illustrates the nine subareas defined by the Fayette Alliance Housing Demand Study, modified slightly to conform to the USB. These areas were drawn for the existing conditions analysis to better understand the overall context of development within the City of Lexington.
Downtown: The Downtown subarea is the smallest of them measuring 0.57 square miles and consisting of 366 acres. Five percent of the land area is considered vacant. The boundaries are W. 3rd Street on the north, Midland Avenue on the east, Manchester on the south, and Newtown Pike on the west. Existing zoning is predominantly commercial and R-3. Existing land uses are a combination of Commercial/Office/Healthcare, Residential, and Government. Not surprising, the primary uses Downtown consist of Office, Hospitality/Recreation, Other Commercial Structures, and Parking. Somewhat surprising is the number of acres designated as Single-Family Dwelling/Platted Lot. This number totals 61.9 acres, second to the land area dedicated to parking uses. The number of developed parcels total 460 with an average size of 0.27. Approximately 1,525 more residential units are located within the Downtown subarea in the form of apartments, duplexes, townhomes, and condominiums. With an overall average parcel size of 0.47, redevelopment of vacant parcels within this subarea may require additional time and/or incentives.
East: The East subarea is the second largest measuring 14.1 square miles and consisting of 8,907 acres. A total of 20% of the land area is considered vacant. The area is located east of New Circle Road, south of Winchester Road, north of Alumni Drive, and all the land to the USB. This subarea includes the Hamburg Area, Gleneagles, Walnut Ridge, Todd’s Station, Lake Crossing, and several other neighborhoods. Expansion Area 2A which includes the planned Baptist Health development, as well as areas 2B, and 2C coupled with abundant vacant land zoned A-R and A-U, represent a large majority of the future growth potential within the USB. A rail spur from Downtown, serves an industrial area in the East near Richmond Road and New Circle Rd.
In Town Central: The In Town Central subarea measures 3.9 square miles and consists of 2,615 acres. Approximately 3.2% of the land area is vacant. Defined by Versailles on the west, the Downtown subarea border on the north, E. High/Tates Creek on the east, Mason Headley Road, and the southern boundary of the University of Kentucky on the south. This subarea consists of higher density neighborhoods supporting the prominent campus and hospital uses. Government uses account for over 30% of the land within this subarea. Undeveloped land within the Red Mile together with vacant commercial and residential present opportunities for future growth.
In Town North: The In Town North subarea measures 6.4 square miles and consists of 4,106 acres. Approximately 4% of the land area is considered vacant. The subarea is encompassed within Leestown and Richmond Road and New Circle Road. The small block length coupled with the numerous parks and Lexington Cemetery give this subarea a truly neighborhood quality. Railroad lines divide the higher density and lower density areas and serve industrial uses on the outer edges of the subarea.

EXISTING CONDITIONS AND GROWTH TRENDS REPORT
Land Use Analysis
41
In Town South: The In Town South subarea measures 12.0 square miles and consists of 7,699 acres. Just 3% of the land area is considered vacant. This subarea encompasses all of the land area within New Circle Road, Leestown and Richmond Roads excluding the In Town Center and Downtown subareas. This subarea is predominantly single family, larger lots sizes defined by longer blocks and cul-de-sacs with a preponderance of R-1A – R1-D zoning. Commercial and business/office uses buffer the residential along the major thoroughfares. The highest number of Single Family Dwelling/Platted Lot land uses are located in this subarea. However, the In Town South subarea also contains the vast majority of I-2 or Heavy Industrial zoning and developed uses with the numerous railroad lines that serve the area between New Circle Road and Downtown.
North: The North subarea measures 9.0 square miles and consists of 5,799 acres. A total of 26% of the land area is vacant. Located north of New Circle Road between Georgetown on the west and Winchester on the east, the northern boundary is the USB. Expansion Area 3, the Dairy Farm property, and vacant A-R plus A-U zoned land provide ample area for future growth and development. The amount of vacant commercial is also significant totally 589 acres. The residential development pattern emulates that of the In Town South subarea with longer residential blocks and cul-de-sacs on the larger lot sizes permitted in R-1A – R-1D zones.
Northwest: The Northwest subarea measures 5.9 square miles and consists of 3,834 acres. Approximately 19% of the land area is considered vacant. This subarea is defined by the 1,124 acres of Industrial land use located east of New Circle Road. Bounded by Georgetown Road, New Circle Road and the USB, other than Industrial zoning, the subarea consists of smaller lot residential and a handful of vacant general purpose/horse farms.
South: The South subarea is the largest of them measuring 14.2 square miles and consisting of 9,125 acres. Nearly half of the total acreage is designated as Single Family Dwelling, Platted Lots built in neighborhoods with curvilinear streets, cul-de-sacs, and numerous parks. Clays Mill Road defines the western border, New Circle Road and Alumni Drive the north border and the USB the south and eastern borders. Approximately 14% of the land area is considered vacant, with 1,048 acres zoned as A-R or A-U, principally from Overbrook Farm. Redevelopment opportunities exist within the existing Fayette Mall and surrounding areas along Nicholasville Road.
Southwest: The Southwest subarea is the second smallest measuring 4.9 square miles and consisting of 3,163 acres. Nearly 75% of the total land area is designated residential land use and just 3% is vacant. New Circle Road defines the northern boundary, Clays Mill Road divides the Southwest from the South subareas and the USB forms the south and west edges. In additional residential uses, a total of 12% of the land is designated as HOA/Retention Basin/Open Space and/or Greenway, not considered developable to accommodate future growth.
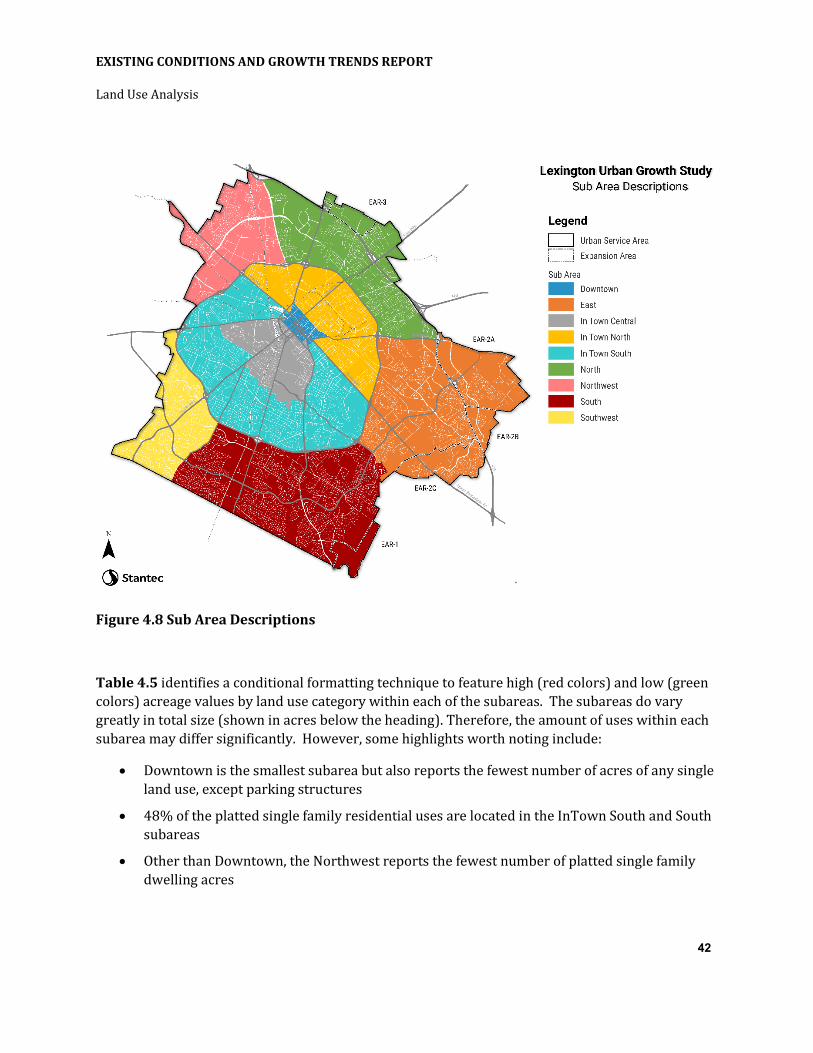
EXISTING CONDITIONS AND GROWTH TRENDS REPORT
Land Use Analysis
42
Figure 4.8 Sub Area Descriptions
Table 4.5 identifies a conditional formatting technique to feature high (red colors) and low (green colors) acreage values by land use category within each of the subareas. The subareas do vary greatly in total size (shown in acres below the heading). Therefore, the amount of uses within each subarea may differ significantly. However, some highlights worth noting include:
• Downtown is the smallest subarea but also reports the fewest number of acres of any single land use, except parking structures
• 48% of the platted single family residential uses are located in the InTown South and South subareas
• Other than Downtown, the Northwest reports the fewest number of platted single family dwelling acres

EXISTING CONDITIONS AND GROWTH TRENDS REPORT
Land Use Analysis
43
• 44% of the industrial uses are located in the Northwest subarea
• 49% of the government uses are located in the InTown Central and North subareas
• 68% of the farmland uses are located in the East and South subareas
• 54% of the HOA/Retention Basin/ Open Space/Greenway is also located in the East and South subareas
• 52% of the retail uses are also located in the East and South
• 65% of the office uses are located in East, InTown North, and InTown South subareas
• Office uses in the remaining subareas total approximately 1/3 the acreage in the East, InTown North and InTown South subareas—so significantly fewer acres overall
Table 4.5 Existing Land Uses by Subarea
Subareas and Acreage
LUC Codes Description Downtown (366 ac)
East (8,907 ac)
In Town Central
(2,530 ac)
In Town North
(4,106 ac)
In Town South
(7,699 ac) North
(5,799) Northwest (3,834 ac)
South (9,125 ac)
Southwest (3,163 ac) Total
510 R- Single Family Dwelling, Platted Lot 61.9 2,617 564 1,420 4,476 2,044 914 4,469 2,095 18,661
549,550,551 R- Condo Mother/Condominium/Townhome 14 245 21 45 123 39 26 195 113 821
520 R- Duplex/Halfplex 10.5 116 89 87 216 124 0 242 11 896 502, 503 R- Rural Residential/Rural <10 acres 0 62 0 0 0 7 24 66 0 159
500 R- Residential Vacant Land, Lot 8 159 38 74 68 62 49 43 26 527
504, 505 R- Rural Residential Vacant/Development Land Res 0 269 1.5 3 19 28 196 29 8 554
401, 402, 403 M- Apartments 4-40> 37 406 190 156 371 102 44 608 70 1,984 420 C- Office 47 273 62 280 203 75 67 76 86 1,169 430 C- Retail 15 605 84 315 291 151 45 431 65 2,002 410 C - Industrial 3.6 337 67 487 354 167 1124 16 0 2,556 450 C- Governmental 16 183 791 159 314 599 375 294 92 2,823 460 C- Healthcare 2 109 90 6 76 10 13 52 14 372
468, 469, 489 C- Public Svc/Telecommunications 4.6 269 4 28 155 9 77 21 7 575 440 C- Hospitality/Recreation 24 136 77 105 128 123 7 75 52 727 463 C- Golf Courses 0 329 0 171 0 142 138 125 0 905 499 C- Other Commercial Structures 31 159 58 529 320 156 60 358 51 1,722 456 C- Parking Structures 63 24 58 66 19 21 1 8 1.4 261
400,405 C- Commercial Vacant Land/Dev Land Comm 9 287 160 116 84 589 217 50 24 1,536
101,102,103 F- Farm<10 ac/General Purpose/Horse 0 829 0 0 47 642 137 1042 45 2,742 199 F- Other Agricultural 0 0 10 0 0 18 41 0.66 0 70
100, 105 F- Agricultural Vacant Land/Dev Land Farm 0 382 0 0 0 239 154 125 10 910
700 HOA/Ret.Basin/Open Space/Greenway 10 941 133 56 394 347 114 704 370 3,069 725, 750,751 Air Lot/Improvement Only/Land Only 14 56 18 0 8 87 0 0 0 183
590,591 R- Transfer/Non-Qualifying 0 68 11 10 10 21 8 128 Blanks 9 49 12 3 23 8 0.31 72 14 190
Total 365.6 8,910 2,528 4,106 7,700 5,799 3,833 9,123 3,162 45,540

EXISTING CONDITIONS AND GROWTH TRENDS REPORT
Land Use Analysis
44
Evaluating the existing land use data for the M-Apartment use or those parcels that contain 4-19, 20-39 and 40 or more dwelling units by subarea indicates the highest number of units is located in the South subarea which has 608 acres of this land use designation as shown in the previous table. As illustrated in Table 4.6, the data for the InTown South and InTown Central subareas also reflect high numbers of apartment units. The build-out scenarios will promote infill development, particularly in the Downtown and within New Circle Road.
Table 4.6 Apartment Land Use and LivUnits by Subarea, 2020
1,4116,667
4,6852,620
7,5762,504
5669,254
1,202
0 2,000 4,000 6,000 8,000 10,000
LivUnits
Nunber of Units
Apar
tmen
t Lan
d Us
e
Southwest
South
Northwest
North
InTown South
InTown North
InTown Central
East
Downtown

EXISTING CONDITIONS AND GROWTH TRENDS REPORT
Land Use Analysis
45
4.2 VACANT LAND
4.2.1 Vacant Land by Zoning Classification
The amount of vacant land within the USB is approximately 5,117 acres. However, there are parcels or development which is currently underway. This includes proposals currently in process with LFUCG, recently approved, or under construction. These acreages are referred to in the map as “in transition” and add 778 acres, technically bringing the total acreage to 5,897. Acreage in transition has been excluded from the future build-out scenario analyses. Figure 2.14 provides an accounting of the primary zoning categories by acreage. Figure 4.9 illustrates the location of the vacant land, including lands in transition, within the USB by zoning class.
Residential
CC/MU3/P1-P2
Industrial
Expansion Areas EAR1-3
Business Uses P1-2
Farm/Agricultural
Economic Development Zone
Zoning Acreage % of Total
Residential 1,491 29%
CC/MU3/P1-P2 367 7%
Industrial 240 5%
Expansion Areas EAR1-3 551 11%
Business Uses P1-2 429 8%
Farm/Agricultural 1,723 34% Economic Development Zone 316 6%
5,117 100%
Figure 4.9 Vacant Land by Zoning Classification

EXISTING CONDITIONS AND GROWTH TRENDS REPORT
Land Use Analysis
46
Figure 4.10 Vacant Land by Zoning 2020
A breakdown of the vacant parcels and acreage is provided in Table 4.7. Residential uses can be developed most zoning classifications. R-3 allows flexibility for residential development types and density and constitutes a significant number of acres to accommodate future residential growth.
Residential and Industrial zoning are of utmost importance to address future housing and employments needs. With the allowance of residential uses in other zones, coupled with flexibility in densities, there is sufficient vacant land area to accommodate housing demand for the next twenty years.

EXISTING CONDITIONS AND GROWTH TRENDS REPORT
Land Use Analysis
47
Table 4.7 Summary of Vacant Land and Land in Transition by Zoning Class
Zone Description Count Acres Transition
Acreage Total A-R Agricultural Rural 24 1,380.0 86.0 A-U Agricultural Urban 24 343.1 78.4 Subtotal 1,723.1 164.4 B-1 Neighborhood Business 136 42.9 8.4 B-2 Downtown Business 3 0.8 B-2A Downtown Frame Business 49 5.6 B-2B Lexington Business Center 12 2.9 B-3 Highway Service Business 71 140.1 B-4 Wholesale and Warehouse Business 71 135.4 B-5P Interchange Service Business Zone 7 10.0 B-6P Commercial Center 26 91.3 Subtotal 429.0 8.4 EAR-1 Expansion Area Residential - LDS 85 148.5 40.2 EAR-2 Expansion Area Residential - MDS or 9 du w TDR 112 366.5 4.2 EAR-3 Expansion Area Residential - HDS 6-18 or 24 du w * 2 35.8 47.3 Subtotal 550.8 91.7
ED Economic Development Zone-Indus, warehouse, office 10 316.5 129.0
I-1 Light Industrial 270 216.0 260.6 I-2 Heavy Industrial 34 24.3 Subtotal 240.3 260.6 CC Expansion Area Community Center Mixed Use 13 60.6 MU-3 Mixed Use 3 8.4 P-1 Professional Office 54 91.9 P-2 Office Industry and Research Park Zone 22 206.2 Subtotal 367.1 PUD-2 Planned Unit Development 1 0.1 R-1A Single Family Residential - 25k lot 10 25.5 R-1B Single Family Residential - 15k lot 92 103.5 R-1C Single Family Residential - 8k lot 207 279.3 R-1D Single Family Residential - 6k lot 210 162.4 R-1E Single Family Residential - 4k lot 46 5.0 R-1T Townhouse Residential - 1.5k lot 11 5.8 R-2 Two-Family Residential - 7.5k lot 215 43.1 R-3 Planned Neighborhood Residential - 6k lot 887 734.9 97.7 R-4 High Density Apartment Residential - 6k lot 229 130.8 26.5 R-5 High Rise Apartment Residential - 6k lot 3 0.4 Subtotal 1,490.7 124.2 2,939 5,117.0 778.3 5,896

EXISTING CONDITIONS AND GROWTH TRENDS REPORT
Land Use Analysis
48
The addition of the Dairy Farm land (identified as “In Transition” for I-1 Light Industrial, coupled with the Economic Development Zoned acreage plus vacant Industrial I-1 and I-2 represents approximately 946 acres available for employment in warehousing, logistics, manufacturing, etc. Figure 4.11 illustrates the locations of parcels 50+ acres. The larger parcels easily accommodate a wide variety of uses and larger master planned developments for both residential and industrial.
Much of the vacant 946 acres of Industrial has unique aspects that render the land more challenging or less challenging for immediate development and absorption. Parcel size was a concern expressed by representatives of Commerce Lex. In particular, parcels 5.0 acres or larger are desirable and there are only eight (8) vacant I-1 parcels totaling 80.4 acres. There are zero (0) vacant I-2 parcels in this size range. The belief is that 5.0-acre parcels provide greater latitude to attract existing industrial users who want to expand and new local, regional, and national employers who need industrial zoning.
Figure 4.11 Locations of Vacant Industrial Parcels by Acreage Range, 2020
Downtown

EXISTING CONDITIONS AND GROWTH TRENDS REPORT
Land Use Analysis
49
However, analysis of over 800 existing I-1 industrial uses by parcel size indicates the mean acreage = 3.48; median = 1.27; and mode= 1.0. Therefore, the existing 51 parcels with I-1 zoning totaling 115 acres and ranging in size between 1.0 - 4.99 acres offer immediate opportunity to fill a certain type of employer demand. The ED zoning has financial stipulations that may be viewed as a hindrance or barrier to new development. Further, the 200 acres that is part of LFUCG’s Dairy Farm is not yet market ready and may require another year or more before industrial uses are constructed and employers hiring.
A similar analysis for vacant residential zoned lands, classified as PUD, R1A-R1T, R2, R3, R4 and R5 reveals a total of 41 parcels totaling 1,015.6 acres are five (5.0) acres and greater. As shown in Figure 4.12, the largest of these parcels are predominantly located North, Northwest, and East subareas. The total acreage doesn’t include the land in transition, nor any of the farm and agricultural land within the USB that can accommodate residential uses with development.
Figure 4.12 Locations of Vacant Residential Parcels by Acreage Range

EXISTING CONDITIONS AND GROWTH TRENDS REPORT
Land Use Analysis
50
4.2.2 Vacant Land by Land Use Description
The land use code and descriptions provide greater detail on the vision for development of vacant land, e.g., retail, single family dwelling, platted lot, horse farms, etc. In total, approximately 3,050 acres or 52% of the available land for future development falls within the agricultural, development land farm, and horse farm designations. This may suggest a longer time frame before the land is available for development since they could require the extension of public infrastructure and/or service since they are predominantly located along perimeter of the USB.
Approximately 17% or 1,023 acres of the available vacant land is designated as residential and includes apartments. The total residential acreage is one-third of the available agriculture and farmland. Using the 6,000 square foot minimum lot size as a general measure of total units possible across all vacant residential land use designations, approximately 7,400 units can be constructed. However, as Figure 4.13 illustrates, the vacant land by land use map shows a large number of small parcels concentrated with the InTown North and InTown Central subareas. The parcels could be less attractive to many developers than the larger tracts of available land with a residential designation. Table 4.8 provides a summary of vacant land by land use including land in transition.

EXISTING CONDITIONS AND GROWTH TRENDS REPORT
Land Use Analysis
51
Figure 4.13 Vacant land by Land Use

EXISTING CONDITIONS AND GROWTH TRENDS REPORT
Land Use Analysis
52
Table 4.8 Summary of Vacant Land and Land in Transition by Land Use Description
Land Use Code Description Count Acres In Transition
Acreage Total
100, 105 F- Agricultural Vacant Land/Development Land Farm 26 689.1 91.9
101, 103 F- Farm <10 ac/General Purpose Farm 32 1,449.7 86.0
102 F- Horse Farms 15 911.2
Subtotal 73 3,050.0 177.9
400, 405 C- Commercial Vacant Land/Dev Land Commercial 713 1,009.9 228.8
450 C- Golf courses, Hospitality/Recreation 3 6.9
430 C- Retail 6 18.6
450 C- Governmental 260.6
499 C - Other Commercial Structures 4 1.0
Subtotal 726 1,036.4 489.5
402 M- Apartments 20-39 units 1 2.6
503 R- Rural <10 acres/Rural Residential 3 4.2
500, 504 R- Residential Vacant Land, Lot/Rural Res Vacant 2,002 472.8
505 R- Development Land Residential 56 531.6 94.9
510 R- Single Family Dwelling, Platted Lot 40 7.1
550, 551 R- Condominium/Townhomes 20 2.5
590, 591 R- Transfer/Non-Qualifying 2 2.0 13.4
Subtotal 2,124 1,020.2 108.3
700 HOA/Ret Basin/OS/Greenway 3.9
751 Land Only 13 8.3
2,937 5,117.0 779.5 5,896.9

EXISTING CONDITIONS AND GROWTH TRENDS REPORT
Land Use Analysis
53
4.2.3 Vacant Land by Land Use Description and Subarea
Table 4.9 Vacant Land by Land Use Description and Subarea
Subarea Acreage
Code Description Downtown
(366 ac) East
(8,907 ac)
In Town Central
(2,515 ac)
In Town North
(4,106 ac)
In Town South
(7,699 ac) North
(5,799) Northwest (3,834 ac)
South (9,125 ac)
Southwest (3,163 ac) Total
101,102,103 F- Farm<10 ac/General Purpose/Horse 0 829 0 0 47 642 137 1042 45 2742
199 F- Other Agricultural 0 0 10 0 0 18 41 0.66 0 70
100, 105 F- Agricultural Vacant Land/Dev Land Farm 0 382 0 0 0 239 154 125 10 910
510 R- Single Family Dwelling, Platted Lot 61.9 2617 564 1420 4476 2044 914 4469 2095 18661
549,550,551 R- Condo Mother/Condominium/Townhome 14 245 21 45 123 39 26 195 113 821
520 R- Duplex/Halfplex 10.5 116 89 87 216 124 0 242 11 896
502, 503 R- Rural Residential/Rural <10 acres 0 62 0 0 0 7 24 66 0 159
500 R- Residential Vacant Land, Lot 8 159 38 74 68 62 49 43 26 527
504, 505 R- Rural Residential Vacant/Development Land Res 0 269 1.5 3 19 28 196 29 8 554
401, 402, 403
M- Apartments 4-40> 37 406 190 156 371 102 44 608 70 1984
420 C- Office 47 273 62 280 203 75 67 76 86 1169
430 C- Retail 15 605 84 315 291 151 45 431 65 2002
410 C - Industrial 3.6 337 67 487 354 167 1124 16 0 2556
450 C- Governmental 16 183 791 159 314 599 375 294 92 2823
460 C - Healthcare 2 109 90 6 76 10 13 52 14 372 468, 469,
489 C- Public Svc/Telecommunications 4.6 269 4 28 155 9 77 21 7 575
440 C- Hospitality/Recreation 24 136 77 105 128 123 7 75 52 727
463 C- Golf Courses 0 329 0 171 0 142 138 125 0 905
499 C- Other Commercial Structures 31 159 58 529 320 156 60 358 51 1722
456 C- Parking Structures 63 24 58 66 19 21 1 8 1.4 261.4
400,405 C- Commercial Vacant Land/Dev Land Comm 9 287 160 116 84 589 217 50 24 1536
700 HOA/Ret. Basin/Open Space/ Greenway 10 941 133 56 394 347 114 704 370 3069
725, 750,751
Air Lot/Improvement Only/Land Only 14 56 18 0 8 87 0 0 0 183
590,591 R- Transfer/Non-Qualifying 0 68 11 10 10 21 8 128
n/a Blanks 9 49 12 3 23 8 0.31 72 14 190
Total 379.6 7,699 2,518 4,106 7,653 4,900 3,501 7,955 3,107 41,819

EXISTING CONDITIONS AND GROWTH TRENDS REPORT
Housing Overview
54
5.0 HOUSING OVERVIEW
5.1 EXISTING HOUSING STOCK
Table 5.1 presents an overview of the total number of housing units in Fayette County and the surrounding counties as reported in the United States Census’ 2019 ACS. As such, the number of occupied households corresponds with the number of households reported in Table 2.2. Vacant units include both those for sale or rent as well as “Other Vacant”, which include houses not considered available, either due to condition or status. The Census reports 5,832 “Other Vacant” units in Fayette County in 2019, reducing the total available housing stock to less than 136,000 total units in the county.
Table 5.1 Housing Units by County
CountyTotal
Housing units
Occupied Housing
units
Vacant Housing
units
Homeowner Vacancy
rate
Rental Vacancy
rateFayette County 141,653 129,784 11,869 1.3% 4.8%Madison County 36,707 33,359 3,348 1.3% 4.8%Scott County 22,007 20,551 1,456 1.3% 4.3%Jessamine County 20,447 18,821 1,626 0.6% 4.7%Clark County 15,900 14,509 1,391 2.8% 3.7%Woodford County 11,138 10,355 783 2.1% 1.9%Bourbon County 9,064 8,106 958 1.1% 0.2%7 County Region 256,916 235,485 21,431Kentucky 1,983,949 1,734,618 249,331 1.6% 5.9%Source: United States Census; American Community Survey
Table 5.2 shows that the share of housing units built since 2000 compared to older housing stock. A direct relationship between new construction and population and household growth is not possible given that small and variable segment of older existing units are removed from the inventory over time. However, a rough comparison between new construction and population and household growth illustrates the interconnection between people and housing. Both Fayette County’s and the regional share of housing units built since 2000 generally tracks with population growth. Table 5.2 also shows that housing construction was significantly higher both regionally and statewide in the first decade of the 2000’s than in the past ten years, reflecting both the early

EXISTING CONDITIONS AND GROWTH TRENDS REPORT
Housing Overview
55
2000’s housing boom that eventually resulted in the recession at the end of the last decade that negatively affected the real estate market for many years into the next decade.
Table 5.3 and Figure 5.1 presents housing development by type since 2000 in Fayette County, based on building permit data collected from the county by the U.S. Department of Housing and Urban Development (HUD). These data focus on new unit construction, as opposed to renovations or additions to existing structures. The data illustrates both the end of the housing boom in Fayette County around 2007 and the gradual recovery, although overall housing construction has not returned to the levels of the early 2000’s, potentially due to the limitations of available land inside the USB as well as the development of robust housing markets in many surrounding counties.
Figure 5.1 also illustrates transition from a primarily single-family market to a mixed market of single family and multi-family units. While the increase in multi-family housing is significant, the category is dominated by higher-density developments with 5 or more units per structure, with a much smaller range of two to four-unit structures.
Table 5.2 Housing Units by Year of Construction
County
Fayette County 110,980 78.4% 21,391 14.7% 12,728 8.8% 34,119 23.5%Madison County 26,012 70.8% 7,321 19.9% 3,374 9.2% 10,695 29.1%Scott County 13,061 59.3% 6,449 29.3% 2,497 11.4% 8,946 40.7%Jessamine County 14,619 71.6% 4,175 20.4% 1,653 8.1% 5,828 28.5%Clark County 13,066 82.2% 2,349 14.8% 485 3.1% 2,834 17.9%Woodford County 8,983 80.7% 1,599 14.4% 556 5.0% 2,155 19.4%Bourbon County 7,412 81.9% 1,372 15.1% 280 3.0% 1,652 18.1%7 County Region 194,133 75.6% 44,656 18.7% 21,573 9.0% 66,229 27.7%Kentucky 1,590,257 80.1% 292,243 14.7% 101,449 5.1% 101,449 19.8%Source: United States Census; American Community Survey; HUD
2000 or laterpre 2000 2000 to 2009 2010 or later
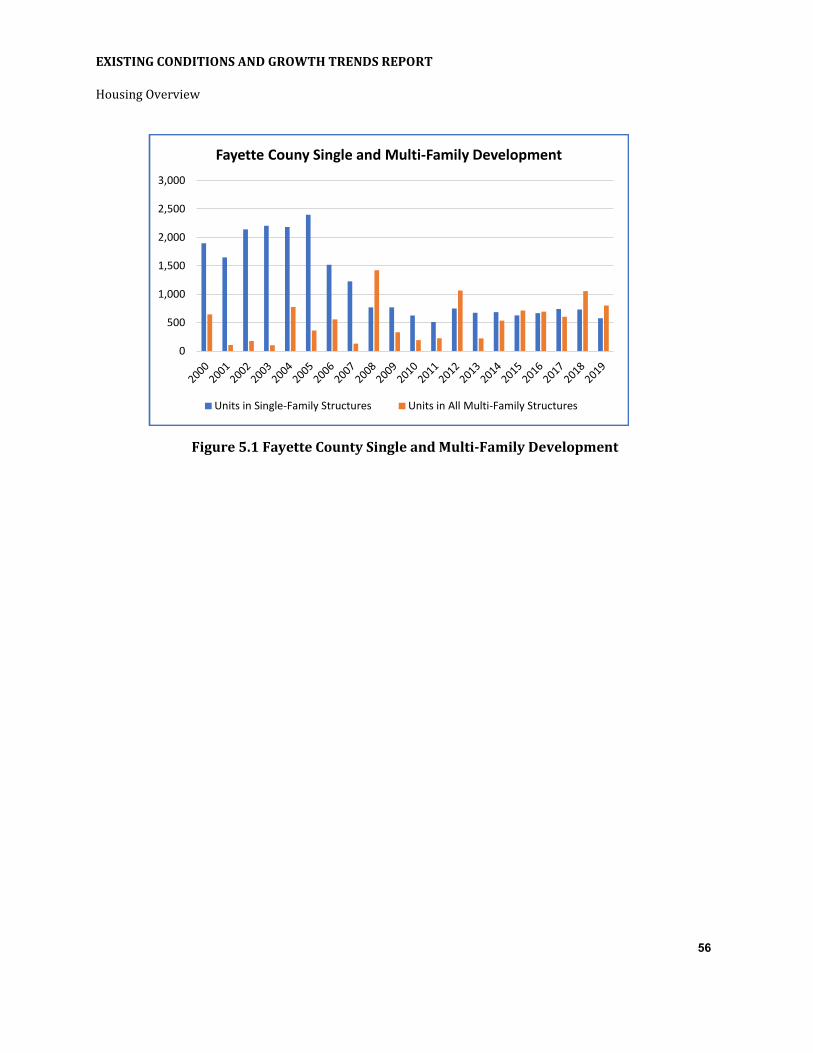
EXISTING CONDITIONS AND GROWTH TRENDS REPORT
Housing Overview
56
Figure 5.1 Fayette County Single and Multi-Family Development
0
500
1,000
1,500
2,000
2,500
3,000
Fayette Couny Single and Multi-Family Development
Units in Single-Family Structures Units in All Multi-Family Structures

EXISTING CONDITIONS AND GROWTH TRENDS REPORT
Housing Overview
57
Table 5.3 Fayette County Single and Multi-unit Development
YearAll MF
Structures2 unit MF
Structures3-4 unit MF Structures
5+ Unit MF Structures
2000 2,544 1,898 646 30 32 5842001 1,758 1,649 109 66 43 0
2002 2,321 2,142 179 6 44 129
2003 2,309 2,206 103 30 0 73
2004 2,960 2,184 776 14 82 680
2005 2,763 2,399 364 8 32 3242006 2,080 1,521 559 16 75 468
2007 1,360 1,227 133 6 39 882008 2,194 771 1,423 18 125 1,2802009 1,102 770 332 12 8 3122010 822 628 194 8 18 1682011 739 513 226 18 4 204
2012 1,816 750 1,066 10 16 1,0402013 899 676 223 10 26 1872014 1,225 687 538 12 20 5062015 1,342 629 713 12 10 6912016 1,365 670 695 8 8 6792017 1,348 743 605 8 6 5912018 1,789 733 1,056 10 7 1,0392019 1,383 579 804 0 0 804
2000-2009 21,391 16,767 4,624 206 480 3,9382000-2009 12,728 6,608 6,120 96 115 5,9092000-2019 34,119 23,375 10,744 302 595 9,847
Source: US HUD; US Census
Units in Multi-Family StructuresTotal Units
Single-Family
Table 5.4 compares the inventory of total housing units by type in Fayette County to the surrounding region. While single-family detached homes comprise the majority of housing units in Fayette County, its share is notably lower than surrounding counties. Fayette County’s share of larger structures with ten or more units is significantly higher than surrounding counties. Fayette County has much fewer mobile homes both in total amount and share than the surrounding counties. These distinctions reflect Fayette County’s position as the metropolitan center of the region.

EXISTING CONDITIONS AND GROWTH TRENDS REPORT
Housing Overview
58
Table 5.4 Housing Units by Type
Housing Unit Type Fayette County
Total housing units 141,653 100% 115,263 100% 1-unit, detached 84,693 59.8% 80,933 70.2% 1-unit, attached 8,984 6.3% 3,971 3.4% 2 units 5,453 3.8% 5,800 5.0% 3 or 4 units 6,392 4.5% 5,482 4.8% 5 to 9 units 9,672 6.8% 6,096 5.3% 10 to 19 units 11,279 8.0% 3,475 3.0% 20 or more units 13,649 9.6% 2,011 1.7% Mobile home 1,464 1.0% 7,445 6.5% Boat, RV, van, etc. 67 0.0% 50 0.0%*Bourbon, Clark, Jessamine, Madison, Scott and Woodford Counties combined Source: United States Census; American Community Survey
Six Adjacent Counties*
5.2 REAL ESTATE STATISTICS
The Lexington Bluegrass Association of Realtors has provided recent sales data for Fayette County and the surrounding counties. Table 5.5 and Figure 5.2 present total home sales by county for the region. The data reflects the effect of the housing downturn and recession in the previous decade in Fayette County as well as its subsequent recovery. The rise in sales in the housing markets in surrounding markets, particularly in Madison, Scott and Jessamine counties is also evident.
Table 5.6 and Figure 5.3 single out new home sales and demonstrate the precipitous drop in new construction at the time of the housing downturn and recession. While the downward trend of new construction in Fayette County has stabilized, new construction levels have not increased since the recession and have been flat for the past ten years. In contrast, annual new home construction in Madison, Scott and Jessamine counties has almost doubled from its levels in 2010. Since 2015, total sales of new homes in the surrounding counties have been higher than in Fayette County.
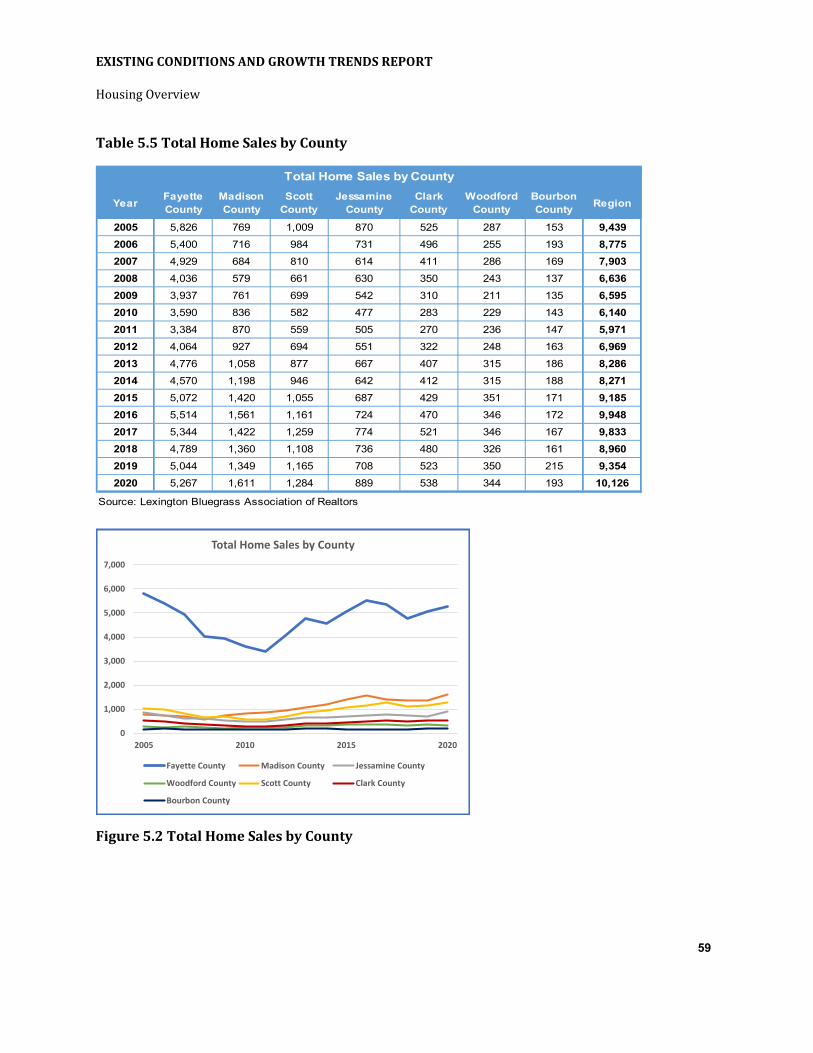
EXISTING CONDITIONS AND GROWTH TRENDS REPORT
Housing Overview
59
Table 5.5 Total Home Sales by County
Total Home Sales by County
Year Fayette County
Madison County
Scott County
Jessamine County
Clark County
Woodford County
Bourbon County Region
2005 5,826 769 1,009 870 525 287 153 9,4392006 5,400 716 984 731 496 255 193 8,7752007 4,929 684 810 614 411 286 169 7,9032008 4,036 579 661 630 350 243 137 6,6362009 3,937 761 699 542 310 211 135 6,5952010 3,590 836 582 477 283 229 143 6,1402011 3,384 870 559 505 270 236 147 5,9712012 4,064 927 694 551 322 248 163 6,9692013 4,776 1,058 877 667 407 315 186 8,2862014 4,570 1,198 946 642 412 315 188 8,2712015 5,072 1,420 1,055 687 429 351 171 9,1852016 5,514 1,561 1,161 724 470 346 172 9,9482017 5,344 1,422 1,259 774 521 346 167 9,8332018 4,789 1,360 1,108 736 480 326 161 8,9602019 5,044 1,349 1,165 708 523 350 215 9,3542020 5,267 1,611 1,284 889 538 344 193 10,126
Source: Lexington Bluegrass Association of Realtors
Figure 5.2 Total Home Sales by County
0
1,000
2,000
3,000
4,000
5,000
6,000
7,000
2005 2010 2015 2020
Total Home Sales by County
Fayette County Madison County Jessamine County
Woodford County Scott County Clark County
Bourbon County

EXISTING CONDITIONS AND GROWTH TRENDS REPORT
Housing Overview
60
Table 5.6 New Home Sales by County
New Home Sales by County
Year Fayette County
Madison County
Scott County
Jessamine County
Clark County
Woodford County
Bourbon County Region
2005 1,586 232 454 310 137 64 10 2,7932006 1,502 197 469 247 109 36 12 2,5722007 1,173 192 310 159 71 51 14 1,9702008 761 143 233 117 47 43 9 1,3532009 626 123 204 79 22 38 51 1,1432010 515 104 148 56 15 48 54 9402011 320 84 112 31 3 27 61 6382012 424 101 140 36 6 33 53 7932013 460 80 188 36 2 49 73 8882014 462 72 186 41 4 45 67 8772015 412 84 230 53 4 58 72 9132016 436 137 281 52 3 56 63 1,0282017 440 172 336 74 8 42 68 1,1402018 385 153 258 96 9 33 67 1,0012019 407 179 225 89 19 57 92 1,0682020 407 259 282 197 22 57 82 1,306
Source: Lexington Bluegrass Association of Realtors
Figure 5.3 New Home Sales by County
0
200
400
600
800
1,000
1,200
1,400
1,600
1,800
2005 2010 2015 2020
New Home Sales by County
Fayette County Madison County Jessamine CountyWoodford County Scott County Clark CountyBourbon County

EXISTING CONDITIONS AND GROWTH TRENDS REPORT
Housing Overview
61
Table 5.7 and Figure 5.4 present the trends in median sale prices for all homes sold in the region from 2005 to 2020. The pattern of rising sales prices over the past decade is evident in each county, and the proximity of sales prices among the counts with the largest housing market indicates the relative connections between the region’s housing markets. This trend in rising prices reflects similar conditions occurring nationwide. Fundamental issues affecting the housing market include an increase of new homebuyers entering the market along with sustained low mortgage interest rates spurring demand. Meanwhile, an overall downturn in new construction, potentially related to restrictive local housing policies or higher input costs, and a lower level of turnover in existing inventory limits supply.
Table 5.7 Median Sales Price: All Housing Types
Median Sales Price: All Housing Types
YearFayette County
Madison County
Scott County
Jessamine County
Clark County
Woodford County
Bourbon County
2005 153,500$ 150,000$ 149,500$ 132,825$ 125,028$ 174,000$ 110,000$ 2010 154,900$ 134,000$ 148,750$ 138,000$ 120,400$ 167,250$ 110,000$ 2015 169,000$ 143,950$ 163,615$ 143,950$ 119,900$ 195,000$ 125,000$ 2020 230,000$ 198,000$ 231,819$ 223,968$ 169,750$ 261,250$ 177,000$
CAGR 2.7% 1.9% 3.0% 3.5% 2.1% 2.7% 3.2%
Source: Lexington Bluegrass Association of Realtors
Figure 5.4 Median Sales Price: All Housing Types
$-
$50,000
$100,000
$150,000
$200,000
$250,000
$300,000
$350,000
$400,000
2005 2010 2015 2020
Median Sales Price: All Housing Types
Fayette County Madison County Jessamine CountyWoodford County Scott County Clark CountyBourbon County

EXISTING CONDITIONS AND GROWTH TRENDS REPORT
Housing Overview
62
The trend in upward sales prices is similar when comparing sales of single-family homes, primarily because they represent such a large share of the market. Table 5.8 and Figure 5.5 show the median single-family home sales in Fayette, Woodford, Scott, and Jessamine counties to be very similar in price and pattern, with the remaining counties displaying slightly lower median prices but with similar upward recent trends.
Table 5.8 Median Sales Price: Single-family Homes
Median Sales Price: Single-family Homes
YearFayette County
Madison County
Scott County
Jessamine County
Clark County
Woodford County
Bourbon County
2005 157,101$ 149,000$ 148,930$ 138,000$ 127,430$ 174,000$ 112,000$ 2010 159,000$ 134,500$ 149,625$ 140,000$ 124,750$ 164,950$ 114,500$ 2015 173,000$ 143,000$ 165,000$ 150,000$ 120,000$ 190,000$ 134,000$ 2020 237,915$ 198,000$ 235,000$ 230,000$ 171,400$ 260,250$ 180,000$
CAGR 2.8% 1.9% 3.1% 3.5% 2.0% 2.7% 3.2%
Source: Lexington Bluegrass Association of Realtors
Figure 5.5 Median Sales Price: Single-family Homes
Focusing in further on the median sales price of new single-family homes sales results in more notable differences between counties. As Table 5.9 and Figure 5.6 illustrate, home prices in counties with low volumes of new home sales show significant volatility year over year while still projecting a rising trend over time. New single homes in Fayette, Jessamine, and Woodford counties
$-
$50,000
$100,000
$150,000
$200,000
$250,000
$300,000
$350,000
$400,000
2005 2010 2015 2020
Median Sales Price: Single-family Homes
Fayette County Madison County Jessamine CountyWoodford County Scott County Clark CountyBourbon County

EXISTING CONDITIONS AND GROWTH TRENDS REPORT
Housing Overview
63
tend to be priced higher than homes in Scott and Madison counties. The increased prices in Fayette County reflect its prime location and limited supply coming onto the market, as well as higher land and other input costs in general, such as exaction fees related to infrastructure development in Lexington’s three expansion areas. The higher costs in Jessamine and Woodford counties are likely related to the specific characteristics and larger lot sizes of recent housing developments among relatively lower overall units for sales. Conversely, lower land and development costs in Scott and Madison counties are contributing factors for median lower prices in those and other outer counties.
Table 5.9 Median Sales Price: New Single-family Homes
Median Sales Price: New Single-family Homes
YearFayette County
Madison County
Scott County
Jessamine County
Clark County
Woodford County
Bourbon County
2005 176,475$ 175,135$ 160,113$ 161,200$ 141,900$ 212,043$ 150,700$ 2010 206,737$ 147,330$ 166,881$ 196,200$ 140,517$ 210,072$ 129,000$ 2015 269,250$ 174,250$ 199,366$ 252,456$ 177,250$ 249,463$ 269,900$ 2020 336,881$ 213,000$ 247,081$ 270,244$ 218,626$ 326,256$ 329,205$
CAGR 4.4% 1.3% 2.9% 3.5% 2.9% 2.9% 5.3%
Figure 5.6 Median Sales Price: New Single-family Homes
$-
$50,000
$100,000
$150,000
$200,000
$250,000
$300,000
$350,000
$400,000
2005 2010 2015 2020
Median Sales Price: New Single-family Homes
Fayette County Madison County Jessamine CountyWoodford County Scott County Clark CountyBourbon County

EXISTING CONDITIONS AND GROWTH TRENDS REPORT
Housing Overview
64
Table 5.10 Median Sales Price: First-time Single-family Homes
Median Sales Price: First Time Single Family
YearFayette County
Madison County
Scott County
Jessamine County
Clark County
Woodford County
Bourbon County
2005 131,500$ 124,865$ 126,908$ 119,500$ 110,000$ 121,000$ 99,110$ 2010 135,000$ 127,500$ 128,000$ 125,000$ 114,500$ 125,750$ 108,500$ 2015 145,000$ 137,000$ 139,900$ 125,000$ 115,500$ 150,700$ 95,000$ 2020 199,900$ 172,000$ 187,000$ 189,900$ 150,000$ 179,000$ 152,950$
CAGR 2.8% 2.2% 2.6% 3.1% 2.1% 2.6% 2.9%
Source: Lexington Bluegrass Association of Realtors
Figure 5.7 Median Sales Price: First-time Single-family Homes
$-
$50,000
$100,000
$150,000
$200,000
$250,000
$300,000
$350,000
$400,000
2005 2010 2015 2020
Median Sales Price: First Time Single Family
Fayette County Madison County Jessamine CountyWoodford County Scott County Clark CountyBourbon County

EXISTING CONDITIONS AND GROWTH TRENDS REPORT
Housing Overview
65
5.3 HOUSING OCCUPANCY AND COST
The general the characteristics of housing affordability begin with a survey of the household characteristics related to their housing situation. Table 5.11 presents the share of households living in owner-occupied units and renter-occupied units. While a majority of Fayette County’s units are owner-occupied, the ownership rate is the lowest in the region, which correlates to the higher rate of larger multi-family apartment developments and the large contingent of student and young working adults living in Lexington. Figure 5.8 shows the range of owner-occupied versus rental housing units, with Scott and Woodford counties having the highest rate of owner-occupied homes.
Table 5.11 Housing Occupancy by Tenure and Monthly Costs
Occupancy and Cost Fayette County
Madison County
Scott County
Jessamine County
Clark County
Woodford County
Bourbon County Kentucky
Occupied housing units 129,784 33,359 20,551 18,821 14,509 10,355 8,106 1,734,618 Owner-occupied units 54% 59% 70% 65% 67% 71% 63% 67% Owner-occupied units with a m 69% 62% 73% 65% 63% 65% 61% 58% Median monthly owner costs w/mortgage 1,345$ 1,198$ 1,328$ 1,247$ 1,141$ 1,302$ 1,131$ 1,178$ 35% or more of hshd income 14% 14% 11% 16% 18% 17% 17% 17%
Renter-occupied units 46% 41% 30% 35% 33% 29% 37% 33% Median monthly rent 896$ 710$ 900$ 789$ 727$ 771$ 730$ 763$ 35% or more of hshd income 40% 39% 24% 39% 30% 35% 35% 36%
Source: United States Census; American Community Survey
Figure 5.8 Housing Tenure by County
0%10%20%30%40%50%60%70%80%90%
100%
FayetteCounty
MadisonCounty
ScottCounty
JessamineCounty
ClarkCounty
WoodfordCounty
BourbonCounty
Owner Occupied vs. Renter by County
Owner-occupied units Renter-occupied units

EXISTING CONDITIONS AND GROWTH TRENDS REPORT
Housing Overview
66
Table 5.11 and Figure 5.9 present the average monthly housing costs for homeowners with mortgages and the average monthly rent. Housing costs are highest in Fayette, Scott, and Woodford counties, and run less than $200 higher than the statewide average, while the remaining counties are close to the Kentucky statewide average. Rental costs are highest in Fayette, Scott and Jessamine counties, approximately 20 percent higher than the Kentucky statewide average.
Figure 5.9 Monthly Housing Costs by County
Figure 5.10 shows the percentage of households who pay more than 35 percent of income to cover housing costs. This metric represents a maximum threshold for a household’s ability to affordably pay for housing. The share of homeowners who pay more than 35 percent is significantly lower than renters, who tend to have lower incomes than homeowners. The percentage of these homeowners in Fayette County is lower than most other counties in the region and the state. However, among renters, Fayette County, along with Scott and Madison counties, have the higher percentage of households paying more than 35 percent of income in rent. Fayette and Madison counties’ largest university student populations likely contribute to that statistic.
$-
$200
$400
$600
$800
$1,000
$1,200
$1,400
$1,600
FayetteCounty
MadisonCounty
ScottCounty
JessamineCounty
ClarkCounty
WoodfordCounty
BourbonCounty
Kentucky
Monthly Housing Costs by County
Median monthly owner costs w/mortgage Median monthly rent
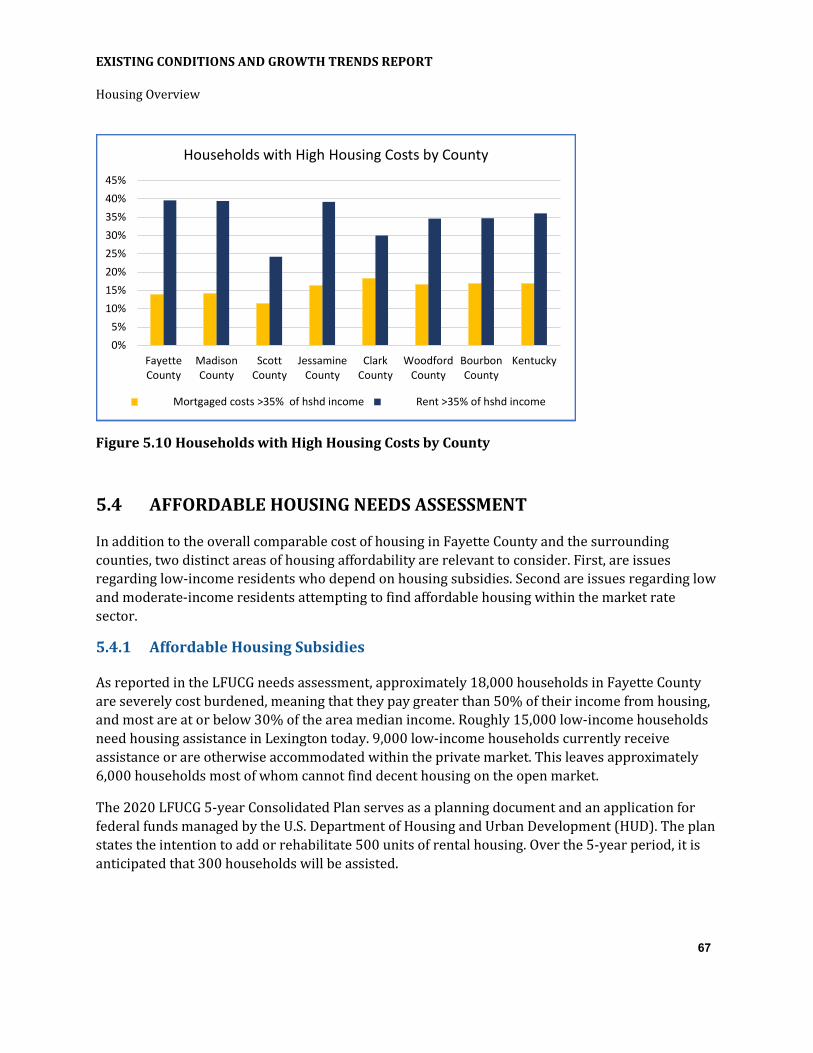
EXISTING CONDITIONS AND GROWTH TRENDS REPORT
Housing Overview
67
Figure 5.10 Households with High Housing Costs by County
5.4 AFFORDABLE HOUSING NEEDS ASSESSMENT
In addition to the overall comparable cost of housing in Fayette County and the surrounding counties, two distinct areas of housing affordability are relevant to consider. First, are issues regarding low-income residents who depend on housing subsidies. Second are issues regarding low and moderate-income residents attempting to find affordable housing within the market rate sector.
5.4.1 Affordable Housing Subsidies
As reported in the LFUCG needs assessment, approximately 18,000 households in Fayette County are severely cost burdened, meaning that they pay greater than 50% of their income from housing, and most are at or below 30% of the area median income. Roughly 15,000 low-income households need housing assistance in Lexington today. 9,000 low-income households currently receive assistance or are otherwise accommodated within the private market. This leaves approximately 6,000 households most of whom cannot find decent housing on the open market.
The 2020 LFUCG 5-year Consolidated Plan serves as a planning document and an application for federal funds managed by the U.S. Department of Housing and Urban Development (HUD). The plan states the intention to add or rehabilitate 500 units of rental housing. Over the 5-year period, it is anticipated that 300 households will be assisted.
0%5%
10%15%20%25%30%35%40%45%
FayetteCounty
MadisonCounty
ScottCounty
JessamineCounty
ClarkCounty
WoodfordCounty
BourbonCounty
Kentucky
Households with High Housing Costs by County
Mortgaged costs >35% of hshd income Rent >35% of hshd income

EXISTING CONDITIONS AND GROWTH TRENDS REPORT
Housing Overview
68
In the last two decades, rising rents have removed an estimated 28,000 apartment units in Lexington from the range of affordability to low wage workers. Rising rents are expected to continue likely continue, resulting in an estimated loss of 400 affordable units per year.
A 2014 affordable housing study prepared by the consulting firm CZB for LFUCG suggests that additional subsidized units to meet unmet demand can best be realized through private market incentive programs. Policies such as density bonuses, transfer of development rights, tax increment financing, and land banking are proven tools for raising development revenue. The study recommends land use planning initiatives to achieve the explicit community objective of more affordable housing units and drive resource generation. Alignment of the zoning code and development regulations towards meeting the affordability challenge will reduce the gaps need and supply and increase long term economic competitiveness of Fayette County’s economy.
Sources: Lexington 2020 Five–Year Consolidated Plan – 2020 One-Year Action Plan, May 15, 2020 Lexington Draft Consolidated Plan – 2021 One-Year Action Plan, April 9, 2021 Lexington’s Affordable Housing Challenge and Potential Strategy February 2014 – CZB Study
5.4.2 Market Based Housing Affordability
The 2017 Fayette County Housing Demand Study set the maximum affordability threshold for low-to-moderate income households at 80 percent of the area median household income. In 2017, the study stated that the maximum affordable home price for this cohort was $170,000. According to the 2019 ACS, the most recent household median income for Fayette County is $58,356 (Kentucky: $52,295), for which $46,685 would represent 80 percent. According to the mortgage affordability calculator at www.nerdwallet.com localized for Fayette County, a household with that income, average credit, and ability to provide a 20 percent down payment could maximum afford a home price of $185,000. This is approximately 20 percent below the median sales price for all homes recently sold in Fayette County ($230,000), and 7.5 percent below the median sales price for first time buyers of single-family homes. As the housing study noted, rising home prices will continuously reduce the number of homes for sale with the affordability of low-and-moderate income households.
The housing study defined 120 percent of the area median income as the upper bound of affordability for “workforce housing,” a middle-income demographic that is also adversely affected by housing prices that outpace community wages. Accordingly, a household income of $70,000 with average credit and a 20 percent down payment can afford home prices up to $339,000,
An accepted ratio of housing costs to income is no more than 28 percent of monthly gross income. Using this metric for rental housing, households with incomes at 80% of the median area household income can afford a maximum of $1,089 in rental costs, compared to the median monthly rent of $896. However, more than 40 percent of Lexington households earn less than this 80% median income, with 26 percent earning less than $30,000 per year.

EXISTING CONDITIONS AND GROWTH TRENDS REPORT
Commercial Development
69
6.0 COMMERCIAL DEVELOPMENT
A current trends analysis was conducted for Fayette County and the surround six counties that constitute the study area. The map below displays the submarkets of this analysis. Fayette County is broken into three submarkets for analysis, East Lexington, West Lexington, and Downtown Lexington.
Figure 6.1 Regional Analysis Submarkets
6.1 INDUSTRIAL ANALYSIS
Market Summary
There is approximately 60.4 million square feet of industrial inventory in Fayette County and the six surrounding counties (the region) as of Q1 2021. The regional industrial market continues to grow with strong overall fundamentals. The advance of e-commerce continues to create exponential growth in the industrial sector which has not experienced the impacts of the Covid-19 pandemic like other real estate assets. Demand for warehouse and logistics space is a major growth trend across North America and central and eastern Kentucky are no different. Specific sub-sectors of logistics such as cold storage and last-mile delivery have been driving demand in recent years.

EXISTING CONDITIONS AND GROWTH TRENDS REPORT
Commercial Development
70
Development patterns continue to be influenced by the USB in Fayette County. Developers and end-user tenants interested in bringing on larger-scale logistics centers have limited options for available greenfield land, although demand in Lexington is considerably less than major logistic hubs such as Louisville and Cincinnati. Infill industrial development for smaller-scale logistics, warehouse and manufacturing is driving the current market.
Market Breakdown
Fayette County has 31.8 million square feet as of Q4 2020. This is 53% of all industrial development in the region. Surrounding counties total 26.43 million square feet, 47% of industrial development. Fayette County is broken down into three submarkets; (1) West Lexington, (2) East Lexington, (3) Downtown Lexington. The West Lexington submarket has the largest inventory of 18.6 million square feet. This is followed by the East Lexington submarket. Scott County has 11.17 million SF of inventory; however, the Toyota Georgetown Assembly Plant makes up a significant portion of this inventory.
Source: CoStar Figure 6.2 Regional Industrial Inventory by Submarket (Q4 2020)
Industrial vacancy rates are low across most of the region. The overall vacancy rate was 3.7% at the end of 2020 and trending downwards. Trends demonstrate that vacancy rates are expected to go below 3% into 2021, near historical lows. Vacancy rates under 5% typically demonstrate the need for new industrial development to match increasing demand. Vacancy rates are low in most counties. Only Bourbon County has a vacancy rate above 5%. Downtown Lexington has a small inventory but high vacancy rate due to small and relatively obsolete industrial stock. Redevelopment of older properties into more efficient uses in Downtown Lexington signifies that
SubmarketInventory SF
(2020)West Lexington/Fayette 18,548,598East Lexington/Fayette 12,057,881Downtown Lexington 1,147,049Scott County 11,172,325Jessamine County 3,894,887Clark County 3,342,866Woodford County 3,438,999Bourbon County 1,996,909Madison County 4,793,315
60,392,829

EXISTING CONDITIONS AND GROWTH TRENDS REPORT
Commercial Development
71
industrial stock adjacent to the downtown area may become more limited. Scott County, Jessamine County, and Woodford County all have industrial vacancy rates below 0.5%.
Source: CoStar
Figure 6.3 Regional Industrial Vacancy Rates by Submarket (Q4 2020)
Leasing activity continues to be limited in recent years due to a tight vacancy rate and a lack of new industrial inventory in the market. Most leases signed are sub 20,000 square feet and no new leases have been signed over 100,000 square feet over the past year. The largest lease in 2020 was in Jessamine County, where Finlay Parker Holdings occupied 75,000 square feet. The largest activity in Fayette County was at Lexington Business Center where Framebridge and LaserShip signed 50,000 square foot and 24,200 square foot deals, respectively.
Submarket Market Vacancy RateEast Lexington/Fayette Lexington - KY 5.6%West Lexington/Fayette Lexington - KY 6.7%Downtown Lexington Lexington - KY 4.4%Jessamine County Lexington - KY 5.3%Scott County Lexington - KY 1.0%Clark County Lexington - KY 7.0%Woodford County Lexington - KY 3.9%Bourbon County Lexington - KY 3.8%Madison County Lexington - KY 0.7%

EXISTING CONDITIONS AND GROWTH TRENDS REPORT
Commercial Development
72
Source: CoStar
Figure 6.4 Fayette County Industrial Annual Inventory and Vacancy Rate
The lack of available inventory has led to continued growth in industrial lease rates. Landlords are capitalizing on a tight vacancy rate by increasing asking prices, especially in high demand areas that have strong highway connectivity. 2020 experienced 4% rent growth and the overall market has posted seven years of positive rental growth rates. Average lease rates reached $6.30/SF at the end of 2020, up from $5/SF at the end of 2015.
Regional Comparison
Fayette County has received a larger share of new industrial development over the past 20 years (2000 to 2020). There has been 5.6 million square feet of new industrial delivered in Fayette County compared to 2.5 million square feet in surrounding counties. In the year 2000, Fayette County had a 50/50 split of industrial inventory with combined surrounding counties. In the past twenty years, Fayette County accounted for 70% of new industrial development bringing its regional share to 53%.
Jessamine and Madison County have the largest share of new industrial deliveries outside of Fayette County over the past 20 years with 750,000 square feet and 566,000 square feet of new inventory, respectively. Data demonstrates that Fayette County does not compete with adjacent jurisdictions for new industrial development, but rather faces strong competition from other regions such as Louisville and Cincinnati/North Kentucky.
0.0%
1.0%
2.0%
3.0%
4.0%
5.0%
6.0%
30,000,000
30,500,000
31,000,000
31,500,000
32,000,000
32,500,000
Annual Inventory Annual Vacancy Rate

EXISTING CONDITIONS AND GROWTH TRENDS REPORT
Commercial Development
73
6.2 6.2 OFFICE ANALYSIS
Market Summary
There is approximately 22.4 million square feet of office inventory in Fayette County and the six surrounding counties (the region) as of Q1 2021. The regional office market remains healthy compared to other regions across the nation that are still experiencing the fallout of the Covid-19 pandemic. Lexington has historically been considered a smaller office market compared to larger-scale metro areas such as Louisville, Cincinnati, Charlotte, and Nashville, however its size has allowed it to weather recent economic shifts. The region currently has a vacancy rate of 7% while Louisville and Cincinnati both have vacancy rates above 15% across their metros. The Lexington office market has demonstrated itself to be a stable market, with less speculative development occurring than in the larger markets. Speculative development can lead to higher overall vacancies both for new buildings and the older building stock that must compete with the new inventory for existing tenants. In contrast, the Lexington market appears to develop inventory with tenant arrangements more prominently established before development takes place.
Demand for office space in the region has primarily been for small-scale spaces. Space take-up has been centered around professional services, health, medical, administrative, and back-office tenants. Leasing activity as slowed due to Covid-19 as many tenants have either scaled back operations or are in “wait and see” modes prior to making a move. Construction of new inventory remains limited, with no major office projects under construction as of Q4 2020. Only 20,000 square feet of new space was completed in 2020.
Market Breakdown
Fayette County has 18.8 million square feet as of Q4 2020. This is 84% of all office development in the region. Surrounding counties total 3.6 million square feet, 16% of office development. Fayette County is broken down into three submarkets; (1) West Lexington, (2) East Lexington, (3) Downtown Lexington. Surprisingly, office space is well spread throughout Fayette County with each submarket having a strong share of inventory. The East Lexington submarket has the largest inventory of 7.2 million square feet followed by West Lexington at 6.3 million square feet.
Office vacancy rates are healthy across the region with only the East Lexington submarket having a vacancy rate higher than 10%. The average vacancy rate of 7% across all markets is lower than the historic average of 9%. Trends demonstrate that vacancy rates are likely to continue to increase in 2021 due to the ongoing Covid-19 pandemic and consolidation of office space by many tenants. Vacancy rates are quite low for surrounding counties; however, this is due to these areas having a small amount of inventory. Only Madison County has an inventory of over 1,000,000 square feet in size. Markets such as Jessamine, Clark, and Scott County have nearly zero available inventory which may demonstrate opportunities for new development if demand is warranted.

EXISTING CONDITIONS AND GROWTH TRENDS REPORT
Commercial Development
74
Source: CoStar
Figure 6.5 Regional Office Inventory by Submarket (Q4 2020)
Source: CoStar
Figure 6.6 Regional Office Vacancy Rates by Submarket (Q4 2020)
Absorption is very limited across all markets. The region featured only 16,000 square feet of net absorption in 2020 after a relatively strong 2019. Tenants are leasing space however absorption is affected by several large move-outs including Valvoline vacating 260,000 square feet of space and moving out of the Lexington market. New leases are primarily sub 20,000 square feet in size and
SubmarketInventory SF
(2020)East Lexington/Fayette 7,189,461West Lexington/Fayette 6,307,585Downtown Lexington 5,300,845Jessamine County 826,114Clark County 520,494Scott County 519,776Woodford County 473,218Bourbon County 160,234Madison County 1,071,948
22,369,675
Submarket Market Vacancy RateEast Lexington/Fayette Lexington - KY 10.3%West Lexington/Fayette Lexington - KY 5.2%Downtown Lexington Lexington - KY 7.8%Jessamine County Lexington - KY 1.8%Clark County Lexington - KY 0.5%Scott County Lexington - KY 0.6%Woodford County Lexington - KY 6.6%Bourbon County Lexington - KY 0.0%Madison County Lexington - KY 3.1%

EXISTING CONDITIONS AND GROWTH TRENDS REPORT
Commercial Development
75
are expected to remain small-scale. The impact of COVID-19 is felt in annual rent growth where the office market has experienced negative rental growth with reductions in asking rent across the board in the region. Rent increases are likely to be limited due to limited market movement and new tenants seeking significant space. Average market lease rates across the region stand at $17.40/SF which is down from 2019 levels but still near a 10-year high.
Source: CoStar
Figure 6.7 Fayette County Office Annual Inventory and Vacancy Rate
Regional Comparison
Fayette County has received a larger share of new office development over the past 20 years (2000 to 2020). There has been 4.6 million square feet of new office delivered in Fayette County compared to 1.3 million square feet in surrounding counties. In the year 2000, Fayette County had a 86% of office inventory with 14% combined in the surrounding counties. In the past twenty years, Fayette County obtained 78% of new office development bringing its regional share slightly down to 84%. Although market share of total inventory has decreased slightly over the past two decades, the total amount of new office development is still significantly weighed towards Fayette County as office tenants still prefer to be located near universities, amenities, and a large workforce.
Jessamine County has experienced the largest amount of new development other than Fayette County, and eclipsed Downtown Lexington in new inventory over the past 20 years. Downtown Lexington has had approximately 450,000 square feet of new inventory come onto the market since 2000, demonstrating that most of the new space has been constructed in suburban areas of East and West Lexington.
0.0%
2.0%
4.0%
6.0%
8.0%
10.0%
12.0%
16,000,000
16,500,000
17,000,000
17,500,000
18,000,000
18,500,000
19,000,000
19,500,000
20,000,000
2007 2008 2009 2010 2011 2012 2013 2014 2015 2016 2017 2018 2019 2020
Annual Inventory Annual Vacancy Rate

EXISTING CONDITIONS AND GROWTH TRENDS REPORT
Commercial Development
76
6.3 RETAIL ANALYSIS
Market Summary
There is approximately 36.7 million square feet of retail inventory in Fayette County and the six surrounding counties (the region) as of Q1 2021. Like the office market, there has been a recent strain on the retail assert class due to the Covid-19 pandemic. The retail asset class has had strong historical performance in the region over the past several decades, even with shifting retail trends and the rise of e-commerce.
Retail demand is in growing residential neighborhoods where this is the need for daily shopping and services such as grocery, pharmacy, food & beverage, and medical. Many new developments are smaller infill retail or mixed-use retail projects rather than large-scale power centers. The Summit at Fritz farm which opened in 2017 is the largest new mixed-use retail project in the region and features approximately 300,000 square feet of leasable space.
Market Breakdown
Fayette County has 22 million square feet as of Q4 2020. This is 60% of all retail development in the region. Surrounding counties total 14.7 million square feet, 40% of retail development. Fayette County is broken down into three submarkets; (1) West Lexington, (2) East Lexington, (3) Downtown Lexington. The East Lexington submarket has the largest inventory of 12 million square feet. This is followed by the East Lexington submarket with 7.8 million square feet.
The region has a 4% vacancy rate which is lower than the 5% U.S. national rate. Vacancies are highest in enclosed malls as they have lost market share in recent years to e-commerce which has been significantly amplified due to the pandemic. Many analysts predict that it will be a struggle for enclosed malls to recover and increase their occupancy. Strip centers, power centers, and general retail have the lowest vacancy rates when comparing different retail typologies.
Although the region has a 4% vacancy rate, West Lexington and East Lexington both have higher than average vacancy rates, at 5.6% and 6.7% respectively. These are still considered healthy for the retail market, especially as retail has been hit hard by the pandemic. Scott County leads the way with a 1% vacancy rate, demonstrating high demand for retail spaces in growing residential areas of Georgetown.

EXISTING CONDITIONS AND GROWTH TRENDS REPORT
Commercial Development
77
Source: CoStar
Figure 6.8 Regional Retail Inventory by Submarket (Q4 2020)
Source: CoStar
Figure 6.9 Fayette County Retail Annual Inventory and Vacancy Rate
Submarket Inventory SFEast Lexington/Fayette 12,064,079West Lexington/Fayette 7,806,687Downtown Lexington 2,129,827Jessamine County 2,918,623Scott County 2,886,235Clark County 2,106,029Woodford County 994,558Bourbon County 1,116,411Madison County 4,647,014
36,669,463
0.0%
1.0%
2.0%
3.0%
4.0%
5.0%
6.0%
7.0%
18,000,000
18,500,000
19,000,000
19,500,000
20,000,000
20,500,000
21,000,000
21,500,000
22,000,000
22,500,000
23,000,000
2007 2008 2009 2010 2011 2012 2013 2014 2015 2016 2017 2018 2019 2020
Lexington Fayette County Retail
Annual Inventory Annual Vacancy Rate

EXISTING CONDITIONS AND GROWTH TRENDS REPORT
Commercial Development
78
Retail leasing has slowed in recent years, especially for larger-scale tenants that would be in power centers or enclosed malls. Leasing has been focused on smaller spaces in the sub 30,000 square foot category. Leasing has been most popular in East and West Lexington which is where the greatest amount of residential growth has occurred in the past several decades.
Rental growth has been stable over the past decade and Lexington has averaged 2% rental growth since 2010. Rental growth is expected to slow in 2021 due to the pandemic, however average lease rates at $16.60/SF are at historic levels and are higher than Louisville. West Lexington has the highest asking lease rates of $19.13/SF and has also experienced the fastest rental growth.
Regional Comparison
Fayette County has received a larger share of new retail development over the past 20 years (2000 to 2020). There has been 5 million square feet of new retail delivered in Fayette County compared to 4 million square feet in surrounding counties. While the majority of industrial and office have continued to be built in Fayette County, retail has followed rooftops and located in areas of strong residential growth. In the year 2000, Fayette County had 62% of retail inventory with 38% combined in the surrounding counties. In the past twenty years, Fayette County obtained 55% of new retail development bringing its regional share slightly down to 60%.
East Lexington has experienced the most retail development out of all submarkets over the past two decades, encompassing 33% of all new construction in the region. This is followed by West Lexington and Jessamine County. Jessamine County has seen significant retail development in Nicholasville, especially in areas such as Brannon Crossing which is located adjacent to the Fayette and Jessamine County border.

EXISTING CONDITIONS AND GROWTH TRENDS REPORT
Fiscal profile
79
7.0 FISCAL PROFILE
Impact to LFUCG finances should be an important consideration in deciding if, when, where and how the USB will be expanded. Knowing how different types of development patterns translate to revenue and expenditures should be considered alongside how they meet demand and how they meet LFUCG goals such as the provision of affordable housing, accessibility, or preservation of green space.
7.1 REVENUE
LFUCG’s annual revenue comes from several sources. Two in particular are directly influenced by land use and ultimately changes to the USB: Ad Valorem taxes and Licenses and Permits. Ad Valorem taxes are primarily property taxes assessed by the Property Valuation Administrator. Revenue from Licenses and Permits is dominated by the Occupational License Fees. Table 7.1 shows the breakdown of LFUCG revenue.
Table 7.1 LFUCG Revenue Sources
Revenue Source Amount PercentAd Valorem Taxes 25,975,000$ 6.91%Licenses and Permits 318,843,000$ 84.76%Services 26,584,508$ 7.07%Fines and Forfeitures 260,250$ 0.07%Intergovernmental 498,156$ 0.13%Property Sales 150,000$ 0.04%Investments 1,172,000$ 0.31%Other Income 2,680,777$ 0.71%Total 376,163,691$ Source: LFUCG
Property taxes represent about 7% of LFUCG revenues or roughly $26million annually while Occupational License Fees represent about 55% of revenue or roughly $207million annually. Different types of land use and development patterns produce different amounts of revenue. To normalize the data for fair comparison, it is helpful to calculate a per acre value for revenue generated by the various land use types. Offices produce the most revenue per acre for LFUCG, mostly from the occupational license fee. Single family residential and agricultural uses generate the lease amount of direct revenue, however their presence supports the revenue generated in other areas. The revenue generated by the various land use types are illustrated in Table 7.2 and Figure 7.1. Only $156million of Occupational License Fee revenue was able to be attributed to

EXISTING CONDITIONS AND GROWTH TRENDS REPORT
Fiscal profile
80
specific land uses in Fayette County. The remaining $50million is being paid from addresses outside Fayette County. Property tax revenue is estimated based on assessed value, therefore it will not equal what was actually collected and represented in Table 7.2.
Table 7.2 LFUCG Revenue by Land Use Type
OccupationalLicense Fees
Office $29,726,283 $1,237,670Govt/Healthcare $44,954,551 $429,127Large Apartment $2,950,033 $2,189,074Retail $15,033,800 $3,267,729Industry $11,894,474 $1,112,757Parking Structure $2,487,568 $48,147Hospitality $4,042,483 $930,471Apartment $2,075,932 $491,523Other Commercial $2,562,703 $317,938Townhouse $981,269 $1,014,472Other Non-Taxable $10,901,183 $0Duplex $2,098,678 $703,401Single Family $17,535,438 $13,469,871Other Residential $3,522,888 $1,642,870Agriculture $5,034,527 $923,028Total $155,801,811 $27,778,079Source: LFUCG
Land Use Property Taxes

EXISTING CONDITIONS AND GROWTH TRENDS REPORT
Fiscal profile
81
Figure 7.1 LFUCG Revenue by Land Use Type
Another way to look at revenue is geographically. Figures 7.2 and 7.3 illustrate where in Fayette County property taxes and Occupational License Fees are generated. Lexington if typical of other cities, however the influence of the USB is evident in both maps. Figure 7.4 illustrates the combination of property taxes and occupational license fees.
$-
$50
$100
$150
$200
$250
$300
$350
$400
Business Fee/Acre Property Tax/Acre
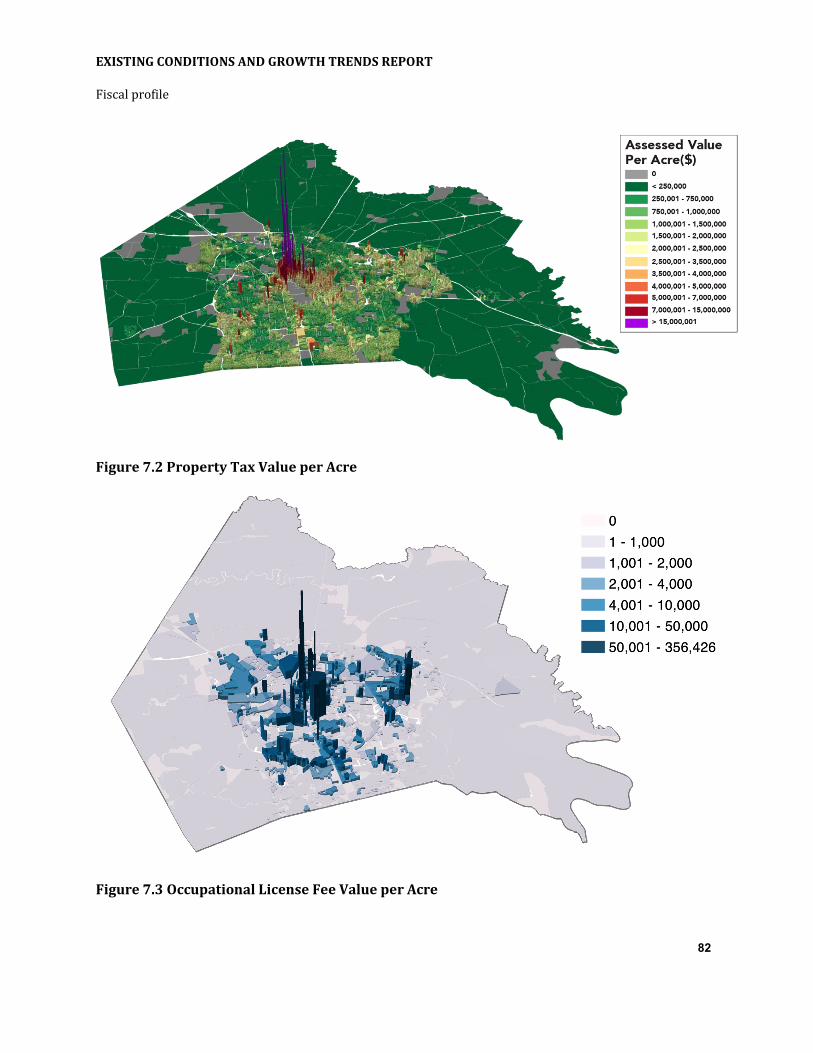
EXISTING CONDITIONS AND GROWTH TRENDS REPORT
Fiscal profile
82
Figure 7.2 Property Tax Value per Acre
Figure 7.3 Occupational License Fee Value per Acre

EXISTING CONDITIONS AND GROWTH TRENDS REPORT
Fiscal profile
83
Figure 7.4 Combined Property Tax and Occupational License Fee Revenue
7.2 EXPENDITURES
Expenses are equally important as revenue when considering the impact of development on LFUCG finances. Most expenses can be attributed evenly across the county, however the costs of operating and maintaining certain infrastructure varies by geography. Table 4.3 shows annual amounts for LFUCG’s major expense categories.
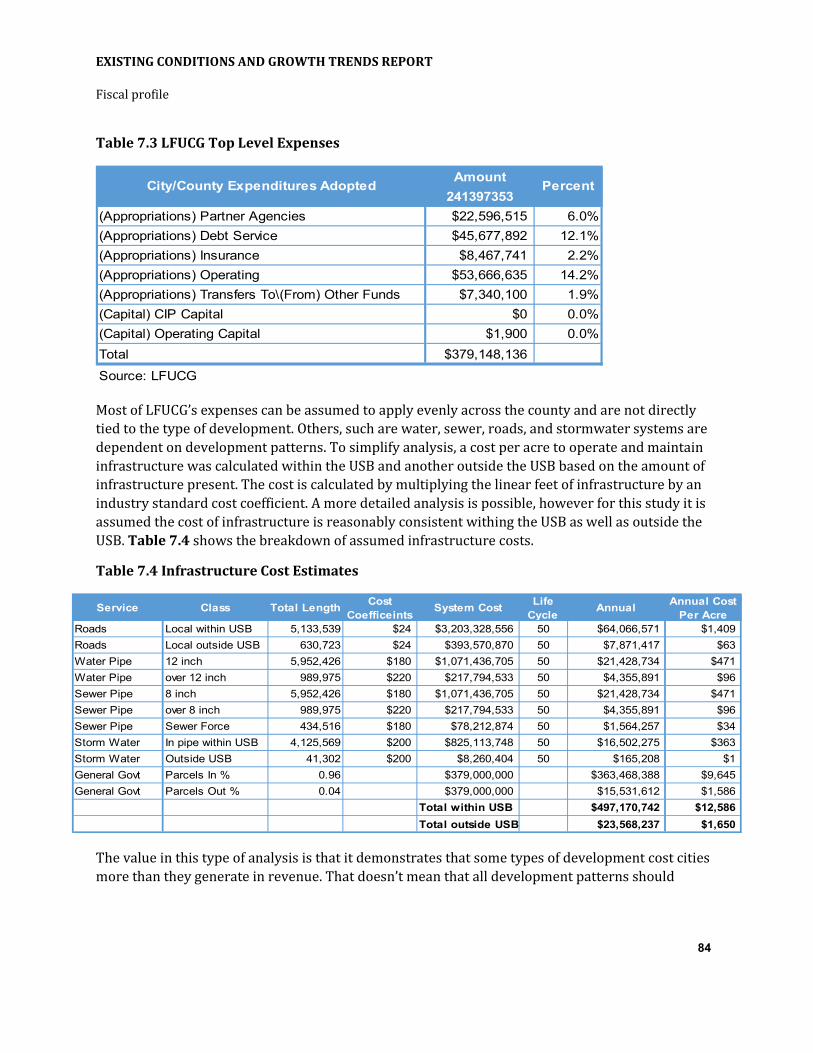
EXISTING CONDITIONS AND GROWTH TRENDS REPORT
Fiscal profile
84
Table 7.3 LFUCG Top Level Expenses
Amount241397353
(Appropriations) Partner Agencies $22,596,515 6.0%(Appropriations) Debt Service $45,677,892 12.1%(Appropriations) Insurance $8,467,741 2.2%(Appropriations) Operating $53,666,635 14.2%(Appropriations) Transfers To\(From) Other Funds $7,340,100 1.9%(Capital) CIP Capital $0 0.0%(Capital) Operating Capital $1,900 0.0%Total $379,148,136Source: LFUCG
City/County Expenditures Adopted Percent
Most of LFUCG’s expenses can be assumed to apply evenly across the county and are not directly tied to the type of development. Others, such are water, sewer, roads, and stormwater systems are dependent on development patterns. To simplify analysis, a cost per acre to operate and maintain infrastructure was calculated within the USB and another outside the USB based on the amount of infrastructure present. The cost is calculated by multiplying the linear feet of infrastructure by an industry standard cost coefficient. A more detailed analysis is possible, however for this study it is assumed the cost of infrastructure is reasonably consistent withing the USB as well as outside the USB. Table 7.4 shows the breakdown of assumed infrastructure costs.
Table 7.4 Infrastructure Cost Estimates
Service Class Total Length Cost Coefficeints System Cost Life
Cycle Annual Annual Cost Per Acre
Roads Local within USB 5,133,539 $24 $3,203,328,556 50 $64,066,571 $1,409Roads Local outside USB 630,723 $24 $393,570,870 50 $7,871,417 $63Water Pipe 12 inch 5,952,426 $180 $1,071,436,705 50 $21,428,734 $471Water Pipe over 12 inch 989,975 $220 $217,794,533 50 $4,355,891 $96Sewer Pipe 8 inch 5,952,426 $180 $1,071,436,705 50 $21,428,734 $471Sewer Pipe over 8 inch 989,975 $220 $217,794,533 50 $4,355,891 $96Sewer Pipe Sewer Force 434,516 $180 $78,212,874 50 $1,564,257 $34Storm Water In pipe within USB 4,125,569 $200 $825,113,748 50 $16,502,275 $363Storm Water Outside USB 41,302 $200 $8,260,404 50 $165,208 $1General Govt Parcels In % 0.96 $379,000,000 $363,468,388 $9,645General Govt Parcels Out % 0.04 $379,000,000 $15,531,612 $1,586
Total within USB $497,170,742 $12,586Total outside USB $23,568,237 $1,650
The value in this type of analysis is that it demonstrates that some types of development cost cities more than they generate in revenue. That doesn’t mean that all development patterns should

EXISTING CONDITIONS AND GROWTH TRENDS REPORT
Fiscal profile
85
generate more than they cost, however there must be an appropriate balance for city finances to be sustainable. Having an understanding of this dynamic should help make decisions about what types of development should occur when the USB is expanded. Figure 7.5 illustrates where in Fayette County generates revenues that exceeds the average per acre costs and by how much. Areas in green illustrate the essential sources of land use-based revenue generation for LFUCG.
Figure 7.5 Revenue Related to Average Per Acre Cost
General Government, $379,000,000
Pipes, $69,800,990
Roads, $71,937,989
Business License Fees, $208,250,000
Property Tax, 25,975,000
Other Revenue,
144,775,000
Expenses
Revenue

EXISTING CONDITIONS AND GROWTH TRENDS REPORT
Infrastructure and community facilities
86
8.0 INFRASTRUCTURE AND COMMUNITY FACILITIES
Evaluating the USB and making decision about possible expansion should be informed by the current provision of infrastructure and certain community facilities and services, including roads, public transit, water, sewer, schools, libraries, community centers, parks, and public safety. The provision and funding of certain infrastructure and community facilities in the Expansion Areas is managed and funded through the Exactions Program administered by LFUCG. This program ensures that “new development activity is served by adequate public facilities and bears a proportionate share of the cost of improvements necessary to provide roads, parks, open space and sanitary sewer treatment, sanitary sewer transmission capacity and stormwater management facilities in the Expansion Areas of Lexington-Fayette County; and to mitigate the loss of rural landscape in the Expansion Areas by providing for an exaction for preservation of undeveloped land within the Rural Service Area in the vicinity of the Expansion Areas or of community-wide significance.”
8.1 TRANSPORTATION
8.1.1 Roads
LFUCG and KYTC are responsible for building and maintaining roadways in Fayette County with planning assistance from the Lexington Area MPO. Roadway service inside the USB is robust. The 2045 Metropolitan Transportation Plan (MTP) includes a few projects that involve completely new roads. Most projects involve widening and multimodal improvements to reduce congestions. Several of these projects will increase the development potential of areas within the USB, particularly the Hamburg Connector in Expansion Area 2 and the Citation Boulevard extension to Russell Cave Road
8.1.2 Transit
LexTran is responsible for providing transit service in Lexington, which includes 26 fixed-route bus lies and paratransit to customers eligible for special service. Approximately 45% of Lexington parcels are within one quarter mile of a fixed-route bus line, conventionally considered the threshold for considering a destination accessible to transit. While LexTran provides paratransit service throughout the county, federal paratransit regulations only require the provision of service for trips within three quarters of a mile from a regular fixed route. Figure 8.1 illustrates the coverage area of current fixed-route bus lines, along with quarter mile and three quarter mile buffers.

EXISTING CONDITIONS AND GROWTH TRENDS REPORT
Infrastructure and community facilities
87
Figure 8.1
8.2 WATER AND SEWER
LFUCG’s Division of Water Quality is responsible for the city’s sewer system and treatment plants, while water service is provided by Kentucky American Water. Sewer service outside the USB is extremely limited and is focused on key public facilities including the Bluegrass Airport, Keenland, Kentucky Horse Park and the Federal Medical Center. Water service is available to large parts of the County outside the USB, but like sewer service, it is concentrated within the USB. Extension of water and sewer service into the Expansion Areas is governed under LFUCG’s Exaction Program and varies by area and correlated with the level of development in each area. Service provision is greatest in Expansion Area 2, where much development has occurred. Water and Sewer infrastructure in Expansion Area 3 is partially constructed, whereas service is not yet available in Expansion Area 1. Figures 8.2 and 8.3 illustrate current water and sewer service within the USB.

EXISTING CONDITIONS AND GROWTH TRENDS REPORT
Infrastructure and community facilities
88
Figure 8.2 Water Service Coverage

EXISTING CONDITIONS AND GROWTH TRENDS REPORT
Infrastructure and community facilities
89
Figure 8.3 Sewer Service Coverage
8.3 SCHOOLS
Fayette County Public Schools (FCPS) serves over 42,000 students with 37 elementary schools, twelve middle schools, six high schools, and three technical centers. FCPS determines the timing and location of new schools according to the regulatory guidelines of the Kentucky Department of Education. FCPS has acquired land and is planning for a new middle school and new elementary school in Expansion Area 2. FCPS is also planning to consolidate its existing career and technical education (CTE) programs – currently split between two campuses at Eastside Technical Center and Southside Technical Center in a new single location in downtown Lexington.

EXISTING CONDITIONS AND GROWTH TRENDS REPORT
Infrastructure and community facilities
90
FCPS is not required to site new facilities within the USB, however growth scenarios should reserve sufficient space for new schools needed to serve areas with new and growing populations. Figure 8.4 shows the location of FCPS’s current school facilities.
Figure 8.4 FCPS School Locations
8.4 PUBLIC SAFETY
Lexington currently has 24 individual fire stations, 20 of which are located inside the USB. The Lexington Fire Department has a Class 1 rating by the Insurance Service Organization (ISO) and is one of only eight departments in Kentucky with that top designation. The Class 1 rating represents the quality and coverage of department facilities and infrastructure, as well as service metrics, including response time, indicating that sufficient coverage exists for all areas within the USB.

EXISTING CONDITIONS AND GROWTH TRENDS REPORT
Infrastructure and community facilities
91
The Lexington Police Department divides the County into three sectors: East, and Central, and West. Sector boundaries were last drawn in the 1990’s based on census tracts and are set to be reevaluated when data from the 2020 Census becomes available. Each sector is divided into four beats, which are further divided into two sub-beats, which are the basis for the allocation of resources for patrol shifts. Resources for patrol shifts are determined by population and call volume, with particular emphasis on priority 1 and 2 calls which deal with imminent danger to life or property. Call volume and patrol resources have notably increased in the East sector due to the significant growth in this part of the city in the past 20 years.
As the County’s population grows, LFUCG will have to expand police, fire, and EMS services and facilities. While Lexington does not have set standards for population served or travel times for police and fire stations, growth scenarios should reserve space for new police and fire stations. Figure 8.5 shows the current distribution of fire stations and police sectors.
Figure 8.5 Police and Fire Coverage

EXISTING CONDITIONS AND GROWTH TRENDS REPORT
Infrastructure and community facilities
92
8.5 PARKS AND RECREATION
Lexington maintains just over 5300 acres in 101 parks and golf courses across the county. Only four of these parks are located entirely outside the USB. LFUCG also operates Lexington operates 6 libraries spread evenly throughout the urban service area. While Lexington does not have level of service requirements for libraries, parks, and recreation facilities, growth scenarios should reserve space for additional parks. Figure 8.6 shows the distribution of Lexington’s current libraries, parks, and golf courses.
Figure 8.6 LFUCG Parks

EXISTING CONDITIONS AND GROWTH TRENDS REPORT
Population Growth trends
93
9.0 POPULATION GROWTH TRENDS
The growth in population and households is the foundation for estimating the additional supply of housing that will be required in the future. In correspondence with the 20-year time horizon of the Imagine Lexington and conventional comprehensive planning analysis periods, a projection of population and households in the year 2040 is appropriate. Similar to most planning efforts in Kentucky, when LFUCG developed the Imagine Lexington plan, they used population projections provided by the Kentucky State Data Center (KSDC), which is the state’s lead agency in the U.S. Census Bureau’s State Data Center Program and Kentucky’s official clearinghouse for Census data. The last county level projections issued by the KSDC were completed in 2016 and project to 2040. The KSDC’s projections for Fayette County are presented in Table 9.1.
Table 9.1 Kentucky State Data Center Population Projections, Fayette County
2010 Census
2015 Estimate
2020 Projection
2025 Projection
2030 Projection
2035 Projection
2040 Projection
Total Population 295,803 314,488 333,580 354,318 375,637 397,513 419,813Population in Households 282,999 301,520 320,356 340,832 361,882 383,485 405,506Total Households 123,043 131,750 141,235 150,978 161,356 171,789 182,417Source: Kentucky State Data Center
The most recent U.S. Census American Community Survey (ACS) in 2019 provided new estimates and it is notable that the 2019 total population estimate for Fayette County is 323,152 and the total household estimate is 129,784, more than 10,000 lower than KSDC’s 2020 projection for both metrics. County level population estimates from the 2020 Census will be available in the near future, which will then serve as the definitive estimates. Until then, this disparity between the KSDC and ASC offers an opportunity to create conservative and full ranges for future household projections, with the KSDC’s projections as the high bound of the range and the most recent 10-year county estimates (2010 Census and 2019 ACS) representing the lower bound of the range.
As households ultimately serve as the proxy for occupied housing units, it is possible to simply subtract the future KSDC projection from the 2020 projection to establish the high bound number of new households that will need to be accommodated in the future. For example, based on KSDC’s 2040 projection, a total of 41,182 additional households will need to be accommodated in 2040. Given that LFUCG used these KSDC projections for its analysis, a similar number of households was also assumed for the Imagine Lexington plan.
As reported in Chapter 2, population growth in Fayette County and the surrounding region was stronger in the period between 2000 and 2010 than is has been in the past decade. While many factors may have contributed to the recent slower growth, including lingering effects of the housing downturn or the increasing challenge of acquiring land and developing new housing inside the USB,

EXISTING CONDITIONS AND GROWTH TRENDS REPORT
Population Growth trends
94
this recent trend is apparent throughout the region and the state. As depicted in Table 9.2, the compound annual population growth in Fayette County since 2010 is consistent with the region and Madison and Jessamine counties. Only Scott County has a higher growth rate, and even it has lowered significantly from the first decade of the millennium. For this reason, using the population growth rate for Fayette County from 2010 to 2019 provides a defensible lower bound for future population growth. According to this rate of 0.99%, Fayette County will need to accommodate 29,742 new households by 2040.
Table 9.2 Growth Rate Comparison of Population by County
Table 9.3 20 Year Household Growth Trendlines
0.0%0.5%1.0%1.5%2.0%2.5%3.0%3.5%4.0%
Compound Annual Growth Comparison
2000-2010 CAGR 2000-2019 CAGR 2010-2019 CAGR
0
5,000
10,000
15,000
20,000
25,000
30,000
35,000
40,000
45,000
2021
2022
2023
2024
2025
2026
2027
2028
2029
2030
2031
2032
2033
2034
2035
2036
2037
2038
2039
2040
20 Year Household Growth Trendlines
Conservative Full

EXISTING CONDITIONS AND GROWTH TRENDS REPORT
Commercial Growth Trends
95
10.0 COMMERCIAL GROWTH TRENDS
10.1 INDUSTRIAL GROWTH TRENDS
10.1.1 Considerations Moving Forward
Industrial development has slowed over the past decade in Fayette County. 2000 to 2006 saw inventory grow by 4.7 million square feet, while 2007 to 2020 experienced 840,225 square feet of inventory growth. Not only has there been significantly less new industrial development occurring, but inventory in certain years decreased due to demolition of obsolete product. The Downtown Lexington submarket experienced negative inventory growth between 2007 to 2020 as certain sites transitioned into other uses.
This slowdown of new industrial inventory in Fayette County over the past decade has likely occurred due to multiple reasons. This includes:
• A reduction of readily available and low-cost industrial land.
• Prominence of Louisville and Cincinnati as major industrial growth nodes.
• Reduction in manufacturing employment.
• Logistics and E Commerce Fulfillment acting as the primary growth typology for industrial space – Louisville and Cincinnati/Northern Kentucky are the logistic hubs for the region. Economic analysis demonstrates that the Transportation & Warehousing sector has grown faster in Fayette County than the U.S. average, however this sector is still much smaller than the aforementioned Metro areas.
Real estate experts are predicting that industrial will be one of the top real estate investments moving forward, especially when product is geared towards e-commerce. Tight vacancy rates, increasing rental growth rates, along with a resilient industrial real estate sector demonstrates strong opportunities for Fayette County moving forward. Pent up demand for new and modern industrial product can allow Fayette County to grow its industrial base and capitalize on strong market fundamentals if well-located and serviced industrial land is available for development at appropriate price points.
10.1.2 Trendline Analysis
Conservative and Full Trendlines project 20-year demand between 1.3 million square feet and 5.6 million square feet of new industrial space in Fayette County. This translates between 65,000 square feet to 278,000 square feet on an annual basis. Based on the current metrics of Lexington’s industrial market and the opportunities for growth moving forward, it is feasible for Lexington to

EXISTING CONDITIONS AND GROWTH TRENDS REPORT
Commercial Growth Trends
96
target the moderate growth scenario. Collaborative partnerships between economic development, landowners, and industrial developers are required to target specific sectors and end-user tenants and make the moderate scenario a reality.
Source: MXD Development Strategists
Figure 10.1 20 Year Industrial Growth Trendline for Fayette County (Cumulative SF)
10.2 OFFICE GROWTH TRENDS
10.2.1 Considerations Moving Forward
The office market continues to face challenges due to the fallout of the Covid-19 pandemic. Limited new development in recent years has demonstrated that office does not have similar investment potential in Fayette County in comparison to the industrial or residential asset classes. Only 1.8 million square feet of new office inventory has come online over the past 15 years, however vacancy rates have continually stayed above 7%. The Location Quotient for Fayette County in the Economic Analysis demonstrates that office-based used such as “Professional Technical & Scientific”, “Finance & Insurance”, “Government” and “Information” have not grown considerably compared to the national average. These economic sectors drivers are for new office space and Fayette County has fallen behind according to U.S. Census data.
Vacancy rates will need to decrease, and rent will need to stabilize or show future growth to demonstrate investment potential for commercial developers. Shifts in how and where people work
0
1,000,000
2,000,000
3,000,000
4,000,000
5,000,000
6,000,000
2021
2022
2023
2024
2025
2026
2027
2028
2029
2030
2031
2032
2033
2034
2035
2036
2037
2038
2039
2040
20 Year Industrial Growth Trendline (Cumulative SF)
Conservative Full

EXISTING CONDITIONS AND GROWTH TRENDS REPORT
Commercial Growth Trends
97
that have emerged from the pandemic will also need to be considered moving forward. Companies may consider downsizing office operations or limit office expansion as certain employees work from home or on flex schedules. These are considerations that will likely impact future demand and absorption in the Lexington market, especially in the next several years.
10.2.2 Trendline Analysis
Conservative and Full Trendlines project 20-year demand between 2.5 million square feet and 4.6 million square feet of new office space in Fayette County. This translates between 123,000 square feet to 231,000 square feet on an annual basis. Based on the current metrics of Lexington’s office market and the relative slow growth of office-centric economic sectors, it is feasible for Lexington to target the conservative growth scenario. A move to a moderate growth scenario will require vacancy rates to decrease and constrain supply, and growth in office-centric sectors that will generate demand.
Source: MXD Development Strategists
Figure 10.2 20 Year Office Growth Trendline for Fayette County (Cumulative SF)
10.3 RETAIL GROWTH TRENDS
10.3.1 Considerations Moving Forward
Market experts state that retail may be the hardest hit real estate asset class due to the Covid-19 pandemic, however Fayette County has been able maintain stability across most typologies.
0500,000
1,000,0001,500,0002,000,0002,500,0003,000,0003,500,0004,000,0004,500,0005,000,000
2021
2022
2023
2024
2025
2026
2027
2028
2029
2030
2031
2032
2033
2034
2035
2036
2037
2038
2039
2040
20 Year Office Growth Trendline (Cumulative SF)
Conservative Full
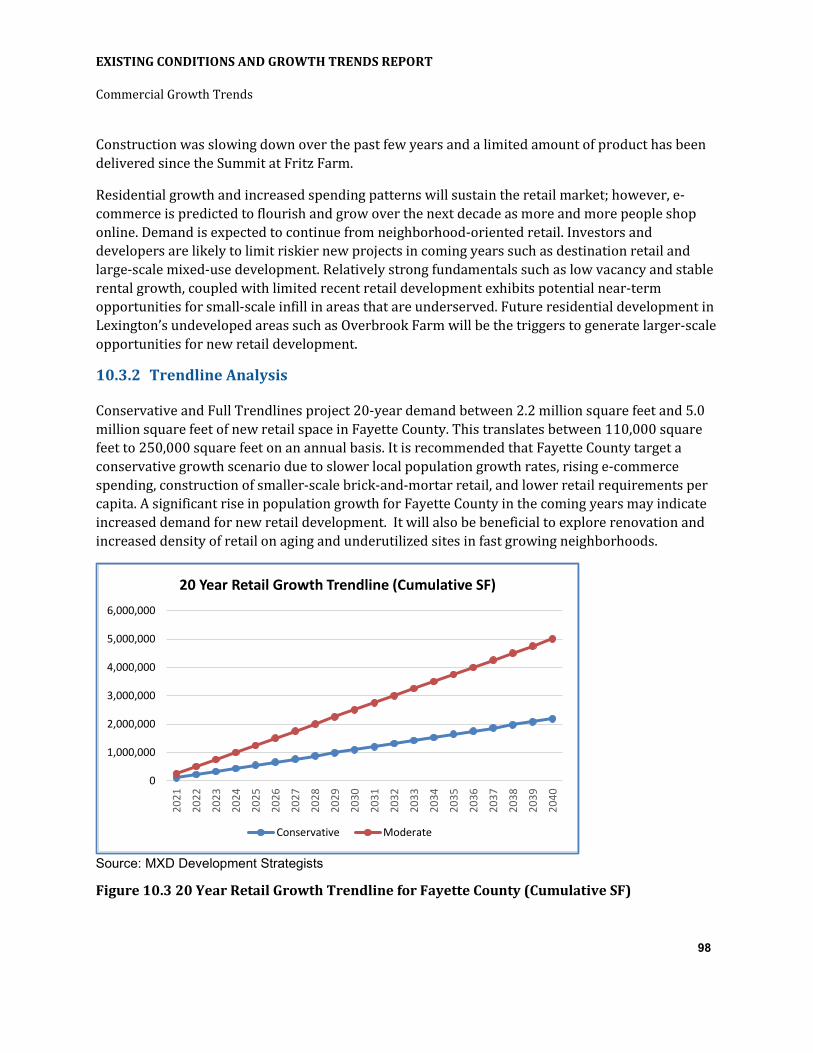
EXISTING CONDITIONS AND GROWTH TRENDS REPORT
Commercial Growth Trends
98
Construction was slowing down over the past few years and a limited amount of product has been delivered since the Summit at Fritz Farm.
Residential growth and increased spending patterns will sustain the retail market; however, e-commerce is predicted to flourish and grow over the next decade as more and more people shop online. Demand is expected to continue from neighborhood-oriented retail. Investors and developers are likely to limit riskier new projects in coming years such as destination retail and large-scale mixed-use development. Relatively strong fundamentals such as low vacancy and stable rental growth, coupled with limited recent retail development exhibits potential near-term opportunities for small-scale infill in areas that are underserved. Future residential development in Lexington’s undeveloped areas such as Overbrook Farm will be the triggers to generate larger-scale opportunities for new retail development.
10.3.2 Trendline Analysis
Conservative and Full Trendlines project 20-year demand between 2.2 million square feet and 5.0 million square feet of new retail space in Fayette County. This translates between 110,000 square feet to 250,000 square feet on an annual basis. It is recommended that Fayette County target a conservative growth scenario due to slower local population growth rates, rising e-commerce spending, construction of smaller-scale brick-and-mortar retail, and lower retail requirements per capita. A significant rise in population growth for Fayette County in the coming years may indicate increased demand for new retail development. It will also be beneficial to explore renovation and increased density of retail on aging and underutilized sites in fast growing neighborhoods.
Source: MXD Development Strategists
Figure 10.3 20 Year Retail Growth Trendline for Fayette County (Cumulative SF)
0
1,000,000
2,000,000
3,000,000
4,000,000
5,000,000
6,000,000
2021
2022
2023
2024
2025
2026
2027
2028
2029
2030
2031
2032
2033
2034
2035
2036
2037
2038
2039
2040
20 Year Retail Growth Trendline (Cumulative SF)
Conservative Moderate