Embed Size (px)
Citation preview

1
slide 0
Chapter 2
The Data of Macroeconomics

2
slide 1
Learning Objectives
In this chapter, you will learn about:
• Gross Domestic Product (GDP)
• the Consumer Price Index (CPI)
• the Unemployment Rate
3
slide 2
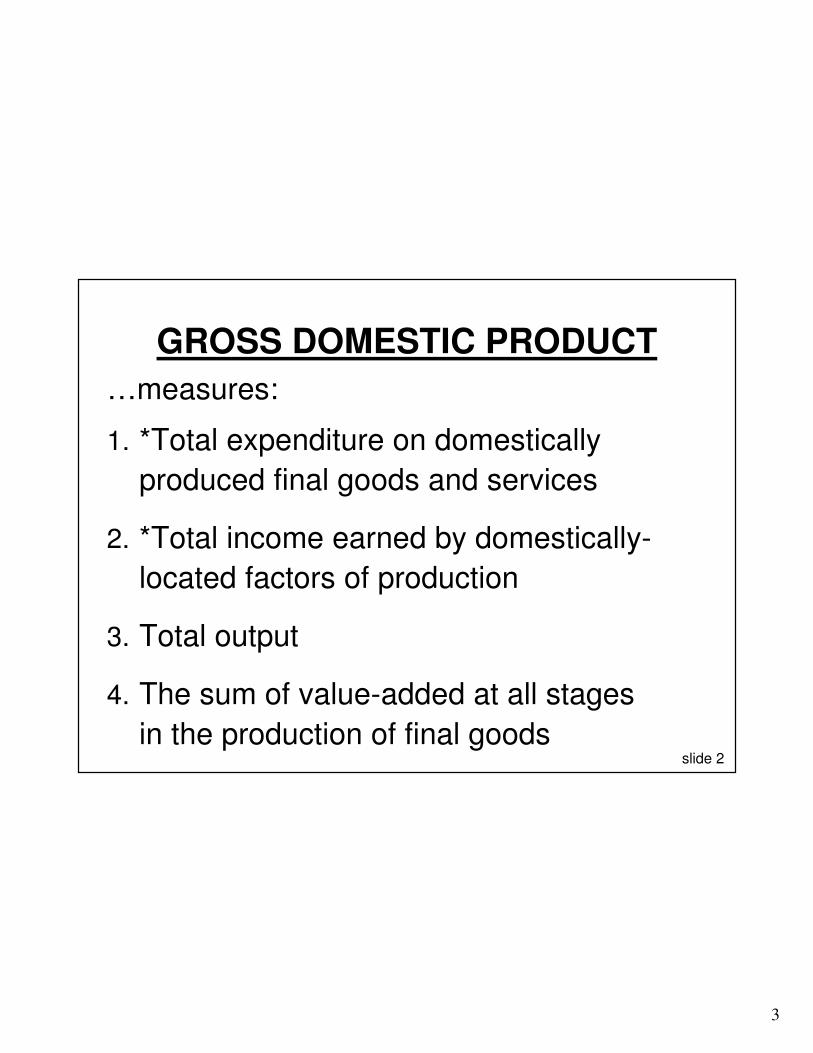
GROSS DOMESTIC PRODUCT
…measures:
1. *Total expenditure on domestically
produced final goods and services
2. *Total income earned by domestically-
located factors of production
3. Total output
4. The sum of value-added at all stages
in the production of final goods

4
slide 3
Why expenditure = income
In every transaction, In every transaction,
the buyerthe buyer’’s expenditure becomes s expenditure becomes
the sellerthe seller’’s income.s income.
Thus, the sum of all expenditure Thus, the sum of all expenditure
equals equals
the sum of all income.the sum of all income.

5
slide 4
The Circular Flow
Income ($ )
Labor
Goods (bread )
Expenditure ($ )
Households Firms
6
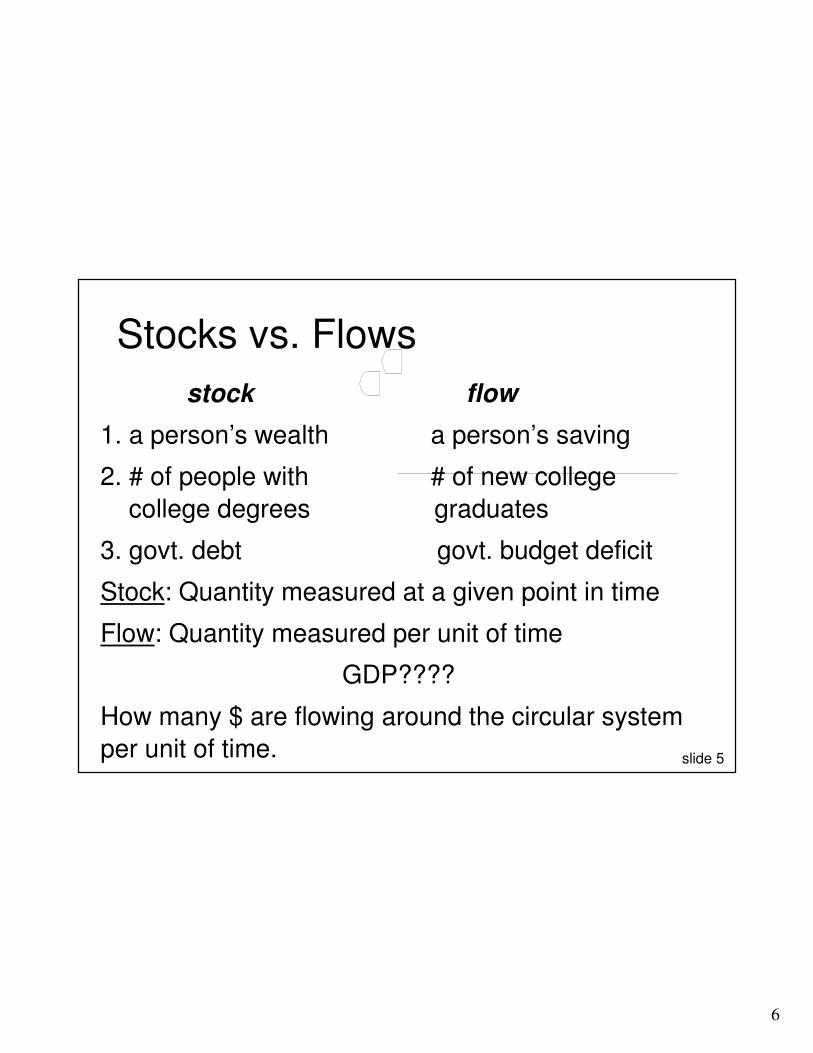
slide 5
Stocks vs. Flows
stock flow
1. a person’s wealth a person’s saving
2. # of people with # of new college
college degrees graduates
3. govt. debt govt. budget deficit
Stock: Quantity measured at a given point in time
Flow: Quantity measured per unit of time
GDP????
How many $ are flowing around the circular system
per unit of time.

7
slide 6
What if number of goods produced>1?
1. Adding apples and oranges: different products have different values �use market prices because they reflect willingness to pay
2. Used goods are NOT included in GDP(GDP measures flow, sales of used goods is a transfer of assets, i.e. stocks)
3. Inventories are seen as purchases of the firms� increase GDP at the time accumulated
What happens when they are sold?

8
slide 7
What if number of goods produced>1?
4. Value of intermediate goods (goods that are used in the production of other goods) is included as part of the market price of the final goods � GDP = value of final goods produced
5. Alternatively, a firm’s value added is TV(output)-TV(intermediate goods)
6. Housing services and imputations
(homework)

9
slide 8
What if number of goods produced>1?
• GDP = value of final goods produced
= sum of value added at all stages
of production

10
slide 9
Allocation of GDP
The Expenditure Components of GDP
• consumption
• investment
• government spending
• net exports

11
slide 10
1. Consumption (C)
Includes:• durable goods
last a long time ex: cars, home appliances
• non-durable goods
last a short time ex: food, clothing
• services
work done for consumers ex: dry cleaning, air travel.
Def: the value of all goods and services bought by households.

12
slide 11
U.S. Consumption, 2001
$ billions
% of GDP
Consumption $7,064.5 69.2%
Durables 858.3 8.4
Nondurables 2,055.1 20.1
Services 4,151.1 40.7
$ billions
% of GDP
Consumption $7,064.5 69.2%
Durables 858.3 8.4
Nondurables 2,055.1 20.1
Services 4,151.1 40.7

13
slide 12
2. Investment (I)Def1: spending on [the factor of production] capital.
Def2: spending on goods bought for future use.
Includes:
� business fixed investmentspending on plant and equipment that firms will use to produce other goods & services
� residential fixed investmentspending on housing units by consumers and landlords
� inventory investmentthe change in the value of all firms’ inventories

14
slide 13
U.S. Investment, 2001
$ billions
% of GDP
Investment $1,633.9 16.0%
Business fixed 1,246.0 12.2
Residential fixed 446.3 4.4
Inventory -58.4 -0.6
$ billions
% of GDP
Investment $1,633.9 16.0%
Business fixed 1,246.0 12.2
Residential fixed 446.3 4.4
Inventory -58.4 -0.6

15
slide 14
3. Government spending (G)
• G includes all government spending on goods and services.
• G excludes transfer payments (e.g. unemployment insurance payments), because they do not represent spending on goods and services.

16
slide 15
Government spending, 2001
$ billions
% of GDP
Gov spending $1,839.5 18.0%
Federal 615.7 6.0
Non-defense 216.6 2.1
Defense 399.0 3.9
State & local 1,223.8 12.0
$ billions
% of GDP
Gov spending $1,839.5 18.0%
Federal 615.7 6.0
Non-defense 216.6 2.1
Defense 399.0 3.9
State & local 1,223.8 12.0

17
slide 16
4. Net exports (NX = EX - IM)
Def: the value of total exports (EX) minus the value of total imports (IM)
U.S. Net Exports, 1960-2000
-400
-350
-300
-250
-200
-150
-100
-50
0
50
1960 1965 1970 1975 1980 1985 1990 1995 2000
$ b
illio
ns

18
slide 17
An Important Identity!!!
Y = C + I + G + NX
where Y = GDP = the value of total output
C + I + G + NX = aggregate expenditure
19
slide 18
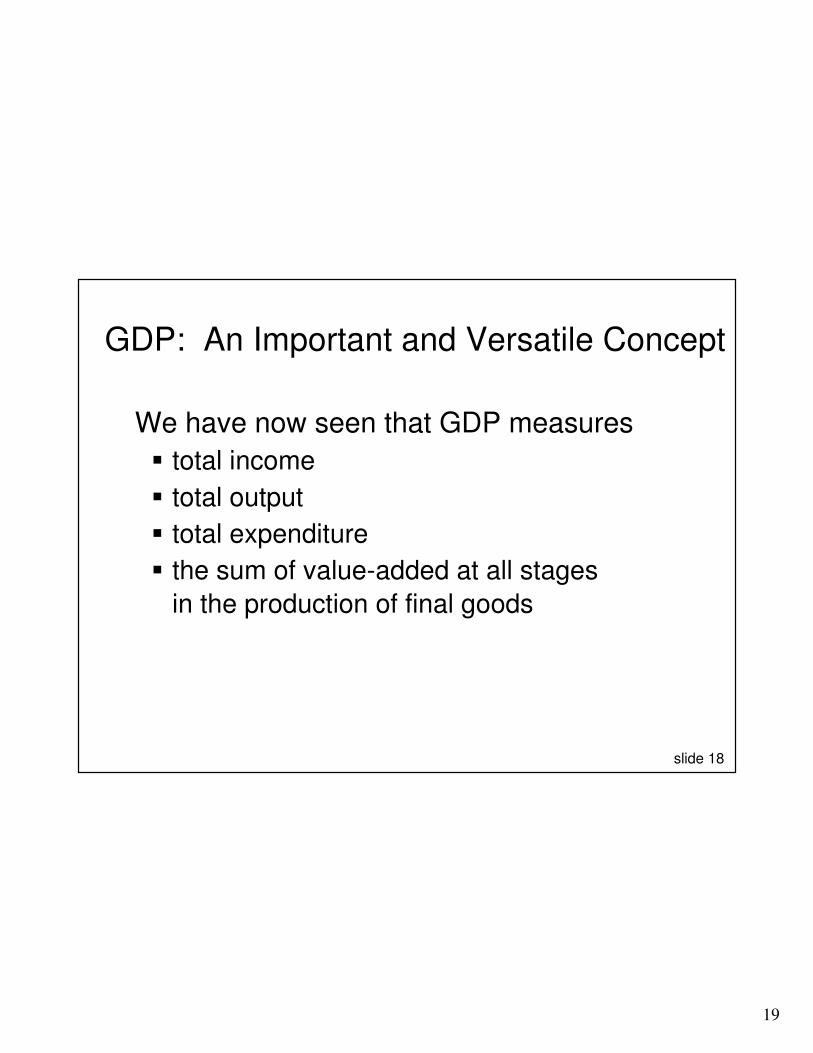
GDP: An Important and Versatile Concept
We have now seen that GDP measures
� total income
� total output
� total expenditure
� the sum of value-added at all stages
in the production of final goods
20
slide 19
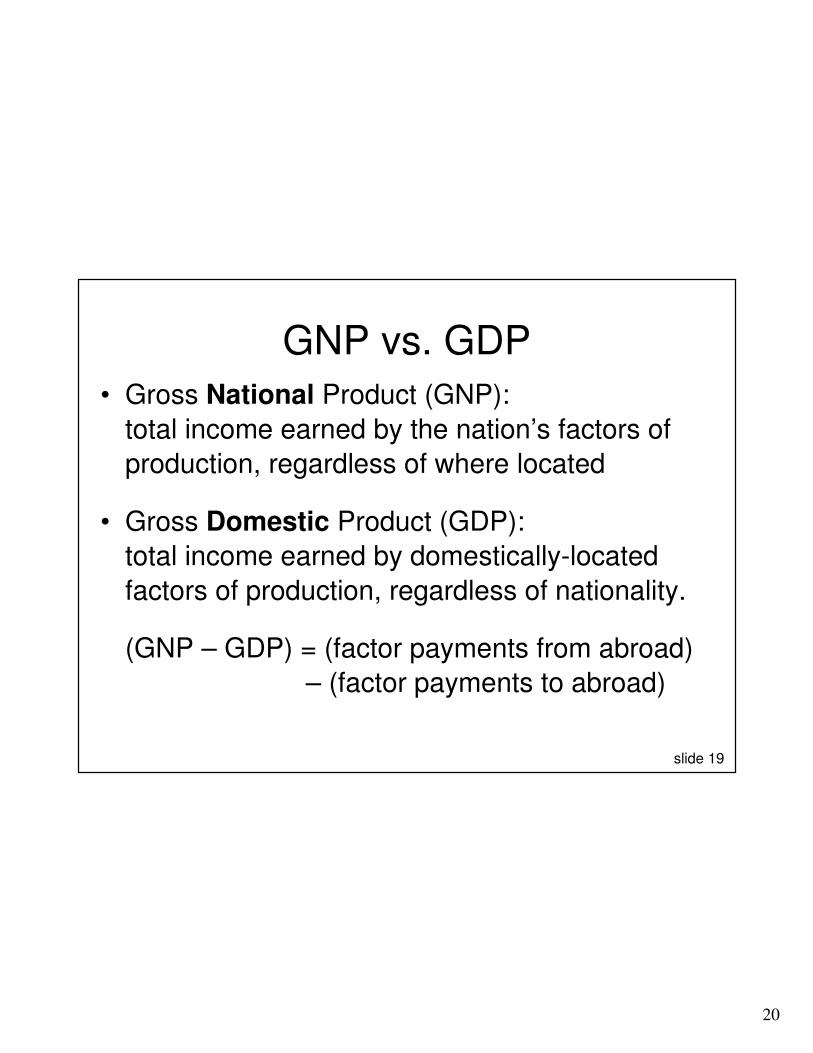
GNP vs. GDP• Gross National Product (GNP):
total income earned by the nation’s factors of
production, regardless of where located
• Gross Domestic Product (GDP):
total income earned by domestically-located
factors of production, regardless of nationality.
(GNP – GDP) = (factor payments from abroad)
– (factor payments to abroad)

21
slide 20
Real vs. Nominal GDP
• GDP is the value of all final goods and services produced.
• Nominal GDP measures these values using current prices.
NGDP2003=∑(P03i*Q03i)
• Real GDP measure these values using the prices of a base year.
RGDP2003=∑(P02i*Q03i)

22
slide 21
Real GDP controls for inflation
Changes in nominal GDP can be due to:
� changes in prices
� changes in quantities of output produced
Changes in real GDP can only be due to changes in quantities, because real GDP is constructed using constant base-year prices.

23
slide 22
GDP Deflator
• The inflation rate is the percentage increase in the overall level of prices.
• One measure of the price level is the GDP Deflator, defined as
Nominal GDPGDP deflator = 100
Real GDP×
24
slide 23
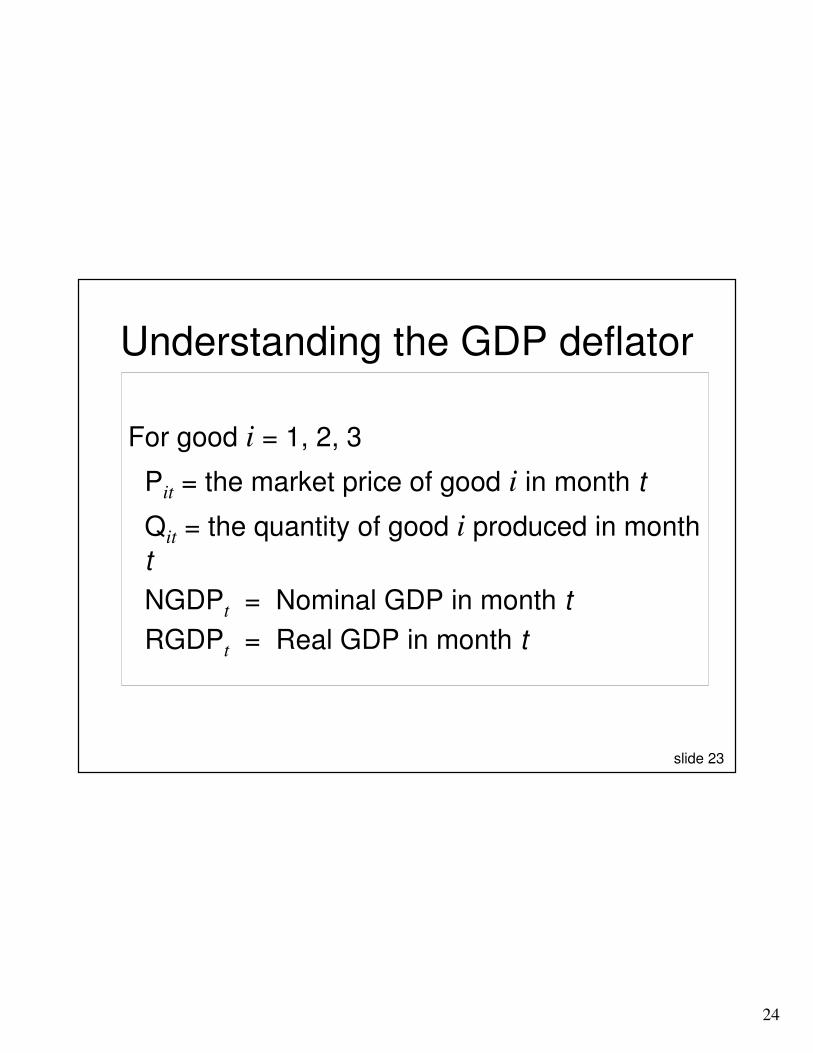
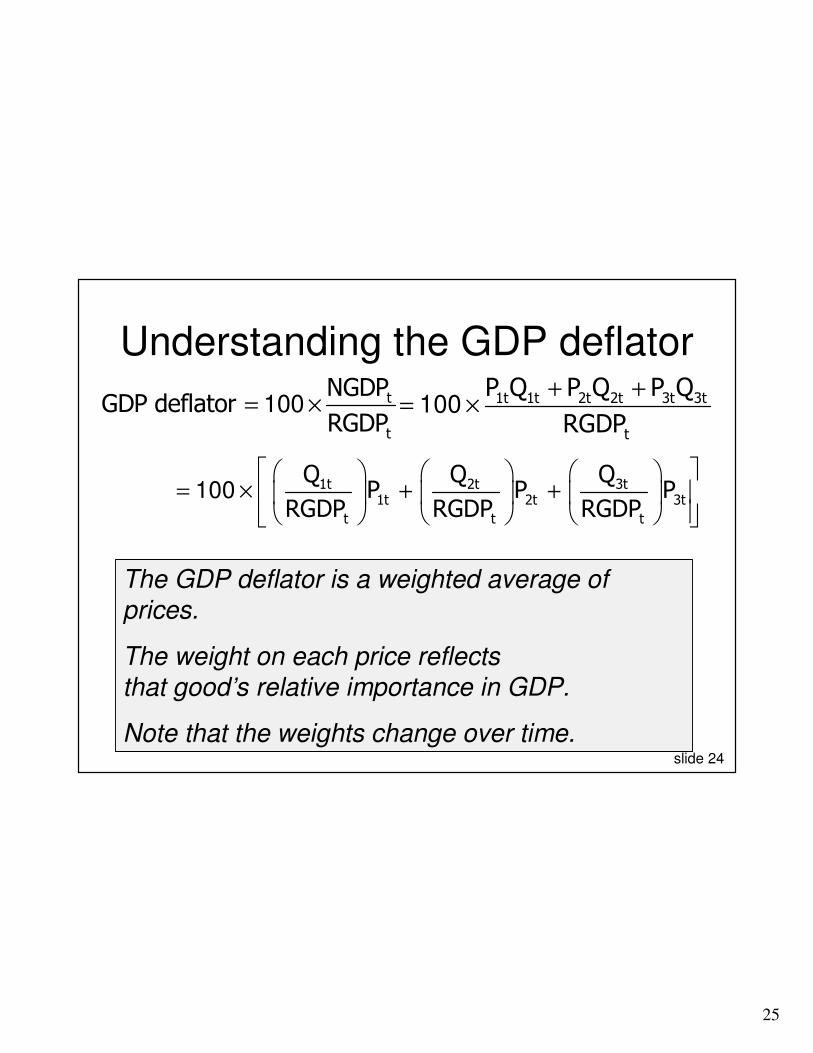
Understanding the GDP deflator
For good i = 1, 2, 3
Pit = the market price of good i in month t
Qit = the quantity of good i produced in month
t
NGDPt = Nominal GDP in month t
RGDPt = Real GDP in month t
25
slide 24
Understanding the GDP deflatort
t
NGDPGDP deflator
RGDP= ×100 1t 1t 2t 2t 3t 3t
t
P Q P Q P Q
RGDP
+ += ×100
1t 2t 3t1t 2t 3t
t t t
Q Q QP P P
RGDP RGDP RGDP
= × + +
100
The GDP deflator is a weighted average of prices.
The weight on each price reflects
that good’s relative importance in GDP.
Note that the weights change over time.

26
slide 25
Understanding the GDP deflator
• Nominal GDP measures the current $ value of the output of the economy.
• Real GDP measures output valued at constant prices.
• GDP deflator measures the price of output relative to its price in the base year.
e.g. 1 good case
GDPdeflator=(Pt*Qt)\(Pt-1*Qt)=(Pt/Pt-1)

27
slide 26
CONSUMER PRICE INDEX (CPI)• A measure of the overall level of prices
• Published by the Bureau of Labor Statistics (BLS)
• Used to – track changes in the typical household’s
cost of living– allow comparisons of dollar figures from
different years
• Tells us how much it costs now to buy X relative to how much it cost to buy it in the base year

28
slide 27
How the BLS constructs the CPI1. Survey consumers to determine
composition of the typical consumer’s “basket” of goods. (e.g. 5 apples, 2 oranges etc)
2. Every month, collect data on prices of all items in the basket; compute cost of basket
3. CPI in any month equals
Cost of basket in that month100
Cost of basket in base period×

29
slide 28
Understanding the CPI
For good i = 1, 2, 3
Ci = amount of good i in the CPI’s basket
Pit = price of good i in month t
Et = cost of the CPI basket in month t
Eb = cost of the basket in the base period

30
slide 29
Understanding the CPIt
b
ECPI in month
E= ×100t 1t 1 2t 2 3t 3
b
P C + P C + P C
E= ×100
31 21t 2t 3t
b b b
CC CP P P
E E E
= × + +
100
The CPI is a weighted average of prices.
The weight on each price reflects that good’s relative importance in the CPI’s basket.
Note that the weights remain fixed over time.

31
slide 30
CPI vs. GDP Deflator1.prices of capital goods
• included in GDP deflator (if produced domestically)
• excluded from CPI
2. prices of imported consumer goods
• included in CPI
• excluded from GDP deflator
3. the basket of goods
• CPI: fixed
• GDP deflator: changes every year

32
slide 31
Fixed versus Changing Weights
e.g. Major frosts destroy nation’s X crop.
• Q(X) produced falls to zero
• P(remaining X) increases significantly
�Fixed weights overstate the impact because it doesn’t take into account the subtutability of goods
31 21t 2t 3t
b b b
CC CP P P
E E E
= × + +
100

33
slide 32
Fixed versus Changing Weights
�Changing weights understate the impact because it doesn’t take into account the possible loss of welfare due to substitution
1t 2t 3t1t 2t 3t
t t t
Q Q QP P P
RGDP RGDP RGDP
= × + +
100
34
slide 33
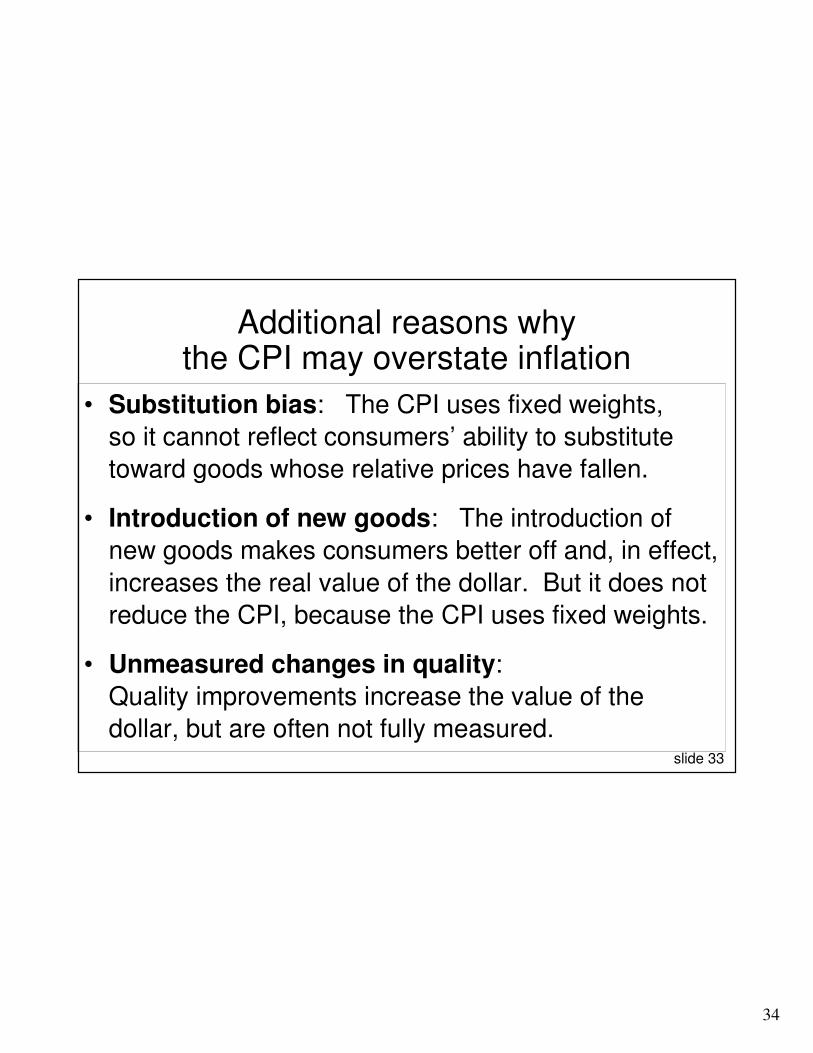
Additional reasons why the CPI may overstate inflation
• Substitution bias: The CPI uses fixed weights,
so it cannot reflect consumers’ ability to substitute
toward goods whose relative prices have fallen.
• Introduction of new goods: The introduction of
new goods makes consumers better off and, in effect,
increases the real value of the dollar. But it does not
reduce the CPI, because the CPI uses fixed weights.
• Unmeasured changes in quality:
Quality improvements increase the value of the
dollar, but are often not fully measured.

35
slide 34
The CPI’s bias
• The Boskin Panel’s “best estimate”:
The CPI overstates the true increase in the
cost of living by 1.1% per year.
• Result: the BLS has refined the way it
calculates the CPI to reduce the bias.
• It is now believed that the CPI’s bias is
slightly less than 1% per year.

36
slide 35
CATEGORIES OF THE POPULATION
• employed
working at a paid job
• unemployed
not employed but looking for a job
• labor force
the amount of labor available for producing goods and services; all employed plus unemployed persons
• not in the labor force
not employed, not looking for work.

37
slide 36
Two important labor force concepts
• unemployment rate
percentage of the labor force that is unemployed
UR=[N(unemployed)/Labor Force]*100
• labor force participation rate
the fraction of the adult population that ‘participates’ in the labor force
LFR=[Labor Force/Adult Population]*100

38
slide 37
• Employed workers help produce GDP, while
unemployed workers do not. So one would
expect a negative relationship between
unemployment and real GDP.
• This relationship is clear in the data
%Change in RGDP=3%-(2*%Change in Unemployment)
Okun’s Law

39
slide 38
Chapter Summary1. Gross Domestic Product (GDP) measures both
total income and total expenditure on the
economy’s output of goods & services.
2. Nominal GDP values output at current prices;
real GDP values output at constant prices.
Changes in output affect both measures, but
changes in prices only affect nominal GDP.
3. GDP is the sum of consumption, investment,
government purchases, and net exports.
40
slide 39
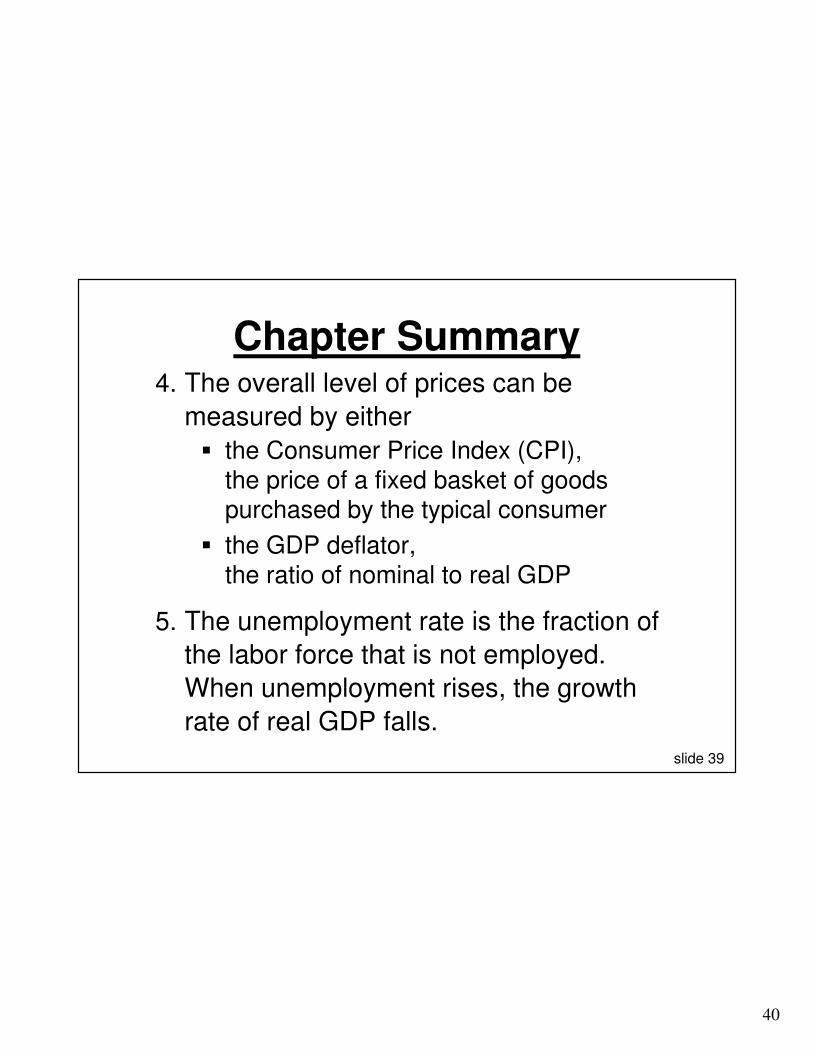
Chapter Summary4. The overall level of prices can be
measured by either
� the Consumer Price Index (CPI), the price of a fixed basket of goods purchased by the typical consumer
� the GDP deflator, the ratio of nominal to real GDP
5. The unemployment rate is the fraction of
the labor force that is not employed.
When unemployment rises, the growth
rate of real GDP falls.