Embed Size (px)
Citation preview
The Pacific Journal of Science and Technology –182– http://www.akamaiuniversity.us/PJST.htm Volume 14. Number 2. November 2013 (Fall)
A Comparative Analysis of Four Deterministic Compartmental Mathematical Models for Controlling the Spread of Tuberculosis in Nigeria.
Abdullah Idris Enagi, Ph.D.
Department of Mathematics and Statistics, Federal University of Technology, Minna, Nigeria.
E-mail: [email protected]
ABSTRACT In this research, we carried out a comparative analysis of four published deterministic mathematical models for controlling the spread of tuberculosis in Nigeria. Our models were: Model One (A Deterministic Compartmental Model of Tuberculosis Control Strategy Adopted by the National Tuberculosis and Leprosy Control Programme in Nigeria), Model Two (Preventing Mother to Child transmission of Tuberculosis Using Bacillus Calmatte - Guerine Vaccine: A Deterministic Modelling Approach.) , Model Three (A Mathematical Model of Effect of Bacillus Calmette-Guerin Vaccine and Isoniazid Preventive Therapy in Controlling the spread of Tuberculosis in Nigeria) and Model Four (Modelling the Effect of Anti-retroviral Therapy and Latent Tuberculosis Treatment in Controlling the Spread of Tuberculosis in Nigeria.). The four models described by systems of ordinary differential equations were converted in to difference equations using Euler’s Numerical method. The resulting difference equations were coded using visual basic programming language into software which produced the required results in graphical forms. Model three turned out to be the best model out of the four models to be adopted in order to ensure that Tuberculosis be completely eradicated from Nigeria within the next one and halve decades.
(Keywords: mathematical models, tuberculosis control,
numerical simulations, total eradication,)
INTRODUCTION With the increasing reported cases of Tuberculosis in Nigeria which is further compounded by high National HIV prevalence of 4.4%, Tuberculosis was declared an emergency in Nigeria and the Stop TB strategy for the control of TB in Nigeria was adopted to reduce the
prevalence of Tuberculosis to a level at which the disease no longer constitute public health problems in the country with the goal to reduce, significantly, the burden of TB by 2015 in line with the Millennium Development Goals (MDG) and the STOP TB Partnership targets. Among the strategies to be adopted to achieve these goals is addressing TB/HIV, MDR-TB and Other Challenges and promotion of research Kabir (2008). Efforts have been made in the past to use Mathematical models to predict the effect of HIV/AIDS on Tuberculosis, this includes Okyere(2007) who proposed a deterministic compartmental models of HIV and TB, but this model did not take into account that latently infected individual can recover without progressing to infectious class, He also stated that Successfully treated Infectious individuals move back to slow rate Latent class this is not also realistic, this happens when re infection occurs else they move into recovered class. Yusuf (2008) also proposed a deterministic compartmental model but ignored the different rates of progression from latent to infectious class, this however precludes the speedy progression of TB caused by HIV infections. By weakening the immune system of a TB patient, HIV acts as catalyst in the progression of TB from latent class to infectious class. A patient with AIDS who become infected with mycobacterium tuberculosis has a 50% chance of developing active tuberculosis within 2 months and a 5 to 10% chance of developing active disease thereafter, infants and young children are also more likely to develop active TB than older people since their immune system are not yet well developed (WHO report 2003).
The Pacific Journal of Science and Technology –183– http://www.akamaiuniversity.us/PJST.htm Volume 14. Number 2. November 2013 (Fall)
Hughes et al. (2006) established that progression to active TB is said to be rapid if it occurs within 5 years after infection. The same paper also stated that 14% of HIV negative people or early HIV positive people develop active TB within these five years after which the progression is slow which is 0.001/year. Also 67% of people who are in their late stage of HIV develop TB within 5 years, after that the progression is slow, 0.1/year Hughes et al. (2006). Enagi (2011), Enagi and Ibrahim (2011a), Enagi and Ibrahim (2011b), and Enagi (2013) presented four new deterministic compartmental mathematical models for the dynamics of tuberculosis taking into consideration the effect of HIV/AIDS on immune system and administration of BCG vaccines as immunity against infection. In this study, we developed a software using Visual Basic Version 6 to carry out comparative analysis of Enagi (2011), Enagi and Ibrahim (2011a), Enagi and Ibrahim (2011b), and Enagi (2013) to determine the most efficient model for eradicating Tuberculosis from Nigeria. MATERIALS AND METHODS Model Equations The four deterministic models were represented by the following systems of ordinary differential equations. Model One
SSIdt
dS (1)
LSIdt
dL)( (2)
ILdt
dI)( (3)
RIdt
dR (4)
(Enagi, 2013)
Model Two
Mdt
dM)( (5)
SSIMdt
dS )1( (6)
ISIdt
dI)( (7)
RIdt
dR (8)
(2011b)
Model Three
Mdt
dM)( (9)
SSIMdt
dS )1( (10)
LSIdt
dL)( (11)
ILdt
dI)( (12)
RILdt
dR (13)
(2011a)
Model Four
ILLISSdt
dSFS (14)
SS LIS
dt
dL)( (15)
FSF LLIS
dt
dL)()1( (16)
The Pacific Journal of Science and Technology –184– http://www.akamaiuniversity.us/PJST.htm Volume 14. Number 2. November 2013 (Fall)
ILdt
dIF )( (17)
(Enagi , 2011) The model parameters and variables used throughout this study are given below with their respective descriptions: M(t) :- Immuned compartment at time t. S(t) :- Susceptible compartment at time t. L(t):- Latent compartment at time R(t):- Recovered compartment at time Ls(t) :- Latent compartment with slow progression rate to infectious class at time t. LF(t) :- Latent compartment with fast progression rate to infectious class at time t. I (t): - Infectious compartment at time t.
:- Recruitment rate.
:- Natural death rate.
:- Removal rate from Immune compartment into
Susceptible compartment at time t.
:- Tuberculosis instantaneous incidence rate per
Susceptible.
:- proportion of infection instantaneous incidence
rate with slow progression rate to infectious TB.
:- Movement rate from Latent class with slow
progression rate to Latent class with fast progression rate.
:- Movement rate from Latent class to
infectious class. :- Movement rate from Latent class with fast
progression rate to infectious class.
:- Tuberculosis induced death rate
:- Recovery rate of Ls(t).
:- Recovery rate of LF(t).
- Recovery rate of I(t).
:- Recovery rate of L(t).
Numerical Solutions The system of equations in each of the four models where converted into difference equations using Euler’s numerical method with step size h=1 .
Model One Using Euler’s Numerical Method, (Stroud, 2011). From (1):
)()()()( tStItStS
)()()( tShtShtS
)]()()([)()( tStItShtShtS
With h=1, we have
)()()()()1( tStItStStS
Similarly,
From (2)
)()()()()( tLtItStL
)()()()()()1( tLtItStLtL
From (3)
)()()()( tItLtI
)()()()()1( tItLtItI
From (4)
)()()( tRtItR
)()()()1( tRtItRtR
The Pacific Journal of Science and Technology –185– http://www.akamaiuniversity.us/PJST.htm Volume 14. Number 2. November 2013 (Fall)
Model Two From (5):
)()()( tMtM
)()()()1( tMtMtM
From (6):
)()()()()1()( tStItStMtS
)()()()()1()()1( tStItStMtStS
From (7):
)()()()()( tItItStI
)()()()()()1( tItItStItI
From (8):
)()()( tRtItR
)()()()1( tRtItRtR
Model Three From (9):
)()()( tMtM
)()()()1( tMtMtM
From (10):
)()()()()1()( tStItStMtS
)()()()()1()()1( tStItStMtStS
From (11):
)()()()()( tLtItStL
)()()()()()1( tLtItStLtL
From (12):
)()()()( tItLtI
)()()()()1( tItLtItI
From (13):
)()()()( tRtItLtR
)()()()()1( tRtItLtRtR
Model Four From (14):
)()()()()()()( tItLtLtStItStS FS
)()()()()()()()1( tItLtLtStItStStS FS
From (15):
)()()()()( tLtStItL SS
)()()()()()1( tLtStItLtL SSS
From (16):
FSF LLIStL )()1()(
FSFF LLIStLtL )()1()()1(
From (17):
)()()()( tItLtI F
)()()()()1( tItLtItI F
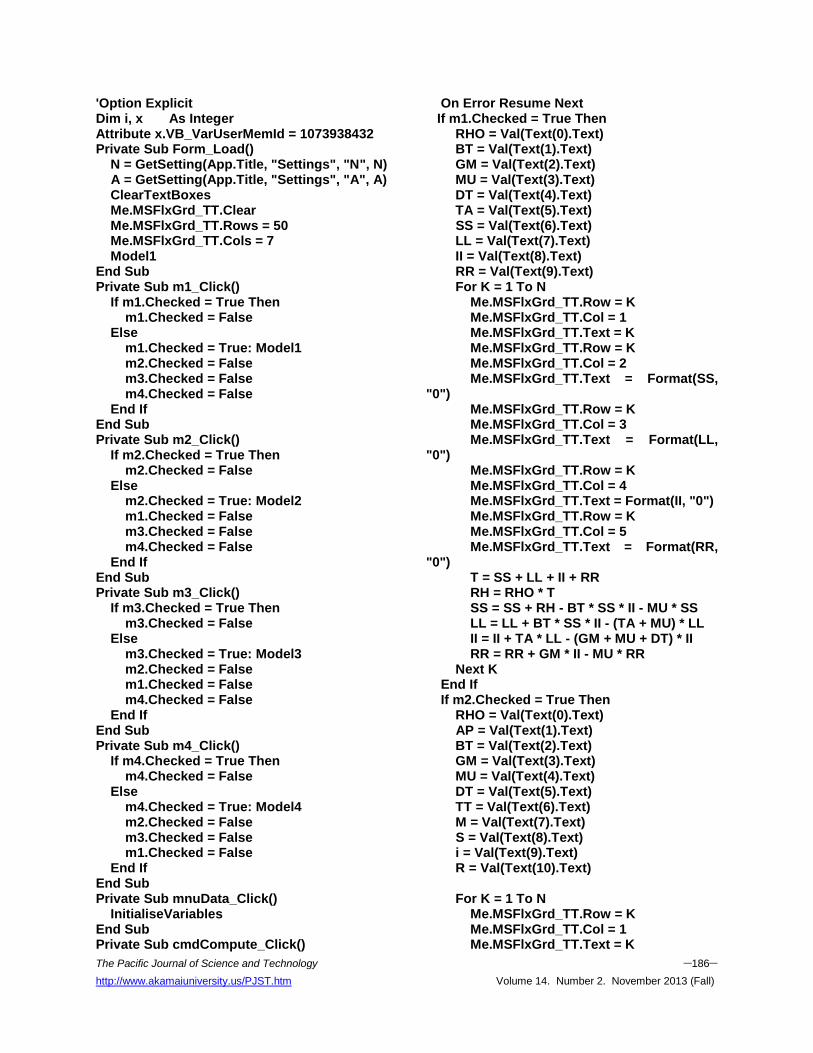
The resulting difference equations where coded using Visual Basic Version 6. Source Codes For the Software '/*************************************** '// File Name: frmMain.frm '// File Size: 33.9 KB '// File Date: 6/6/12 10:14:32 AM '// Printed On: Fri. June 9, 2013 10:15:31 AM '/***************************************
The Pacific Journal of Science and Technology –186– http://www.akamaiuniversity.us/PJST.htm Volume 14. Number 2. November 2013 (Fall)
'Option Explicit Dim i, x As Integer Attribute x.VB_VarUserMemId = 1073938432 Private Sub Form_Load() N = GetSetting(App.Title, "Settings", "N", N) A = GetSetting(App.Title, "Settings", "A", A) ClearTextBoxes Me.MSFlxGrd_TT.Clear Me.MSFlxGrd_TT.Rows = 50 Me.MSFlxGrd_TT.Cols = 7 Model1 End Sub Private Sub m1_Click() If m1.Checked = True Then m1.Checked = False Else m1.Checked = True: Model1 m2.Checked = False m3.Checked = False m4.Checked = False End If End Sub Private Sub m2_Click() If m2.Checked = True Then m2.Checked = False Else m2.Checked = True: Model2 m1.Checked = False m3.Checked = False m4.Checked = False End If End Sub Private Sub m3_Click() If m3.Checked = True Then m3.Checked = False Else m3.Checked = True: Model3 m2.Checked = False m1.Checked = False m4.Checked = False End If End Sub Private Sub m4_Click() If m4.Checked = True Then m4.Checked = False Else m4.Checked = True: Model4 m2.Checked = False m3.Checked = False m1.Checked = False End If End Sub Private Sub mnuData_Click() InitialiseVariables End Sub Private Sub cmdCompute_Click()
On Error Resume Next If m1.Checked = True Then RHO = Val(Text(0).Text) BT = Val(Text(1).Text) GM = Val(Text(2).Text) MU = Val(Text(3).Text) DT = Val(Text(4).Text) TA = Val(Text(5).Text) SS = Val(Text(6).Text) LL = Val(Text(7).Text) II = Val(Text(8).Text) RR = Val(Text(9).Text) For K = 1 To N Me.MSFlxGrd_TT.Row = K Me.MSFlxGrd_TT.Col = 1 Me.MSFlxGrd_TT.Text = K Me.MSFlxGrd_TT.Row = K Me.MSFlxGrd_TT.Col = 2 Me.MSFlxGrd_TT.Text = Format(SS, "0") Me.MSFlxGrd_TT.Row = K Me.MSFlxGrd_TT.Col = 3 Me.MSFlxGrd_TT.Text = Format(LL, "0") Me.MSFlxGrd_TT.Row = K Me.MSFlxGrd_TT.Col = 4 Me.MSFlxGrd_TT.Text = Format(II, "0") Me.MSFlxGrd_TT.Row = K Me.MSFlxGrd_TT.Col = 5 Me.MSFlxGrd_TT.Text = Format(RR, "0") T = SS + LL + II + RR RH = RHO * T SS = SS + RH - BT * SS * II - MU * SS LL = LL + BT * SS * II - (TA + MU) * LL II = II + TA * LL - (GM + MU + DT) * II RR = RR + GM * II - MU * RR Next K End If If m2.Checked = True Then RHO = Val(Text(0).Text) AP = Val(Text(1).Text) BT = Val(Text(2).Text) GM = Val(Text(3).Text) MU = Val(Text(4).Text) DT = Val(Text(5).Text) TT = Val(Text(6).Text) M = Val(Text(7).Text) S = Val(Text(8).Text) i = Val(Text(9).Text) R = Val(Text(10).Text) For K = 1 To N Me.MSFlxGrd_TT.Row = K Me.MSFlxGrd_TT.Col = 1 Me.MSFlxGrd_TT.Text = K
The Pacific Journal of Science and Technology –187– http://www.akamaiuniversity.us/PJST.htm Volume 14. Number 2. November 2013 (Fall)
Me.MSFlxGrd_TT.Row = K Me.MSFlxGrd_TT.Col = 2 Me.MSFlxGrd_TT.Text = Format(M, "0") Me.MSFlxGrd_TT.Row = K Me.MSFlxGrd_TT.Col = 3 Me.MSFlxGrd_TT.Text = Format(S, "0") Me.MSFlxGrd_TT.Row = K Me.MSFlxGrd_TT.Col = 4 Me.MSFlxGrd_TT.Text = Format(i, "0") Me.MSFlxGrd_TT.Row = K Me.MSFlxGrd_TT.Col = 5 Me.MSFlxGrd_TT.Text = Format(R, "0") T = S + L + i + R RH = RHO * T M = M + TT * RH - (AP + MU) * M S = S + (1 - TT) * RH + AP * M - BT * S * i - MU * S i = i + BT * S * i - (GM + MU + DT) * i R = R + GM * i - MU * R Next K End If If m3.Checked = True Then RHO = Val(Text(0).Text) AP = Val(Text(1).Text) BT = Val(Text(2).Text) GM = Val(Text(3).Text) MU = Val(Text(4).Text) DT = Val(Text(5).Text) TT = Val(Text(6).Text) TA = Val(Text(7).Text) SM = Val(Text(8).Text) M = Val(Text(9).Text) S = Val(Text(10).Text) L = Val(Text(11).Text) i = Val(Text(12).Text) R = Val(Text(13).Text) For K = 1 To N Me.MSFlxGrd_TT.Row = K Me.MSFlxGrd_TT.Col = 1 Me.MSFlxGrd_TT.Text = K Me.MSFlxGrd_TT.Row = K Me.MSFlxGrd_TT.Col = 2 Me.MSFlxGrd_TT.Text = Format(M, "0") Me.MSFlxGrd_TT.Row = K Me.MSFlxGrd_TT.Col = 3 Me.MSFlxGrd_TT.Text = Format(S, "0") Me.MSFlxGrd_TT.Row = K Me.MSFlxGrd_TT.Col = 4 Me.MSFlxGrd_TT.Text = Format(L, "0") Me.MSFlxGrd_TT.Row = K Me.MSFlxGrd_TT.Col = 5 Me.MSFlxGrd_TT.Text = Format(i, "0") Me.MSFlxGrd_TT.Row = K Me.MSFlxGrd_TT.Col = 6 Me.MSFlxGrd_TT.Text = Format(R, "0") T = M + S + L + i + R
RH = RHO * T M = M + TT * RH - (AP + MU) * M S = S + (1 - TT) * RH + AP * M - BT * S * i - MU * S L = L + BT * S * i - (SM + TA + MU) * L i = i + TA * L - (GM + MU + DT) * i R = R + SM * L + GM * i - MU * R Next K End If If m4.Checked = True Then RHO = Val(Text(0).Text) BT = Val(Text(1).Text) GM = Val(Text(2).Text) MU = Val(Text(3).Text) DT = Val(Text(4).Text) VE = Val(Text(5).Text) TT = Val(Text(6).Text) Pi = Val(Text(7).Text) PS = Val(Text(8).Text) ET = Val(Text(9).Text) S = Val(Text(10).Text) LS = Val(Text(11).Text) LF = Val(Text(12).Text) i = Val(Text(13).Text) For K = 1 To N Me.MSFlxGrd_TT.Row = K Me.MSFlxGrd_TT.Col = 1 Me.MSFlxGrd_TT.Text = K Me.MSFlxGrd_TT.Row = K Me.MSFlxGrd_TT.Col = 2 Me.MSFlxGrd_TT.Text = Format(S, "0") Me.MSFlxGrd_TT.Row = K Me.MSFlxGrd_TT.Col = 3 Me.MSFlxGrd_TT.Text = Format(LS, "0") Me.MSFlxGrd_TT.Row = K Me.MSFlxGrd_TT.Col = 4 Me.MSFlxGrd_TT.Text = Format(LF, "0") Me.MSFlxGrd_TT.Row = K Me.MSFlxGrd_TT.Col = 5 Me.MSFlxGrd_TT.Text = Format(i, "0") T = S + LF + LS + i RH = RHO * T S = S + RH - MU * S - BT * S * i + VE * LS + PS * LF + GM * i LS = LS + TT * BT * S * i - (MU + Pi + VE) * LS LF = LF + (1 - TT) * BT * S * i + Pi * LS - (MU + ET + PS) * LF i = i + ET * LF - (MU + DT + GM) * i Next K End If End Sub

The Pacific Journal of Science and Technology –188– http://www.akamaiuniversity.us/PJST.htm Volume 14. Number 2. November 2013 (Fall)
RESULTS AND DISCUSSION Numerical Simulations of the Models This section presents graphs generated using the models based software developed using visual basic programming language. The aim of this is to study the profile of the population in respect of the distinct compartments in each model and to consider the effect of varying some parameter values on the population. From the available literature we adopted the following values for the parameters in the four models. Recruitment rate = 0.045 (National Population
Commission, Abuja, 2008). Natural death rate μ= 0.014 (National Population
Commission, Abuja, 2008). Movement rate from slow progressing Latent
class to fast progressing Latent class =
0.17 (Zaric et al., 2000). Movement rate from Latent class to infectious
class τ = 0.03 (Sanchez and Blower 1997,WHO 2006a, WHO 2006b).
Movement rate from Latent class with fast
progression rate to infectious class =
0.1. (WHO 2006a, WHO 2006b). Recovery rate of I(t) =0.23 (National
Tuberculosis And Leprosy Control Programme Abuja, 2008).
Tuberculosis induced death rate = 0.001
(Estimated from National (Tuberculosis And Leprosy Control Programme Abuja, 2008))
Expiration of vaccine efficacy (varied
hypothetically).
Tuberculosis contraction rate (varied
hypothetically). Recovery rate of L(t) (varied hypothetically).
Proportion of individuals with strong immunity θ (varied hypothetically)
Recovery rate of LS(t) (varied hypothetically).
Recovery rate of LF(t) (varied hypothetically).
Figure 1: Software Interface.
Model One With the initial conditions of S(0) = 60, L(0) = 10, I(0) = 10 and R(0) = 20, we obtained the following graphs for model one.
The Pacific Journal of Science and Technology –189– http://www.akamaiuniversity.us/PJST.htm Volume 14. Number 2. November 2013 (Fall)
0
50
100
150
200
250
300
1 6 11 16 21 26 31 36 41 46
Time (t)
Po
pu
lati
on S(t)
L(t)
I(t)
R(t)
0
50
100
150
200
250
300
1 6 11 16 21 26 31 36 41 46
Time (t)
Po
pu
lati
on S(t)
L(t)
I(t)
R(t)
Time (year)
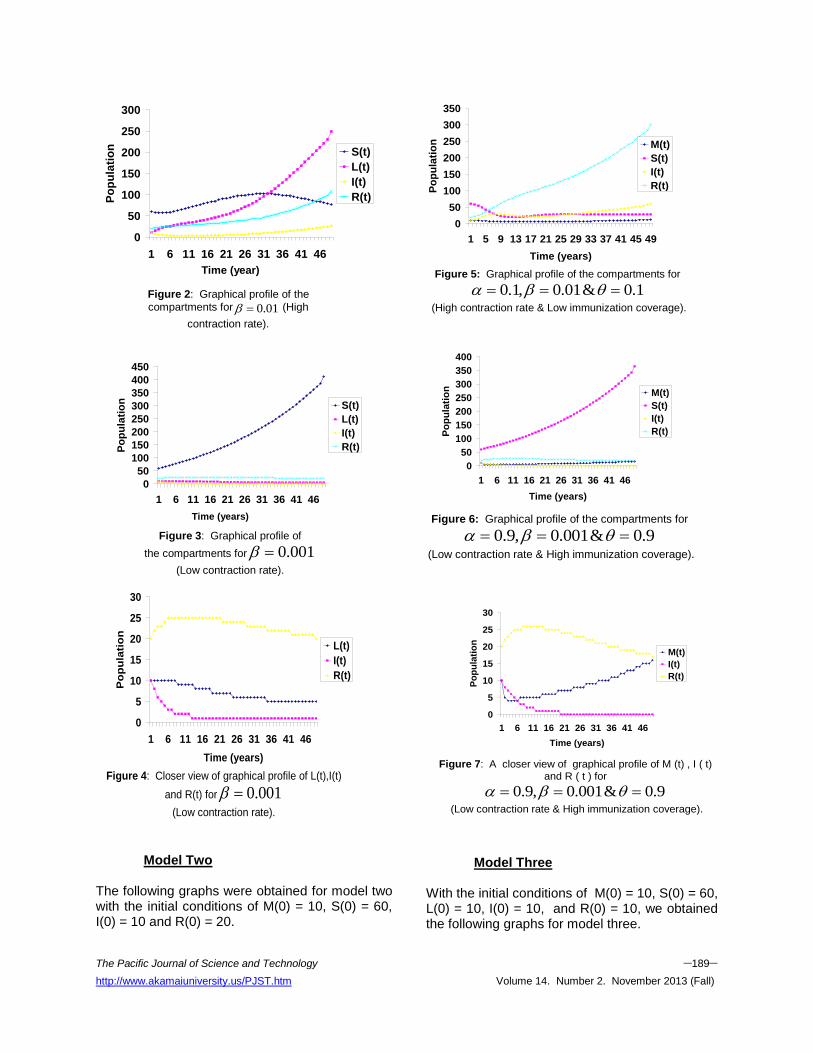
Figure 2: Graphical profile of the
compartments for 01.0 (High
contraction rate).
0
50
100
150
200
250
300
350
400
450
1 6 11 16 21 26 31 36 41 46
Time (t)
Po
pu
lati
on S(t)
L(t)
I(t)
R(t)
Figure 3: Graphical profile of
the compartments for 001.0
(Low contraction rate).
Time (years)
0
5
10
15
20
25
30
1 6 11 16 21 26 31 36 41 46
Time (years)
Po
pu
lati
on
L(t)
I(t)
R(t)
Figure 4: Closer view of graphical profile of L(t),I(t)
and R(t) for 001.0
(Low contraction rate).
Model Two The following graphs were obtained for model two with the initial conditions of M(0) = 10, S(0) = 60, I(0) = 10 and R(0) = 20.
0
50
100
150
200
250
300
350
1 5 9 13 17 21 25 29 33 37 41 45 49
Time (years)
Po
pu
lati
on M(t)
S(t)
I(t)
R(t)
Figure 5: Graphical profile of the compartments for
1.0&01.0,1.0
(High contraction rate & Low immunization coverage).
0
50
100
150
200
250
300
350
400
1 6 11 16 21 26 31 36 41 46
Time (years)
Po
pu
lati
on M(t)
S(t)
I(t)
R(t)
Figure 6: Graphical profile of the compartments for
9.0&001.0,9.0
(Low contraction rate & High immunization coverage).
0
5
10
15
20
25
30
1 6 11 16 21 26 31 36 41 46
Time (years)
Po
pu
lati
on
M(t)
I(t)
R(t)
Figure 7: A closer view of graphical profile of M (t) , I ( t)
and R ( t ) for
9.0&001.0,9.0
(Low contraction rate & High immunization coverage).
Model Three
With the initial conditions of M(0) = 10, S(0) = 60, L(0) = 10, I(0) = 10, and R(0) = 10, we obtained the following graphs for model three.
The Pacific Journal of Science and Technology –190– http://www.akamaiuniversity.us/PJST.htm Volume 14. Number 2. November 2013 (Fall)
0
50
100
150
200
250
300
1 6 11 16 21 26 31 36 41 46
Time (years)
Po
pu
lati
on M(t)
S(t)
L(t)
I(t)
R(t)
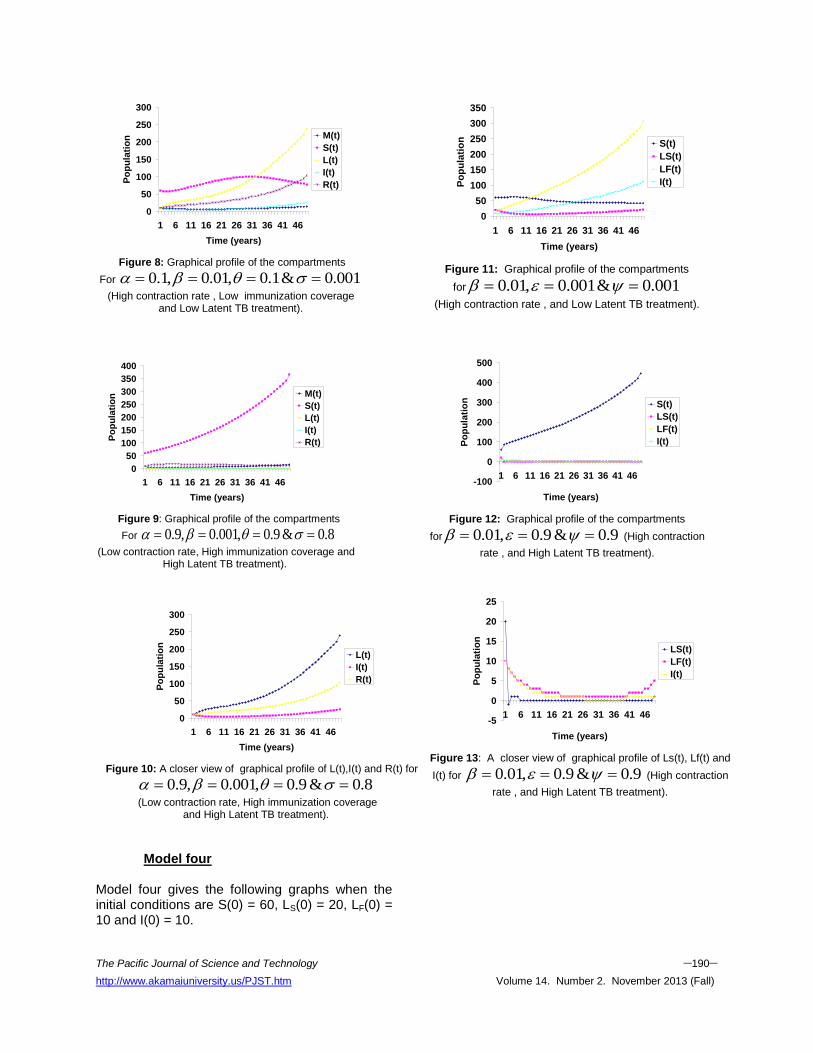
Figure 8: Graphical profile of the compartments
For 001.0&1.0,01.0,1.0
(High contraction rate , Low immunization coverage and Low Latent TB treatment).
0
50
100
150
200
250
300
350
400
1 6 11 16 21 26 31 36 41 46
Time (years)
Po
pu
lati
on M(t)
S(t)
L(t)
I(t)
R(t)
Figure 9: Graphical profile of the compartments
For 8.0&9.0,001.0,9.0
(Low contraction rate, High immunization coverage and High Latent TB treatment).
0
50
100
150
200
250
300
1 6 11 16 21 26 31 36 41 46
Time (years)
Po
pu
lati
on
L(t)
I(t)
R(t)
Figure 10: A closer view of graphical profile of L(t),I(t) and R(t) for
8.0&9.0,001.0,9.0
(Low contraction rate, High immunization coverage and High Latent TB treatment).
Model four Model four gives the following graphs when the initial conditions are S(0) = 60, LS(0) = 20, LF(0) = 10 and I(0) = 10.
0
50
100
150
200
250
300
350
1 6 11 16 21 26 31 36 41 46
Time (years)
Po
pu
lati
on S(t)
LS(t)
LF(t)
I(t)
Figure 11: Graphical profile of the compartments
for 001.0&001.0,01.0
(High contraction rate , and Low Latent TB treatment).
-100
0
100
200
300
400
500
1 6 11 16 21 26 31 36 41 46
Time (years)
Po
pu
lati
on S(t)
LS(t)
LF(t)
I(t)
Figure 12: Graphical profile of the compartments
for 9.0&9.0,01.0 (High contraction
rate , and High Latent TB treatment).
-5
0
5
10
15
20
25
1 6 11 16 21 26 31 36 41 46
Time (years)
Po
pu
lati
on
LS(t)
LF(t)
I(t)
Figure 13: A closer view of graphical profile of Ls(t), Lf(t) and
I(t) for 9.0&9.0,01.0 (High contraction
rate , and High Latent TB treatment).

The Pacific Journal of Science and Technology –191– http://www.akamaiuniversity.us/PJST.htm Volume 14. Number 2. November 2013 (Fall)
0
50
100
150
200
250
300
350
400
450
1 6 11 16 21 26 31 36 41 46
Time (years)
Po
pu
lati
on S(t)
LS(t)
LF(t)
I(t)
Figure 14: Graphical profile of the compartments
for 001.0&001.0,001.0
(Low contraction rate , and Low Latent TB treatment)
.
0
5
10
15
20
25
1 6 11 16 21 26 31 36 41 46
Time (years)
Po
pu
lati
on
LS(t)
LF(t)
I(t)
Figure 15: A closer view of graphical profile of
Ls(t), Lf(t) and I(t) for
001.0&001.0,001.0
(Low contraction rate , and Low Latent TB treatment).
-50
0
50
100
150
200
250
300
350
400
450
500
1 5 9 13 17 21 25 29 33 37 41 45 49Time (year)
Po
pu
lati
on S(t)
LS(t)
LF(t)
I(t)
Figure 16: Graphical profile of the compartments
for 9.0&9.0,001.0 (Low
contraction rate , and High Latent TB treatment).
-5
0
5
10
15
20
25
1 6 11 16 21 26 31 36 41 46
Time (year)
Po
pu
lati
on
LS(t)
LF(t)
I(t)
Figure17: A closer view of graphical
profile of the compartments for
9.0&9.0,001.0
(Low contraction rate , and High Latent TB treatment).
Discussion of the Results
Model One Figure 2 shows the graphical profile of model one
for 01.0 (i e high contraction rate) it was
observed that the population of susceptible compartment increases until t=29 and then decreases steadily. The latent and infections classes increases exponentially much faster than the recovered class and this will lead to an
endemic TB situation. Reducing from 0.01 to
0.001 (i. e low contraction rate) as shown in Figure 4 brought down the number of infectious individuals to 1 from t=13 and this was maintained up to t=50, hence a condition for minimizing the disease and not total eradication.
Model Two Figure 5 shows the graphical profile of each compartment in model 2 for
1.0&01.0,1.0 implying High
contraction rate and low immunisation coverage. It was observed that R(t) was increasing rapidly. The susceptible compartment was gradually decreasing from the beginning until t=11. From t=11 to t=28, the Susceptible and Infectious classes were fluctuating until t=30 when the two compartments continue to increase gradually leading to a TB endemic state.
Increasing and to 0.9 and reducing to
0.001 (i.e. low contraction rate and High immunisation coverage) as shown in Figure 7, brought down the number of infectious individuals
The Pacific Journal of Science and Technology –192– http://www.akamaiuniversity.us/PJST.htm Volume 14. Number 2. November 2013 (Fall)
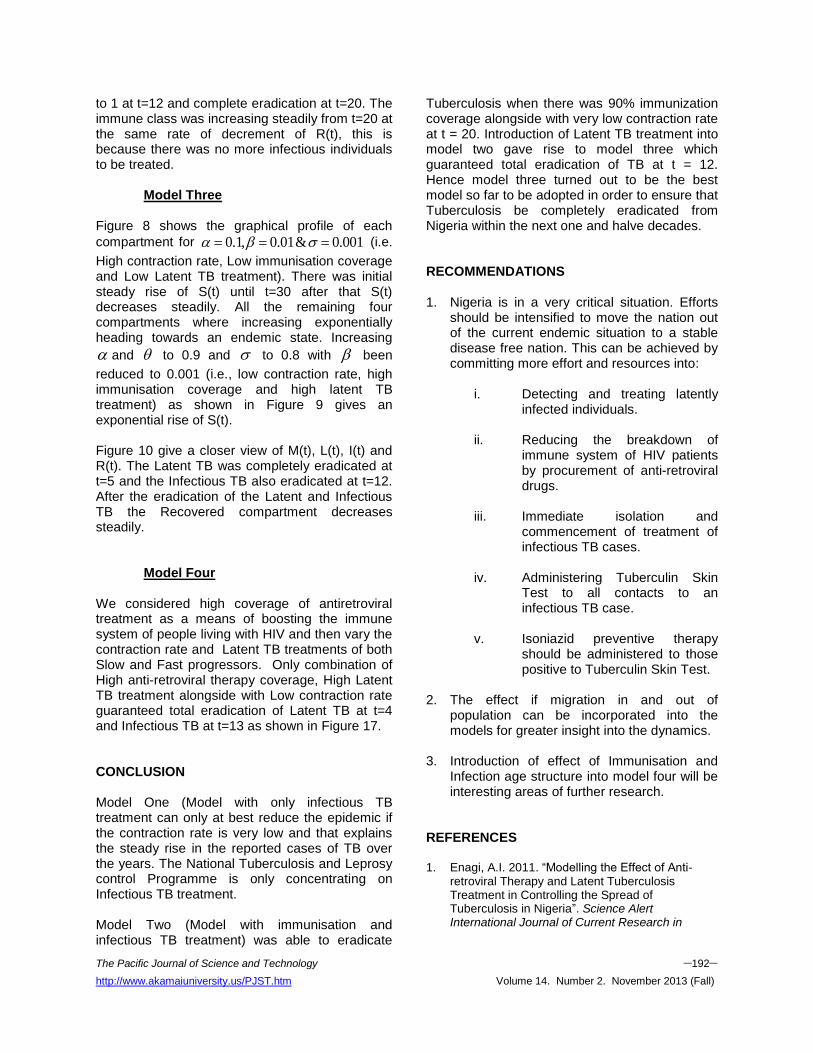
to 1 at t=12 and complete eradication at t=20. The immune class was increasing steadily from t=20 at the same rate of decrement of R(t), this is because there was no more infectious individuals to be treated.
Model Three Figure 8 shows the graphical profile of each
compartment for 001.0&01.0,1.0 (i.e.
High contraction rate, Low immunisation coverage and Low Latent TB treatment). There was initial steady rise of S(t) until t=30 after that S(t) decreases steadily. All the remaining four compartments where increasing exponentially heading towards an endemic state. Increasing
and to 0.9 and to 0.8 with been
reduced to 0.001 (i.e., low contraction rate, high immunisation coverage and high latent TB treatment) as shown in Figure 9 gives an exponential rise of S(t). Figure 10 give a closer view of M(t), L(t), I(t) and R(t). The Latent TB was completely eradicated at t=5 and the Infectious TB also eradicated at t=12. After the eradication of the Latent and Infectious TB the Recovered compartment decreases steadily.
Model Four We considered high coverage of antiretroviral treatment as a means of boosting the immune system of people living with HIV and then vary the contraction rate and Latent TB treatments of both Slow and Fast progressors. Only combination of High anti-retroviral therapy coverage, High Latent TB treatment alongside with Low contraction rate guaranteed total eradication of Latent TB at t=4 and Infectious TB at t=13 as shown in Figure 17. CONCLUSION Model One (Model with only infectious TB treatment can only at best reduce the epidemic if the contraction rate is very low and that explains the steady rise in the reported cases of TB over the years. The National Tuberculosis and Leprosy control Programme is only concentrating on Infectious TB treatment. Model Two (Model with immunisation and infectious TB treatment) was able to eradicate
Tuberculosis when there was 90% immunization coverage alongside with very low contraction rate at t = 20. Introduction of Latent TB treatment into model two gave rise to model three which guaranteed total eradication of TB at t = 12. Hence model three turned out to be the best model so far to be adopted in order to ensure that Tuberculosis be completely eradicated from Nigeria within the next one and halve decades. RECOMMENDATIONS 1. Nigeria is in a very critical situation. Efforts
should be intensified to move the nation out of the current endemic situation to a stable disease free nation. This can be achieved by committing more effort and resources into:
i. Detecting and treating latently infected individuals.
ii. Reducing the breakdown of immune system of HIV patients by procurement of anti-retroviral drugs.
iii. Immediate isolation and commencement of treatment of infectious TB cases.
iv. Administering Tuberculin Skin Test to all contacts to an infectious TB case.
v. Isoniazid preventive therapy should be administered to those positive to Tuberculin Skin Test.
2. The effect if migration in and out of
population can be incorporated into the models for greater insight into the dynamics.
3. Introduction of effect of Immunisation and Infection age structure into model four will be interesting areas of further research.
REFERENCES 1. Enagi, A.I. 2011. “Modelling the Effect of Anti-
retroviral Therapy and Latent Tuberculosis Treatment in Controlling the Spread of Tuberculosis in Nigeria”. Science Alert International Journal of Current Research in
The Pacific Journal of Science and Technology –193– http://www.akamaiuniversity.us/PJST.htm Volume 14. Number 2. November 2013 (Fall)
Tuberculosis USA. (On line) ISSN 1819-3366. 3(1):9-15.
2. Enagi, A.I. 2013. “A Deterministic Compartmental Model of Tuberculosis Control Strategy Adopted by the National Tuberculosis and Leprosy Control Programme in Nigeria”. Pacific Journal of Science and Technology. 14(1):342-348.
3. Enagi A.I. and M.O. Ibrahim. 2011a. “A Mathematical Model of Effect of Bacillus Calmette-Guerin Vaccine and Isoniazid Preventive Therapy in Controlling the spread of Tuberculosis in Nigeria”. Medwell International Journals of Modern Mathematics and Statistics Pakistan. ISSN 1994-
5388. 5(1):25-29.
4. Enagi, A.I. and M.O. Ibrahim. 2011b. “Preventing Mother to Child transmission of Tuberculosis Using Bacillus Calmatte - Guerine Vaccine: A Deterministic Modelling Approach”. Maxwell Science Publication. International Research Journal of Maths and Statistics, Pakistan. ISSN
(Online) 2040-7505. 3(2):67-71. 5. Hughes, C., S.M. Currie, and E.L. Corbett. 2006.
“Modelling Tuberculosis in areas of high HIV Prevalence”. Proceedings of the 2006 Winter Simulation Conference.
6. Kabir, A. 2008. “Update on the National TB Control Programme in Nigeria”. Expert Meeting to Support Strategic Framework Development 8th – 12th September 2008. Jigawa Hotels, Dutse, Nigeria.
7. National Tuberculosis and Leprosy Control Programme, Abuja. 2008. “Annual Report: http://www.ntbltc.org/reports/Annual%20Report%202008%20NTBLCP.pdf
8. National Population Commission, Abuja. 2008. “Report Of Live births, Deaths & Stillbirths In Nigeria (1994-2007)”. http://www.population.gov.ng/images/stories/Report%20on%20Birth-Death-Stillbirth-Registration.pdf
9. Okeyre, E. 2007. “Deterministic Compartmental Models for HIV and TB”. African Institute for Mathematical Sciences.
10. Sanchez, M.A. and S.M. Blower. 1997. “Uncertainty and Sensitivity Analysis of the Basic Reproductive Rate: Tuberculosis as an Example”. Am. J. Epidemiol, 145(12):1127–1137.
11. Stroud, K.A. and J.B. Dexter. 2003. Advanced Engineering Mathematics. Palgrave and Macmillan Publishers: London, UK.
12. World Health Organization. 2003. “Tuberculosis,
Fact Sheet”. WHO, Global Tuberculosis Program: Geneva, Switzerland.
13. World Health Organization. 2006a. “Frequently Asked Questions About TB and HIV”. WHO: Geneva, Switzerland. Retrieved September 9 2006. http://www .who.int/ tb/hiv/faq/en/ index.htrnl.
14. World Health Organization. 2006b. “Tuberculosis Fact Sheet. Geneva, Switzerland. Retrieved September 9, 2006, http://www.who. int/mediacentre/factsheets/fs 104/en/index.html.
15. Yusuf, T. 2008. “Mathematical Model to Simulate Tuberculosis Disease Population Dynamics”. American Journal of Applied Sciences. 5(4):301-306. 2008 ISSN 1546-9239 2008.
16. Zaric, G.S., P.G. Barnett, and M.L. Brandeau. 2000. “HIV Transmission and the Cost-Effectiveness of Methadone Maintenance”. Amer. J. Public Health. 90(7):1100-1111.
ABOUT THE AUTHOR Dr. Enagi Abdullah Idris, is a Lecturer in the Department of Mathematics and Statistics, Federal University of Technology, Minna, Nigeria. He holds a Ph.D. degree in Applied Mathematics from Usmanu Danfodiyo University Sokoto, Nigeria. His research interest is in mathematical modelling of infectious diseases. SUGGESTED CITATION Enagi, A.I. 2013. “A Comparative Analysis of Four Deterministic Compartmental Mathematical Models for Controlling the Spread of Tuberculosis in Nigeria”. Pacific Journal of Science and Technology. 14(2):182-193.
Pacific Journal of Science and Technology