Embed Size (px)
Citation preview

13Y BC DOAP REPORT 2014 Y
CHAPTER 2
CHAPTER 2
SUBSTANCE USE TRENDS0 General Population and Substance UseThe Canadian Alcohol and Drug Use Monitoring Survey (CADUMS) is a general population telephone survey thus participants must have a landline phone and are willing to answer the survey In 2011 CADUMS found 897 of Canadians reported consuming alcohol at some point in their life (780 in the past 12 months) and 394 have ever used cannabis (91 in the past 12 months)19 The Canadian Centre on Substance Abuse identifies the threshold for low-risk drinking for chronic harms as exceeding 15 drinks per week3 drinks per day for males and 10 drinks per week2 drinks per day for females and for acute harms 5+4+ drinks on one occasion for malesfemales respectively
Figure 21a and 21b show CADUMS risky alcohol use by male and female participants from 2008 to 2012 From 2008 to 2010 males were significantly (p lt 005) more likely to report drinking in excess of the low risk drinking guidelines for chronic harms than females in BC and Canada (Figure 21a) The proportion of males and females reporting risky alcohol use for acute harms are higher in BC than the rest of Canada (Figure 21b)20
Figure 21 CADUMS substance use trends in BC and Canada based on gender 2008-2012 a) Prevalence of risky drinking in past year for chronic harms b) Prevalence of risky drinking in past year for acute harms18
8
54231199138132
464241
302520151050
6
4
2
0
2008Year 2009 2010 2011 2012
a) Prevalence of risky drinking in past year for chronic harms among Canadians aged 15+ by gender 2008-12
Risk
y dr
inke
rs fo
r chr
onic
har
ms
()
BCFemales
Rest of CanadaFemales
BCMales
Rest of CanadaMales
Having 16+ drinks in men and 11+ in women weekly
2008Year 2009 2010 2011 2012
b) Prevalence of risky drinking in past year for acute harms among Canadians aged 15+ by gender 2008-12
Risk
y dr
inke
rs fo
r acu
te h
arm
s (
)
BCFemales
Rest of CanadaFemales
BCMales
Rest of CanadaMales
Having 5+ drinks in men and 4+ in women weekly on one occassion atleast once in past 30 days
JBack to Table of Content
SUBSTANCE USE TRENDS
14 Y BC DOAP REPORT 2014 Y
Figure 22 presents per capita alcohol consumption for individuals 15 and older in BC and Canada between 199899 and 201213 Alcohol consumption in Canada and BC steadily increased until 200708 Alcohol consumption in BC consistently exceeds the Canadian average Please note that the Alcohol and Other Drug
(AOD) monitoring project estimates of alcohol consumption are higher because they include UBrew and UVin sales20 UBrews and UVins are businesses that sell ingredients and equipment used to produce beer wine ciders or coolers20
Figure 22 Annual per capita age 15+ alcohol consumption for BC and Canada in litres of absolute alcohol 199899 to 20121320
Litr
es o
f abs
olut
e al
coho
l per
per
son
per y
ear
Fiscal Year
95
848
810
90 British Columbia(AOD Monitoring Project)
British Columbia Rates(Statistics Canada) Canada Rates
(Statistics Canada)
85
80
75
709899 9900 0001 0102 0203 0304 0405 0506 0607 0708 0809 0910 1011 1112 1213
15Y BC DOAP REPORT 2014 Y
CHAPTER 2
Per capita alcohol consumption based on 2011 alcohol sales data (reported in litres of absolute alcohol) among resident adults (15 years and older) for the 16 HSDA in BC is shown in figure 23 The rate was calculated by the sales per resident population the highest rate at 1331 litres per adult was in the northern
geographic region of North ShoreCoast Garibaldi HSDA (which includes Bella Coola Valley) The lowest rate 451 litre per adult was in Richmond As seen in Figure 23 alcohol use is higher in the northern and eastern interior regions of BC compared to the rest of the province20
32 22
3123
12
11
13
Kewlona
14Kamploops
21
33 B
Victoria
42
41
43
43
33 A
52
Prince George
51
Fort Nelson
53
11 East Kootenay (1169 L)12 Kootenay Boundary (1113 L)13 Okanagan (1145 L)14 Thompson Cariboo Shuswap (1078L)21 Fraser East (720 L)22 Fraser North (583 L)23 Fraser South (648 L)31 Richmond (451 L)32 Vancouver (772 L)
33 A North ShoreCoast Garibaldi North (1331 L)33 B North ShoreCoast Garibaldi South (1049 L)41 South Vancouver Island (996 L)42 Central Vancouver Island (1014 L)43 North Vancouver Island (1147 L)51 Northwest (1137 L)52 Northern Interior (936 L)53 Northeast (1064 L)
gt 1400 L
1250 L - 1400 L
1100 L - 1249 L
950 L - 1099 L
800 L - 949 L
lt 800 L
Per Capita1 Litres (L) of Absolute Alcohol Consumption 1 15 years and older
N
Figure 23 Per capita alcohol consumption by HSDA in BC in 201220
JBack to Table of Content
SUBSTANCE USE TRENDS
16 Y BC DOAP REPORT 2014 Y
Self-reported tobacco use among males and females in BC is consistently lower than the rest of Canada However cannabis use in both sexes was higher in BC and an increase was reported
among BC males in 2012 (Figure 24a) Males in BC and the rest of Canada were significantly (p lt 005) more likely than females to report cannabis use (Figure 24b)
Figure 24 CADUMS substance use trends in BC and Canada by gender 2008-2012 a) Prevalence of tobacco smoking in the past year b) Prevalence of cannabis use in the past 12 months20
25
20
15
10
5
0
192161147119
2008Year 2009 2010 2011 2012
a) Prevalence of smoking in past year among Canadians aged 15+ by gender 2008-2012
Smok
ers
()
BCFemales
Rest of CanadaFemales
BCMales
Rest of CanadaMales
20
15
10
5
0
190
129
8967
2008Year 2009 2010 2011 2012
b) Prevalence of cannabis use in the past 12 months among Canadians 15+ by gender 2008-2012
Cann
abis
use
rs (
)
BCFemales
Rest of CanadaFemales
BCMales
Rest of CanadaMales
17Y BC DOAP REPORT 2014 Y
CHAPTER 2
CADUMS reported the prevalence of lifetime cannabis use in BC in 2011 as 4436 As shown in Figure 25 the Kootenay Boundary HSDA has the highest prevalence of lifetime cannabis
use (62) closely followed by Northern Interior (61) North-east (60) and South Vancouver Island (57) Richmond has the lowest prevalence of lifetime cannabis use (35)20
12
11
13
Kewlona
14Kamploops
21
42
42
Victoria41
43
43
33
52
Prince George
51
Fort Nelson
53
11 East Kootenay (430)12 Kootenay Boundary (6200)13 Okanagan (516)14 Thompson Cariboo Shuswap (492)21 Fraser East (414)22 Fraser North (446)23 Fraser South (456)31 Richmond (344)
32 Vancouver (465)33 North ShoreCoast Garibaldi (524)41 South Vancouver Island (573)42 Central Vancouver Island (511)43 North Vancouver Island (528)51 Northwest (536)52 Northern Interior (611)53 Northeast (603)
Percent Lifetime Cannabis Use Among Adults1 1 age15 years or older
537 ndash 620
512 ndash 536
447 ndash 511
344 ndash 446
Classified using quartiles
N
Figure 25 Percentage of lifetime cannabis use by HSDA in BC 2008-200920
22
31 23
32
33
JBack to Table of Content
SUBSTANCE USE TRENDS
18 Y BC DOAP REPORT 2014 Y
Figure 26 illustrates the prevalence of illicit substance use (other than cannabis) in the past 12 months among adults aged 15 and older reported by CADUMS Prevalence was estimated using the number of the people who reported using any illicit drugs including cocaine speed methamphetamine ecstasy hallucinogens inhalants heroin pain relievers stimulants and
sedatives divided by the sample population In BC and the rest of Canada males were more likely than females to use illicit substances and the prevalence of illicit drug use between 2008 and 2012 is significantly higher (p lt 005) in BC compared to the rest of Canada20
0 High Risk Populations and Substance Use CARBCrsquos High Risk Populations survey is a convenience sample of 50 street-involved adults and 50 adults using drugs recreationally in Vancouver and Victoria every six months These high risk populations report higher alcohol cannabis and other illicit substances use compared to the general population However substance use patterns vary between these two high-risk populations Figure 27 shows that in 2012 1 of recreational drug using adults compared to 78 of street-involved adults reported crack cocaine use in the previous month while 88 versus 6 in the same groups used ecstasy There are also
statistically significant differences in crystal methamphetamine heroin LSD and mushroom use20
The survey also found 36 of the recreational-use adult co-horts in Vancouver and Victoria reported simultaneous alcohol and marijuana use over the previous weekend and 11 reported simultaneous use of alcohol and cocaine Using more than one substance at a time (poly-substance use) was lower among street-involved adults the most frequently mixed substances being alcohol and marijuana (10) followed by crystal meth and heroin (75)20
7
6
5
4
3
2
1
0
Figure 26 CADUMS substance use trends in BC and Canada by gender 2008-2012 Prevalence of other illicit substance use (excluding cannabis) in the past 12 months20
Prevalence of other illicit substance use (excluding cannabis) in the past year among Canadians 15+ by gender 2008-2012
2008Year 2009 2010 2011 2012
BCFemales
Rest of CanadaFemales
BCMales
Rest of CanadaMales
Illic
it dr
ug u
sers
()
- 47
36
16 14
BC numbers for females 2011-12 and males 2011 were suppressed due to unstable estimates
19Y BC DOAP REPORT 2014 Y
CHAPTER 2
Drugs used at least weekly reported by the VIDUS and ACCESS cohorts are shown in Figure 28 and 29 Figure 28 indicates considerable changes in weekly drug use (by any route) over time Cocaine use declined since 1996 while crack cocaine use
increased from 51 in 1996 to 706 in 2008 but declined to 34 in 2013 Crystal methamphetamine use reached its highest recorded level in 2013 (178 )
Figure 27 Past month substance use in high risk populations in Victoria and Vancouver 2012 (Wave 2)20
Alcohol Marijuana Tobacco CocaineCrack Amphetamine Crystal Meth HeroinEcstasy LSD Magic Mushrooms
Perc
enta
ge
Street involved adults Recreational Adults
100
8068
72
91
52
78
13
40
9689
7469
1
25
6 3
88
55
75
40
6 510
60
40
20
0
Figure 28 Weekly drug use patterns among people who use illicit drugs in Vancouver Canada 1996-2013
1996 1997 1998 1999 2000 2001 2002 2003 2004 2005 2006 2007 2008 2009 2010 2011 2012 2013
80
70
60
50
40
30
20
10
0
Perc
enta
ge
Cocaine Crack Crystal Meth Heroin Marijuana Prescription opioids
(BC Centre for Excellence in HIVAIDS personal communication June 10 2014) Note each category in the graph captures both injection and non-injection use of the specified drug
JBack to Table of Content
SUBSTANCE USE TRENDS
20 Y BC DOAP REPORT 2014 Y
Figure 29 shows weekly drug use by route of administration illicit prescription opioid use (ie use of prescription opioids without a valid prescription) includes OxyContin (oxycodone) Percocet (oxycodonetylenol) Tylenol 3 (codeinetylenol) morphine Dilaudid (hydromorphone) Demerol (meperidine or pethadine) methadone fentanyl hydrocodone and Talwin (pentazocine)
Most high-risk drug use research in BC is conducted in Vancouver and Victoria To gain a better understanding of drug use outside these two cities over 700 clients using harm
reduction distribution sites throughout BC were surveyed in 2012 and 2013 (HR client survey)2223 In 2013 drug use was weighted by HSDA population the three most commonly used substances were marijuana (51) alcohol (48) and crack (35) Substance use patterns vary between regions as seen in Figure 210 Crack use was highest in NH (67) and lowest in VCH (33) Powdered cocaine use was also highest in the NH region By contrast reported use of heroin and crystal meth was lower in NH compared to other regions of BC and highest in FH (54 and 48 respectively)23
Figure 29 Weekly substance use prevalence among people who use illicit drugs in Vancouver Canada 2013
Perc
enta
ge
Cocaine Injectio
n
Cocaine Non-Injectio
n
Crystal M
eth Injectio
n
Crystal M
eth Non-Injectio
n
Crack Non-In
jection
Prescrip
tion Opioid In
jection
Prescrip
tion Opioid Non-In
jection
Heroin Injectio
n
Marijuana Non-In
jection
(BC Centre for Excellence in HIVAIDS personal communication June 10 2014)
40
35
30
25
193
34
149
79
340
86
49
261 252
20
15
10
5
0
21Y BC DOAP REPORT 2014 Y
CHAPTER 2
0 Substance Availability and CostThe availability of illicit drugs in Vancouver is reported by UHRI as the percentage of PWUD who can obtain the drug within 10 minutes PWUD in Vancouver were more likely able to obtain crack cocaine (80) cocaine (70) and heroin (70) than cannabis (65) or crystal methamphetamine within 10 minutes in 2011
URHI cohort participants identified the cost of drugs has been stable over the past 10 years
- Heroin $20 per 01 gram since 2001
- Powder cocaine and crack cocaine $10 per 01 gram
- Crystal methamphetamine $10 per 01 gram
The availability and consistent price of drugs in the Vancouver area does not support the claim that law enforcement efforts have reduced the available drug supply and increased the cost of illicit substances18
The Centre for Addiction Research of BC (CARBC)rsquos High Risk Population survey in Vancouver and Victoria shows similar trends in drug prices and availability Since 2008 cocaine crack heroin and crystal meth have been reported by street-involved adults in both cities as being either ldquoeasyrdquo or ldquovery easyrdquo to obtain Furthermore the reported street prices of these substances are very similar to those reported in UHRIrsquos research and have fluctuated little over the years20 More information on drug trafficking can be found in the enforcement chapter of this report
The 2014 UNODC World Drug Report identifies Canada as the country with the highest consumption of prescription opioids with 8122 mg per capita of morphine equivalence (see Table 21) the next highest is United States at 74979 mg per capita24 Canadarsquos high rate of pain medication prescribing and availability has serious implications for drug-related harms and diversion
Figure 210 Percent of HR clients reporting substance use in the past week by HA weighted by HSDA population 201323
70
60
50
40
30
20
10
0
Marijuana Alcohol Crack Heroin Crystal Meth Cocaine
FH VCH VIHA IH NH
Perc
enta
ge
JBack to Table of Content
SUBSTANCE USE TRENDS
22 Y BC DOAP REPORT 2014 Y
0 OxycontinOxyContin a patented prescription version of oxycodone used to treat moderate to intense pain was discontinued in Canada in March 201225 OxyContin was a slow-release narcotic when taken orally as intended however users could release high levels of the drug instantaneously by crushing and snorting the tablet OxyNEO was introduced by the same manufacturer Purdue Pharma as a replacement drug that was designed to be harder to crush and dissolve limiting abuse through snorting and injecting2526 Since its introduction several provincial health plans altered their drug coverage to restrict coverage of OxyNEO In BC only exceptional case-by-base coverage requests for OxyNEO are considered and it is only covered through the palliative care plan2728 There are concerns that the recent lack of OxyContin is leading some opioid dependant users to seek out more accessible and potentially more dangerous opioids A US-based study found that after the formulation changed misuse of OxyContin among patients undergoing opioid dependence treatment decreased from 356 to 12829 However fentanyl and hydromorphone use increased among these patients and heroin use doubled29
Although the replacement of OxyContin with OxyNEO was intended to address concerns over misuse of the drug Health Canadarsquos subsequent decision in November
2012 to approve generic production of extended release oxycodone allowed off-brand versions to enter the Canadian pharmaceutical market30 These generic versions are not currently covered under BCrsquos provincial formulary28
0 Medical MarijuanaThere have been recent developments regarding medical marijuana licensing Health Canadarsquos 2014 proposed Marijuana for Medical Purposes Regulations (MMPR) required patients to end home production of medical marijuana on April 1 201431 However following a consti-tutional challenge to the MMPR a Federal Court granted an injunction on March 21 201432 This allows those with personal and designated production licenses (for persons responsible for the patient) to continue home production of medical marijuana until the case goes to trial in spring 201532 The injunction does not affect Health Canadarsquos new medical marijuana licensing system for dispensing prescribed marijuana and there are concerns that new patients will have difficulty affording the higher marijuana prices projected to result from the federal legislation32 On a related note licensed sales of recreational marijuana began in Washington State on July 8 201433 This may have implications on illicit cannabis trade with BC given the US statersquos close proximity
Table 21 Morphine equivalence consumption per capita Canada 2011
Drug mgcapita ME mgcapita
Fentanyl
Hydromorphone
Methadone
Morphine
Oxycodone
Pethidine
Total Morphine Equivalence
24366
250938
200946
874741
1458966
71278
2030396
1254691
2003782
874741
1940425
17820
8121855
httpwwwpainpolicywisceducountryprofilecanada
23Y BC DOAP REPORT 2014 Y
CHAPTER 2
0 FentanylBC has experienced a recent increase in fentanyl availability and fentanyl-detected deaths Fentanyl is a synthetic narcotic that is used to relieve intense pain In BC fentanyl can be prescribed for pain management as a transdermal patch which provides sustained release of the drug34 However this formulation is susceptible to abuse through the extraction of patch contents and subsequent intrave-nous injection35 Fentanyl is 50-100 times more potent than morphine which greatly increases the risk of accidental overdose36 Early signs of fentanyl overdose include severe sleepiness slow heartbeat difficulty breathing coldclammy skin and trouble with walking or talking36
The RCMP and municipal police forces in BC have identi-fied illegally manufactured fentanyl as a white powder resembling heroin and in tablet form as counterfeit oxycodone (fake oxy) tablets3738 Illegally-produced fentanyl can be significantly more toxic than the pharma-ceutical-grade39 Tablets containing fentanyl are green and are stamped with ldquoCDNrdquo and the number 80 on the opposite sides (Figure 211) These pills are nicknamed ldquogreen jelliesrdquo and ldquostreet oxyrdquo in Western Canada37 White tablets with ldquoCDNrdquo and ldquo10rdquo stamped on them have also appeared in British Columbia (Figure 211) Seized quan-tities of these two versions tested positive for fentanyl 89 of the time and contain variable sometimes very high dose of fentanyl37 Individuals using these drugs may be under the assumption that they contain oxycodone only and are therefore at high risk of accidental overdose
On May 30th 2013 in response to an increase in fentayl- detected deaths in BC a joint alert was issued by the Provincial Health Officer BC Coroners Service (BCCS) healthcare and enforcement partners warning the public of the increase in deaths and availability of fentanyl within the street drug market After the alert fentanyl- detected deaths declined in June and July 2013 but have since increased In 2012 there were 15 fentanyl-detected deaths a total of 51 fentanyl-detected deaths were iden-tified in BC in 2013 most 2013 fentanyl-detected deaths occurred in Metro Vancouver region (15) Island (14) and Fraser (12) (Figure 212)
Preliminary data from the BCCS indicates 49 fentanyl- detected deaths occurred in the first eight months of 2014 (January 1st to August 31st) of these 10 occurred in the City of Vancouver and 18 in the Fraser region about a third (16) were female Please note that 2013 and 2014 data are preliminary and subject to change and these deaths only include fentanyl found in illicit drug-related circumstances and exclude overdose deaths in persons prescribed fentanyl40
In June 2014 the BCCS issued another public warning urging all PWUD to exercise extreme caution when consuming substances that may contain fentanyl More information regarding fentanyl can be found in the Mortality section37
Figure 211 Samples of seized counterfeit oxycodone tablets39
JBack to Table of Content
SUBSTANCE USE TRENDS
24 Y BC DOAP REPORT 2014 YN
umbe
r of D
eath
s
16
141210
8642
2012 2013 Jan 1-Aug 31 20140
Fraser 6
3
2
3
115
12
15
14
3
751
18
12
7
7
549
Metro
Island
InteriorNorthern
Total
Figure 212 Fentanyl-detected deaths by BCCS region 2012-201440
Figure 213 Fentanyl-detected deaths by sex 2012-201440
50
40
30
20
10
02012 2013 Jan 1-Aug 31 2014
Male
Female
12
3
42
9
33
16
Num
ber o
f Dea
ths
25Y BC DOAP REPORT 2014 Y
CHAPTER 2
0 Youth YOUTH IN SCHOOLThe McCreary Centre Society recruits grade 7-12 students in public schools throughout BC to participate in the Adolescent Health Survey (AHS) every five years Since these participants are in school they are unlikely to have major substance use problems The 2013 survey had 259138 participants and found that self-reported substance use among BC adolescents has declined since 2003 (Figures 214 and 215) Alcohol was the
most commonly used substance in 2013 with 45 of BC youth reporting that they had tried it41
Self-reported use of steroids heroin inhalants amphetamines or cocaine has remained stable or declined since 2003 Adolescent use of prescription pills peaked in 2008
Figure 214 Percentage of BC youth who have ever used alcohol cannabis tobacco 2003-201341
Perc
enta
ge
60
55
50
45
40
35
30
25
20 2003 2008 2013
Alcohol
Cannabis
Tobacco
2003 2008 2013
Figure 215 Percentage of BC youth who have ever used prescription pills illicit substances 2003-201341
16
14
12
10
8
6
4
2
0
Cocaine
Prescription Pills
Amphetamines
Heroin
Hallucinogens
Mushrooms
Steriods
Inhalants
Perc
enta
ge
JBack to Table of Content
SUBSTANCE USE TRENDS
26 Y BC DOAP REPORT 2014 Y
Although some students experiment with alcohol and cannabis before the age of 13 the majority (65) who tried alcohol and cannabis did so between the ages of 13 and 15 (Figure 216)41
Table 22 summarizes the self-reported reasons among adolescents for their most recent substance use event The most cited reason was ldquoI wanted to have funrdquo followed by ldquomy friends were doing itrdquo and ldquoI wanted to try itexperimentrdquo
Mental health factors were also reported as reasons for drug use lsquobecause of stressrsquo or feeling ldquodown or sadrdquo Youth who reported self-harm in the past year were more likely to use substances compared to those who had not self-harmed (43 vs 14 respectively)41
Figure 216 Age when BC youth used alcohol or cannabis for the first time41
Perc
enta
ge
Age (years)
25
20
15
10
5
0lt9 9 10 11 12 13 14 15 gt1716
AlcoholCannabis
_
6029271611
9533211
21
693729252110
743211
16
Table 22 Reasons for last time substance uses for BC youth41
Males FemalesI wanted to have funMy friends were doing itI wanted to try itexperimentBecause of stressI felt down or sadI felt like there was nothing else to doTo manage physical painI was pressured into doing itI thought it would help me focusBecause of an addictionI didnrsquot mean to do itTo change the effects of some other drug(s)Other
27Y BC DOAP REPORT 2014 Y
CHAPTER 2
About half of youth who used substances in the past year reported negative consequences The most frequent responses were ldquodoing something they could not rememberrdquo ldquopassing outrdquo and ldquogetting injuredrdquo (Table 23)41
Substance use trends from the 2013 East Kootenay Addiction Service Society (EKASS) survey are similar to the AHS data Since 2005 the proportion of East Kootenay area in-school youth experimenting with substances has declined In 2013 females reported using fewer substances than males This is in contrast to prior years for example alcohol use was 720 for girls and 703 for boys in 2007 but was 585 and 620 in 2013 similarly cannabis use for girls and boys was 362 and 354 in 2007 but 273 and 336 respectively in 201342
The EKASS reports the proportion of students admitting to being in a car with an alcohol-impaired driver reached a high of 601 in 2009 but was 464 in 2013 a consid-erable decrease but still unacceptably high Youth who reported driving after drinking alcohol also dropped from 201 in 2005 to 120 in 2013 Rate of self-reports of
being a passenger in a car with a cannabis-impaired driver was 295 in 2011 These declines may also reflect the overall decrease in substance use among youth42
HIGH RISK YOUTHThe proportion of lifetime drug use among a convenience sample of Vancouver and Victoria area street-involved youth aged 15-24 in the CARBC high risk survey is considerably higher than the in-school youth surveys (Figure 217) Although 2013 data is available for Victoria the most recent data available for Vancouver is 2012 In 2012 marijuana use was more common than alcohol or tobacco and over 90 of youth reported ever using cocaine at both sites Reported lifetime use of amphetamines and ecstasy is more prevalent in street-involved youth from Victoria (53 and 95) than Vancouver (38 and 83)20
Table 23 Consequences of substance use by BC youth in the past year41
31261210109885421
52
4229171555
105
10721
46
Males FemalesWas told I did something I couldnrsquot rememberPassed outGot injuredArgued with family membersDamaged propertyGot in trouble with policeSchoolwork or grades changedGot into a physical fightLost friends or broke up with a girlfriend or boyfriendHad sex when I didnrsquot want toOverdosedHad to get treatment for alcohol or drug abuseUsed alcohol or drugs but none of this things happened
JBack to Table of Content
SUBSTANCE USE TRENDS
28 Y BC DOAP REPORT 2014 Y
Figure 218 shows past 30 day substance use in Vancouver in 2012 More recent data (2013) for Victoria (Figure 219) shows alcohol use in the past 30 days reached its lowest reported prevalence (595) while crystal meth use (811) shows a
steep increase since the second 2011 wave (28) Crack LSD and heroin use declined between the two 2013 waves however this is a small convenience sample (n=50 per wave per city) so rates may be unstable20
Figure 217 Percentage of Vancouver and Victoria street-involved youth who have ever used substances 201220
Perc
enta
ge
Vancouver Victoria
100
90
80
70
60
50
40
30
20
10
0
AlcoholMarijuanaTobaccoCocaineCrackAmphetamineCrystal MethHeroinEcstasyLSDMagic Mushrooms
Figure 218 Substance use trends in the past 30 days among street-involved youth in Vancouver 2008-201220
Perc
enta
ge
100908070605040302010
0
Cocaine Crack Crystal Meth Heroin Marijuana Alcohol
2008 Wave 1
2008 Wave 2
2009Wave 1
2009Wave 2
2010Wave 1
2010Wave 2
2011Wave 1
2011Wave 2
2012 Wave 1
2012 Wave 2
29Y BC DOAP REPORT 2014 Y
CHAPTER 2
When asked about the perceived benefits of drug use in 2013 reasons most cited were helping with social connections alleviating symptoms of mental and physical illness and making respondents feel happy calm and in some cases more productive20
The At-Risk Youth Survey (ARYS) led by UHRI studies risk factors for 14-26 year old street-involved youth in Vancouver Figure 220 represents drugs used by any route at least weekly among ARYS
participants Reported marijuana use declined considerably be-tween 2012 and 2013 However crystal methamphetamine use has increased over the past 3 years similar to that seen in the high-risk youth in Victoria (Figure 219) The proportion of ARYS participants reporting weekly crack use in 2013 (164) is considerably lower than the older Vancouver-based VIDUS and ACCESS cohorts (Figure 28) for which crack was the most widely used substance that year
Perc
enta
ge
Note each category in the graph captures both injection and non-injection use of the specified drug(BC Centre for Excellence in HIVAIDS personal communication June 10 2014)
80
70
60
50
40
30
20
10
0
Figure 220 Weekly drug use patterns among street-involved youth who use illicit drugs in Vancouver Canada 2005-2013
Cocaine Crack Crystal Meth Heroin Injection Marijuana Prescription Opioids
2005 2006 2007 2008 2009 2010 2011 2012 2013
Figure 219 Substance use trends in the past 30 days among street-involved youth in Victoria 2008-201320Pe
rcen
tage
1009080706050403020100
2008 Wave 1
2008 Wave 2
2009Wave 1
2009Wave 2
2010Wave 1
2010Wave 2
2011Wave 1
2011Wave 2
2012 Wave 1
2012 Wave 2
2013Wave 1
2013Wave 2
Cocaine Crack Crystal Meth Heroin Marijuana Alcohol

JBack to Table of Content
SUBSTANCE USE TRENDS
14 Y BC DOAP REPORT 2014 Y
Figure 22 presents per capita alcohol consumption for individuals 15 and older in BC and Canada between 199899 and 201213 Alcohol consumption in Canada and BC steadily increased until 200708 Alcohol consumption in BC consistently exceeds the Canadian average Please note that the Alcohol and Other Drug
(AOD) monitoring project estimates of alcohol consumption are higher because they include UBrew and UVin sales20 UBrews and UVins are businesses that sell ingredients and equipment used to produce beer wine ciders or coolers20
Figure 22 Annual per capita age 15+ alcohol consumption for BC and Canada in litres of absolute alcohol 199899 to 20121320
Litr
es o
f abs
olut
e al
coho
l per
per
son
per y
ear
Fiscal Year
95
848
810
90 British Columbia(AOD Monitoring Project)
British Columbia Rates(Statistics Canada) Canada Rates
(Statistics Canada)
85
80
75
709899 9900 0001 0102 0203 0304 0405 0506 0607 0708 0809 0910 1011 1112 1213
15Y BC DOAP REPORT 2014 Y
CHAPTER 2
Per capita alcohol consumption based on 2011 alcohol sales data (reported in litres of absolute alcohol) among resident adults (15 years and older) for the 16 HSDA in BC is shown in figure 23 The rate was calculated by the sales per resident population the highest rate at 1331 litres per adult was in the northern
geographic region of North ShoreCoast Garibaldi HSDA (which includes Bella Coola Valley) The lowest rate 451 litre per adult was in Richmond As seen in Figure 23 alcohol use is higher in the northern and eastern interior regions of BC compared to the rest of the province20
32 22
3123
12
11
13
Kewlona
14Kamploops
21
33 B
Victoria
42
41
43
43
33 A
52
Prince George
51
Fort Nelson
53
11 East Kootenay (1169 L)12 Kootenay Boundary (1113 L)13 Okanagan (1145 L)14 Thompson Cariboo Shuswap (1078L)21 Fraser East (720 L)22 Fraser North (583 L)23 Fraser South (648 L)31 Richmond (451 L)32 Vancouver (772 L)
33 A North ShoreCoast Garibaldi North (1331 L)33 B North ShoreCoast Garibaldi South (1049 L)41 South Vancouver Island (996 L)42 Central Vancouver Island (1014 L)43 North Vancouver Island (1147 L)51 Northwest (1137 L)52 Northern Interior (936 L)53 Northeast (1064 L)
gt 1400 L
1250 L - 1400 L
1100 L - 1249 L
950 L - 1099 L
800 L - 949 L
lt 800 L
Per Capita1 Litres (L) of Absolute Alcohol Consumption 1 15 years and older
N
Figure 23 Per capita alcohol consumption by HSDA in BC in 201220
JBack to Table of Content
SUBSTANCE USE TRENDS
16 Y BC DOAP REPORT 2014 Y
Self-reported tobacco use among males and females in BC is consistently lower than the rest of Canada However cannabis use in both sexes was higher in BC and an increase was reported
among BC males in 2012 (Figure 24a) Males in BC and the rest of Canada were significantly (p lt 005) more likely than females to report cannabis use (Figure 24b)
Figure 24 CADUMS substance use trends in BC and Canada by gender 2008-2012 a) Prevalence of tobacco smoking in the past year b) Prevalence of cannabis use in the past 12 months20
25
20
15
10
5
0
192161147119
2008Year 2009 2010 2011 2012
a) Prevalence of smoking in past year among Canadians aged 15+ by gender 2008-2012
Smok
ers
()
BCFemales
Rest of CanadaFemales
BCMales
Rest of CanadaMales
20
15
10
5
0
190
129
8967
2008Year 2009 2010 2011 2012
b) Prevalence of cannabis use in the past 12 months among Canadians 15+ by gender 2008-2012
Cann
abis
use
rs (
)
BCFemales
Rest of CanadaFemales
BCMales
Rest of CanadaMales
17Y BC DOAP REPORT 2014 Y
CHAPTER 2
CADUMS reported the prevalence of lifetime cannabis use in BC in 2011 as 4436 As shown in Figure 25 the Kootenay Boundary HSDA has the highest prevalence of lifetime cannabis
use (62) closely followed by Northern Interior (61) North-east (60) and South Vancouver Island (57) Richmond has the lowest prevalence of lifetime cannabis use (35)20
12
11
13
Kewlona
14Kamploops
21
42
42
Victoria41
43
43
33
52
Prince George
51
Fort Nelson
53
11 East Kootenay (430)12 Kootenay Boundary (6200)13 Okanagan (516)14 Thompson Cariboo Shuswap (492)21 Fraser East (414)22 Fraser North (446)23 Fraser South (456)31 Richmond (344)
32 Vancouver (465)33 North ShoreCoast Garibaldi (524)41 South Vancouver Island (573)42 Central Vancouver Island (511)43 North Vancouver Island (528)51 Northwest (536)52 Northern Interior (611)53 Northeast (603)
Percent Lifetime Cannabis Use Among Adults1 1 age15 years or older
537 ndash 620
512 ndash 536
447 ndash 511
344 ndash 446
Classified using quartiles
N
Figure 25 Percentage of lifetime cannabis use by HSDA in BC 2008-200920
22
31 23
32
33
JBack to Table of Content
SUBSTANCE USE TRENDS
18 Y BC DOAP REPORT 2014 Y
Figure 26 illustrates the prevalence of illicit substance use (other than cannabis) in the past 12 months among adults aged 15 and older reported by CADUMS Prevalence was estimated using the number of the people who reported using any illicit drugs including cocaine speed methamphetamine ecstasy hallucinogens inhalants heroin pain relievers stimulants and
sedatives divided by the sample population In BC and the rest of Canada males were more likely than females to use illicit substances and the prevalence of illicit drug use between 2008 and 2012 is significantly higher (p lt 005) in BC compared to the rest of Canada20
0 High Risk Populations and Substance Use CARBCrsquos High Risk Populations survey is a convenience sample of 50 street-involved adults and 50 adults using drugs recreationally in Vancouver and Victoria every six months These high risk populations report higher alcohol cannabis and other illicit substances use compared to the general population However substance use patterns vary between these two high-risk populations Figure 27 shows that in 2012 1 of recreational drug using adults compared to 78 of street-involved adults reported crack cocaine use in the previous month while 88 versus 6 in the same groups used ecstasy There are also
statistically significant differences in crystal methamphetamine heroin LSD and mushroom use20
The survey also found 36 of the recreational-use adult co-horts in Vancouver and Victoria reported simultaneous alcohol and marijuana use over the previous weekend and 11 reported simultaneous use of alcohol and cocaine Using more than one substance at a time (poly-substance use) was lower among street-involved adults the most frequently mixed substances being alcohol and marijuana (10) followed by crystal meth and heroin (75)20
7
6
5
4
3
2
1
0
Figure 26 CADUMS substance use trends in BC and Canada by gender 2008-2012 Prevalence of other illicit substance use (excluding cannabis) in the past 12 months20
Prevalence of other illicit substance use (excluding cannabis) in the past year among Canadians 15+ by gender 2008-2012
2008Year 2009 2010 2011 2012
BCFemales
Rest of CanadaFemales
BCMales
Rest of CanadaMales
Illic
it dr
ug u
sers
()
- 47
36
16 14
BC numbers for females 2011-12 and males 2011 were suppressed due to unstable estimates
19Y BC DOAP REPORT 2014 Y
CHAPTER 2
Drugs used at least weekly reported by the VIDUS and ACCESS cohorts are shown in Figure 28 and 29 Figure 28 indicates considerable changes in weekly drug use (by any route) over time Cocaine use declined since 1996 while crack cocaine use
increased from 51 in 1996 to 706 in 2008 but declined to 34 in 2013 Crystal methamphetamine use reached its highest recorded level in 2013 (178 )
Figure 27 Past month substance use in high risk populations in Victoria and Vancouver 2012 (Wave 2)20
Alcohol Marijuana Tobacco CocaineCrack Amphetamine Crystal Meth HeroinEcstasy LSD Magic Mushrooms
Perc
enta
ge
Street involved adults Recreational Adults
100
8068
72
91
52
78
13
40
9689
7469
1
25
6 3
88
55
75
40
6 510
60
40
20
0
Figure 28 Weekly drug use patterns among people who use illicit drugs in Vancouver Canada 1996-2013
1996 1997 1998 1999 2000 2001 2002 2003 2004 2005 2006 2007 2008 2009 2010 2011 2012 2013
80
70
60
50
40
30
20
10
0
Perc
enta
ge
Cocaine Crack Crystal Meth Heroin Marijuana Prescription opioids
(BC Centre for Excellence in HIVAIDS personal communication June 10 2014) Note each category in the graph captures both injection and non-injection use of the specified drug
JBack to Table of Content
SUBSTANCE USE TRENDS
20 Y BC DOAP REPORT 2014 Y
Figure 29 shows weekly drug use by route of administration illicit prescription opioid use (ie use of prescription opioids without a valid prescription) includes OxyContin (oxycodone) Percocet (oxycodonetylenol) Tylenol 3 (codeinetylenol) morphine Dilaudid (hydromorphone) Demerol (meperidine or pethadine) methadone fentanyl hydrocodone and Talwin (pentazocine)
Most high-risk drug use research in BC is conducted in Vancouver and Victoria To gain a better understanding of drug use outside these two cities over 700 clients using harm
reduction distribution sites throughout BC were surveyed in 2012 and 2013 (HR client survey)2223 In 2013 drug use was weighted by HSDA population the three most commonly used substances were marijuana (51) alcohol (48) and crack (35) Substance use patterns vary between regions as seen in Figure 210 Crack use was highest in NH (67) and lowest in VCH (33) Powdered cocaine use was also highest in the NH region By contrast reported use of heroin and crystal meth was lower in NH compared to other regions of BC and highest in FH (54 and 48 respectively)23
Figure 29 Weekly substance use prevalence among people who use illicit drugs in Vancouver Canada 2013
Perc
enta
ge
Cocaine Injectio
n
Cocaine Non-Injectio
n
Crystal M
eth Injectio
n
Crystal M
eth Non-Injectio
n
Crack Non-In
jection
Prescrip
tion Opioid In
jection
Prescrip
tion Opioid Non-In
jection
Heroin Injectio
n
Marijuana Non-In
jection
(BC Centre for Excellence in HIVAIDS personal communication June 10 2014)
40
35
30
25
193
34
149
79
340
86
49
261 252
20
15
10
5
0
21Y BC DOAP REPORT 2014 Y
CHAPTER 2
0 Substance Availability and CostThe availability of illicit drugs in Vancouver is reported by UHRI as the percentage of PWUD who can obtain the drug within 10 minutes PWUD in Vancouver were more likely able to obtain crack cocaine (80) cocaine (70) and heroin (70) than cannabis (65) or crystal methamphetamine within 10 minutes in 2011
URHI cohort participants identified the cost of drugs has been stable over the past 10 years
- Heroin $20 per 01 gram since 2001
- Powder cocaine and crack cocaine $10 per 01 gram
- Crystal methamphetamine $10 per 01 gram
The availability and consistent price of drugs in the Vancouver area does not support the claim that law enforcement efforts have reduced the available drug supply and increased the cost of illicit substances18
The Centre for Addiction Research of BC (CARBC)rsquos High Risk Population survey in Vancouver and Victoria shows similar trends in drug prices and availability Since 2008 cocaine crack heroin and crystal meth have been reported by street-involved adults in both cities as being either ldquoeasyrdquo or ldquovery easyrdquo to obtain Furthermore the reported street prices of these substances are very similar to those reported in UHRIrsquos research and have fluctuated little over the years20 More information on drug trafficking can be found in the enforcement chapter of this report
The 2014 UNODC World Drug Report identifies Canada as the country with the highest consumption of prescription opioids with 8122 mg per capita of morphine equivalence (see Table 21) the next highest is United States at 74979 mg per capita24 Canadarsquos high rate of pain medication prescribing and availability has serious implications for drug-related harms and diversion
Figure 210 Percent of HR clients reporting substance use in the past week by HA weighted by HSDA population 201323
70
60
50
40
30
20
10
0
Marijuana Alcohol Crack Heroin Crystal Meth Cocaine
FH VCH VIHA IH NH
Perc
enta
ge
JBack to Table of Content
SUBSTANCE USE TRENDS
22 Y BC DOAP REPORT 2014 Y
0 OxycontinOxyContin a patented prescription version of oxycodone used to treat moderate to intense pain was discontinued in Canada in March 201225 OxyContin was a slow-release narcotic when taken orally as intended however users could release high levels of the drug instantaneously by crushing and snorting the tablet OxyNEO was introduced by the same manufacturer Purdue Pharma as a replacement drug that was designed to be harder to crush and dissolve limiting abuse through snorting and injecting2526 Since its introduction several provincial health plans altered their drug coverage to restrict coverage of OxyNEO In BC only exceptional case-by-base coverage requests for OxyNEO are considered and it is only covered through the palliative care plan2728 There are concerns that the recent lack of OxyContin is leading some opioid dependant users to seek out more accessible and potentially more dangerous opioids A US-based study found that after the formulation changed misuse of OxyContin among patients undergoing opioid dependence treatment decreased from 356 to 12829 However fentanyl and hydromorphone use increased among these patients and heroin use doubled29
Although the replacement of OxyContin with OxyNEO was intended to address concerns over misuse of the drug Health Canadarsquos subsequent decision in November
2012 to approve generic production of extended release oxycodone allowed off-brand versions to enter the Canadian pharmaceutical market30 These generic versions are not currently covered under BCrsquos provincial formulary28
0 Medical MarijuanaThere have been recent developments regarding medical marijuana licensing Health Canadarsquos 2014 proposed Marijuana for Medical Purposes Regulations (MMPR) required patients to end home production of medical marijuana on April 1 201431 However following a consti-tutional challenge to the MMPR a Federal Court granted an injunction on March 21 201432 This allows those with personal and designated production licenses (for persons responsible for the patient) to continue home production of medical marijuana until the case goes to trial in spring 201532 The injunction does not affect Health Canadarsquos new medical marijuana licensing system for dispensing prescribed marijuana and there are concerns that new patients will have difficulty affording the higher marijuana prices projected to result from the federal legislation32 On a related note licensed sales of recreational marijuana began in Washington State on July 8 201433 This may have implications on illicit cannabis trade with BC given the US statersquos close proximity
Table 21 Morphine equivalence consumption per capita Canada 2011
Drug mgcapita ME mgcapita
Fentanyl
Hydromorphone
Methadone
Morphine
Oxycodone
Pethidine
Total Morphine Equivalence
24366
250938
200946
874741
1458966
71278
2030396
1254691
2003782
874741
1940425
17820
8121855
httpwwwpainpolicywisceducountryprofilecanada
23Y BC DOAP REPORT 2014 Y
CHAPTER 2
0 FentanylBC has experienced a recent increase in fentanyl availability and fentanyl-detected deaths Fentanyl is a synthetic narcotic that is used to relieve intense pain In BC fentanyl can be prescribed for pain management as a transdermal patch which provides sustained release of the drug34 However this formulation is susceptible to abuse through the extraction of patch contents and subsequent intrave-nous injection35 Fentanyl is 50-100 times more potent than morphine which greatly increases the risk of accidental overdose36 Early signs of fentanyl overdose include severe sleepiness slow heartbeat difficulty breathing coldclammy skin and trouble with walking or talking36
The RCMP and municipal police forces in BC have identi-fied illegally manufactured fentanyl as a white powder resembling heroin and in tablet form as counterfeit oxycodone (fake oxy) tablets3738 Illegally-produced fentanyl can be significantly more toxic than the pharma-ceutical-grade39 Tablets containing fentanyl are green and are stamped with ldquoCDNrdquo and the number 80 on the opposite sides (Figure 211) These pills are nicknamed ldquogreen jelliesrdquo and ldquostreet oxyrdquo in Western Canada37 White tablets with ldquoCDNrdquo and ldquo10rdquo stamped on them have also appeared in British Columbia (Figure 211) Seized quan-tities of these two versions tested positive for fentanyl 89 of the time and contain variable sometimes very high dose of fentanyl37 Individuals using these drugs may be under the assumption that they contain oxycodone only and are therefore at high risk of accidental overdose
On May 30th 2013 in response to an increase in fentayl- detected deaths in BC a joint alert was issued by the Provincial Health Officer BC Coroners Service (BCCS) healthcare and enforcement partners warning the public of the increase in deaths and availability of fentanyl within the street drug market After the alert fentanyl- detected deaths declined in June and July 2013 but have since increased In 2012 there were 15 fentanyl-detected deaths a total of 51 fentanyl-detected deaths were iden-tified in BC in 2013 most 2013 fentanyl-detected deaths occurred in Metro Vancouver region (15) Island (14) and Fraser (12) (Figure 212)
Preliminary data from the BCCS indicates 49 fentanyl- detected deaths occurred in the first eight months of 2014 (January 1st to August 31st) of these 10 occurred in the City of Vancouver and 18 in the Fraser region about a third (16) were female Please note that 2013 and 2014 data are preliminary and subject to change and these deaths only include fentanyl found in illicit drug-related circumstances and exclude overdose deaths in persons prescribed fentanyl40
In June 2014 the BCCS issued another public warning urging all PWUD to exercise extreme caution when consuming substances that may contain fentanyl More information regarding fentanyl can be found in the Mortality section37
Figure 211 Samples of seized counterfeit oxycodone tablets39
JBack to Table of Content
SUBSTANCE USE TRENDS
24 Y BC DOAP REPORT 2014 YN
umbe
r of D
eath
s
16
141210
8642
2012 2013 Jan 1-Aug 31 20140
Fraser 6
3
2
3
115
12
15
14
3
751
18
12
7
7
549
Metro
Island
InteriorNorthern
Total
Figure 212 Fentanyl-detected deaths by BCCS region 2012-201440
Figure 213 Fentanyl-detected deaths by sex 2012-201440
50
40
30
20
10
02012 2013 Jan 1-Aug 31 2014
Male
Female
12
3
42
9
33
16
Num
ber o
f Dea
ths
25Y BC DOAP REPORT 2014 Y
CHAPTER 2
0 Youth YOUTH IN SCHOOLThe McCreary Centre Society recruits grade 7-12 students in public schools throughout BC to participate in the Adolescent Health Survey (AHS) every five years Since these participants are in school they are unlikely to have major substance use problems The 2013 survey had 259138 participants and found that self-reported substance use among BC adolescents has declined since 2003 (Figures 214 and 215) Alcohol was the
most commonly used substance in 2013 with 45 of BC youth reporting that they had tried it41
Self-reported use of steroids heroin inhalants amphetamines or cocaine has remained stable or declined since 2003 Adolescent use of prescription pills peaked in 2008
Figure 214 Percentage of BC youth who have ever used alcohol cannabis tobacco 2003-201341
Perc
enta
ge
60
55
50
45
40
35
30
25
20 2003 2008 2013
Alcohol
Cannabis
Tobacco
2003 2008 2013
Figure 215 Percentage of BC youth who have ever used prescription pills illicit substances 2003-201341
16
14
12
10
8
6
4
2
0
Cocaine
Prescription Pills
Amphetamines
Heroin
Hallucinogens
Mushrooms
Steriods
Inhalants
Perc
enta
ge
JBack to Table of Content
SUBSTANCE USE TRENDS
26 Y BC DOAP REPORT 2014 Y
Although some students experiment with alcohol and cannabis before the age of 13 the majority (65) who tried alcohol and cannabis did so between the ages of 13 and 15 (Figure 216)41
Table 22 summarizes the self-reported reasons among adolescents for their most recent substance use event The most cited reason was ldquoI wanted to have funrdquo followed by ldquomy friends were doing itrdquo and ldquoI wanted to try itexperimentrdquo
Mental health factors were also reported as reasons for drug use lsquobecause of stressrsquo or feeling ldquodown or sadrdquo Youth who reported self-harm in the past year were more likely to use substances compared to those who had not self-harmed (43 vs 14 respectively)41
Figure 216 Age when BC youth used alcohol or cannabis for the first time41
Perc
enta
ge
Age (years)
25
20
15
10
5
0lt9 9 10 11 12 13 14 15 gt1716
AlcoholCannabis
_
6029271611
9533211
21
693729252110
743211
16
Table 22 Reasons for last time substance uses for BC youth41
Males FemalesI wanted to have funMy friends were doing itI wanted to try itexperimentBecause of stressI felt down or sadI felt like there was nothing else to doTo manage physical painI was pressured into doing itI thought it would help me focusBecause of an addictionI didnrsquot mean to do itTo change the effects of some other drug(s)Other
27Y BC DOAP REPORT 2014 Y
CHAPTER 2
About half of youth who used substances in the past year reported negative consequences The most frequent responses were ldquodoing something they could not rememberrdquo ldquopassing outrdquo and ldquogetting injuredrdquo (Table 23)41
Substance use trends from the 2013 East Kootenay Addiction Service Society (EKASS) survey are similar to the AHS data Since 2005 the proportion of East Kootenay area in-school youth experimenting with substances has declined In 2013 females reported using fewer substances than males This is in contrast to prior years for example alcohol use was 720 for girls and 703 for boys in 2007 but was 585 and 620 in 2013 similarly cannabis use for girls and boys was 362 and 354 in 2007 but 273 and 336 respectively in 201342
The EKASS reports the proportion of students admitting to being in a car with an alcohol-impaired driver reached a high of 601 in 2009 but was 464 in 2013 a consid-erable decrease but still unacceptably high Youth who reported driving after drinking alcohol also dropped from 201 in 2005 to 120 in 2013 Rate of self-reports of
being a passenger in a car with a cannabis-impaired driver was 295 in 2011 These declines may also reflect the overall decrease in substance use among youth42
HIGH RISK YOUTHThe proportion of lifetime drug use among a convenience sample of Vancouver and Victoria area street-involved youth aged 15-24 in the CARBC high risk survey is considerably higher than the in-school youth surveys (Figure 217) Although 2013 data is available for Victoria the most recent data available for Vancouver is 2012 In 2012 marijuana use was more common than alcohol or tobacco and over 90 of youth reported ever using cocaine at both sites Reported lifetime use of amphetamines and ecstasy is more prevalent in street-involved youth from Victoria (53 and 95) than Vancouver (38 and 83)20
Table 23 Consequences of substance use by BC youth in the past year41
31261210109885421
52
4229171555
105
10721
46
Males FemalesWas told I did something I couldnrsquot rememberPassed outGot injuredArgued with family membersDamaged propertyGot in trouble with policeSchoolwork or grades changedGot into a physical fightLost friends or broke up with a girlfriend or boyfriendHad sex when I didnrsquot want toOverdosedHad to get treatment for alcohol or drug abuseUsed alcohol or drugs but none of this things happened
JBack to Table of Content
SUBSTANCE USE TRENDS
28 Y BC DOAP REPORT 2014 Y
Figure 218 shows past 30 day substance use in Vancouver in 2012 More recent data (2013) for Victoria (Figure 219) shows alcohol use in the past 30 days reached its lowest reported prevalence (595) while crystal meth use (811) shows a
steep increase since the second 2011 wave (28) Crack LSD and heroin use declined between the two 2013 waves however this is a small convenience sample (n=50 per wave per city) so rates may be unstable20
Figure 217 Percentage of Vancouver and Victoria street-involved youth who have ever used substances 201220
Perc
enta
ge
Vancouver Victoria
100
90
80
70
60
50
40
30
20
10
0
AlcoholMarijuanaTobaccoCocaineCrackAmphetamineCrystal MethHeroinEcstasyLSDMagic Mushrooms
Figure 218 Substance use trends in the past 30 days among street-involved youth in Vancouver 2008-201220
Perc
enta
ge
100908070605040302010
0
Cocaine Crack Crystal Meth Heroin Marijuana Alcohol
2008 Wave 1
2008 Wave 2
2009Wave 1
2009Wave 2
2010Wave 1
2010Wave 2
2011Wave 1
2011Wave 2
2012 Wave 1
2012 Wave 2
29Y BC DOAP REPORT 2014 Y
CHAPTER 2
When asked about the perceived benefits of drug use in 2013 reasons most cited were helping with social connections alleviating symptoms of mental and physical illness and making respondents feel happy calm and in some cases more productive20
The At-Risk Youth Survey (ARYS) led by UHRI studies risk factors for 14-26 year old street-involved youth in Vancouver Figure 220 represents drugs used by any route at least weekly among ARYS
participants Reported marijuana use declined considerably be-tween 2012 and 2013 However crystal methamphetamine use has increased over the past 3 years similar to that seen in the high-risk youth in Victoria (Figure 219) The proportion of ARYS participants reporting weekly crack use in 2013 (164) is considerably lower than the older Vancouver-based VIDUS and ACCESS cohorts (Figure 28) for which crack was the most widely used substance that year
Perc
enta
ge
Note each category in the graph captures both injection and non-injection use of the specified drug(BC Centre for Excellence in HIVAIDS personal communication June 10 2014)
80
70
60
50
40
30
20
10
0
Figure 220 Weekly drug use patterns among street-involved youth who use illicit drugs in Vancouver Canada 2005-2013
Cocaine Crack Crystal Meth Heroin Injection Marijuana Prescription Opioids
2005 2006 2007 2008 2009 2010 2011 2012 2013
Figure 219 Substance use trends in the past 30 days among street-involved youth in Victoria 2008-201320Pe
rcen
tage
1009080706050403020100
2008 Wave 1
2008 Wave 2
2009Wave 1
2009Wave 2
2010Wave 1
2010Wave 2
2011Wave 1
2011Wave 2
2012 Wave 1
2012 Wave 2
2013Wave 1
2013Wave 2
Cocaine Crack Crystal Meth Heroin Marijuana Alcohol
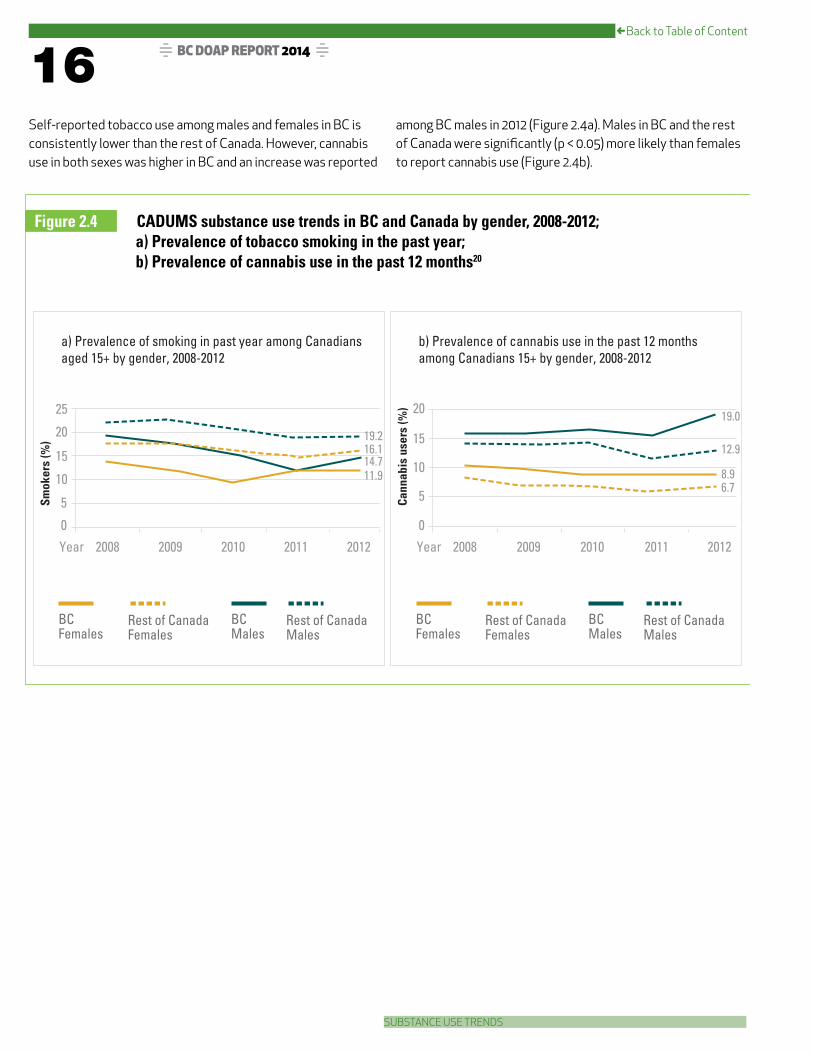
JBack to Table of Content
SUBSTANCE USE TRENDS
16 Y BC DOAP REPORT 2014 Y
Self-reported tobacco use among males and females in BC is consistently lower than the rest of Canada However cannabis use in both sexes was higher in BC and an increase was reported
among BC males in 2012 (Figure 24a) Males in BC and the rest of Canada were significantly (p lt 005) more likely than females to report cannabis use (Figure 24b)
Figure 24 CADUMS substance use trends in BC and Canada by gender 2008-2012 a) Prevalence of tobacco smoking in the past year b) Prevalence of cannabis use in the past 12 months20
25
20
15
10
5
0
192161147119
2008Year 2009 2010 2011 2012
a) Prevalence of smoking in past year among Canadians aged 15+ by gender 2008-2012
Smok
ers
()
BCFemales
Rest of CanadaFemales
BCMales
Rest of CanadaMales
20
15
10
5
0
190
129
8967
2008Year 2009 2010 2011 2012
b) Prevalence of cannabis use in the past 12 months among Canadians 15+ by gender 2008-2012
Cann
abis
use
rs (
)
BCFemales
Rest of CanadaFemales
BCMales
Rest of CanadaMales
17Y BC DOAP REPORT 2014 Y
CHAPTER 2
CADUMS reported the prevalence of lifetime cannabis use in BC in 2011 as 4436 As shown in Figure 25 the Kootenay Boundary HSDA has the highest prevalence of lifetime cannabis
use (62) closely followed by Northern Interior (61) North-east (60) and South Vancouver Island (57) Richmond has the lowest prevalence of lifetime cannabis use (35)20
12
11
13
Kewlona
14Kamploops
21
42
42
Victoria41
43
43
33
52
Prince George
51
Fort Nelson
53
11 East Kootenay (430)12 Kootenay Boundary (6200)13 Okanagan (516)14 Thompson Cariboo Shuswap (492)21 Fraser East (414)22 Fraser North (446)23 Fraser South (456)31 Richmond (344)
32 Vancouver (465)33 North ShoreCoast Garibaldi (524)41 South Vancouver Island (573)42 Central Vancouver Island (511)43 North Vancouver Island (528)51 Northwest (536)52 Northern Interior (611)53 Northeast (603)
Percent Lifetime Cannabis Use Among Adults1 1 age15 years or older
537 ndash 620
512 ndash 536
447 ndash 511
344 ndash 446
Classified using quartiles
N
Figure 25 Percentage of lifetime cannabis use by HSDA in BC 2008-200920
22
31 23
32
33
JBack to Table of Content
SUBSTANCE USE TRENDS
18 Y BC DOAP REPORT 2014 Y
Figure 26 illustrates the prevalence of illicit substance use (other than cannabis) in the past 12 months among adults aged 15 and older reported by CADUMS Prevalence was estimated using the number of the people who reported using any illicit drugs including cocaine speed methamphetamine ecstasy hallucinogens inhalants heroin pain relievers stimulants and
sedatives divided by the sample population In BC and the rest of Canada males were more likely than females to use illicit substances and the prevalence of illicit drug use between 2008 and 2012 is significantly higher (p lt 005) in BC compared to the rest of Canada20
0 High Risk Populations and Substance Use CARBCrsquos High Risk Populations survey is a convenience sample of 50 street-involved adults and 50 adults using drugs recreationally in Vancouver and Victoria every six months These high risk populations report higher alcohol cannabis and other illicit substances use compared to the general population However substance use patterns vary between these two high-risk populations Figure 27 shows that in 2012 1 of recreational drug using adults compared to 78 of street-involved adults reported crack cocaine use in the previous month while 88 versus 6 in the same groups used ecstasy There are also
statistically significant differences in crystal methamphetamine heroin LSD and mushroom use20
The survey also found 36 of the recreational-use adult co-horts in Vancouver and Victoria reported simultaneous alcohol and marijuana use over the previous weekend and 11 reported simultaneous use of alcohol and cocaine Using more than one substance at a time (poly-substance use) was lower among street-involved adults the most frequently mixed substances being alcohol and marijuana (10) followed by crystal meth and heroin (75)20
7
6
5
4
3
2
1
0
Figure 26 CADUMS substance use trends in BC and Canada by gender 2008-2012 Prevalence of other illicit substance use (excluding cannabis) in the past 12 months20
Prevalence of other illicit substance use (excluding cannabis) in the past year among Canadians 15+ by gender 2008-2012
2008Year 2009 2010 2011 2012
BCFemales
Rest of CanadaFemales
BCMales
Rest of CanadaMales
Illic
it dr
ug u
sers
()
- 47
36
16 14
BC numbers for females 2011-12 and males 2011 were suppressed due to unstable estimates
19Y BC DOAP REPORT 2014 Y
CHAPTER 2
Drugs used at least weekly reported by the VIDUS and ACCESS cohorts are shown in Figure 28 and 29 Figure 28 indicates considerable changes in weekly drug use (by any route) over time Cocaine use declined since 1996 while crack cocaine use
increased from 51 in 1996 to 706 in 2008 but declined to 34 in 2013 Crystal methamphetamine use reached its highest recorded level in 2013 (178 )
Figure 27 Past month substance use in high risk populations in Victoria and Vancouver 2012 (Wave 2)20
Alcohol Marijuana Tobacco CocaineCrack Amphetamine Crystal Meth HeroinEcstasy LSD Magic Mushrooms
Perc
enta
ge
Street involved adults Recreational Adults
100
8068
72
91
52
78
13
40
9689
7469
1
25
6 3
88
55
75
40
6 510
60
40
20
0
Figure 28 Weekly drug use patterns among people who use illicit drugs in Vancouver Canada 1996-2013
1996 1997 1998 1999 2000 2001 2002 2003 2004 2005 2006 2007 2008 2009 2010 2011 2012 2013
80
70
60
50
40
30
20
10
0
Perc
enta
ge
Cocaine Crack Crystal Meth Heroin Marijuana Prescription opioids
(BC Centre for Excellence in HIVAIDS personal communication June 10 2014) Note each category in the graph captures both injection and non-injection use of the specified drug
JBack to Table of Content
SUBSTANCE USE TRENDS
20 Y BC DOAP REPORT 2014 Y
Figure 29 shows weekly drug use by route of administration illicit prescription opioid use (ie use of prescription opioids without a valid prescription) includes OxyContin (oxycodone) Percocet (oxycodonetylenol) Tylenol 3 (codeinetylenol) morphine Dilaudid (hydromorphone) Demerol (meperidine or pethadine) methadone fentanyl hydrocodone and Talwin (pentazocine)
Most high-risk drug use research in BC is conducted in Vancouver and Victoria To gain a better understanding of drug use outside these two cities over 700 clients using harm
reduction distribution sites throughout BC were surveyed in 2012 and 2013 (HR client survey)2223 In 2013 drug use was weighted by HSDA population the three most commonly used substances were marijuana (51) alcohol (48) and crack (35) Substance use patterns vary between regions as seen in Figure 210 Crack use was highest in NH (67) and lowest in VCH (33) Powdered cocaine use was also highest in the NH region By contrast reported use of heroin and crystal meth was lower in NH compared to other regions of BC and highest in FH (54 and 48 respectively)23
Figure 29 Weekly substance use prevalence among people who use illicit drugs in Vancouver Canada 2013
Perc
enta
ge
Cocaine Injectio
n
Cocaine Non-Injectio
n
Crystal M
eth Injectio
n
Crystal M
eth Non-Injectio
n
Crack Non-In
jection
Prescrip
tion Opioid In
jection
Prescrip
tion Opioid Non-In
jection
Heroin Injectio
n
Marijuana Non-In
jection
(BC Centre for Excellence in HIVAIDS personal communication June 10 2014)
40
35
30
25
193
34
149
79
340
86
49
261 252
20
15
10
5
0
21Y BC DOAP REPORT 2014 Y
CHAPTER 2
0 Substance Availability and CostThe availability of illicit drugs in Vancouver is reported by UHRI as the percentage of PWUD who can obtain the drug within 10 minutes PWUD in Vancouver were more likely able to obtain crack cocaine (80) cocaine (70) and heroin (70) than cannabis (65) or crystal methamphetamine within 10 minutes in 2011
URHI cohort participants identified the cost of drugs has been stable over the past 10 years
- Heroin $20 per 01 gram since 2001
- Powder cocaine and crack cocaine $10 per 01 gram
- Crystal methamphetamine $10 per 01 gram
The availability and consistent price of drugs in the Vancouver area does not support the claim that law enforcement efforts have reduced the available drug supply and increased the cost of illicit substances18
The Centre for Addiction Research of BC (CARBC)rsquos High Risk Population survey in Vancouver and Victoria shows similar trends in drug prices and availability Since 2008 cocaine crack heroin and crystal meth have been reported by street-involved adults in both cities as being either ldquoeasyrdquo or ldquovery easyrdquo to obtain Furthermore the reported street prices of these substances are very similar to those reported in UHRIrsquos research and have fluctuated little over the years20 More information on drug trafficking can be found in the enforcement chapter of this report
The 2014 UNODC World Drug Report identifies Canada as the country with the highest consumption of prescription opioids with 8122 mg per capita of morphine equivalence (see Table 21) the next highest is United States at 74979 mg per capita24 Canadarsquos high rate of pain medication prescribing and availability has serious implications for drug-related harms and diversion
Figure 210 Percent of HR clients reporting substance use in the past week by HA weighted by HSDA population 201323
70
60
50
40
30
20
10
0
Marijuana Alcohol Crack Heroin Crystal Meth Cocaine
FH VCH VIHA IH NH
Perc
enta
ge
JBack to Table of Content
SUBSTANCE USE TRENDS
22 Y BC DOAP REPORT 2014 Y
0 OxycontinOxyContin a patented prescription version of oxycodone used to treat moderate to intense pain was discontinued in Canada in March 201225 OxyContin was a slow-release narcotic when taken orally as intended however users could release high levels of the drug instantaneously by crushing and snorting the tablet OxyNEO was introduced by the same manufacturer Purdue Pharma as a replacement drug that was designed to be harder to crush and dissolve limiting abuse through snorting and injecting2526 Since its introduction several provincial health plans altered their drug coverage to restrict coverage of OxyNEO In BC only exceptional case-by-base coverage requests for OxyNEO are considered and it is only covered through the palliative care plan2728 There are concerns that the recent lack of OxyContin is leading some opioid dependant users to seek out more accessible and potentially more dangerous opioids A US-based study found that after the formulation changed misuse of OxyContin among patients undergoing opioid dependence treatment decreased from 356 to 12829 However fentanyl and hydromorphone use increased among these patients and heroin use doubled29
Although the replacement of OxyContin with OxyNEO was intended to address concerns over misuse of the drug Health Canadarsquos subsequent decision in November
2012 to approve generic production of extended release oxycodone allowed off-brand versions to enter the Canadian pharmaceutical market30 These generic versions are not currently covered under BCrsquos provincial formulary28
0 Medical MarijuanaThere have been recent developments regarding medical marijuana licensing Health Canadarsquos 2014 proposed Marijuana for Medical Purposes Regulations (MMPR) required patients to end home production of medical marijuana on April 1 201431 However following a consti-tutional challenge to the MMPR a Federal Court granted an injunction on March 21 201432 This allows those with personal and designated production licenses (for persons responsible for the patient) to continue home production of medical marijuana until the case goes to trial in spring 201532 The injunction does not affect Health Canadarsquos new medical marijuana licensing system for dispensing prescribed marijuana and there are concerns that new patients will have difficulty affording the higher marijuana prices projected to result from the federal legislation32 On a related note licensed sales of recreational marijuana began in Washington State on July 8 201433 This may have implications on illicit cannabis trade with BC given the US statersquos close proximity
Table 21 Morphine equivalence consumption per capita Canada 2011
Drug mgcapita ME mgcapita
Fentanyl
Hydromorphone
Methadone
Morphine
Oxycodone
Pethidine
Total Morphine Equivalence
24366
250938
200946
874741
1458966
71278
2030396
1254691
2003782
874741
1940425
17820
8121855
httpwwwpainpolicywisceducountryprofilecanada
23Y BC DOAP REPORT 2014 Y
CHAPTER 2
0 FentanylBC has experienced a recent increase in fentanyl availability and fentanyl-detected deaths Fentanyl is a synthetic narcotic that is used to relieve intense pain In BC fentanyl can be prescribed for pain management as a transdermal patch which provides sustained release of the drug34 However this formulation is susceptible to abuse through the extraction of patch contents and subsequent intrave-nous injection35 Fentanyl is 50-100 times more potent than morphine which greatly increases the risk of accidental overdose36 Early signs of fentanyl overdose include severe sleepiness slow heartbeat difficulty breathing coldclammy skin and trouble with walking or talking36
The RCMP and municipal police forces in BC have identi-fied illegally manufactured fentanyl as a white powder resembling heroin and in tablet form as counterfeit oxycodone (fake oxy) tablets3738 Illegally-produced fentanyl can be significantly more toxic than the pharma-ceutical-grade39 Tablets containing fentanyl are green and are stamped with ldquoCDNrdquo and the number 80 on the opposite sides (Figure 211) These pills are nicknamed ldquogreen jelliesrdquo and ldquostreet oxyrdquo in Western Canada37 White tablets with ldquoCDNrdquo and ldquo10rdquo stamped on them have also appeared in British Columbia (Figure 211) Seized quan-tities of these two versions tested positive for fentanyl 89 of the time and contain variable sometimes very high dose of fentanyl37 Individuals using these drugs may be under the assumption that they contain oxycodone only and are therefore at high risk of accidental overdose
On May 30th 2013 in response to an increase in fentayl- detected deaths in BC a joint alert was issued by the Provincial Health Officer BC Coroners Service (BCCS) healthcare and enforcement partners warning the public of the increase in deaths and availability of fentanyl within the street drug market After the alert fentanyl- detected deaths declined in June and July 2013 but have since increased In 2012 there were 15 fentanyl-detected deaths a total of 51 fentanyl-detected deaths were iden-tified in BC in 2013 most 2013 fentanyl-detected deaths occurred in Metro Vancouver region (15) Island (14) and Fraser (12) (Figure 212)
Preliminary data from the BCCS indicates 49 fentanyl- detected deaths occurred in the first eight months of 2014 (January 1st to August 31st) of these 10 occurred in the City of Vancouver and 18 in the Fraser region about a third (16) were female Please note that 2013 and 2014 data are preliminary and subject to change and these deaths only include fentanyl found in illicit drug-related circumstances and exclude overdose deaths in persons prescribed fentanyl40
In June 2014 the BCCS issued another public warning urging all PWUD to exercise extreme caution when consuming substances that may contain fentanyl More information regarding fentanyl can be found in the Mortality section37
Figure 211 Samples of seized counterfeit oxycodone tablets39
JBack to Table of Content
SUBSTANCE USE TRENDS
24 Y BC DOAP REPORT 2014 YN
umbe
r of D
eath
s
16
141210
8642
2012 2013 Jan 1-Aug 31 20140
Fraser 6
3
2
3
115
12
15
14
3
751
18
12
7
7
549
Metro
Island
InteriorNorthern
Total
Figure 212 Fentanyl-detected deaths by BCCS region 2012-201440
Figure 213 Fentanyl-detected deaths by sex 2012-201440
50
40
30
20
10
02012 2013 Jan 1-Aug 31 2014
Male
Female
12
3
42
9
33
16
Num
ber o
f Dea
ths
25Y BC DOAP REPORT 2014 Y
CHAPTER 2
0 Youth YOUTH IN SCHOOLThe McCreary Centre Society recruits grade 7-12 students in public schools throughout BC to participate in the Adolescent Health Survey (AHS) every five years Since these participants are in school they are unlikely to have major substance use problems The 2013 survey had 259138 participants and found that self-reported substance use among BC adolescents has declined since 2003 (Figures 214 and 215) Alcohol was the
most commonly used substance in 2013 with 45 of BC youth reporting that they had tried it41
Self-reported use of steroids heroin inhalants amphetamines or cocaine has remained stable or declined since 2003 Adolescent use of prescription pills peaked in 2008
Figure 214 Percentage of BC youth who have ever used alcohol cannabis tobacco 2003-201341
Perc
enta
ge
60
55
50
45
40
35
30
25
20 2003 2008 2013
Alcohol
Cannabis
Tobacco
2003 2008 2013
Figure 215 Percentage of BC youth who have ever used prescription pills illicit substances 2003-201341
16
14
12
10
8
6
4
2
0
Cocaine
Prescription Pills
Amphetamines
Heroin
Hallucinogens
Mushrooms
Steriods
Inhalants
Perc
enta
ge
JBack to Table of Content
SUBSTANCE USE TRENDS
26 Y BC DOAP REPORT 2014 Y
Although some students experiment with alcohol and cannabis before the age of 13 the majority (65) who tried alcohol and cannabis did so between the ages of 13 and 15 (Figure 216)41
Table 22 summarizes the self-reported reasons among adolescents for their most recent substance use event The most cited reason was ldquoI wanted to have funrdquo followed by ldquomy friends were doing itrdquo and ldquoI wanted to try itexperimentrdquo
Mental health factors were also reported as reasons for drug use lsquobecause of stressrsquo or feeling ldquodown or sadrdquo Youth who reported self-harm in the past year were more likely to use substances compared to those who had not self-harmed (43 vs 14 respectively)41
Figure 216 Age when BC youth used alcohol or cannabis for the first time41
Perc
enta
ge
Age (years)
25
20
15
10
5
0lt9 9 10 11 12 13 14 15 gt1716
AlcoholCannabis
_
6029271611
9533211
21
693729252110
743211
16
Table 22 Reasons for last time substance uses for BC youth41
Males FemalesI wanted to have funMy friends were doing itI wanted to try itexperimentBecause of stressI felt down or sadI felt like there was nothing else to doTo manage physical painI was pressured into doing itI thought it would help me focusBecause of an addictionI didnrsquot mean to do itTo change the effects of some other drug(s)Other
27Y BC DOAP REPORT 2014 Y
CHAPTER 2
About half of youth who used substances in the past year reported negative consequences The most frequent responses were ldquodoing something they could not rememberrdquo ldquopassing outrdquo and ldquogetting injuredrdquo (Table 23)41
Substance use trends from the 2013 East Kootenay Addiction Service Society (EKASS) survey are similar to the AHS data Since 2005 the proportion of East Kootenay area in-school youth experimenting with substances has declined In 2013 females reported using fewer substances than males This is in contrast to prior years for example alcohol use was 720 for girls and 703 for boys in 2007 but was 585 and 620 in 2013 similarly cannabis use for girls and boys was 362 and 354 in 2007 but 273 and 336 respectively in 201342
The EKASS reports the proportion of students admitting to being in a car with an alcohol-impaired driver reached a high of 601 in 2009 but was 464 in 2013 a consid-erable decrease but still unacceptably high Youth who reported driving after drinking alcohol also dropped from 201 in 2005 to 120 in 2013 Rate of self-reports of
being a passenger in a car with a cannabis-impaired driver was 295 in 2011 These declines may also reflect the overall decrease in substance use among youth42
HIGH RISK YOUTHThe proportion of lifetime drug use among a convenience sample of Vancouver and Victoria area street-involved youth aged 15-24 in the CARBC high risk survey is considerably higher than the in-school youth surveys (Figure 217) Although 2013 data is available for Victoria the most recent data available for Vancouver is 2012 In 2012 marijuana use was more common than alcohol or tobacco and over 90 of youth reported ever using cocaine at both sites Reported lifetime use of amphetamines and ecstasy is more prevalent in street-involved youth from Victoria (53 and 95) than Vancouver (38 and 83)20
Table 23 Consequences of substance use by BC youth in the past year41
31261210109885421
52
4229171555
105
10721
46
Males FemalesWas told I did something I couldnrsquot rememberPassed outGot injuredArgued with family membersDamaged propertyGot in trouble with policeSchoolwork or grades changedGot into a physical fightLost friends or broke up with a girlfriend or boyfriendHad sex when I didnrsquot want toOverdosedHad to get treatment for alcohol or drug abuseUsed alcohol or drugs but none of this things happened
JBack to Table of Content
SUBSTANCE USE TRENDS
28 Y BC DOAP REPORT 2014 Y
Figure 218 shows past 30 day substance use in Vancouver in 2012 More recent data (2013) for Victoria (Figure 219) shows alcohol use in the past 30 days reached its lowest reported prevalence (595) while crystal meth use (811) shows a
steep increase since the second 2011 wave (28) Crack LSD and heroin use declined between the two 2013 waves however this is a small convenience sample (n=50 per wave per city) so rates may be unstable20
Figure 217 Percentage of Vancouver and Victoria street-involved youth who have ever used substances 201220
Perc
enta
ge
Vancouver Victoria
100
90
80
70
60
50
40
30
20
10
0
AlcoholMarijuanaTobaccoCocaineCrackAmphetamineCrystal MethHeroinEcstasyLSDMagic Mushrooms
Figure 218 Substance use trends in the past 30 days among street-involved youth in Vancouver 2008-201220
Perc
enta
ge
100908070605040302010
0
Cocaine Crack Crystal Meth Heroin Marijuana Alcohol
2008 Wave 1
2008 Wave 2
2009Wave 1
2009Wave 2
2010Wave 1
2010Wave 2
2011Wave 1
2011Wave 2
2012 Wave 1
2012 Wave 2
29Y BC DOAP REPORT 2014 Y
CHAPTER 2
When asked about the perceived benefits of drug use in 2013 reasons most cited were helping with social connections alleviating symptoms of mental and physical illness and making respondents feel happy calm and in some cases more productive20
The At-Risk Youth Survey (ARYS) led by UHRI studies risk factors for 14-26 year old street-involved youth in Vancouver Figure 220 represents drugs used by any route at least weekly among ARYS
participants Reported marijuana use declined considerably be-tween 2012 and 2013 However crystal methamphetamine use has increased over the past 3 years similar to that seen in the high-risk youth in Victoria (Figure 219) The proportion of ARYS participants reporting weekly crack use in 2013 (164) is considerably lower than the older Vancouver-based VIDUS and ACCESS cohorts (Figure 28) for which crack was the most widely used substance that year
Perc
enta
ge
Note each category in the graph captures both injection and non-injection use of the specified drug(BC Centre for Excellence in HIVAIDS personal communication June 10 2014)
80
70
60
50
40
30
20
10
0
Figure 220 Weekly drug use patterns among street-involved youth who use illicit drugs in Vancouver Canada 2005-2013
Cocaine Crack Crystal Meth Heroin Injection Marijuana Prescription Opioids
2005 2006 2007 2008 2009 2010 2011 2012 2013
Figure 219 Substance use trends in the past 30 days among street-involved youth in Victoria 2008-201320Pe
rcen
tage
1009080706050403020100
2008 Wave 1
2008 Wave 2
2009Wave 1
2009Wave 2
2010Wave 1
2010Wave 2
2011Wave 1
2011Wave 2
2012 Wave 1
2012 Wave 2
2013Wave 1
2013Wave 2
Cocaine Crack Crystal Meth Heroin Marijuana Alcohol
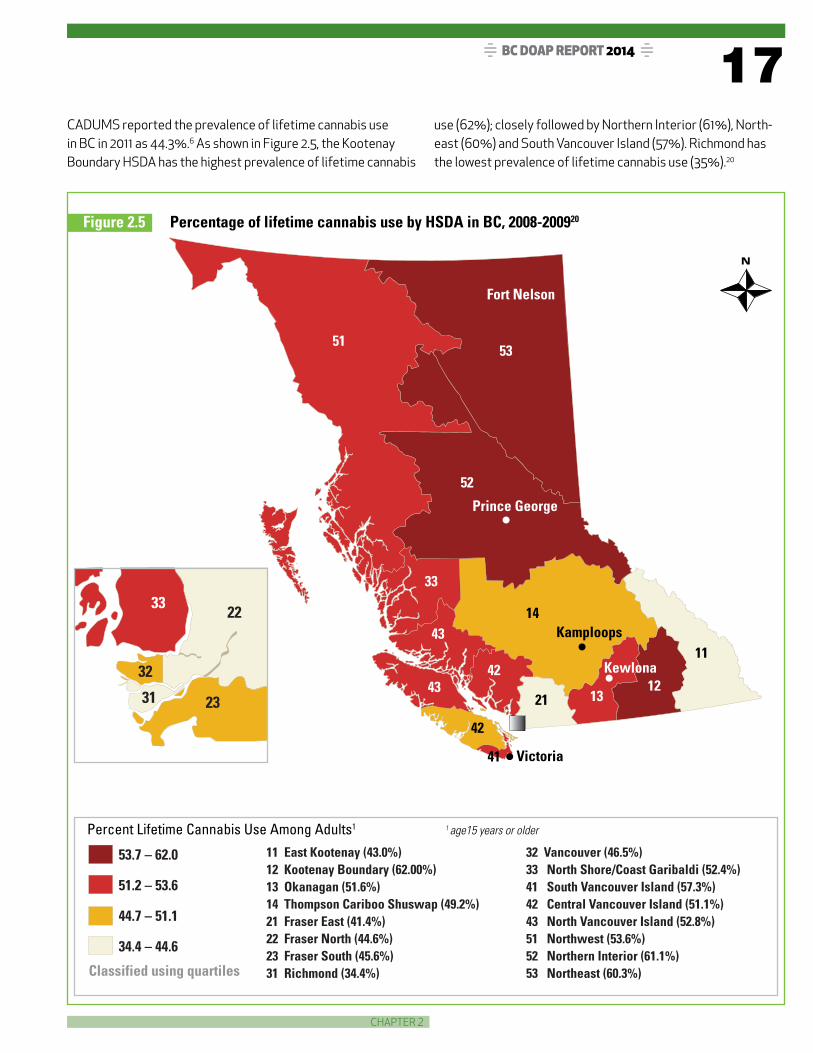

JBack to Table of Content
SUBSTANCE USE TRENDS
18 Y BC DOAP REPORT 2014 Y
Figure 26 illustrates the prevalence of illicit substance use (other than cannabis) in the past 12 months among adults aged 15 and older reported by CADUMS Prevalence was estimated using the number of the people who reported using any illicit drugs including cocaine speed methamphetamine ecstasy hallucinogens inhalants heroin pain relievers stimulants and
sedatives divided by the sample population In BC and the rest of Canada males were more likely than females to use illicit substances and the prevalence of illicit drug use between 2008 and 2012 is significantly higher (p lt 005) in BC compared to the rest of Canada20
0 High Risk Populations and Substance Use CARBCrsquos High Risk Populations survey is a convenience sample of 50 street-involved adults and 50 adults using drugs recreationally in Vancouver and Victoria every six months These high risk populations report higher alcohol cannabis and other illicit substances use compared to the general population However substance use patterns vary between these two high-risk populations Figure 27 shows that in 2012 1 of recreational drug using adults compared to 78 of street-involved adults reported crack cocaine use in the previous month while 88 versus 6 in the same groups used ecstasy There are also
statistically significant differences in crystal methamphetamine heroin LSD and mushroom use20
The survey also found 36 of the recreational-use adult co-horts in Vancouver and Victoria reported simultaneous alcohol and marijuana use over the previous weekend and 11 reported simultaneous use of alcohol and cocaine Using more than one substance at a time (poly-substance use) was lower among street-involved adults the most frequently mixed substances being alcohol and marijuana (10) followed by crystal meth and heroin (75)20
7
6
5
4
3
2
1
0
Figure 26 CADUMS substance use trends in BC and Canada by gender 2008-2012 Prevalence of other illicit substance use (excluding cannabis) in the past 12 months20
Prevalence of other illicit substance use (excluding cannabis) in the past year among Canadians 15+ by gender 2008-2012
2008Year 2009 2010 2011 2012
BCFemales
Rest of CanadaFemales
BCMales
Rest of CanadaMales
Illic
it dr
ug u
sers
()
- 47
36
16 14
BC numbers for females 2011-12 and males 2011 were suppressed due to unstable estimates
19Y BC DOAP REPORT 2014 Y
CHAPTER 2
Drugs used at least weekly reported by the VIDUS and ACCESS cohorts are shown in Figure 28 and 29 Figure 28 indicates considerable changes in weekly drug use (by any route) over time Cocaine use declined since 1996 while crack cocaine use
increased from 51 in 1996 to 706 in 2008 but declined to 34 in 2013 Crystal methamphetamine use reached its highest recorded level in 2013 (178 )
Figure 27 Past month substance use in high risk populations in Victoria and Vancouver 2012 (Wave 2)20
Alcohol Marijuana Tobacco CocaineCrack Amphetamine Crystal Meth HeroinEcstasy LSD Magic Mushrooms
Perc
enta
ge
Street involved adults Recreational Adults
100
8068
72
91
52
78
13
40
9689
7469
1
25
6 3
88
55
75
40
6 510
60
40
20
0
Figure 28 Weekly drug use patterns among people who use illicit drugs in Vancouver Canada 1996-2013
1996 1997 1998 1999 2000 2001 2002 2003 2004 2005 2006 2007 2008 2009 2010 2011 2012 2013
80
70
60
50
40
30
20
10
0
Perc
enta
ge
Cocaine Crack Crystal Meth Heroin Marijuana Prescription opioids
(BC Centre for Excellence in HIVAIDS personal communication June 10 2014) Note each category in the graph captures both injection and non-injection use of the specified drug
JBack to Table of Content
SUBSTANCE USE TRENDS
20 Y BC DOAP REPORT 2014 Y
Figure 29 shows weekly drug use by route of administration illicit prescription opioid use (ie use of prescription opioids without a valid prescription) includes OxyContin (oxycodone) Percocet (oxycodonetylenol) Tylenol 3 (codeinetylenol) morphine Dilaudid (hydromorphone) Demerol (meperidine or pethadine) methadone fentanyl hydrocodone and Talwin (pentazocine)
Most high-risk drug use research in BC is conducted in Vancouver and Victoria To gain a better understanding of drug use outside these two cities over 700 clients using harm
reduction distribution sites throughout BC were surveyed in 2012 and 2013 (HR client survey)2223 In 2013 drug use was weighted by HSDA population the three most commonly used substances were marijuana (51) alcohol (48) and crack (35) Substance use patterns vary between regions as seen in Figure 210 Crack use was highest in NH (67) and lowest in VCH (33) Powdered cocaine use was also highest in the NH region By contrast reported use of heroin and crystal meth was lower in NH compared to other regions of BC and highest in FH (54 and 48 respectively)23
Figure 29 Weekly substance use prevalence among people who use illicit drugs in Vancouver Canada 2013
Perc
enta
ge
Cocaine Injectio
n
Cocaine Non-Injectio
n
Crystal M
eth Injectio
n
Crystal M
eth Non-Injectio
n
Crack Non-In
jection
Prescrip
tion Opioid In
jection
Prescrip
tion Opioid Non-In
jection
Heroin Injectio
n
Marijuana Non-In
jection
(BC Centre for Excellence in HIVAIDS personal communication June 10 2014)
40
35
30
25
193
34
149
79
340
86
49
261 252
20
15
10
5
0
21Y BC DOAP REPORT 2014 Y
CHAPTER 2
0 Substance Availability and CostThe availability of illicit drugs in Vancouver is reported by UHRI as the percentage of PWUD who can obtain the drug within 10 minutes PWUD in Vancouver were more likely able to obtain crack cocaine (80) cocaine (70) and heroin (70) than cannabis (65) or crystal methamphetamine within 10 minutes in 2011
URHI cohort participants identified the cost of drugs has been stable over the past 10 years
- Heroin $20 per 01 gram since 2001
- Powder cocaine and crack cocaine $10 per 01 gram
- Crystal methamphetamine $10 per 01 gram
The availability and consistent price of drugs in the Vancouver area does not support the claim that law enforcement efforts have reduced the available drug supply and increased the cost of illicit substances18
The Centre for Addiction Research of BC (CARBC)rsquos High Risk Population survey in Vancouver and Victoria shows similar trends in drug prices and availability Since 2008 cocaine crack heroin and crystal meth have been reported by street-involved adults in both cities as being either ldquoeasyrdquo or ldquovery easyrdquo to obtain Furthermore the reported street prices of these substances are very similar to those reported in UHRIrsquos research and have fluctuated little over the years20 More information on drug trafficking can be found in the enforcement chapter of this report
The 2014 UNODC World Drug Report identifies Canada as the country with the highest consumption of prescription opioids with 8122 mg per capita of morphine equivalence (see Table 21) the next highest is United States at 74979 mg per capita24 Canadarsquos high rate of pain medication prescribing and availability has serious implications for drug-related harms and diversion
Figure 210 Percent of HR clients reporting substance use in the past week by HA weighted by HSDA population 201323
70
60
50
40
30
20
10
0
Marijuana Alcohol Crack Heroin Crystal Meth Cocaine
FH VCH VIHA IH NH
Perc
enta
ge
JBack to Table of Content
SUBSTANCE USE TRENDS
22 Y BC DOAP REPORT 2014 Y
0 OxycontinOxyContin a patented prescription version of oxycodone used to treat moderate to intense pain was discontinued in Canada in March 201225 OxyContin was a slow-release narcotic when taken orally as intended however users could release high levels of the drug instantaneously by crushing and snorting the tablet OxyNEO was introduced by the same manufacturer Purdue Pharma as a replacement drug that was designed to be harder to crush and dissolve limiting abuse through snorting and injecting2526 Since its introduction several provincial health plans altered their drug coverage to restrict coverage of OxyNEO In BC only exceptional case-by-base coverage requests for OxyNEO are considered and it is only covered through the palliative care plan2728 There are concerns that the recent lack of OxyContin is leading some opioid dependant users to seek out more accessible and potentially more dangerous opioids A US-based study found that after the formulation changed misuse of OxyContin among patients undergoing opioid dependence treatment decreased from 356 to 12829 However fentanyl and hydromorphone use increased among these patients and heroin use doubled29
Although the replacement of OxyContin with OxyNEO was intended to address concerns over misuse of the drug Health Canadarsquos subsequent decision in November
2012 to approve generic production of extended release oxycodone allowed off-brand versions to enter the Canadian pharmaceutical market30 These generic versions are not currently covered under BCrsquos provincial formulary28
0 Medical MarijuanaThere have been recent developments regarding medical marijuana licensing Health Canadarsquos 2014 proposed Marijuana for Medical Purposes Regulations (MMPR) required patients to end home production of medical marijuana on April 1 201431 However following a consti-tutional challenge to the MMPR a Federal Court granted an injunction on March 21 201432 This allows those with personal and designated production licenses (for persons responsible for the patient) to continue home production of medical marijuana until the case goes to trial in spring 201532 The injunction does not affect Health Canadarsquos new medical marijuana licensing system for dispensing prescribed marijuana and there are concerns that new patients will have difficulty affording the higher marijuana prices projected to result from the federal legislation32 On a related note licensed sales of recreational marijuana began in Washington State on July 8 201433 This may have implications on illicit cannabis trade with BC given the US statersquos close proximity
Table 21 Morphine equivalence consumption per capita Canada 2011
Drug mgcapita ME mgcapita
Fentanyl
Hydromorphone
Methadone
Morphine
Oxycodone
Pethidine
Total Morphine Equivalence
24366
250938
200946
874741
1458966
71278
2030396
1254691
2003782
874741
1940425
17820
8121855
httpwwwpainpolicywisceducountryprofilecanada
23Y BC DOAP REPORT 2014 Y
CHAPTER 2
0 FentanylBC has experienced a recent increase in fentanyl availability and fentanyl-detected deaths Fentanyl is a synthetic narcotic that is used to relieve intense pain In BC fentanyl can be prescribed for pain management as a transdermal patch which provides sustained release of the drug34 However this formulation is susceptible to abuse through the extraction of patch contents and subsequent intrave-nous injection35 Fentanyl is 50-100 times more potent than morphine which greatly increases the risk of accidental overdose36 Early signs of fentanyl overdose include severe sleepiness slow heartbeat difficulty breathing coldclammy skin and trouble with walking or talking36
The RCMP and municipal police forces in BC have identi-fied illegally manufactured fentanyl as a white powder resembling heroin and in tablet form as counterfeit oxycodone (fake oxy) tablets3738 Illegally-produced fentanyl can be significantly more toxic than the pharma-ceutical-grade39 Tablets containing fentanyl are green and are stamped with ldquoCDNrdquo and the number 80 on the opposite sides (Figure 211) These pills are nicknamed ldquogreen jelliesrdquo and ldquostreet oxyrdquo in Western Canada37 White tablets with ldquoCDNrdquo and ldquo10rdquo stamped on them have also appeared in British Columbia (Figure 211) Seized quan-tities of these two versions tested positive for fentanyl 89 of the time and contain variable sometimes very high dose of fentanyl37 Individuals using these drugs may be under the assumption that they contain oxycodone only and are therefore at high risk of accidental overdose
On May 30th 2013 in response to an increase in fentayl- detected deaths in BC a joint alert was issued by the Provincial Health Officer BC Coroners Service (BCCS) healthcare and enforcement partners warning the public of the increase in deaths and availability of fentanyl within the street drug market After the alert fentanyl- detected deaths declined in June and July 2013 but have since increased In 2012 there were 15 fentanyl-detected deaths a total of 51 fentanyl-detected deaths were iden-tified in BC in 2013 most 2013 fentanyl-detected deaths occurred in Metro Vancouver region (15) Island (14) and Fraser (12) (Figure 212)
Preliminary data from the BCCS indicates 49 fentanyl- detected deaths occurred in the first eight months of 2014 (January 1st to August 31st) of these 10 occurred in the City of Vancouver and 18 in the Fraser region about a third (16) were female Please note that 2013 and 2014 data are preliminary and subject to change and these deaths only include fentanyl found in illicit drug-related circumstances and exclude overdose deaths in persons prescribed fentanyl40
In June 2014 the BCCS issued another public warning urging all PWUD to exercise extreme caution when consuming substances that may contain fentanyl More information regarding fentanyl can be found in the Mortality section37
Figure 211 Samples of seized counterfeit oxycodone tablets39
JBack to Table of Content
SUBSTANCE USE TRENDS
24 Y BC DOAP REPORT 2014 YN
umbe
r of D
eath
s
16
141210
8642
2012 2013 Jan 1-Aug 31 20140
Fraser 6
3
2
3
115
12
15
14
3
751
18
12
7
7
549
Metro
Island
InteriorNorthern
Total
Figure 212 Fentanyl-detected deaths by BCCS region 2012-201440
Figure 213 Fentanyl-detected deaths by sex 2012-201440
50
40
30
20
10
02012 2013 Jan 1-Aug 31 2014
Male
Female
12
3
42
9
33
16
Num
ber o
f Dea
ths
25Y BC DOAP REPORT 2014 Y
CHAPTER 2
0 Youth YOUTH IN SCHOOLThe McCreary Centre Society recruits grade 7-12 students in public schools throughout BC to participate in the Adolescent Health Survey (AHS) every five years Since these participants are in school they are unlikely to have major substance use problems The 2013 survey had 259138 participants and found that self-reported substance use among BC adolescents has declined since 2003 (Figures 214 and 215) Alcohol was the
most commonly used substance in 2013 with 45 of BC youth reporting that they had tried it41
Self-reported use of steroids heroin inhalants amphetamines or cocaine has remained stable or declined since 2003 Adolescent use of prescription pills peaked in 2008
Figure 214 Percentage of BC youth who have ever used alcohol cannabis tobacco 2003-201341
Perc
enta
ge
60
55
50
45
40
35
30
25
20 2003 2008 2013
Alcohol
Cannabis
Tobacco
2003 2008 2013
Figure 215 Percentage of BC youth who have ever used prescription pills illicit substances 2003-201341
16
14
12
10
8
6
4
2
0
Cocaine
Prescription Pills
Amphetamines
Heroin
Hallucinogens
Mushrooms
Steriods
Inhalants
Perc
enta
ge
JBack to Table of Content
SUBSTANCE USE TRENDS
26 Y BC DOAP REPORT 2014 Y
Although some students experiment with alcohol and cannabis before the age of 13 the majority (65) who tried alcohol and cannabis did so between the ages of 13 and 15 (Figure 216)41
Table 22 summarizes the self-reported reasons among adolescents for their most recent substance use event The most cited reason was ldquoI wanted to have funrdquo followed by ldquomy friends were doing itrdquo and ldquoI wanted to try itexperimentrdquo
Mental health factors were also reported as reasons for drug use lsquobecause of stressrsquo or feeling ldquodown or sadrdquo Youth who reported self-harm in the past year were more likely to use substances compared to those who had not self-harmed (43 vs 14 respectively)41
Figure 216 Age when BC youth used alcohol or cannabis for the first time41
Perc
enta
ge
Age (years)
25
20
15
10
5
0lt9 9 10 11 12 13 14 15 gt1716
AlcoholCannabis
_
6029271611
9533211
21
693729252110
743211
16
Table 22 Reasons for last time substance uses for BC youth41
Males FemalesI wanted to have funMy friends were doing itI wanted to try itexperimentBecause of stressI felt down or sadI felt like there was nothing else to doTo manage physical painI was pressured into doing itI thought it would help me focusBecause of an addictionI didnrsquot mean to do itTo change the effects of some other drug(s)Other
27Y BC DOAP REPORT 2014 Y
CHAPTER 2
About half of youth who used substances in the past year reported negative consequences The most frequent responses were ldquodoing something they could not rememberrdquo ldquopassing outrdquo and ldquogetting injuredrdquo (Table 23)41
Substance use trends from the 2013 East Kootenay Addiction Service Society (EKASS) survey are similar to the AHS data Since 2005 the proportion of East Kootenay area in-school youth experimenting with substances has declined In 2013 females reported using fewer substances than males This is in contrast to prior years for example alcohol use was 720 for girls and 703 for boys in 2007 but was 585 and 620 in 2013 similarly cannabis use for girls and boys was 362 and 354 in 2007 but 273 and 336 respectively in 201342
The EKASS reports the proportion of students admitting to being in a car with an alcohol-impaired driver reached a high of 601 in 2009 but was 464 in 2013 a consid-erable decrease but still unacceptably high Youth who reported driving after drinking alcohol also dropped from 201 in 2005 to 120 in 2013 Rate of self-reports of
being a passenger in a car with a cannabis-impaired driver was 295 in 2011 These declines may also reflect the overall decrease in substance use among youth42
HIGH RISK YOUTHThe proportion of lifetime drug use among a convenience sample of Vancouver and Victoria area street-involved youth aged 15-24 in the CARBC high risk survey is considerably higher than the in-school youth surveys (Figure 217) Although 2013 data is available for Victoria the most recent data available for Vancouver is 2012 In 2012 marijuana use was more common than alcohol or tobacco and over 90 of youth reported ever using cocaine at both sites Reported lifetime use of amphetamines and ecstasy is more prevalent in street-involved youth from Victoria (53 and 95) than Vancouver (38 and 83)20
Table 23 Consequences of substance use by BC youth in the past year41
31261210109885421
52
4229171555
105
10721
46
Males FemalesWas told I did something I couldnrsquot rememberPassed outGot injuredArgued with family membersDamaged propertyGot in trouble with policeSchoolwork or grades changedGot into a physical fightLost friends or broke up with a girlfriend or boyfriendHad sex when I didnrsquot want toOverdosedHad to get treatment for alcohol or drug abuseUsed alcohol or drugs but none of this things happened
JBack to Table of Content
SUBSTANCE USE TRENDS
28 Y BC DOAP REPORT 2014 Y
Figure 218 shows past 30 day substance use in Vancouver in 2012 More recent data (2013) for Victoria (Figure 219) shows alcohol use in the past 30 days reached its lowest reported prevalence (595) while crystal meth use (811) shows a
steep increase since the second 2011 wave (28) Crack LSD and heroin use declined between the two 2013 waves however this is a small convenience sample (n=50 per wave per city) so rates may be unstable20
Figure 217 Percentage of Vancouver and Victoria street-involved youth who have ever used substances 201220
Perc
enta
ge
Vancouver Victoria
100
90
80
70
60
50
40
30
20
10
0
AlcoholMarijuanaTobaccoCocaineCrackAmphetamineCrystal MethHeroinEcstasyLSDMagic Mushrooms
Figure 218 Substance use trends in the past 30 days among street-involved youth in Vancouver 2008-201220
Perc
enta
ge
100908070605040302010
0
Cocaine Crack Crystal Meth Heroin Marijuana Alcohol
2008 Wave 1
2008 Wave 2
2009Wave 1
2009Wave 2
2010Wave 1
2010Wave 2
2011Wave 1
2011Wave 2
2012 Wave 1
2012 Wave 2
29Y BC DOAP REPORT 2014 Y
CHAPTER 2
When asked about the perceived benefits of drug use in 2013 reasons most cited were helping with social connections alleviating symptoms of mental and physical illness and making respondents feel happy calm and in some cases more productive20
The At-Risk Youth Survey (ARYS) led by UHRI studies risk factors for 14-26 year old street-involved youth in Vancouver Figure 220 represents drugs used by any route at least weekly among ARYS
participants Reported marijuana use declined considerably be-tween 2012 and 2013 However crystal methamphetamine use has increased over the past 3 years similar to that seen in the high-risk youth in Victoria (Figure 219) The proportion of ARYS participants reporting weekly crack use in 2013 (164) is considerably lower than the older Vancouver-based VIDUS and ACCESS cohorts (Figure 28) for which crack was the most widely used substance that year
Perc
enta
ge
Note each category in the graph captures both injection and non-injection use of the specified drug(BC Centre for Excellence in HIVAIDS personal communication June 10 2014)
80
70
60
50
40
30
20
10
0
Figure 220 Weekly drug use patterns among street-involved youth who use illicit drugs in Vancouver Canada 2005-2013
Cocaine Crack Crystal Meth Heroin Injection Marijuana Prescription Opioids
2005 2006 2007 2008 2009 2010 2011 2012 2013
Figure 219 Substance use trends in the past 30 days among street-involved youth in Victoria 2008-201320Pe
rcen
tage
1009080706050403020100
2008 Wave 1
2008 Wave 2
2009Wave 1
2009Wave 2
2010Wave 1
2010Wave 2
2011Wave 1
2011Wave 2
2012 Wave 1
2012 Wave 2
2013Wave 1
2013Wave 2
Cocaine Crack Crystal Meth Heroin Marijuana Alcohol
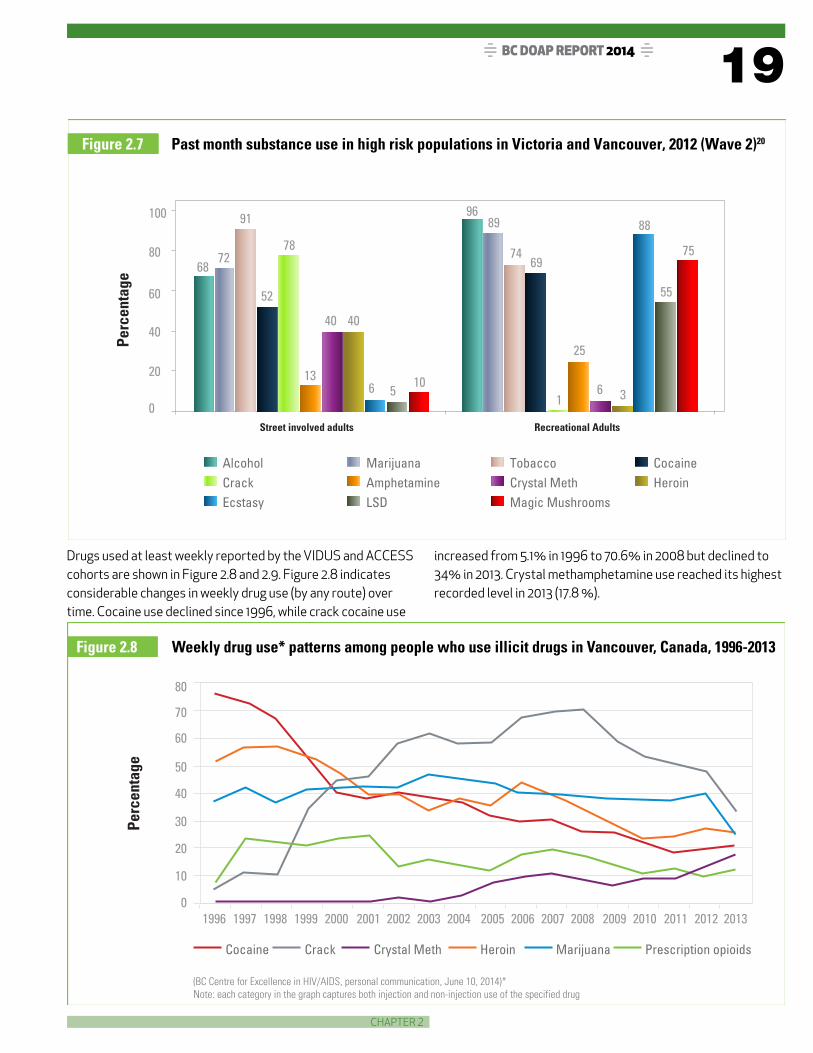

JBack to Table of Content
SUBSTANCE USE TRENDS
20 Y BC DOAP REPORT 2014 Y
Figure 29 shows weekly drug use by route of administration illicit prescription opioid use (ie use of prescription opioids without a valid prescription) includes OxyContin (oxycodone) Percocet (oxycodonetylenol) Tylenol 3 (codeinetylenol) morphine Dilaudid (hydromorphone) Demerol (meperidine or pethadine) methadone fentanyl hydrocodone and Talwin (pentazocine)
Most high-risk drug use research in BC is conducted in Vancouver and Victoria To gain a better understanding of drug use outside these two cities over 700 clients using harm
reduction distribution sites throughout BC were surveyed in 2012 and 2013 (HR client survey)2223 In 2013 drug use was weighted by HSDA population the three most commonly used substances were marijuana (51) alcohol (48) and crack (35) Substance use patterns vary between regions as seen in Figure 210 Crack use was highest in NH (67) and lowest in VCH (33) Powdered cocaine use was also highest in the NH region By contrast reported use of heroin and crystal meth was lower in NH compared to other regions of BC and highest in FH (54 and 48 respectively)23
Figure 29 Weekly substance use prevalence among people who use illicit drugs in Vancouver Canada 2013
Perc
enta
ge
Cocaine Injectio
n
Cocaine Non-Injectio
n
Crystal M
eth Injectio
n
Crystal M
eth Non-Injectio
n
Crack Non-In
jection
Prescrip
tion Opioid In
jection
Prescrip
tion Opioid Non-In
jection
Heroin Injectio
n
Marijuana Non-In
jection
(BC Centre for Excellence in HIVAIDS personal communication June 10 2014)
40
35
30
25
193
34
149
79
340
86
49
261 252
20
15
10
5
0
21Y BC DOAP REPORT 2014 Y
CHAPTER 2
0 Substance Availability and CostThe availability of illicit drugs in Vancouver is reported by UHRI as the percentage of PWUD who can obtain the drug within 10 minutes PWUD in Vancouver were more likely able to obtain crack cocaine (80) cocaine (70) and heroin (70) than cannabis (65) or crystal methamphetamine within 10 minutes in 2011
URHI cohort participants identified the cost of drugs has been stable over the past 10 years
- Heroin $20 per 01 gram since 2001
- Powder cocaine and crack cocaine $10 per 01 gram
- Crystal methamphetamine $10 per 01 gram
The availability and consistent price of drugs in the Vancouver area does not support the claim that law enforcement efforts have reduced the available drug supply and increased the cost of illicit substances18
The Centre for Addiction Research of BC (CARBC)rsquos High Risk Population survey in Vancouver and Victoria shows similar trends in drug prices and availability Since 2008 cocaine crack heroin and crystal meth have been reported by street-involved adults in both cities as being either ldquoeasyrdquo or ldquovery easyrdquo to obtain Furthermore the reported street prices of these substances are very similar to those reported in UHRIrsquos research and have fluctuated little over the years20 More information on drug trafficking can be found in the enforcement chapter of this report
The 2014 UNODC World Drug Report identifies Canada as the country with the highest consumption of prescription opioids with 8122 mg per capita of morphine equivalence (see Table 21) the next highest is United States at 74979 mg per capita24 Canadarsquos high rate of pain medication prescribing and availability has serious implications for drug-related harms and diversion
Figure 210 Percent of HR clients reporting substance use in the past week by HA weighted by HSDA population 201323
70
60
50
40
30
20
10
0
Marijuana Alcohol Crack Heroin Crystal Meth Cocaine
FH VCH VIHA IH NH
Perc
enta
ge
JBack to Table of Content
SUBSTANCE USE TRENDS
22 Y BC DOAP REPORT 2014 Y
0 OxycontinOxyContin a patented prescription version of oxycodone used to treat moderate to intense pain was discontinued in Canada in March 201225 OxyContin was a slow-release narcotic when taken orally as intended however users could release high levels of the drug instantaneously by crushing and snorting the tablet OxyNEO was introduced by the same manufacturer Purdue Pharma as a replacement drug that was designed to be harder to crush and dissolve limiting abuse through snorting and injecting2526 Since its introduction several provincial health plans altered their drug coverage to restrict coverage of OxyNEO In BC only exceptional case-by-base coverage requests for OxyNEO are considered and it is only covered through the palliative care plan2728 There are concerns that the recent lack of OxyContin is leading some opioid dependant users to seek out more accessible and potentially more dangerous opioids A US-based study found that after the formulation changed misuse of OxyContin among patients undergoing opioid dependence treatment decreased from 356 to 12829 However fentanyl and hydromorphone use increased among these patients and heroin use doubled29
Although the replacement of OxyContin with OxyNEO was intended to address concerns over misuse of the drug Health Canadarsquos subsequent decision in November
2012 to approve generic production of extended release oxycodone allowed off-brand versions to enter the Canadian pharmaceutical market30 These generic versions are not currently covered under BCrsquos provincial formulary28
0 Medical MarijuanaThere have been recent developments regarding medical marijuana licensing Health Canadarsquos 2014 proposed Marijuana for Medical Purposes Regulations (MMPR) required patients to end home production of medical marijuana on April 1 201431 However following a consti-tutional challenge to the MMPR a Federal Court granted an injunction on March 21 201432 This allows those with personal and designated production licenses (for persons responsible for the patient) to continue home production of medical marijuana until the case goes to trial in spring 201532 The injunction does not affect Health Canadarsquos new medical marijuana licensing system for dispensing prescribed marijuana and there are concerns that new patients will have difficulty affording the higher marijuana prices projected to result from the federal legislation32 On a related note licensed sales of recreational marijuana began in Washington State on July 8 201433 This may have implications on illicit cannabis trade with BC given the US statersquos close proximity
Table 21 Morphine equivalence consumption per capita Canada 2011
Drug mgcapita ME mgcapita
Fentanyl
Hydromorphone
Methadone
Morphine
Oxycodone
Pethidine
Total Morphine Equivalence
24366
250938
200946
874741
1458966
71278
2030396
1254691
2003782
874741
1940425
17820
8121855
httpwwwpainpolicywisceducountryprofilecanada
23Y BC DOAP REPORT 2014 Y
CHAPTER 2
0 FentanylBC has experienced a recent increase in fentanyl availability and fentanyl-detected deaths Fentanyl is a synthetic narcotic that is used to relieve intense pain In BC fentanyl can be prescribed for pain management as a transdermal patch which provides sustained release of the drug34 However this formulation is susceptible to abuse through the extraction of patch contents and subsequent intrave-nous injection35 Fentanyl is 50-100 times more potent than morphine which greatly increases the risk of accidental overdose36 Early signs of fentanyl overdose include severe sleepiness slow heartbeat difficulty breathing coldclammy skin and trouble with walking or talking36
The RCMP and municipal police forces in BC have identi-fied illegally manufactured fentanyl as a white powder resembling heroin and in tablet form as counterfeit oxycodone (fake oxy) tablets3738 Illegally-produced fentanyl can be significantly more toxic than the pharma-ceutical-grade39 Tablets containing fentanyl are green and are stamped with ldquoCDNrdquo and the number 80 on the opposite sides (Figure 211) These pills are nicknamed ldquogreen jelliesrdquo and ldquostreet oxyrdquo in Western Canada37 White tablets with ldquoCDNrdquo and ldquo10rdquo stamped on them have also appeared in British Columbia (Figure 211) Seized quan-tities of these two versions tested positive for fentanyl 89 of the time and contain variable sometimes very high dose of fentanyl37 Individuals using these drugs may be under the assumption that they contain oxycodone only and are therefore at high risk of accidental overdose
On May 30th 2013 in response to an increase in fentayl- detected deaths in BC a joint alert was issued by the Provincial Health Officer BC Coroners Service (BCCS) healthcare and enforcement partners warning the public of the increase in deaths and availability of fentanyl within the street drug market After the alert fentanyl- detected deaths declined in June and July 2013 but have since increased In 2012 there were 15 fentanyl-detected deaths a total of 51 fentanyl-detected deaths were iden-tified in BC in 2013 most 2013 fentanyl-detected deaths occurred in Metro Vancouver region (15) Island (14) and Fraser (12) (Figure 212)
Preliminary data from the BCCS indicates 49 fentanyl- detected deaths occurred in the first eight months of 2014 (January 1st to August 31st) of these 10 occurred in the City of Vancouver and 18 in the Fraser region about a third (16) were female Please note that 2013 and 2014 data are preliminary and subject to change and these deaths only include fentanyl found in illicit drug-related circumstances and exclude overdose deaths in persons prescribed fentanyl40
In June 2014 the BCCS issued another public warning urging all PWUD to exercise extreme caution when consuming substances that may contain fentanyl More information regarding fentanyl can be found in the Mortality section37
Figure 211 Samples of seized counterfeit oxycodone tablets39
JBack to Table of Content
SUBSTANCE USE TRENDS
24 Y BC DOAP REPORT 2014 YN
umbe
r of D
eath
s
16
141210
8642
2012 2013 Jan 1-Aug 31 20140
Fraser 6
3
2
3
115
12
15
14
3
751
18
12
7
7
549
Metro
Island
InteriorNorthern
Total
Figure 212 Fentanyl-detected deaths by BCCS region 2012-201440
Figure 213 Fentanyl-detected deaths by sex 2012-201440
50
40
30
20
10
02012 2013 Jan 1-Aug 31 2014
Male
Female
12
3
42
9
33
16
Num
ber o
f Dea
ths
25Y BC DOAP REPORT 2014 Y
CHAPTER 2
0 Youth YOUTH IN SCHOOLThe McCreary Centre Society recruits grade 7-12 students in public schools throughout BC to participate in the Adolescent Health Survey (AHS) every five years Since these participants are in school they are unlikely to have major substance use problems The 2013 survey had 259138 participants and found that self-reported substance use among BC adolescents has declined since 2003 (Figures 214 and 215) Alcohol was the
most commonly used substance in 2013 with 45 of BC youth reporting that they had tried it41
Self-reported use of steroids heroin inhalants amphetamines or cocaine has remained stable or declined since 2003 Adolescent use of prescription pills peaked in 2008
Figure 214 Percentage of BC youth who have ever used alcohol cannabis tobacco 2003-201341
Perc
enta
ge
60
55
50
45
40
35
30
25
20 2003 2008 2013
Alcohol
Cannabis
Tobacco
2003 2008 2013
Figure 215 Percentage of BC youth who have ever used prescription pills illicit substances 2003-201341
16
14
12
10
8
6
4
2
0
Cocaine
Prescription Pills
Amphetamines
Heroin
Hallucinogens
Mushrooms
Steriods
Inhalants
Perc
enta
ge
JBack to Table of Content
SUBSTANCE USE TRENDS
26 Y BC DOAP REPORT 2014 Y
Although some students experiment with alcohol and cannabis before the age of 13 the majority (65) who tried alcohol and cannabis did so between the ages of 13 and 15 (Figure 216)41
Table 22 summarizes the self-reported reasons among adolescents for their most recent substance use event The most cited reason was ldquoI wanted to have funrdquo followed by ldquomy friends were doing itrdquo and ldquoI wanted to try itexperimentrdquo
Mental health factors were also reported as reasons for drug use lsquobecause of stressrsquo or feeling ldquodown or sadrdquo Youth who reported self-harm in the past year were more likely to use substances compared to those who had not self-harmed (43 vs 14 respectively)41
Figure 216 Age when BC youth used alcohol or cannabis for the first time41
Perc
enta
ge
Age (years)
25
20
15
10
5
0lt9 9 10 11 12 13 14 15 gt1716
AlcoholCannabis
_
6029271611
9533211
21
693729252110
743211
16
Table 22 Reasons for last time substance uses for BC youth41
Males FemalesI wanted to have funMy friends were doing itI wanted to try itexperimentBecause of stressI felt down or sadI felt like there was nothing else to doTo manage physical painI was pressured into doing itI thought it would help me focusBecause of an addictionI didnrsquot mean to do itTo change the effects of some other drug(s)Other
27Y BC DOAP REPORT 2014 Y
CHAPTER 2
About half of youth who used substances in the past year reported negative consequences The most frequent responses were ldquodoing something they could not rememberrdquo ldquopassing outrdquo and ldquogetting injuredrdquo (Table 23)41
Substance use trends from the 2013 East Kootenay Addiction Service Society (EKASS) survey are similar to the AHS data Since 2005 the proportion of East Kootenay area in-school youth experimenting with substances has declined In 2013 females reported using fewer substances than males This is in contrast to prior years for example alcohol use was 720 for girls and 703 for boys in 2007 but was 585 and 620 in 2013 similarly cannabis use for girls and boys was 362 and 354 in 2007 but 273 and 336 respectively in 201342
The EKASS reports the proportion of students admitting to being in a car with an alcohol-impaired driver reached a high of 601 in 2009 but was 464 in 2013 a consid-erable decrease but still unacceptably high Youth who reported driving after drinking alcohol also dropped from 201 in 2005 to 120 in 2013 Rate of self-reports of
being a passenger in a car with a cannabis-impaired driver was 295 in 2011 These declines may also reflect the overall decrease in substance use among youth42
HIGH RISK YOUTHThe proportion of lifetime drug use among a convenience sample of Vancouver and Victoria area street-involved youth aged 15-24 in the CARBC high risk survey is considerably higher than the in-school youth surveys (Figure 217) Although 2013 data is available for Victoria the most recent data available for Vancouver is 2012 In 2012 marijuana use was more common than alcohol or tobacco and over 90 of youth reported ever using cocaine at both sites Reported lifetime use of amphetamines and ecstasy is more prevalent in street-involved youth from Victoria (53 and 95) than Vancouver (38 and 83)20
Table 23 Consequences of substance use by BC youth in the past year41
31261210109885421
52
4229171555
105
10721
46
Males FemalesWas told I did something I couldnrsquot rememberPassed outGot injuredArgued with family membersDamaged propertyGot in trouble with policeSchoolwork or grades changedGot into a physical fightLost friends or broke up with a girlfriend or boyfriendHad sex when I didnrsquot want toOverdosedHad to get treatment for alcohol or drug abuseUsed alcohol or drugs but none of this things happened
JBack to Table of Content
SUBSTANCE USE TRENDS
28 Y BC DOAP REPORT 2014 Y
Figure 218 shows past 30 day substance use in Vancouver in 2012 More recent data (2013) for Victoria (Figure 219) shows alcohol use in the past 30 days reached its lowest reported prevalence (595) while crystal meth use (811) shows a
steep increase since the second 2011 wave (28) Crack LSD and heroin use declined between the two 2013 waves however this is a small convenience sample (n=50 per wave per city) so rates may be unstable20
Figure 217 Percentage of Vancouver and Victoria street-involved youth who have ever used substances 201220
Perc
enta
ge
Vancouver Victoria
100
90
80
70
60
50
40
30
20
10
0
AlcoholMarijuanaTobaccoCocaineCrackAmphetamineCrystal MethHeroinEcstasyLSDMagic Mushrooms
Figure 218 Substance use trends in the past 30 days among street-involved youth in Vancouver 2008-201220
Perc
enta
ge
100908070605040302010
0
Cocaine Crack Crystal Meth Heroin Marijuana Alcohol
2008 Wave 1
2008 Wave 2
2009Wave 1
2009Wave 2
2010Wave 1
2010Wave 2
2011Wave 1
2011Wave 2
2012 Wave 1
2012 Wave 2
29Y BC DOAP REPORT 2014 Y
CHAPTER 2
When asked about the perceived benefits of drug use in 2013 reasons most cited were helping with social connections alleviating symptoms of mental and physical illness and making respondents feel happy calm and in some cases more productive20
The At-Risk Youth Survey (ARYS) led by UHRI studies risk factors for 14-26 year old street-involved youth in Vancouver Figure 220 represents drugs used by any route at least weekly among ARYS
participants Reported marijuana use declined considerably be-tween 2012 and 2013 However crystal methamphetamine use has increased over the past 3 years similar to that seen in the high-risk youth in Victoria (Figure 219) The proportion of ARYS participants reporting weekly crack use in 2013 (164) is considerably lower than the older Vancouver-based VIDUS and ACCESS cohorts (Figure 28) for which crack was the most widely used substance that year
Perc
enta
ge
Note each category in the graph captures both injection and non-injection use of the specified drug(BC Centre for Excellence in HIVAIDS personal communication June 10 2014)
80
70
60
50
40
30
20
10
0
Figure 220 Weekly drug use patterns among street-involved youth who use illicit drugs in Vancouver Canada 2005-2013
Cocaine Crack Crystal Meth Heroin Injection Marijuana Prescription Opioids
2005 2006 2007 2008 2009 2010 2011 2012 2013
Figure 219 Substance use trends in the past 30 days among street-involved youth in Victoria 2008-201320Pe
rcen
tage
1009080706050403020100
2008 Wave 1
2008 Wave 2
2009Wave 1
2009Wave 2
2010Wave 1
2010Wave 2
2011Wave 1
2011Wave 2
2012 Wave 1
2012 Wave 2
2013Wave 1
2013Wave 2
Cocaine Crack Crystal Meth Heroin Marijuana Alcohol
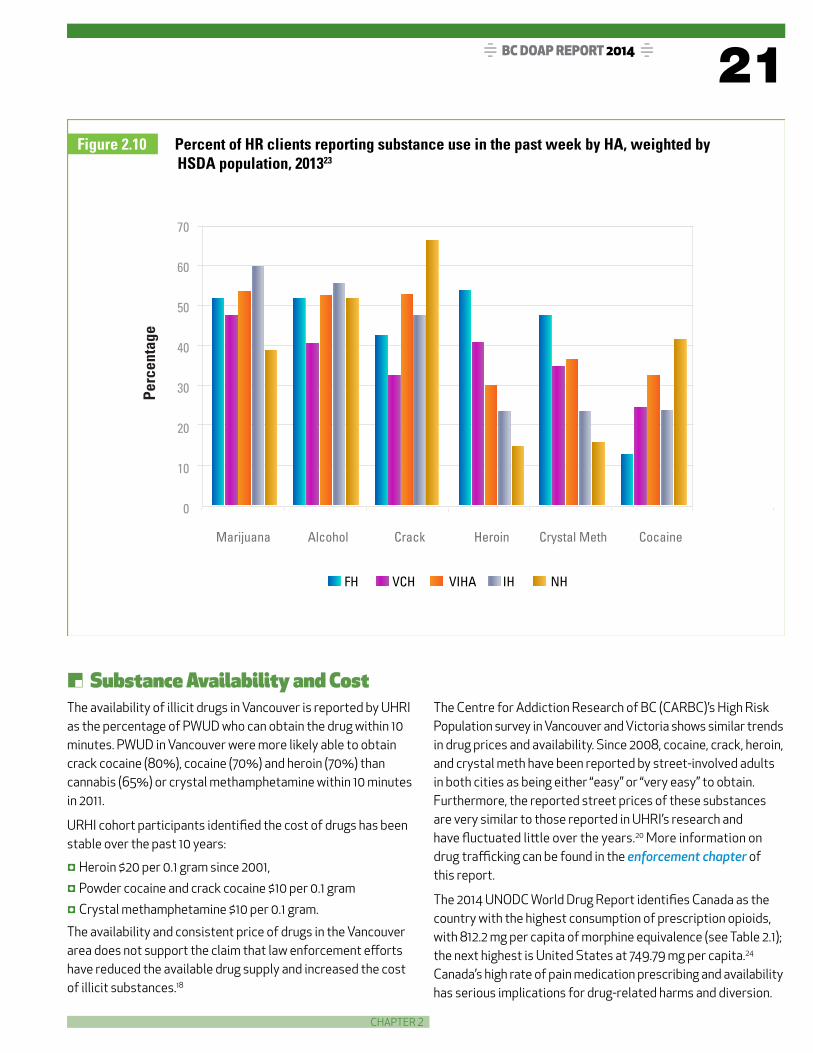

JBack to Table of Content
SUBSTANCE USE TRENDS
22 Y BC DOAP REPORT 2014 Y
0 OxycontinOxyContin a patented prescription version of oxycodone used to treat moderate to intense pain was discontinued in Canada in March 201225 OxyContin was a slow-release narcotic when taken orally as intended however users could release high levels of the drug instantaneously by crushing and snorting the tablet OxyNEO was introduced by the same manufacturer Purdue Pharma as a replacement drug that was designed to be harder to crush and dissolve limiting abuse through snorting and injecting2526 Since its introduction several provincial health plans altered their drug coverage to restrict coverage of OxyNEO In BC only exceptional case-by-base coverage requests for OxyNEO are considered and it is only covered through the palliative care plan2728 There are concerns that the recent lack of OxyContin is leading some opioid dependant users to seek out more accessible and potentially more dangerous opioids A US-based study found that after the formulation changed misuse of OxyContin among patients undergoing opioid dependence treatment decreased from 356 to 12829 However fentanyl and hydromorphone use increased among these patients and heroin use doubled29
Although the replacement of OxyContin with OxyNEO was intended to address concerns over misuse of the drug Health Canadarsquos subsequent decision in November
2012 to approve generic production of extended release oxycodone allowed off-brand versions to enter the Canadian pharmaceutical market30 These generic versions are not currently covered under BCrsquos provincial formulary28
0 Medical MarijuanaThere have been recent developments regarding medical marijuana licensing Health Canadarsquos 2014 proposed Marijuana for Medical Purposes Regulations (MMPR) required patients to end home production of medical marijuana on April 1 201431 However following a consti-tutional challenge to the MMPR a Federal Court granted an injunction on March 21 201432 This allows those with personal and designated production licenses (for persons responsible for the patient) to continue home production of medical marijuana until the case goes to trial in spring 201532 The injunction does not affect Health Canadarsquos new medical marijuana licensing system for dispensing prescribed marijuana and there are concerns that new patients will have difficulty affording the higher marijuana prices projected to result from the federal legislation32 On a related note licensed sales of recreational marijuana began in Washington State on July 8 201433 This may have implications on illicit cannabis trade with BC given the US statersquos close proximity
Table 21 Morphine equivalence consumption per capita Canada 2011
Drug mgcapita ME mgcapita
Fentanyl
Hydromorphone
Methadone
Morphine
Oxycodone
Pethidine
Total Morphine Equivalence
24366
250938
200946
874741
1458966
71278
2030396
1254691
2003782
874741
1940425
17820
8121855
httpwwwpainpolicywisceducountryprofilecanada
23Y BC DOAP REPORT 2014 Y
CHAPTER 2
0 FentanylBC has experienced a recent increase in fentanyl availability and fentanyl-detected deaths Fentanyl is a synthetic narcotic that is used to relieve intense pain In BC fentanyl can be prescribed for pain management as a transdermal patch which provides sustained release of the drug34 However this formulation is susceptible to abuse through the extraction of patch contents and subsequent intrave-nous injection35 Fentanyl is 50-100 times more potent than morphine which greatly increases the risk of accidental overdose36 Early signs of fentanyl overdose include severe sleepiness slow heartbeat difficulty breathing coldclammy skin and trouble with walking or talking36
The RCMP and municipal police forces in BC have identi-fied illegally manufactured fentanyl as a white powder resembling heroin and in tablet form as counterfeit oxycodone (fake oxy) tablets3738 Illegally-produced fentanyl can be significantly more toxic than the pharma-ceutical-grade39 Tablets containing fentanyl are green and are stamped with ldquoCDNrdquo and the number 80 on the opposite sides (Figure 211) These pills are nicknamed ldquogreen jelliesrdquo and ldquostreet oxyrdquo in Western Canada37 White tablets with ldquoCDNrdquo and ldquo10rdquo stamped on them have also appeared in British Columbia (Figure 211) Seized quan-tities of these two versions tested positive for fentanyl 89 of the time and contain variable sometimes very high dose of fentanyl37 Individuals using these drugs may be under the assumption that they contain oxycodone only and are therefore at high risk of accidental overdose
On May 30th 2013 in response to an increase in fentayl- detected deaths in BC a joint alert was issued by the Provincial Health Officer BC Coroners Service (BCCS) healthcare and enforcement partners warning the public of the increase in deaths and availability of fentanyl within the street drug market After the alert fentanyl- detected deaths declined in June and July 2013 but have since increased In 2012 there were 15 fentanyl-detected deaths a total of 51 fentanyl-detected deaths were iden-tified in BC in 2013 most 2013 fentanyl-detected deaths occurred in Metro Vancouver region (15) Island (14) and Fraser (12) (Figure 212)
Preliminary data from the BCCS indicates 49 fentanyl- detected deaths occurred in the first eight months of 2014 (January 1st to August 31st) of these 10 occurred in the City of Vancouver and 18 in the Fraser region about a third (16) were female Please note that 2013 and 2014 data are preliminary and subject to change and these deaths only include fentanyl found in illicit drug-related circumstances and exclude overdose deaths in persons prescribed fentanyl40
In June 2014 the BCCS issued another public warning urging all PWUD to exercise extreme caution when consuming substances that may contain fentanyl More information regarding fentanyl can be found in the Mortality section37
Figure 211 Samples of seized counterfeit oxycodone tablets39
JBack to Table of Content
SUBSTANCE USE TRENDS
24 Y BC DOAP REPORT 2014 YN
umbe
r of D
eath
s
16
141210
8642
2012 2013 Jan 1-Aug 31 20140
Fraser 6
3
2
3
115
12
15
14
3
751
18
12
7
7
549
Metro
Island
InteriorNorthern
Total
Figure 212 Fentanyl-detected deaths by BCCS region 2012-201440
Figure 213 Fentanyl-detected deaths by sex 2012-201440
50
40
30
20
10
02012 2013 Jan 1-Aug 31 2014
Male
Female
12
3
42
9
33
16
Num
ber o
f Dea
ths
25Y BC DOAP REPORT 2014 Y
CHAPTER 2
0 Youth YOUTH IN SCHOOLThe McCreary Centre Society recruits grade 7-12 students in public schools throughout BC to participate in the Adolescent Health Survey (AHS) every five years Since these participants are in school they are unlikely to have major substance use problems The 2013 survey had 259138 participants and found that self-reported substance use among BC adolescents has declined since 2003 (Figures 214 and 215) Alcohol was the
most commonly used substance in 2013 with 45 of BC youth reporting that they had tried it41
Self-reported use of steroids heroin inhalants amphetamines or cocaine has remained stable or declined since 2003 Adolescent use of prescription pills peaked in 2008
Figure 214 Percentage of BC youth who have ever used alcohol cannabis tobacco 2003-201341
Perc
enta
ge
60
55
50
45
40
35
30
25
20 2003 2008 2013
Alcohol
Cannabis
Tobacco
2003 2008 2013
Figure 215 Percentage of BC youth who have ever used prescription pills illicit substances 2003-201341
16
14
12
10
8
6
4
2
0
Cocaine
Prescription Pills
Amphetamines
Heroin
Hallucinogens
Mushrooms
Steriods
Inhalants
Perc
enta
ge
JBack to Table of Content
SUBSTANCE USE TRENDS
26 Y BC DOAP REPORT 2014 Y
Although some students experiment with alcohol and cannabis before the age of 13 the majority (65) who tried alcohol and cannabis did so between the ages of 13 and 15 (Figure 216)41
Table 22 summarizes the self-reported reasons among adolescents for their most recent substance use event The most cited reason was ldquoI wanted to have funrdquo followed by ldquomy friends were doing itrdquo and ldquoI wanted to try itexperimentrdquo
Mental health factors were also reported as reasons for drug use lsquobecause of stressrsquo or feeling ldquodown or sadrdquo Youth who reported self-harm in the past year were more likely to use substances compared to those who had not self-harmed (43 vs 14 respectively)41
Figure 216 Age when BC youth used alcohol or cannabis for the first time41
Perc
enta
ge
Age (years)
25
20
15
10
5
0lt9 9 10 11 12 13 14 15 gt1716
AlcoholCannabis
_
6029271611
9533211
21
693729252110
743211
16
Table 22 Reasons for last time substance uses for BC youth41
Males FemalesI wanted to have funMy friends were doing itI wanted to try itexperimentBecause of stressI felt down or sadI felt like there was nothing else to doTo manage physical painI was pressured into doing itI thought it would help me focusBecause of an addictionI didnrsquot mean to do itTo change the effects of some other drug(s)Other
27Y BC DOAP REPORT 2014 Y
CHAPTER 2
About half of youth who used substances in the past year reported negative consequences The most frequent responses were ldquodoing something they could not rememberrdquo ldquopassing outrdquo and ldquogetting injuredrdquo (Table 23)41
Substance use trends from the 2013 East Kootenay Addiction Service Society (EKASS) survey are similar to the AHS data Since 2005 the proportion of East Kootenay area in-school youth experimenting with substances has declined In 2013 females reported using fewer substances than males This is in contrast to prior years for example alcohol use was 720 for girls and 703 for boys in 2007 but was 585 and 620 in 2013 similarly cannabis use for girls and boys was 362 and 354 in 2007 but 273 and 336 respectively in 201342
The EKASS reports the proportion of students admitting to being in a car with an alcohol-impaired driver reached a high of 601 in 2009 but was 464 in 2013 a consid-erable decrease but still unacceptably high Youth who reported driving after drinking alcohol also dropped from 201 in 2005 to 120 in 2013 Rate of self-reports of
being a passenger in a car with a cannabis-impaired driver was 295 in 2011 These declines may also reflect the overall decrease in substance use among youth42
HIGH RISK YOUTHThe proportion of lifetime drug use among a convenience sample of Vancouver and Victoria area street-involved youth aged 15-24 in the CARBC high risk survey is considerably higher than the in-school youth surveys (Figure 217) Although 2013 data is available for Victoria the most recent data available for Vancouver is 2012 In 2012 marijuana use was more common than alcohol or tobacco and over 90 of youth reported ever using cocaine at both sites Reported lifetime use of amphetamines and ecstasy is more prevalent in street-involved youth from Victoria (53 and 95) than Vancouver (38 and 83)20
Table 23 Consequences of substance use by BC youth in the past year41
31261210109885421
52
4229171555
105
10721
46
Males FemalesWas told I did something I couldnrsquot rememberPassed outGot injuredArgued with family membersDamaged propertyGot in trouble with policeSchoolwork or grades changedGot into a physical fightLost friends or broke up with a girlfriend or boyfriendHad sex when I didnrsquot want toOverdosedHad to get treatment for alcohol or drug abuseUsed alcohol or drugs but none of this things happened
JBack to Table of Content
SUBSTANCE USE TRENDS
28 Y BC DOAP REPORT 2014 Y
Figure 218 shows past 30 day substance use in Vancouver in 2012 More recent data (2013) for Victoria (Figure 219) shows alcohol use in the past 30 days reached its lowest reported prevalence (595) while crystal meth use (811) shows a
steep increase since the second 2011 wave (28) Crack LSD and heroin use declined between the two 2013 waves however this is a small convenience sample (n=50 per wave per city) so rates may be unstable20
Figure 217 Percentage of Vancouver and Victoria street-involved youth who have ever used substances 201220
Perc
enta
ge
Vancouver Victoria
100
90
80
70
60
50
40
30
20
10
0
AlcoholMarijuanaTobaccoCocaineCrackAmphetamineCrystal MethHeroinEcstasyLSDMagic Mushrooms
Figure 218 Substance use trends in the past 30 days among street-involved youth in Vancouver 2008-201220
Perc
enta
ge
100908070605040302010
0
Cocaine Crack Crystal Meth Heroin Marijuana Alcohol
2008 Wave 1
2008 Wave 2
2009Wave 1
2009Wave 2
2010Wave 1
2010Wave 2
2011Wave 1
2011Wave 2
2012 Wave 1
2012 Wave 2
29Y BC DOAP REPORT 2014 Y
CHAPTER 2
When asked about the perceived benefits of drug use in 2013 reasons most cited were helping with social connections alleviating symptoms of mental and physical illness and making respondents feel happy calm and in some cases more productive20
The At-Risk Youth Survey (ARYS) led by UHRI studies risk factors for 14-26 year old street-involved youth in Vancouver Figure 220 represents drugs used by any route at least weekly among ARYS
participants Reported marijuana use declined considerably be-tween 2012 and 2013 However crystal methamphetamine use has increased over the past 3 years similar to that seen in the high-risk youth in Victoria (Figure 219) The proportion of ARYS participants reporting weekly crack use in 2013 (164) is considerably lower than the older Vancouver-based VIDUS and ACCESS cohorts (Figure 28) for which crack was the most widely used substance that year
Perc
enta
ge
Note each category in the graph captures both injection and non-injection use of the specified drug(BC Centre for Excellence in HIVAIDS personal communication June 10 2014)
80
70
60
50
40
30
20
10
0
Figure 220 Weekly drug use patterns among street-involved youth who use illicit drugs in Vancouver Canada 2005-2013
Cocaine Crack Crystal Meth Heroin Injection Marijuana Prescription Opioids
2005 2006 2007 2008 2009 2010 2011 2012 2013
Figure 219 Substance use trends in the past 30 days among street-involved youth in Victoria 2008-201320Pe
rcen
tage
1009080706050403020100
2008 Wave 1
2008 Wave 2
2009Wave 1
2009Wave 2
2010Wave 1
2010Wave 2
2011Wave 1
2011Wave 2
2012 Wave 1
2012 Wave 2
2013Wave 1
2013Wave 2
Cocaine Crack Crystal Meth Heroin Marijuana Alcohol
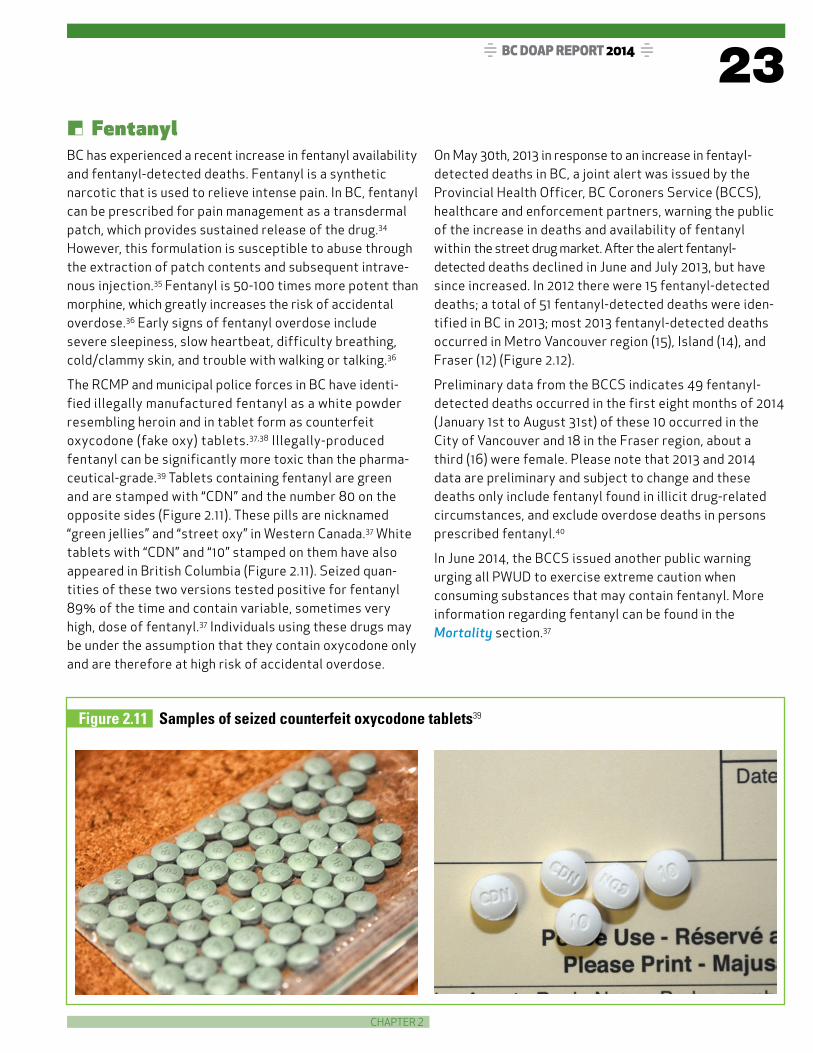
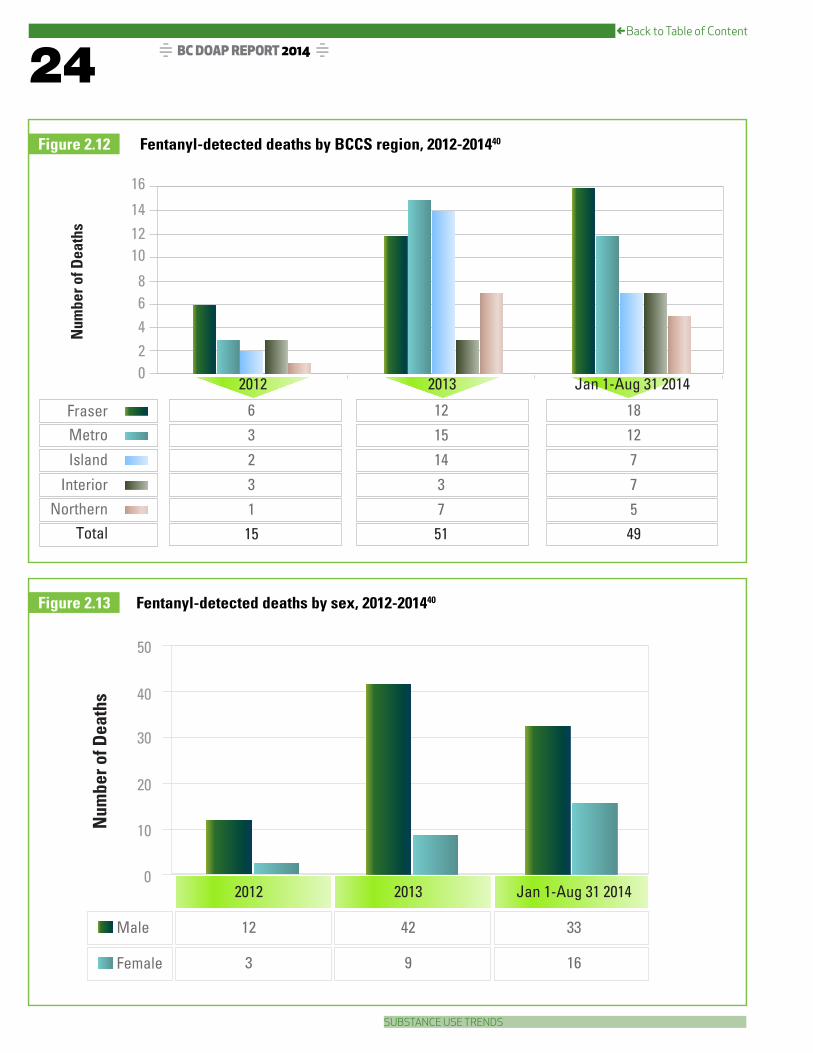
JBack to Table of Content
SUBSTANCE USE TRENDS
24 Y BC DOAP REPORT 2014 YN
umbe
r of D
eath
s
16
141210
8642
2012 2013 Jan 1-Aug 31 20140
Fraser 6
3
2
3
115
12
15
14
3
751
18
12
7
7
549
Metro
Island
InteriorNorthern
Total
Figure 212 Fentanyl-detected deaths by BCCS region 2012-201440
Figure 213 Fentanyl-detected deaths by sex 2012-201440
50
40
30
20
10
02012 2013 Jan 1-Aug 31 2014
Male
Female
12
3
42
9
33
16
Num
ber o
f Dea
ths
25Y BC DOAP REPORT 2014 Y
CHAPTER 2
0 Youth YOUTH IN SCHOOLThe McCreary Centre Society recruits grade 7-12 students in public schools throughout BC to participate in the Adolescent Health Survey (AHS) every five years Since these participants are in school they are unlikely to have major substance use problems The 2013 survey had 259138 participants and found that self-reported substance use among BC adolescents has declined since 2003 (Figures 214 and 215) Alcohol was the
most commonly used substance in 2013 with 45 of BC youth reporting that they had tried it41
Self-reported use of steroids heroin inhalants amphetamines or cocaine has remained stable or declined since 2003 Adolescent use of prescription pills peaked in 2008
Figure 214 Percentage of BC youth who have ever used alcohol cannabis tobacco 2003-201341
Perc
enta
ge
60
55
50
45
40
35
30
25
20 2003 2008 2013
Alcohol
Cannabis
Tobacco
2003 2008 2013
Figure 215 Percentage of BC youth who have ever used prescription pills illicit substances 2003-201341
16
14
12
10
8
6
4
2
0
Cocaine
Prescription Pills
Amphetamines
Heroin
Hallucinogens
Mushrooms
Steriods
Inhalants
Perc
enta
ge
JBack to Table of Content
SUBSTANCE USE TRENDS
26 Y BC DOAP REPORT 2014 Y
Although some students experiment with alcohol and cannabis before the age of 13 the majority (65) who tried alcohol and cannabis did so between the ages of 13 and 15 (Figure 216)41
Table 22 summarizes the self-reported reasons among adolescents for their most recent substance use event The most cited reason was ldquoI wanted to have funrdquo followed by ldquomy friends were doing itrdquo and ldquoI wanted to try itexperimentrdquo
Mental health factors were also reported as reasons for drug use lsquobecause of stressrsquo or feeling ldquodown or sadrdquo Youth who reported self-harm in the past year were more likely to use substances compared to those who had not self-harmed (43 vs 14 respectively)41
Figure 216 Age when BC youth used alcohol or cannabis for the first time41
Perc
enta
ge
Age (years)
25
20
15
10
5
0lt9 9 10 11 12 13 14 15 gt1716
AlcoholCannabis
_
6029271611
9533211
21
693729252110
743211
16
Table 22 Reasons for last time substance uses for BC youth41
Males FemalesI wanted to have funMy friends were doing itI wanted to try itexperimentBecause of stressI felt down or sadI felt like there was nothing else to doTo manage physical painI was pressured into doing itI thought it would help me focusBecause of an addictionI didnrsquot mean to do itTo change the effects of some other drug(s)Other
27Y BC DOAP REPORT 2014 Y
CHAPTER 2
About half of youth who used substances in the past year reported negative consequences The most frequent responses were ldquodoing something they could not rememberrdquo ldquopassing outrdquo and ldquogetting injuredrdquo (Table 23)41
Substance use trends from the 2013 East Kootenay Addiction Service Society (EKASS) survey are similar to the AHS data Since 2005 the proportion of East Kootenay area in-school youth experimenting with substances has declined In 2013 females reported using fewer substances than males This is in contrast to prior years for example alcohol use was 720 for girls and 703 for boys in 2007 but was 585 and 620 in 2013 similarly cannabis use for girls and boys was 362 and 354 in 2007 but 273 and 336 respectively in 201342
The EKASS reports the proportion of students admitting to being in a car with an alcohol-impaired driver reached a high of 601 in 2009 but was 464 in 2013 a consid-erable decrease but still unacceptably high Youth who reported driving after drinking alcohol also dropped from 201 in 2005 to 120 in 2013 Rate of self-reports of
being a passenger in a car with a cannabis-impaired driver was 295 in 2011 These declines may also reflect the overall decrease in substance use among youth42
HIGH RISK YOUTHThe proportion of lifetime drug use among a convenience sample of Vancouver and Victoria area street-involved youth aged 15-24 in the CARBC high risk survey is considerably higher than the in-school youth surveys (Figure 217) Although 2013 data is available for Victoria the most recent data available for Vancouver is 2012 In 2012 marijuana use was more common than alcohol or tobacco and over 90 of youth reported ever using cocaine at both sites Reported lifetime use of amphetamines and ecstasy is more prevalent in street-involved youth from Victoria (53 and 95) than Vancouver (38 and 83)20
Table 23 Consequences of substance use by BC youth in the past year41
31261210109885421
52
4229171555
105
10721
46
Males FemalesWas told I did something I couldnrsquot rememberPassed outGot injuredArgued with family membersDamaged propertyGot in trouble with policeSchoolwork or grades changedGot into a physical fightLost friends or broke up with a girlfriend or boyfriendHad sex when I didnrsquot want toOverdosedHad to get treatment for alcohol or drug abuseUsed alcohol or drugs but none of this things happened
JBack to Table of Content
SUBSTANCE USE TRENDS
28 Y BC DOAP REPORT 2014 Y
Figure 218 shows past 30 day substance use in Vancouver in 2012 More recent data (2013) for Victoria (Figure 219) shows alcohol use in the past 30 days reached its lowest reported prevalence (595) while crystal meth use (811) shows a
steep increase since the second 2011 wave (28) Crack LSD and heroin use declined between the two 2013 waves however this is a small convenience sample (n=50 per wave per city) so rates may be unstable20
Figure 217 Percentage of Vancouver and Victoria street-involved youth who have ever used substances 201220
Perc
enta
ge
Vancouver Victoria
100
90
80
70
60
50
40
30
20
10
0
AlcoholMarijuanaTobaccoCocaineCrackAmphetamineCrystal MethHeroinEcstasyLSDMagic Mushrooms
Figure 218 Substance use trends in the past 30 days among street-involved youth in Vancouver 2008-201220
Perc
enta
ge
100908070605040302010
0
Cocaine Crack Crystal Meth Heroin Marijuana Alcohol
2008 Wave 1
2008 Wave 2
2009Wave 1
2009Wave 2
2010Wave 1
2010Wave 2
2011Wave 1
2011Wave 2
2012 Wave 1
2012 Wave 2
29Y BC DOAP REPORT 2014 Y
CHAPTER 2
When asked about the perceived benefits of drug use in 2013 reasons most cited were helping with social connections alleviating symptoms of mental and physical illness and making respondents feel happy calm and in some cases more productive20
The At-Risk Youth Survey (ARYS) led by UHRI studies risk factors for 14-26 year old street-involved youth in Vancouver Figure 220 represents drugs used by any route at least weekly among ARYS
participants Reported marijuana use declined considerably be-tween 2012 and 2013 However crystal methamphetamine use has increased over the past 3 years similar to that seen in the high-risk youth in Victoria (Figure 219) The proportion of ARYS participants reporting weekly crack use in 2013 (164) is considerably lower than the older Vancouver-based VIDUS and ACCESS cohorts (Figure 28) for which crack was the most widely used substance that year
Perc
enta
ge
Note each category in the graph captures both injection and non-injection use of the specified drug(BC Centre for Excellence in HIVAIDS personal communication June 10 2014)
80
70
60
50
40
30
20
10
0
Figure 220 Weekly drug use patterns among street-involved youth who use illicit drugs in Vancouver Canada 2005-2013
Cocaine Crack Crystal Meth Heroin Injection Marijuana Prescription Opioids
2005 2006 2007 2008 2009 2010 2011 2012 2013
Figure 219 Substance use trends in the past 30 days among street-involved youth in Victoria 2008-201320Pe
rcen
tage
1009080706050403020100
2008 Wave 1
2008 Wave 2
2009Wave 1
2009Wave 2
2010Wave 1
2010Wave 2
2011Wave 1
2011Wave 2
2012 Wave 1
2012 Wave 2
2013Wave 1
2013Wave 2
Cocaine Crack Crystal Meth Heroin Marijuana Alcohol
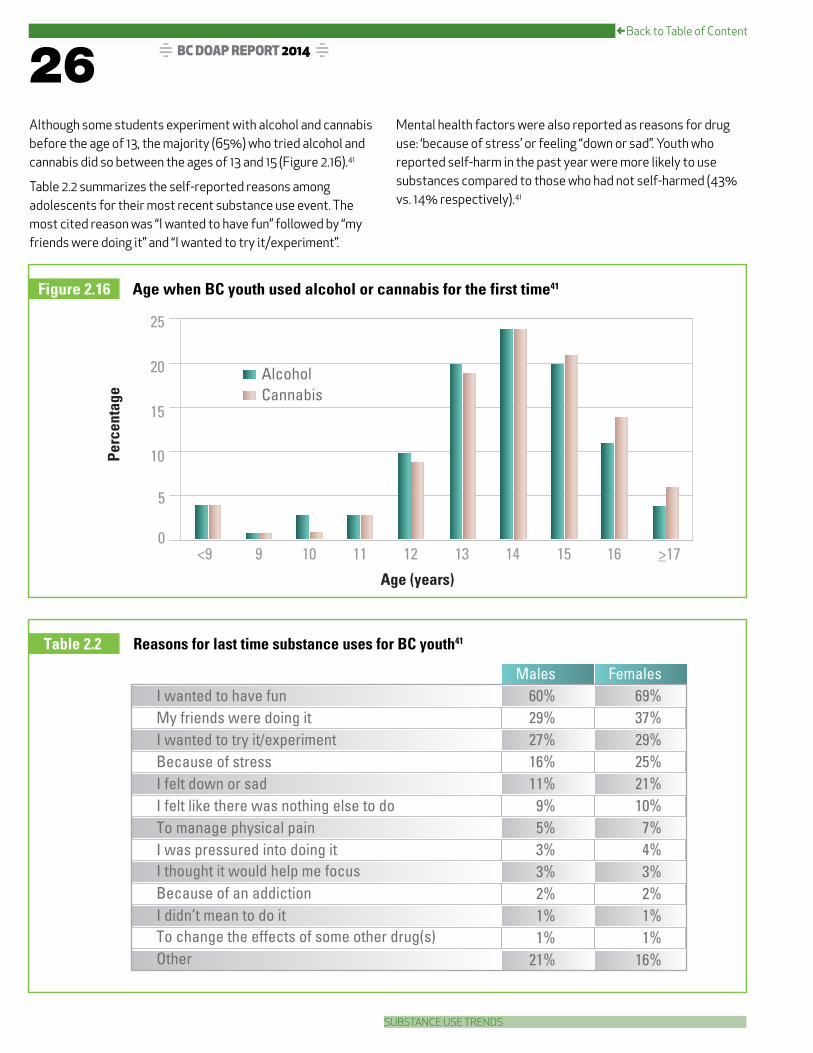
JBack to Table of Content
SUBSTANCE USE TRENDS
26 Y BC DOAP REPORT 2014 Y
Although some students experiment with alcohol and cannabis before the age of 13 the majority (65) who tried alcohol and cannabis did so between the ages of 13 and 15 (Figure 216)41
Table 22 summarizes the self-reported reasons among adolescents for their most recent substance use event The most cited reason was ldquoI wanted to have funrdquo followed by ldquomy friends were doing itrdquo and ldquoI wanted to try itexperimentrdquo
Mental health factors were also reported as reasons for drug use lsquobecause of stressrsquo or feeling ldquodown or sadrdquo Youth who reported self-harm in the past year were more likely to use substances compared to those who had not self-harmed (43 vs 14 respectively)41
Figure 216 Age when BC youth used alcohol or cannabis for the first time41
Perc
enta
ge
Age (years)
25
20
15
10
5
0lt9 9 10 11 12 13 14 15 gt1716
AlcoholCannabis
_
6029271611
9533211
21
693729252110
743211
16
Table 22 Reasons for last time substance uses for BC youth41
Males FemalesI wanted to have funMy friends were doing itI wanted to try itexperimentBecause of stressI felt down or sadI felt like there was nothing else to doTo manage physical painI was pressured into doing itI thought it would help me focusBecause of an addictionI didnrsquot mean to do itTo change the effects of some other drug(s)Other
27Y BC DOAP REPORT 2014 Y
CHAPTER 2
About half of youth who used substances in the past year reported negative consequences The most frequent responses were ldquodoing something they could not rememberrdquo ldquopassing outrdquo and ldquogetting injuredrdquo (Table 23)41
Substance use trends from the 2013 East Kootenay Addiction Service Society (EKASS) survey are similar to the AHS data Since 2005 the proportion of East Kootenay area in-school youth experimenting with substances has declined In 2013 females reported using fewer substances than males This is in contrast to prior years for example alcohol use was 720 for girls and 703 for boys in 2007 but was 585 and 620 in 2013 similarly cannabis use for girls and boys was 362 and 354 in 2007 but 273 and 336 respectively in 201342
The EKASS reports the proportion of students admitting to being in a car with an alcohol-impaired driver reached a high of 601 in 2009 but was 464 in 2013 a consid-erable decrease but still unacceptably high Youth who reported driving after drinking alcohol also dropped from 201 in 2005 to 120 in 2013 Rate of self-reports of
being a passenger in a car with a cannabis-impaired driver was 295 in 2011 These declines may also reflect the overall decrease in substance use among youth42
HIGH RISK YOUTHThe proportion of lifetime drug use among a convenience sample of Vancouver and Victoria area street-involved youth aged 15-24 in the CARBC high risk survey is considerably higher than the in-school youth surveys (Figure 217) Although 2013 data is available for Victoria the most recent data available for Vancouver is 2012 In 2012 marijuana use was more common than alcohol or tobacco and over 90 of youth reported ever using cocaine at both sites Reported lifetime use of amphetamines and ecstasy is more prevalent in street-involved youth from Victoria (53 and 95) than Vancouver (38 and 83)20
Table 23 Consequences of substance use by BC youth in the past year41
31261210109885421
52
4229171555
105
10721
46
Males FemalesWas told I did something I couldnrsquot rememberPassed outGot injuredArgued with family membersDamaged propertyGot in trouble with policeSchoolwork or grades changedGot into a physical fightLost friends or broke up with a girlfriend or boyfriendHad sex when I didnrsquot want toOverdosedHad to get treatment for alcohol or drug abuseUsed alcohol or drugs but none of this things happened
JBack to Table of Content
SUBSTANCE USE TRENDS
28 Y BC DOAP REPORT 2014 Y
Figure 218 shows past 30 day substance use in Vancouver in 2012 More recent data (2013) for Victoria (Figure 219) shows alcohol use in the past 30 days reached its lowest reported prevalence (595) while crystal meth use (811) shows a
steep increase since the second 2011 wave (28) Crack LSD and heroin use declined between the two 2013 waves however this is a small convenience sample (n=50 per wave per city) so rates may be unstable20
Figure 217 Percentage of Vancouver and Victoria street-involved youth who have ever used substances 201220
Perc
enta
ge
Vancouver Victoria
100
90
80
70
60
50
40
30
20
10
0
AlcoholMarijuanaTobaccoCocaineCrackAmphetamineCrystal MethHeroinEcstasyLSDMagic Mushrooms
Figure 218 Substance use trends in the past 30 days among street-involved youth in Vancouver 2008-201220
Perc
enta
ge
100908070605040302010
0
Cocaine Crack Crystal Meth Heroin Marijuana Alcohol
2008 Wave 1
2008 Wave 2
2009Wave 1
2009Wave 2
2010Wave 1
2010Wave 2
2011Wave 1
2011Wave 2
2012 Wave 1
2012 Wave 2
29Y BC DOAP REPORT 2014 Y
CHAPTER 2
When asked about the perceived benefits of drug use in 2013 reasons most cited were helping with social connections alleviating symptoms of mental and physical illness and making respondents feel happy calm and in some cases more productive20
The At-Risk Youth Survey (ARYS) led by UHRI studies risk factors for 14-26 year old street-involved youth in Vancouver Figure 220 represents drugs used by any route at least weekly among ARYS
participants Reported marijuana use declined considerably be-tween 2012 and 2013 However crystal methamphetamine use has increased over the past 3 years similar to that seen in the high-risk youth in Victoria (Figure 219) The proportion of ARYS participants reporting weekly crack use in 2013 (164) is considerably lower than the older Vancouver-based VIDUS and ACCESS cohorts (Figure 28) for which crack was the most widely used substance that year
Perc
enta
ge
Note each category in the graph captures both injection and non-injection use of the specified drug(BC Centre for Excellence in HIVAIDS personal communication June 10 2014)
80
70
60
50
40
30
20
10
0
Figure 220 Weekly drug use patterns among street-involved youth who use illicit drugs in Vancouver Canada 2005-2013
Cocaine Crack Crystal Meth Heroin Injection Marijuana Prescription Opioids
2005 2006 2007 2008 2009 2010 2011 2012 2013
Figure 219 Substance use trends in the past 30 days among street-involved youth in Victoria 2008-201320Pe
rcen
tage
1009080706050403020100
2008 Wave 1
2008 Wave 2
2009Wave 1
2009Wave 2
2010Wave 1
2010Wave 2
2011Wave 1
2011Wave 2
2012 Wave 1
2012 Wave 2
2013Wave 1
2013Wave 2
Cocaine Crack Crystal Meth Heroin Marijuana Alcohol