Embed Size (px)
Citation preview

51
CHAPTER 2
SIMULTANEOUS ESTIMATION OF PIOGLITAZONE,
GLIMEPIRIDE AND GLIMEPIRIDE IMPURITIES IN
COMBINATION DRUG PRODUCT BY A VALIDATED
STABILITY-INDICATING RP-HPLC METHOD
2.1 INTRODUCTION OF DOSAGE FORM AND
LITERATURE REVIEW
Type 2 diabetes is a disorder characterized by high levels of glucose in
the blood. It is the most common form of diabetes. Once affected, people have to
deal with this disorder for the rest of their lives. A combination of glimepiride,
pioglitazone hydrochloride and metformin hydrochloride extended release is used
for the management of type 2 diabetes. The primary mechanism of glimepiride in
lowering blood glucose is dependent, likely, on stimulating the release of insulin
from functioning pancreatic beta cells (Sweetman 2009). Pioglitazone
hydrochloride is a potent and highly selective agonist for peroxisome
proliferators-activated receptor gamma (Sweetman 2009). Metformin
hydrochloride helps in decreasing hepatic glucose production, decreasing
intestinal absorption of glucose and improving insulin sensitivity by increasing
peripheral glucose uptake and utilization. Thus, this combination helps in
providing better glycaemic control in the management of type 2 diabetes. It also
probably plays a role in the prevention of associated macrovascular and
microvascular complications.
Glimepiride estimation was in USP (2011). The HPLC method is
mentioned as the main method for the determination of purity of both the raw
materials and pharmaceutical formulations. The literature contains several
52
methods for the determination of glimepiride in pharmaceutical dosage forms,
including liquid chromatography (Warnjari and Gaikwad 2005) and derivative
spectroscopy (Bonfilio et al 2011). Bansal et al (2008), Kovařı́ková et al (2004)
and Khan et al (2005) have worked with glimepiride related substances and
degradation pathway methods. Similarly, Ramulu et al (2010), Shirkhedkar and
Surana (2009) and Smita Sharma et al (2010) have published the degradation
behavior of pioglitazone and stability-indicating assay methods. Jain et al (2008),
Karthik et al (2008) and Lakshmi et al (2009) have estimated the drugs in the
combination drug product.
2.1.1 Target of the Work
No stability-indicating HPLC method has been reported yet for the
simultaneous determination of pioglitazone, glimepiride and glimepiride
impurities in the combination drug product. Glimepiride and pioglitazone are
highly unstable compounds. Although several pharmaceutical companies have
marketed this combination drug product, no analytical method is available to
determine this product through routine quality control and stability sample
analysis processes. It is essential to develop a stability-indicating assay method
for the unstable molecules in glimepiride and pioglitazone. Additionally, to prove
the selectivity of the method, glimepiride major degradations of impurity B and
impurity C were injected and estimated in the combination tablets. The aim of the
present study is to develop a single HPLC method for the simultaneous estimation
of pioglitazone, glimepiride, glimepiride impurity B and impurity C from the
combination drug product.

53
2.2 EXPERIMENTAL
2.2.1 Materials and Reagents
Pharmaceutical grade standards of pioglitazone (chemically: 5-(4-[2-
(5-ethylpyridin-2-yl)ethoxy]benzyl) thiazolidine-2,4-dione) and glimepiride
(chemically: 3-ethyl-4-methyl-N-(4-[N-((1r,4r)-4-methyl cyclohexylcarbamoyl)
sulfamoyl]phenethyl)-2-oxo-2,5-dihydro-1H-pyrrole-1-carboxamide) were
supplied by M/S Pharma Lab (Baddi, India). Glimepiride impurity B (chemically:
3-Ethyl-4-methyl-2-oxo-N-[2-(4- sulphamoylphenyl) ethyl]-2,3-dihydro-1H-
pyrrole-1-carboxamide ) and impurity C (chemically: Methyl [[4-[2-[[(3-Ethyl-4-
methyl-2-oxo-2,3-dihydro-1H-pyrrol-1-yl) carbonyl]amino]ethyl]phenyl]-
sulphonyl] carbamate) were purchased from LGC Standards (Mumbai, India).
Chemical structures are shown in Figures 2.1 to 2.4. Commercially available
combination tablets containing 15 mg of pioglitazone, 2 mg of glimepiride and
500 mg of metformin hydrochloride (PRICHEK GMP®-manufactured by Indoco
Rem) were purchased. HPLC grade acetonitrile, analytical reagent grade
potassium dihydrogen phosphate and orthophosphoric acid were obtained from
Rankem (India). Millipore water manufactured by the Milli-Q plus water
purification system was used (Bedford, MA, USA).
Figure 2.1 Chemical structure of pioglitazone
(MF: C19H20N2O3S, MW: 356)

54
Figure 2.2 Chemical structure of glimepiride
(MF: C24H34N4O5S, MW: 490)
Figure 2.3 Chemical structure of glimepiride impurity B
(MF: C8H9NO2, MW: 151)
Figure 2.4 Chemical structure of glimepiride impurity C
(MF: C18H23N3O6S, MW: 409)

55
2.2.2 Instrumentation
The Waters HPLC system consisting of 2695 binary pump plus auto
sampler, a 2996 photo diode array and a 2487 UV detector (Waters Corporation,
Milford, USA) was used for the development and validation.
2.2.3 System Suitability Solution
Stock solutions of glimepiride impurity B, impurity C and glimepiride
(1000 µg/mL) were prepared by dissolving appropriate amounts in methanol.
System suitability solutions of 0.2 µg/mL of impurity B and impurity C and 0.5
µg/mL of glimepiride were prepared from the above mentioned stock solutions
with a diluent mixture of acetonitrile and water (8:2, v/v).
2.2.4 Preparation of Standard Solution
A standard solution, containing 750 µg/mL of pioglitazone and 100
µg/mL of glimepiride, was prepared by dissolving the appropriate amount of
pioglitazone and glimepiride standard in diluent.
2.2.5 Preparation of Sample Solution
Twenty tablets were weighed and powdered with the mortar and pestle
tool. Powder tablets equivalent to 10 mg of glimepiride (equivalent to 75 mg of
pioglitazone) were transferred to a 100 mL volumetric flask. About 60 mL of
diluent was added and kept on a rotatory shaker for 10 min to disperse the
material completely, sonicated for 10 min (during sonication, the bath
temperature was maintained at 25°C) and diluted to 100 mL with diluent. The
concentration of pioglitazone and glimepiride was 750 µg/mL and 100 µg/mL.
The resulting solution was centrifuged at 10000 rpm for 5 min. The supernatant

56
solution was used for the estimation of pioglitazone, glimepiride and glimepiride
impurities.
2.3 RESULTS AND DISCUSSION
2.3.1 Optimization of Chromatographic Method
The HPLC method was optimized with a view to develop a stability-
indicating method. The stability-indicating method should accurately measure the
active ingredients without any interference from degradation products and sample
matrices. As pioglitazone and glimepiride have degradation qualities, the gradient
method was preferred over the isocratic method to get a complete degradation
product as well as a good resolution between close eluting compounds. The initial
trials were taken with the pure drug forms of pioglitazone and glimepiride spiked
with glimepiride impurity B and glimepiride impurity C. Different buffer pH (2-
7) and solvent systems containing methanol and acetonitrile were tested. The
reverse phase column chemistry of C18 was applied for the preliminary trial. A
good separation was achieved in the gradient program containing solution A
(phosphate buffer at pH 3.2) and solution B (acetonitrile), with a flow rate of 0.8
mL/min. To prove the stability-indicating nature of the method, all forced
degradation samples were injected in the optimized conditions. The peak purity of
glimepiride and pioglitazone was not successful because of the interference of
degradation compounds. To rectify this problem, a little adjustment in gradient,
column temperature and flow rate was made, but these trials were not coming up
with the desired results. So, different column chemistry was tried. Initially, the C8
column was selected, and a known compound was merged. While using the
phenyl column, one degradation peak came out from the glimepiride peak. The
glimepiride peak purity was satisfactory, but the pioglitazone peak purity
remained the same. Finally, the cyano column was used for development. The
main base degradation peak came with more than 2.0 resolutions from the
57
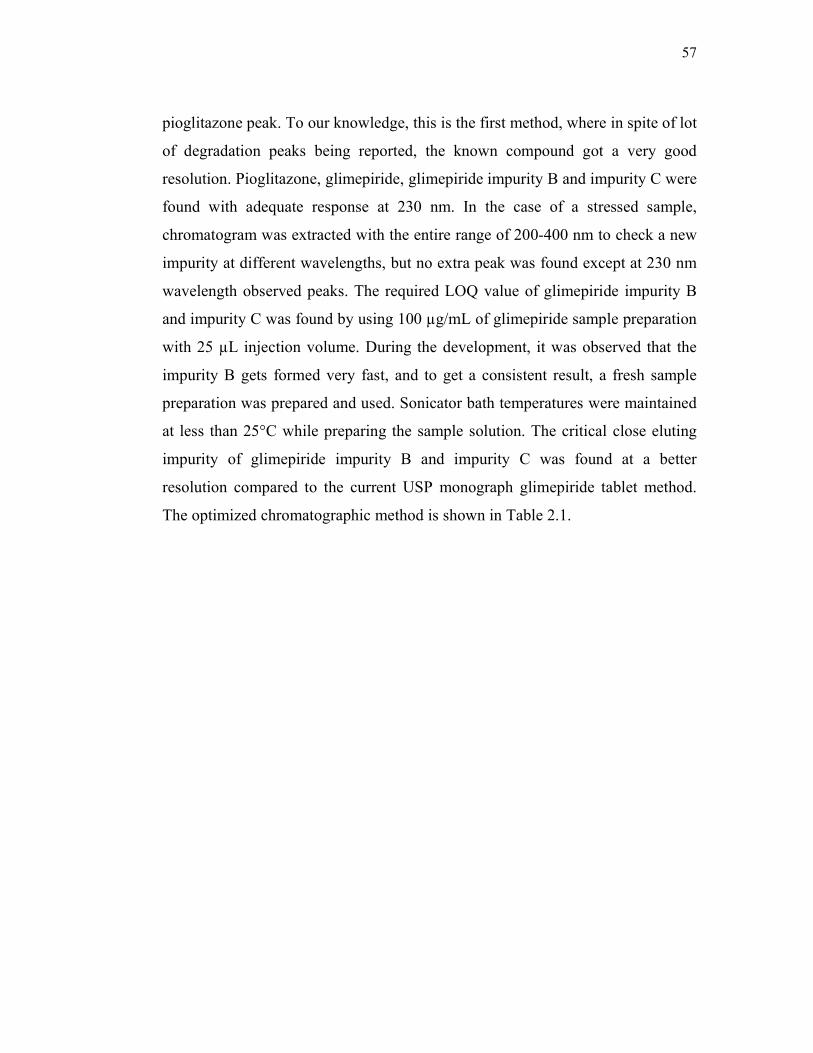
pioglitazone peak. To our knowledge, this is the first method, where in spite of lot
of degradation peaks being reported, the known compound got a very good
resolution. Pioglitazone, glimepiride, glimepiride impurity B and impurity C were
found with adequate response at 230 nm. In the case of a stressed sample,
chromatogram was extracted with the entire range of 200-400 nm to check a new
impurity at different wavelengths, but no extra peak was found except at 230 nm
wavelength observed peaks. The required LOQ value of glimepiride impurity B
and impurity C was found by using 100 µg/mL of glimepiride sample preparation
with 25 µL injection volume. During the development, it was observed that the
impurity B gets formed very fast, and to get a consistent result, a fresh sample
preparation was prepared and used. Sonicator bath temperatures were maintained
at less than 25°C while preparing the sample solution. The critical close eluting
impurity of glimepiride impurity B and impurity C was found at a better
resolution compared to the current USP monograph glimepiride tablet method.
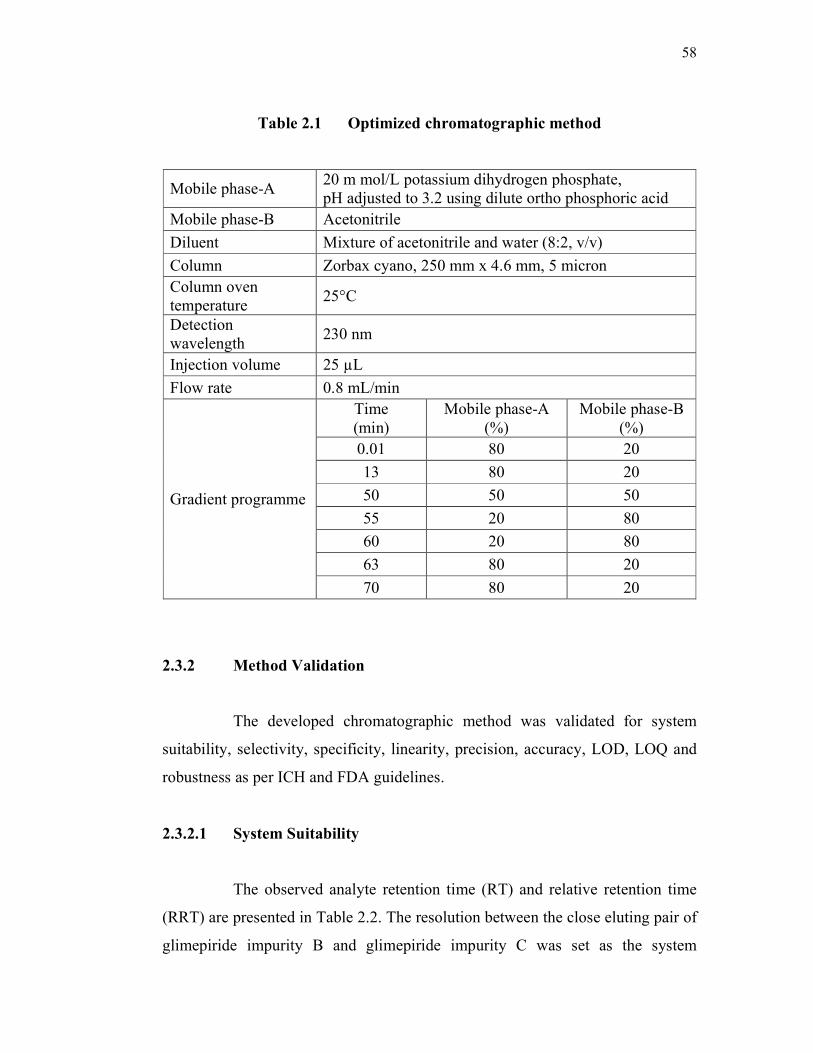
The optimized chromatographic method is shown in Table 2.1.
58
Table 2.1 Optimized chromatographic method
Mobile phase-A 20 m mol/L potassium dihydrogen phosphate, pH adjusted to 3.2 using dilute ortho phosphoric acid
Mobile phase-B Acetonitrile
Diluent Mixture of acetonitrile and water (8:2, v/v)
Column Zorbax cyano, 250 mm x 4.6 mm, 5 micron Column oven temperature
25°C
Detection wavelength
230 nm
Injection volume 25 µL
Flow rate 0.8 mL/min
Gradient programme
Time (min)
Mobile phase-A (%)
Mobile phase-B (%)
0.01 80 20
13 80 20
50 50 50
55 20 80
60 20 80
63 80 20
70 80 20
2.3.2 Method Validation
The developed chromatographic method was validated for system
suitability, selectivity, specificity, linearity, precision, accuracy, LOD, LOQ and
robustness as per ICH and FDA guidelines.
2.3.2.1 System Suitability
The observed analyte retention time (RT) and relative retention time
(RRT) are presented in Table 2.2. The resolution between the close eluting pair of
glimepiride impurity B and glimepiride impurity C was set as the system

59
suitability parameter (> 6.0). Also, the % RSD of the peak area of pioglitazone
and glimepiride was calculated. The system suitability chromatogram is shown in
Figure 2.5.
Figure 2.5 System suitability chromatogram (Containing glimepiride,
glimepiride impurity B and glimepiride impurity C)
Table 2.2 System suitability results
Parameter Pioglitazone Glimepiride Impurity B Impurity C
% RSD
Retention time
Relative retention
time
USP resolution
USP tailing factor
USP theoretical
Plates
1.1
31.93
- -
1.01
15011
1.3
38.73
1.00 -
0.99
18123
4.1
21.99
0.57
6.50
1.22
8012
3.2
19.82
0.51 -
1.13
7532
60
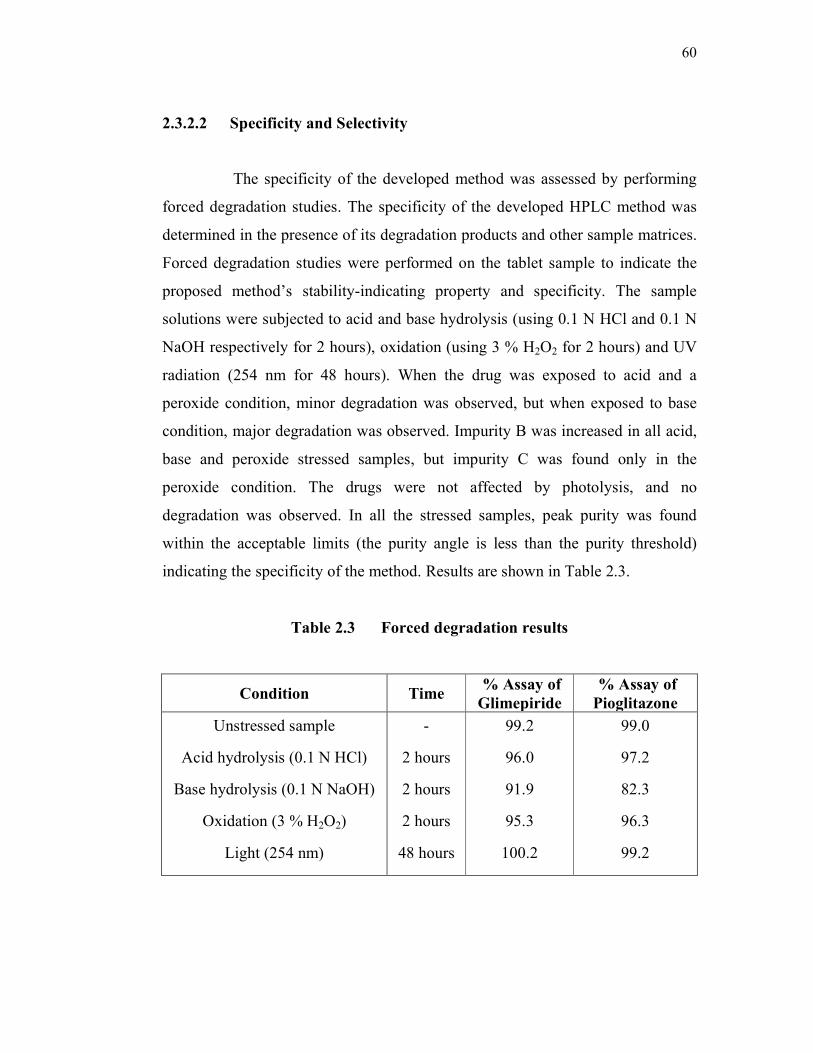
2.3.2.2 Specificity and Selectivity
The specificity of the developed method was assessed by performing
forced degradation studies. The specificity of the developed HPLC method was
determined in the presence of its degradation products and other sample matrices.
Forced degradation studies were performed on the tablet sample to indicate the
proposed method’s stability-indicating property and specificity. The sample
solutions were subjected to acid and base hydrolysis (using 0.1 N HCl and 0.1 N
NaOH respectively for 2 hours), oxidation (using 3 % H2O2 for 2 hours) and UV
radiation (254 nm for 48 hours). When the drug was exposed to acid and a
peroxide condition, minor degradation was observed, but when exposed to base
condition, major degradation was observed. Impurity B was increased in all acid,
base and peroxide stressed samples, but impurity C was found only in the
peroxide condition. The drugs were not affected by photolysis, and no
degradation was observed. In all the stressed samples, peak purity was found
within the acceptable limits (the purity angle is less than the purity threshold)
indicating the specificity of the method. Results are shown in Table 2.3.
Table 2.3 Forced degradation results
Condition Time % Assay of
Glimepiride
% Assay of
Pioglitazone
Unstressed sample
Acid hydrolysis (0.1 N HCl)
Base hydrolysis (0.1 N NaOH)
Oxidation (3 % H2O2)
Light (254 nm)
-
2 hours
2 hours
2 hours
48 hours
99.2
96.0
91.9
95.3
100.2
99.0
97.2
82.3
96.3
99.2

61
To prove the selectivity of the method, all individual compounds, i.e.,
pioglitazone, glimepiride, metformin, glimepiride impurity B and glimepiride
impurity C were injected in the optimized method. Blank interference was
checked by injecting the sample diluents. No interference was found with the
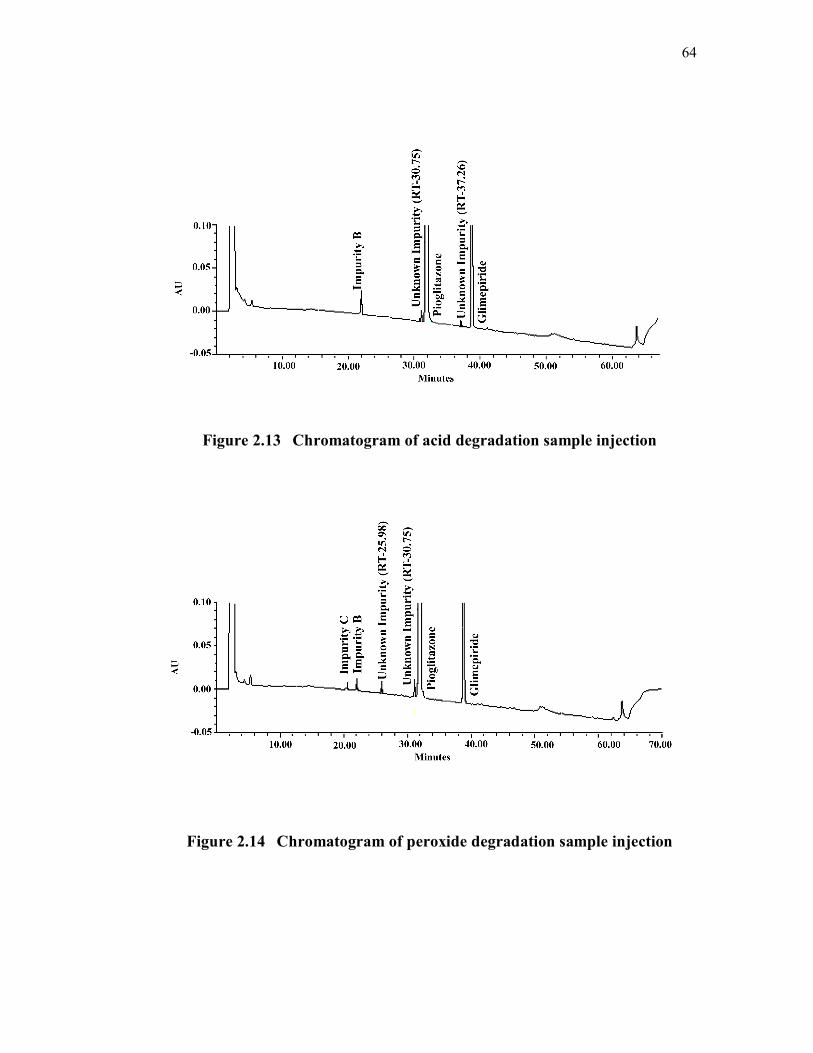
discussed compounds. Specificity chromatograms are shown in Figures 2.6 to
2.15.
Figure 2.6 Blank chromatogram
Figure 2.7 Chromatogram of glimepiride impurity B injection

62
Figure 2.8 Chromatogram of glimepiride impurity C injection
Figure 2.9 Chromatogram of metformin injection
Figure 2.10 Chromatogram of glimepiride injection

63
Figure 2.11 Chromatogram of pioglitazone injection
Figure 2.12 Chromatogram of unstressed sample injection
64
Figure 2.13 Chromatogram of acid degradation sample injection
Figure 2.14 Chromatogram of peroxide degradation sample injection
65
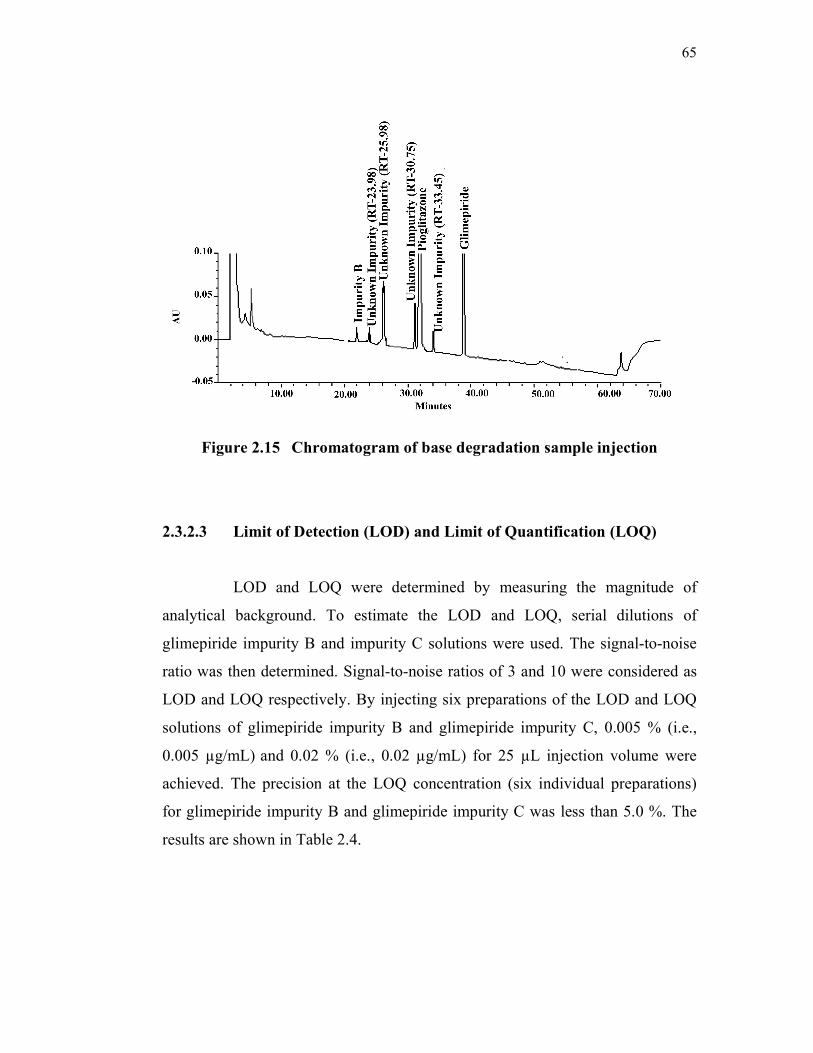
Figure 2.15 Chromatogram of base degradation sample injection
2.3.2.3 Limit of Detection (LOD) and Limit of Quantification (LOQ)
LOD and LOQ were determined by measuring the magnitude of
analytical background. To estimate the LOD and LOQ, serial dilutions of
glimepiride impurity B and impurity C solutions were used. The signal-to-noise
ratio was then determined. Signal-to-noise ratios of 3 and 10 were considered as
LOD and LOQ respectively. By injecting six preparations of the LOD and LOQ
solutions of glimepiride impurity B and glimepiride impurity C, 0.005 % (i.e.,
0.005 µg/mL) and 0.02 % (i.e., 0.02 µg/mL) for 25 µL injection volume were
achieved. The precision at the LOQ concentration (six individual preparations)
for glimepiride impurity B and glimepiride impurity C was less than 5.0 %. The
results are shown in Table 2.4.
66
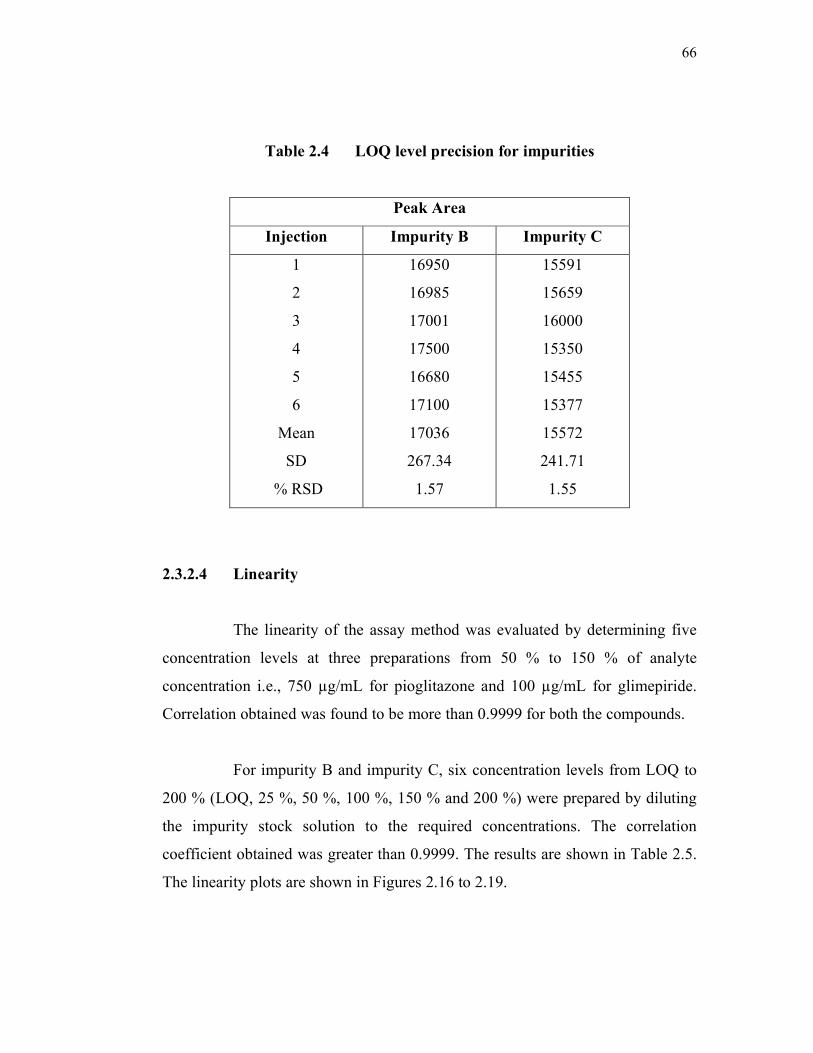
Table 2.4 LOQ level precision for impurities
Peak Area
Injection Impurity B Impurity C
1
2
3
4
5
6
Mean
SD
% RSD
16950
16985
17001
17500
16680
17100
17036
267.34
1.57
15591
15659
16000
15350
15455
15377
15572
241.71
1.55
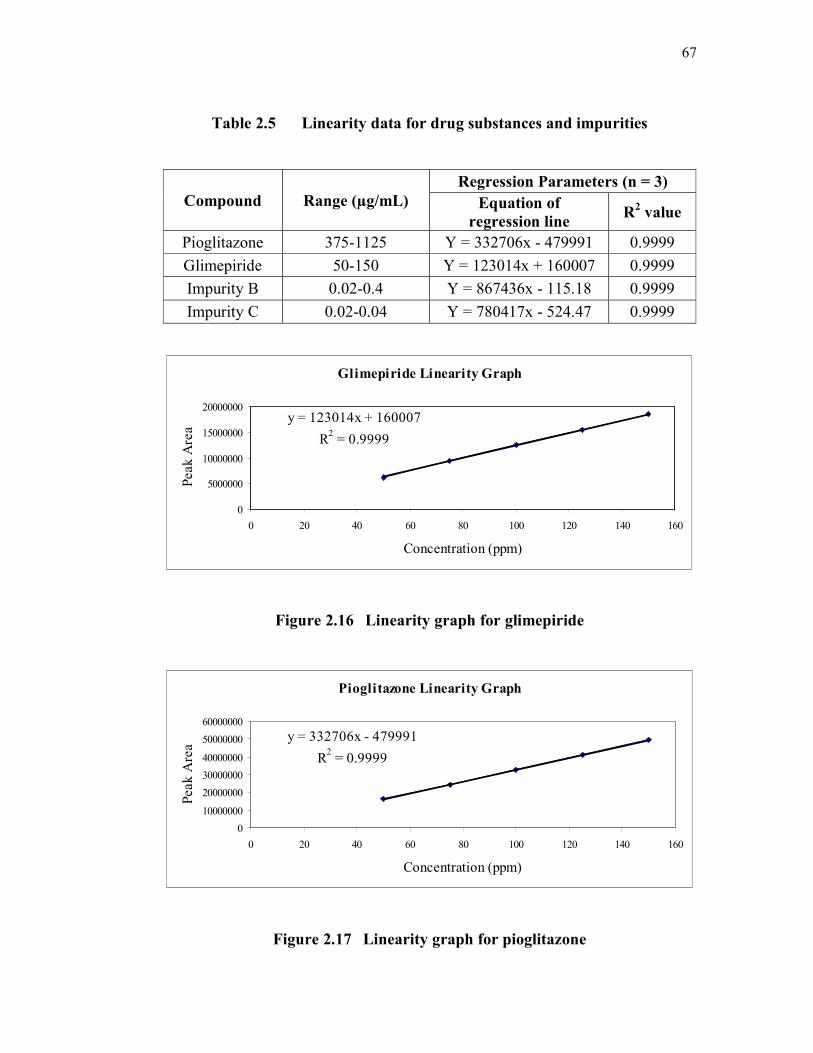
2.3.2.4 Linearity
The linearity of the assay method was evaluated by determining five
concentration levels at three preparations from 50 % to 150 % of analyte
concentration i.e., 750 µg/mL for pioglitazone and 100 µg/mL for glimepiride.
Correlation obtained was found to be more than 0.9999 for both the compounds.
For impurity B and impurity C, six concentration levels from LOQ to
200 % (LOQ, 25 %, 50 %, 100 %, 150 % and 200 %) were prepared by diluting
the impurity stock solution to the required concentrations. The correlation
coefficient obtained was greater than 0.9999. The results are shown in Table 2.5.
The linearity plots are shown in Figures 2.16 to 2.19.
67
Table 2.5 Linearity data for drug substances and impurities
Compound Range (µg/mL)
Regression Parameters (n = 3)
Equation of
regression line R
2 value
Pioglitazone 375-1125 Y = 332706x - 479991 0.9999
Glimepiride 50-150 Y = 123014x + 160007 0.9999
Impurity B 0.02-0.4 Y = 867436x - 115.18 0.9999
Impurity C 0.02-0.04 Y = 780417x - 524.47 0.9999
Glimepiride Linearity Graph
y = 123014x + 160007
R2 = 0.9999
0
5000000
10000000
15000000
20000000
0 20 40 60 80 100 120 140 160
Concentration (ppm)
Peak
Are
a
Figure 2.16 Linearity graph for glimepiride
Pioglitazone Linearity Graph
y = 332706x - 479991
R2 = 0.9999
0
10000000
20000000
30000000
40000000
50000000
60000000
0 20 40 60 80 100 120 140 160
Concentration (ppm)
Peak
Are
a
Figure 2.17 Linearity graph for pioglitazone

68
Glimepiride Impurity B Linearity Graph
y = 332706x - 479991
R2 = 0.9999
0
10000000
20000000
30000000
40000000
50000000
60000000
0 20 40 60 80 100 120 140 160
Concentration (ppm)
Peak
Are
a
Figure 2.18 Linearity graph for glimepiride impurity B
Glimepiride Impurity C Linearity Graph
y = 780417x - 524.47
R2 = 0.9999
0
50000100000
150000200000
250000300000
350000
0 0.05 0.1 0.15 0.2 0.25 0.3 0.35 0.4 0.45
Concentration (ppm)
Peak
Are
a
Figure 2.19 Linearity graph for glimepiride impurity C
2.3.2.5 Precision
The % RSD of six sample preparations assay value was 1.1 for
pioglitazone and 0.9 for glimepiride. The average assay was found to be 98.2 %
for pioglitazone and 100.2 % for glimepiride. The intermediate precision of the
assay method was evaluated by different columns, systems, and analysts. On
different days, % RSDs were within 2.0 for both pioglitazone and glimepiride.
69
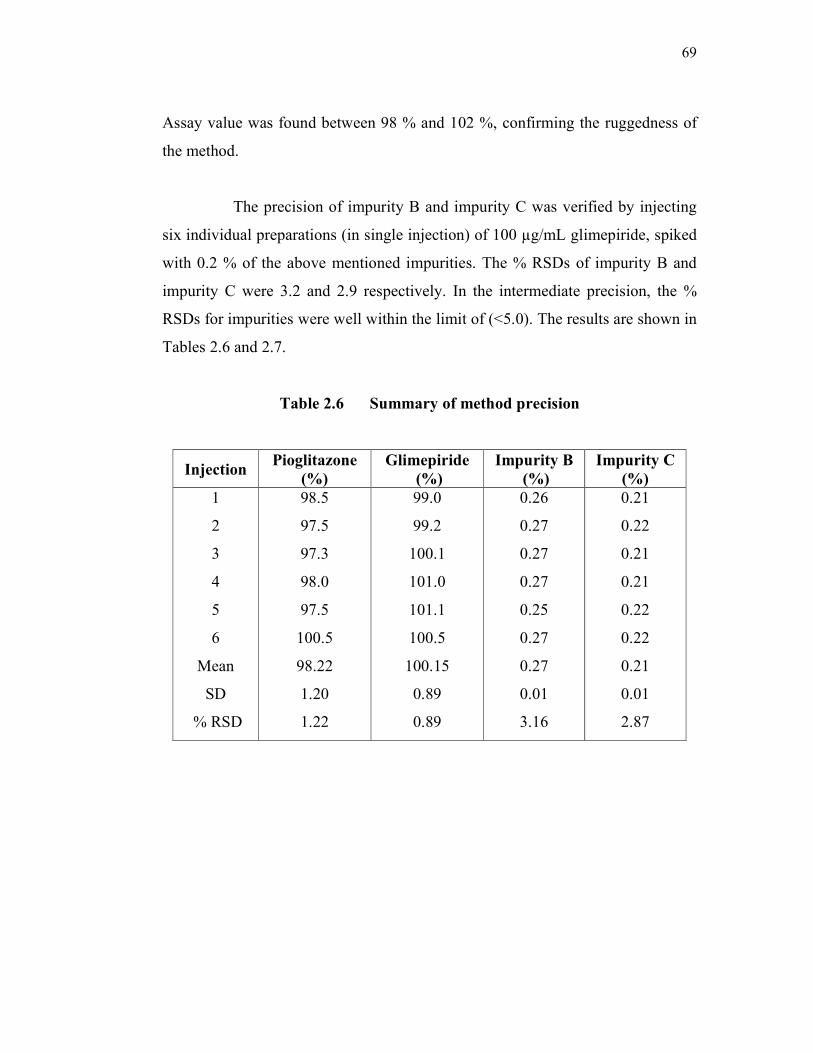
Assay value was found between 98 % and 102 %, confirming the ruggedness of
the method.
The precision of impurity B and impurity C was verified by injecting
six individual preparations (in single injection) of 100 µg/mL glimepiride, spiked
with 0.2 % of the above mentioned impurities. The % RSDs of impurity B and
impurity C were 3.2 and 2.9 respectively. In the intermediate precision, the %
RSDs for impurities were well within the limit of (<5.0). The results are shown in
Tables 2.6 and 2.7.
Table 2.6 Summary of method precision
Injection Pioglitazone
(%)
Glimepiride
(%)
Impurity B
(%)
Impurity C
(%)
1
2
3
4
5
6
Mean
SD
% RSD
98.5
97.5
97.3
98.0
97.5
100.5
98.22
1.20
1.22
99.0
99.2
100.1
101.0
101.1
100.5
100.15
0.89
0.89
0.26
0.27
0.27
0.27
0.25
0.27
0.27
0.01
3.16
0.21
0.22
0.21
0.21
0.22
0.22
0.21
0.01
2.87

70
Table 2.7 Summary of intermediate precision
Injection Pioglitazone
(%)
Glimepiride
(%)
Impurity B
(%)
Impurity C
(%)
1
2
3
4
5
6
Mean
SD
% RSD
98.9
99.3
99.1
98.4
98.0
100.1
98.97
0.73
0.74
97.1
98.3
99.2
99.5
99.8
99.1
98.83
0.99
1.00
0.27
0.26
0.26
0.26
0.27
0.26
0.26
0.01
1.96
0.20
0.21
0.20
0.19
0.20
0.20
0.20
0.01
3.16
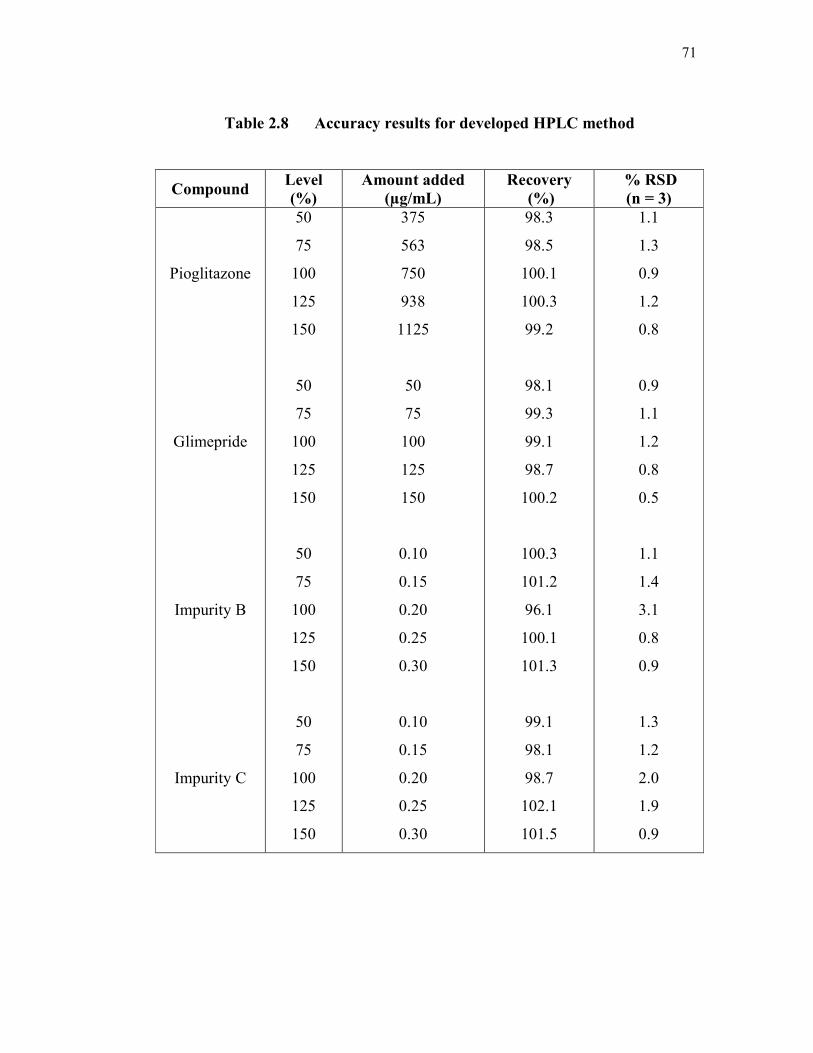
2.3.2.6 Accuracy
The recovery of three sample preparations at five concentration levels,
i.e., 50 %, 75 %, 100 %, 125 %, and 150 % of working concentration levels for
pioglitazone, glimepiride and glimepiride impurities were determined. The
recovery of pioglitazone and glimepiride was obtained within the acceptable
range, i.e., from 98 % to 102 %. The recovery of impurity B and impurity C
ranged from 96.1 % to 101.3 % and 98.1 % to 102.1 % respectively. The recovery
results are shown in Table 2.8.
71
Table 2.8 Accuracy results for developed HPLC method
Compound Level
(%)
Amount added
(µg/mL)
Recovery
(%)
% RSD
(n = 3)
Pioglitazone
Glimepride
Impurity B
Impurity C
50
75
100
125
150
50
75
100
125
150
50
75
100
125
150
50
75
100
125
150
375
563
750
938
1125
50
75
100
125
150
0.10
0.15
0.20
0.25
0.30
0.10
0.15
0.20
0.25
0.30
98.3
98.5
100.1
100.3
99.2
98.1
99.3
99.1
98.7
100.2
100.3
101.2
96.1
100.1
101.3
99.1
98.1
98.7
102.1
101.5
1.1
1.3
0.9
1.2
0.8
0.9
1.1
1.2
0.8
0.5
1.1
1.4
3.1
0.8
0.9
1.3
1.2
2.0
1.9
0.9

72
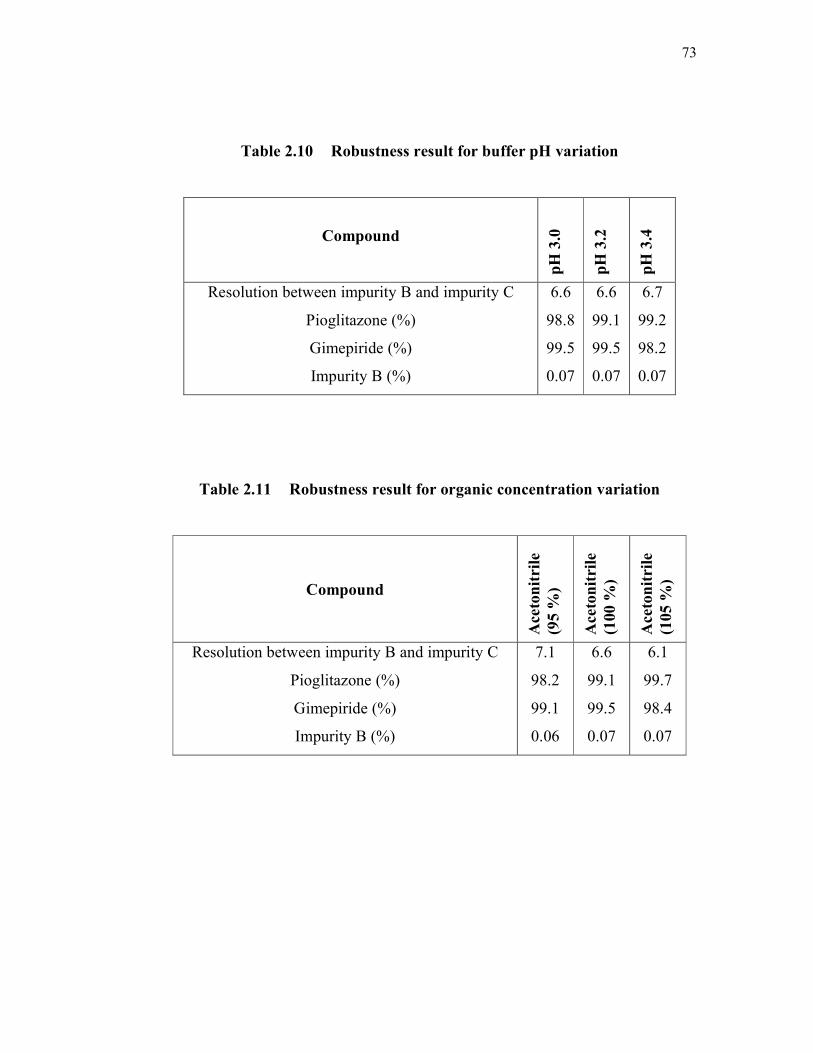
2.3.2.7 Robustness
Chromatographic parameters of the method were intensely altered to
measure the robustness of the method. The system suitability parameters as well
as the recovery for the main ingredients in the sample solution were examined.
The parameters altered were the flow rate (± 0.1 mL/min), the buffer’s pH (± 0.2)
and the organic composition (± 5 %) in the mobile phase. The results obtained
from the deliberate changes were well within the limits. The adequate resolution
obtained between impurity B and impurity C in all the changes was greater than
5.0. The assay value of pioglitatone and glimepiride was obtained between 98 %
and 102 %, confirming the robustness of the method. The robustness results are
shown in Tables 2.9 to 2.11.
Table 2.9 Robustness result for flow rate variation
Compound
0.7
mL
/min
0.8
mL
/min
0.9
mL
/min
Resolution between impurity B and impurity C
Pioglitazone (%)
Gimepiride (%)
Impurity B (%)
6.8
98.3
99.1
0.06
6.6
99.1
99.5
0.07
6.5
98.9
98.6
0.07
73
Table 2.10 Robustness result for buffer pH variation
Compound
pH
3.0
pH
3.2
pH
3.4
Resolution between impurity B and impurity C
Pioglitazone (%)
Gimepiride (%)
Impurity B (%)
6.6
98.8
99.5
0.07
6.6
99.1
99.5
0.07
6.7
99.2
98.2
0.07
Table 2.11 Robustness result for organic concentration variation
Compound
Ace
ton
itri
le
(95 %
)
Ace
ton
itri
le
(100
%)
Ace
ton
itri
le
(105
%)
Resolution between impurity B and impurity C
Pioglitazone (%)
Gimepiride (%)
Impurity B (%)
7.1
98.2
99.1
0.06
6.6
99.1
99.5
0.07
6.1
99.7
98.4
0.07

74
2.3.2.8 Application of the Developed Method to Commercial Tablets
To evaluate the application of the developed method, commercial
preparations (PRICHEK GMP®-manufactured by Indoco Rem-Tablets
containing 15 mg of pioglitazone, 2 mg of glimepiride and 500 mg of metformin
hydrochloride) were analysed. The commercial samples were prepared six times,
and the contents of pioglitazone, glimepiride, glimepiride impurity B and
glimepiride impurity C were calculated. The average assay values of pioglitazone,
glimepiride and glimepiride impurity B were 98.2 %, 100.1 % and 0.07 %
respectively. Glimepiride impurity C was not detected in the analysed
commercial sample.
2.3.2.9 Conclusion
The single reversed phase stability-indicating RP-HPLC method has
been established for the simultaneous estimation of pioglitazone, glimepiride,
glimepiride impurity B and impurity C from the combination drug product. The
method was fully validated and the data found to be satisfactory for all the
method validation parameters tested. The developed method can be conveniently
used by both quality control departments for routine analysis to determine the
compound and commercial sample purity checks.