Embed Size (px)
Citation preview
Copyright © 2010 Pearson Education, Inc.
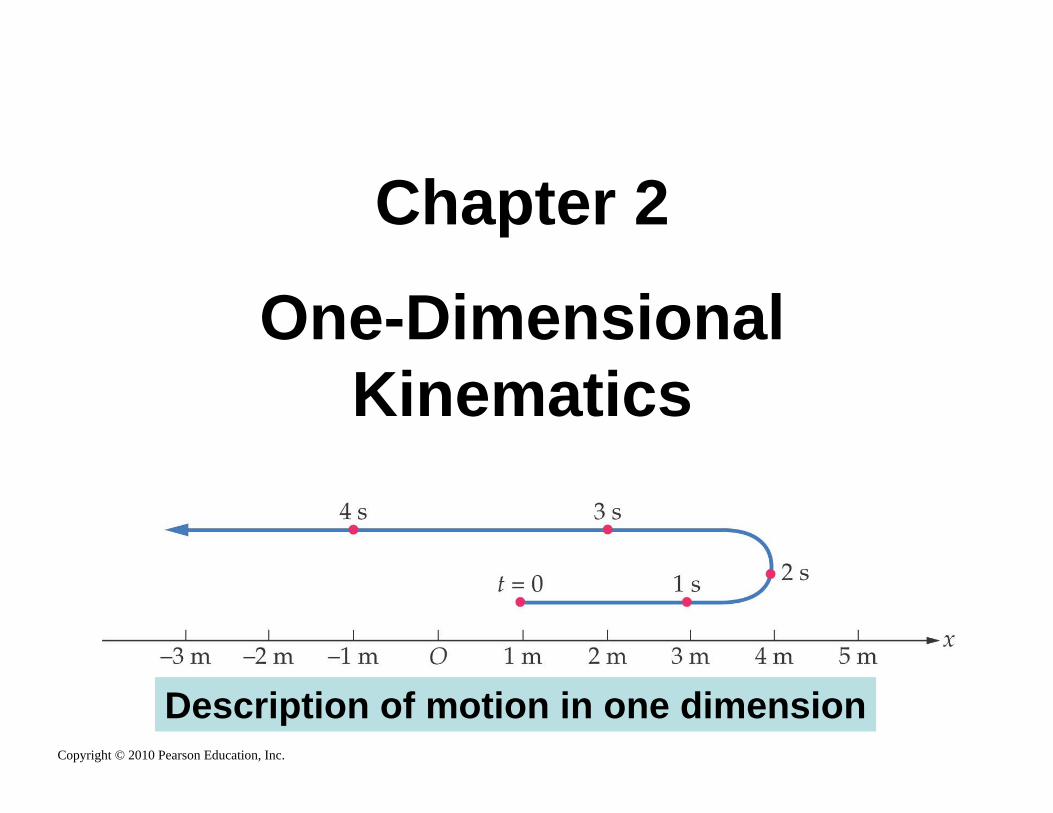
Chapter 2
One-Dimensional Kinematics
Description of motion in one dimension

Copyright © 2010 Pearson Education, Inc.
Units of Chapter 2• Position, Distance, and Displacement
• Average Speed and Velocity
• Instantaneous Velocity
• Acceleration
• Motion with Constant Acceleration
• Applications of the Equations of Motion
• Freely Falling Objects

Copyright © 2010 Pearson Education, Inc.
2-1 Position, Distance, and Displacement
Before describing motion, you must set up a coordinate system – define an origin and a positive direction.
Position: described by x

Copyright © 2010 Pearson Education, Inc.
2-1 Position, Distance, and Displacement
The distance is the total length of travel; if you drive from your house to the grocery store and back, you have covered a distance of 8.6 mi.

Copyright © 2010 Pearson Education, Inc.
2-1 Position, Distance, and Displacement
Displacement is the change in position. If you drive from your house to the grocery store and then to your friend’s house, your displacement is 2.1 mi and the distance you have traveled is 10.7 mi.
displacement change in position final position initial positiondisplacement f i
= = −= = −Δ Δx x x
You and your dog go for a walk to the park. On the way, your dog takes many side trips to chase squirrels or examine fire hydrants. When you arrive at the park, do you and your dog have the same displacement?
a) yes
b) no
Question 2.1 Walking the Dog
You and your dog go for a walk to the park. On the way, your dog takes many side trips to chase squirrels or examine fire hydrants. When you arrive at the park, do you and your dog have the same displacement?
a) yes
b) no
Yes, you have the same displacement. Because you and your dog had the same initial position and the same final position, then you have (by definition) the same displacement.
Question 2.1 Walking the Dog
Follow-up: have you and your dog traveled the same distance?

Copyright © 2010 Pearson Education, Inc.
2-2 Average Speed and Velocity
The average speed is defined as the distance traveled divided by the time the trip took:
Average speed = distance / elapsed timeIs the average speed of the red car 40.0 mi/h, more than 40.0 mi/h, or less than 40.0 mi/h?

Copyright © 2010 Pearson Education, Inc.
2-2 Average Speed and VelocityThe average speed is defined as the distance traveled divided by the time the trip took:
Average speed = distance / elapsed timeIs the average speed of the red car 40.0 mi/h, more than 40.0 mi/h, or less than 40.0 mi/h?
hhmi
mit )0.30/00.4(/0.30
00.41 ==
hhmi
mit )0.50/00.4(/0.50
00.42 ==
htt 213.021 =+ Average speed = hmihmih
mi /40/6.37213.08
<=
Copyright © 2010 Pearson Education, Inc.
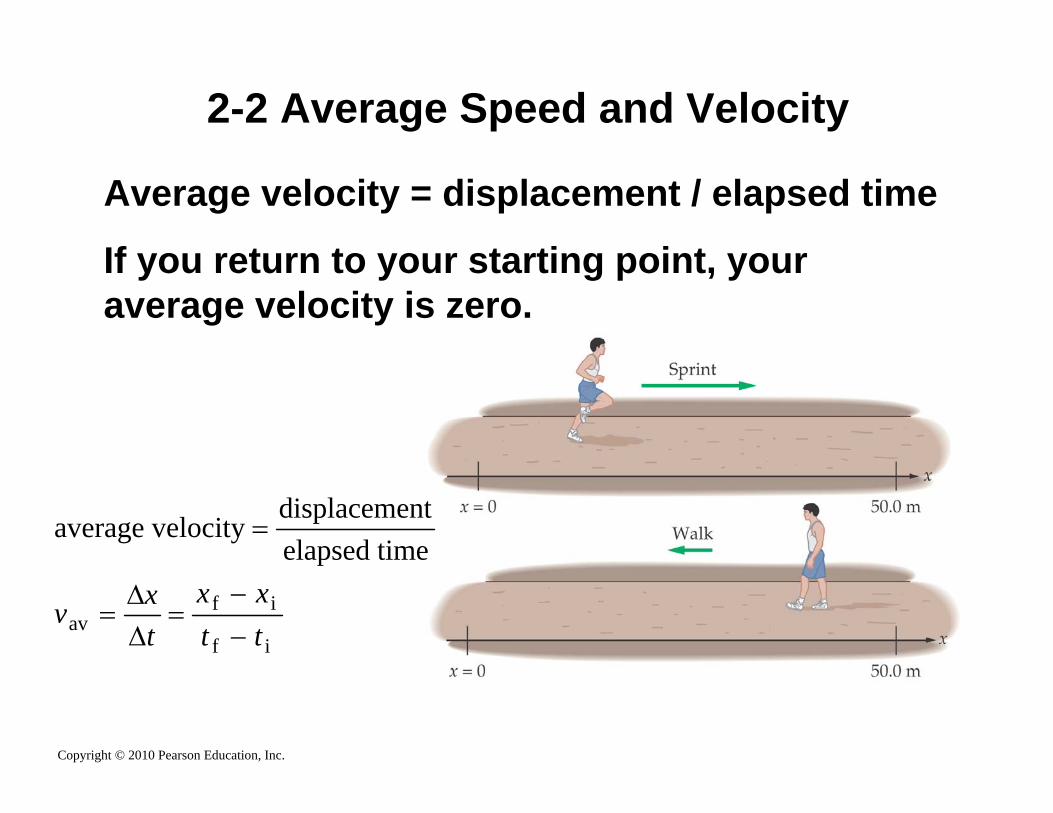
2-2 Average Speed and Velocity
Average velocity = displacement / elapsed time
If you return to your starting point, your average velocity is zero.
average velocitydisplacementelapsed time
avf i
f i
=
= =−−
v xt
x xt t
ΔΔ

Copyright © 2010 Pearson Education, Inc.
2-2 Average Speed and Velocity
Graphical Interpretation of Average Velocity
The same motion, plotted one-dimensionally and as an x-t graph:

Copyright © 2010 Pearson Education, Inc.
2-3 Instantaneous Velocity
Definition:
(2-4)
This means that we evaluate the average velocity over a shorter and shorter period of time; as that time becomes infinitesimally small, we have the instantaneous velocity.

Copyright © 2010 Pearson Education, Inc.
2-3 Instantaneous VelocityThis plot shows the average velocity being measured over shorter and shorter intervals. The instantaneous velocity is tangent to the curve.
average velocitydisplacementelapsed time
avf i
f i
=
= =−−
v xt
x xt t
ΔΔ
v xtt
=→
limΔ
ΔΔ0

Copyright © 2010 Pearson Education, Inc.
2-3 Instantaneous Velocity
Graphical Interpretation of Average and Instantaneous Velocity

Copyright © 2010 Pearson Education, Inc.
2-4 Acceleration
Average acceleration:
(2-5)

Copyright © 2010 Pearson Education, Inc.
2-4 AccelerationGraphical Interpretation of Average and Instantaneous Acceleration:
a vtt
=→
limΔ
ΔΔ0
a vt
v vt tav
f i
f i= =
−−
ΔΔ
Copyright © 2010 Pearson Education, Inc.
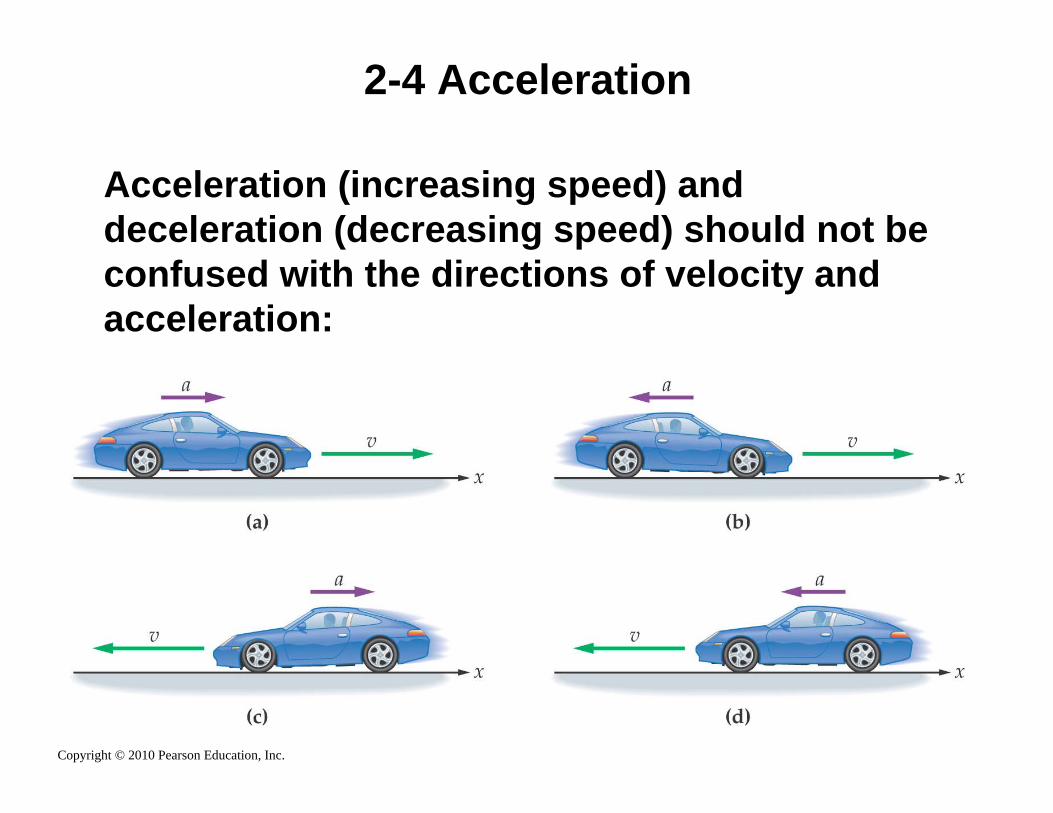
2-4 Acceleration
Acceleration (increasing speed) and deceleration (decreasing speed) should not be confused with the directions of velocity and acceleration:

Copyright © 2010 Pearson Education, Inc.
Units of Chapter 2• Position, Distance, and Displacement
• Average Speed and Velocity
• Instantaneous Velocity
• Acceleration
• Motion with Constant Acceleration
• Applications of the Equations of Motion
• Freely Falling Objects

Copyright © 2010 Pearson Education, Inc.
Review: 2-3 Instantaneous VelocityThis plot shows the average velocity being measured over shorter and shorter intervals. The instantaneous velocity is tangent to the curve.
average velocitydisplacementelapsed time
avf i
f i
=
= =−−
v xt
x xt t
ΔΔ
v xtt
=→
limΔ
ΔΔ0

Copyright © 2010 Pearson Education, Inc.
Review: 2-4 AccelerationGraphical Interpretation of Average and Instantaneous Acceleration:
a vtt
=→
limΔ
ΔΔ0
a vt
v vt tav
f i
f i= =
−−
ΔΔ

Question 2.13aQuestion 2.13a Graphing Velocity IGraphing Velocity I
t
x
The graph of position versus
time for a car is given below.
What can you say about the
velocity of the car over time?
a) it speeds up all the timeb) it slows down all the timec) it moves at constant velocityd) sometimes it speeds up and
sometimes it slows downe) not really sure

Question 2.13aQuestion 2.13a Graphing Velocity IGraphing Velocity I
t
x
The graph of position versus
time for a car is given below.
What can you say about the
velocity of the car over time?
The car moves at a constant velocity because the x vs. t plot shows a straight line. The slope of a straight line isconstant. Remember that the slope of xvs. t is the velocity!
a) it speeds up all the timeb) it slows down all the timec) it moves at constant velocityd) sometimes it speeds up and
sometimes it slows downe) not really sure

t
x
a) it speeds up all the timeb) it slows down all the timec) it moves at constant velocityd) sometimes it speeds up and
sometimes it slows downe) not really sure
The graph of position vs.
time for a car is given below.
What can you say about the
velocity of the car over time?
Question 2.13b Graphing Velocity II

a) it speeds up all the timeb) it slows down all the timec) it moves at constant velocityd) sometimes it speeds up and
sometimes it slows downe) not really sure
x
The graph of position vs.
time for a car is given below.
What can you say about the
velocity of the car over time?
The car slows down all the time because the slope of the x vs. t graph is diminishing as time goes on. Remember that the slope of x vs. t is the velocity! At large t, the value of the position x does not change, indicating that the car must be at rest.
t
Question 2.13b Graphing Velocity II

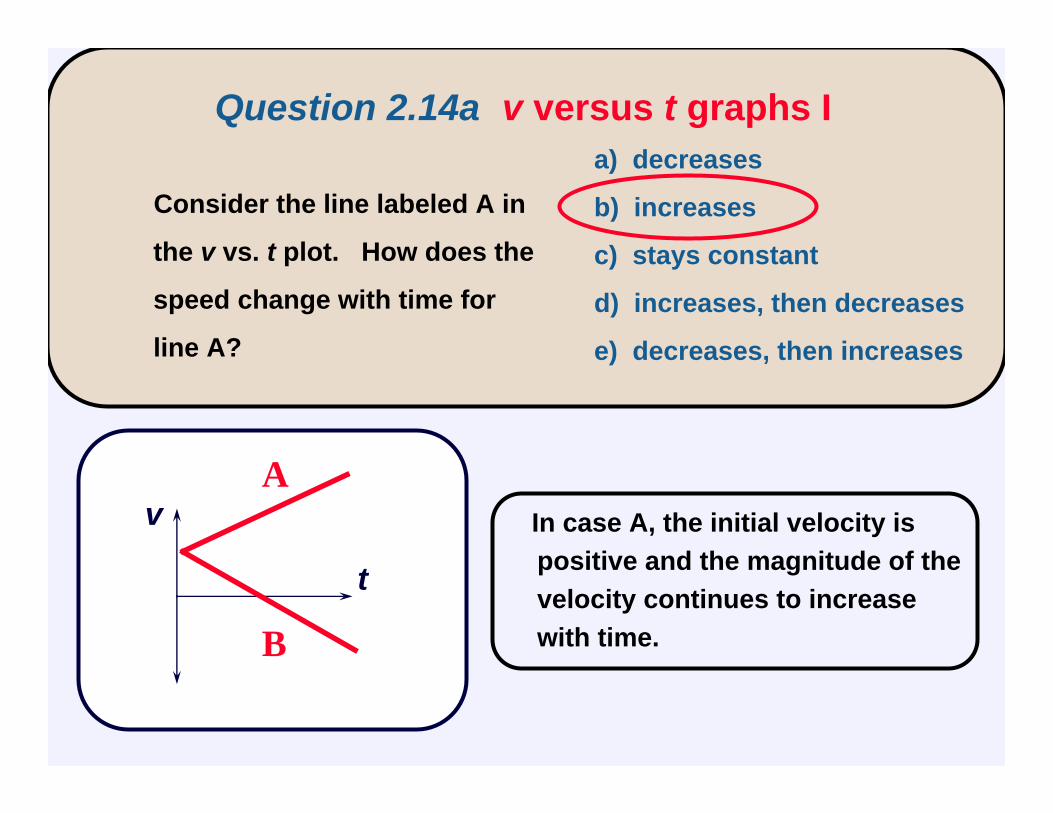
Consider the line labeled A in
the v vs. t plot. How does the
speed change with time for
line A?
a) decreases
b) increases
c) stays constant
d) increases, then decreases
e) decreases, then increases
Question 2.14a v versus t graphs I
v
t
A
B
Consider the line labeled A in
the v vs. t plot. How does the
speed change with time for
line A?
a) decreases
b) increases
c) stays constant
d) increases, then decreases
e) decreases, then increases
In case A, the initial velocity is positive and the magnitude of the velocity continues to increase with time.
Question 2.14a v versus t graphs I
v
t
A
B

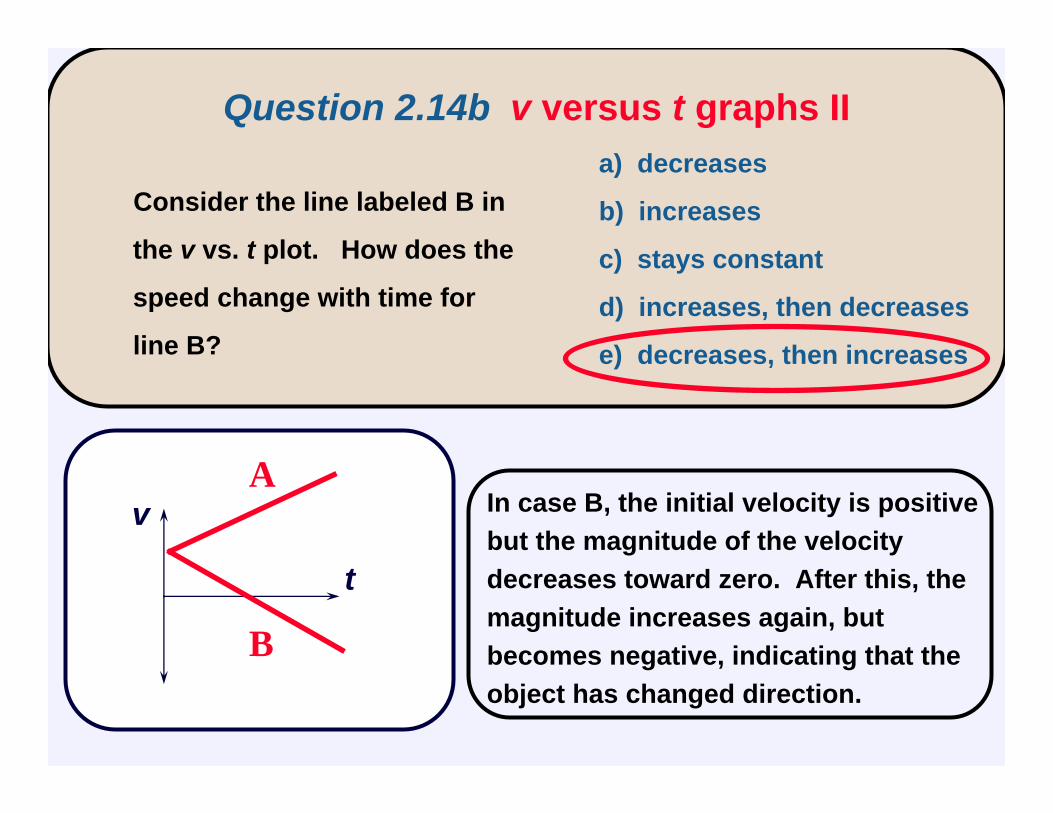
Consider the line labeled B in
the v vs. t plot. How does the
speed change with time for
line B?
a) decreases
b) increases
c) stays constant
d) increases, then decreases
e) decreases, then increases
Question 2.14b v versus t graphs II
v
t
A
B
Consider the line labeled B in
the v vs. t plot. How does the
speed change with time for
line B?
a) decreases
b) increases
c) stays constant
d) increases, then decreases
e) decreases, then increases
In case B, the initial velocity is positive but the magnitude of the velocity decreases toward zero. After this, the magnitude increases again, but becomes negative, indicating that the object has changed direction.
Question 2.14b v versus t graphs II
v
t
A
B
Copyright © 2010 Pearson Education, Inc.
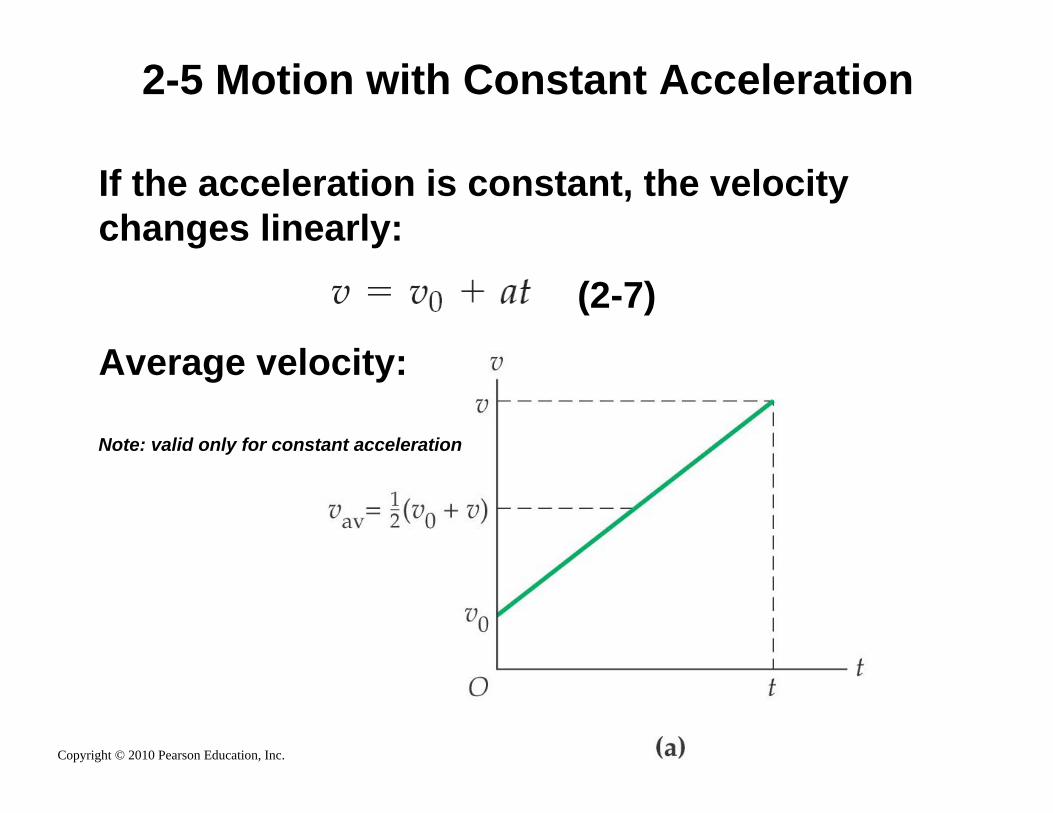
2-5 Motion with Constant Acceleration
If the acceleration is constant, the velocity changes linearly:
(2-7)
Average velocity:
Note: valid only for constant acceleration

Copyright © 2010 Pearson Education, Inc.
2-5 Motion with Constant Acceleration
Average velocity:
(2-9)
Position as a function of time:
(2-10)
(2-11)
Velocity as a function of position:
(2-12)
x x v t= +0 av
v v at= +0

Copyright © 2010 Pearson Education, Inc.
2-5 Motion with Constant Acceleration
The relationship between position and time follows a characteristic curve.