Embed Size (px)
Citation preview

57AID FOR TRADE AT A GLANCE 2013: CONNECTING TO VALUE CHAINS - © OECD, WTO 2013
CHAPTER 2: AID-FOR-TRADE FLOWS AND FINANCING
CHAPTER 2: AID-FOR-TRADE FLOWS AND FINANCING
This chapter provides a comprehensive overview of aid-for-trade flows, ODA
commitments and disbursements, trade-related Other Official Flows (OOF) and
South-South trade-related co-operation. It examines aid-for-trade flows using data from
the OECD Creditor Reporting System (CRS), complemented by findings from the OECD/
WTO monitoring survey. It examines recipients and providers of assistance, the financial
terms of assistance, and the outlook for aid for trade. In the context of the economic crisis
in many OECD member countries, aid for trade (scaled up since 2005) has for the most
part been maintained. Aid-for-trade flows declined in 2011, with decreasing support for
infrastructure, particularly in Africa. Least developed countries (LDCs) experienced a fall in
funding, but they did not bear the brunt of the decline. The flows indicate a shift in funding
towards private sector development and value chain promotion. Consequently, flows to
meet trade objectives in sectors such as agriculture, industry, and business services are
continuing to increase.
INTRODUCTION
In 2011, overall ODA (excluding debt relief) fell for the first time since 1997, followed by a
further fall in 2012. After several years of increasing aid-for-trade flows, the financial crisis and
subsequent economic challenges faced by OECD member countries have put pressure on aid
budgets. Aid-for-trade commitments declined in 2011, with DAC donors1, in particular the G72
countries, providing less support, especially to infrastructure in Africa. Multilateral institutions
maintained support at its 2010 level. Support to build productive capacity in sectors such as
agriculture, industry and banking increased slightly, suggesting that donors increasingly see
private sector development as an important way to leverage aid and promote trade. Although
the least developed countries (LDCs) suffered a decline in funding, they have not borne the
brunt of the overall decline. They experienced the smallest drop of any income group. Support
for regional programmes reached its highest ever level. While the outlook points to either
stagnation or further modest declines in aid flows, the G20 has pledged to maintain aid-for-
trade resources beyond 2011. The findings of the OECD/WTO monitoring survey suggest that
most providers of South-South trade-related co-operation plan to increase their resources
in the future. In addition, collaborative private sector ventures and value chain investments
are growing in number and impact and are charting an innovative way forward for business
involvement in trade-related capacity building.
This chapter provides a comprehensive overview of aid-for-trade flows, ODA
commitments and disbursements, trade-related Other Official Flows (OOF) and South-
South trade-related co-operation. It examines aid-for-trade flows using data from the
OECD Creditor Reporting System (CRS), complemented by findings from the OECD/WTO
monitoring survey. The chapter puts aid for trade in the context of other development
finance flows. It discusses recent trends and provides details on what aid for trade supports

58 AID FOR TRADE AT A GLANCE 2013: CONNECTING TO VALUE CHAINS - © OECD, WTO 2013
CHAPTER 2: AID-FOR-TRADE FLOWS AND FINANCING
and who receives it in terms of regions, countries and income groups. It also examines the providers of assistance:
bilateral donors, multilateral donors and providers of South-South trade-related co-operation. The financial
terms of assistance are examined, looking at grants, ODA loans and non-concessional Other Official Flows (OOF).
The outlook for aid for trade is considered, and a number of conclusions are presented.
HOW IMPORTANT IS AID FOR TRADE IN THE CONTEXT OF DEVELOPMENT FINANCE?
As highlighted in the Monterrey Consensus on Financing for Development, trade is in many cases the single most
important external source of development finance. Increased trade and foreign direct investment (FDI), combined
with complementary policies, can boost economic growth and provide a significant source of employment. But if
developing countries are to take advantage of the opportunities offered by regional and global markets, they require
assistance in increasing competitiveness, reducing transport and trade costs, and integrating fully into the international
trading system. Many developing countries face a range of supply-side and trade-related infrastructure obstacles
which constrain their ability to engage in international trade. Aid for trade helps developing countries – particularly
the LDCs – to use trade as an engine for growth and poverty reduction.
To address trade-related constraints, a variety of financial instruments are used. Basnett et al. (2012) reviewed these
instruments, including loans, grants, pooled funds and trust funds, and channelling of funds through international
financial institutions. They found that blended financing mechanisms and corridor approaches to delivering aid for
trade were particularly effective. In addition to aid for trade, trade-related OOF are mostly provided by multilateral
donors to middle income countries. In fact, low income countries receive only 3 percent of such flows. These non-
concessional loans mainly fund infrastructure projects, but also some productive capacity building programmes.
A major element of trade-related support is provided by and to private firms. For example, the International Finance
Corporation (IFC), a member of the World Bank Group, finances (and provides advice for) private sector ventures and
projects in developing countries. Some donors are also providing assistance to help create partnerships between
local producers and global companies such as WalMart and Danone. International logistics companies are partnering
with the World Bank to facilitate trade. These forms of collaborative ventures and value chain investments are growing
in number and impact. They are charting an innovative way forward for business involvement in trade-related
capacity building.
The development finance landscape is changing.
The trade and development landscape is changing. Aid funding, national expenditures and public policies, as well
as private investment, increasingly need to be examined in an integrated way. While aid for trade has been defined
in terms of ODA, other sources of finance can help build trade capacities in low income countries and middle income
countries (LICs and MICs). Trade-related OOF provide non-concessional loans mostly to middle income countries.
The private sector has also engaged in trade capacity building.
Renewed attention is being given to ways to finance development beyond traditional aid. Figures 2.1 and 2.2
confirm that FDI and other private capital flows have been increasing since the beginning of the millennium, indicating
that investors recognise the potential for high returns in developing countries. Figure 2.2 shows that FDI inflows to
MICs have rebounded since the global financial crisis and that FDI is the most important development finance flow
in MICs, while ODA is no longer a prominent flow. In LICs remittances are the most important flow, but ODA remains
a substantial part of overall capital inflows. LICs do not currently secure a substantial amount of income from FDI
compared to MICs.

59AID FOR TRADE AT A GLANCE 2013: CONNECTING TO VALUE CHAINS - © OECD, WTO 2013
CHAPTER 2: AID-FOR-TRADE FLOWS AND FINANCING
These flows should be interpreted carefully. Bhinda and Martin (2009) have urged caution in assuming that
private flows are automatically positive for development. First, in terms of stability, private flows are volatile, with low
predictability compared to aid. Bhinda and Martin also point out that even before the crisis, FDI in many of the “boom
sectors” was not providing sustainable benefits for growth and poverty reduction in terms of employment, budget
revenue, and transfer of technology and skills.
Figure 2.1 Development finance flows in low income countries
-20
0
40
60
80
100
120
140
USD BILLION, CURRENT PRICES
2000 2001 2002 2003 2004 2005 2006 2007 2008 2009 2010
Source: UNCTADStat
FDI Migrant remittances Total net ODA Total net OOF
-50
0
50
100
150
200
250
USD BILLION, CURRENT PRICES
2000 2001 2002 2003 2004 2005 2006 2007 2008 2009 2010
Source: UNCTADStat
FDI Migrant remittances Total net ODA Total net OOF
Figure 2.2 Development finance flows in middle income countries
12http://dx.doi.org/10.1787/888932854081
12http://dx.doi.org/10.1787/888932854100

60 AID FOR TRADE AT A GLANCE 2013: CONNECTING TO VALUE CHAINS - © OECD, WTO 2013
CHAPTER 2: AID-FOR-TRADE FLOWS AND FINANCING
Foreign direct investment is the most important source for building trade capacities…
The most important source of finance for connecting to regional and global value chains (Figure 2.3) is foreign
direct investment, according to partner countries (53 of which consider it the most important). FDI is followed by
domestic private investment (46 countries) and domestic public investment (30 countries). Bilateral donors also see FDI
as the most important source of financing (nine donors), followed by ODA (seven donors). Providers of South-South
trade-related co-operation agree on the primary importance of FDI, with seven of them listing it as the most important
source of financing and six listing assistance from South-South partners. In fact, most donors tend to emphasise the
virtues of their own instruments, with multilateral donors considering non-concessional finance the most important
source of finance for addressing trade-related capacity building needs.
Figure 2.3 Most important sources of finance according to partner countries
(percentage of responses)
…while ODA remains essential…
Consistent with the Financing for Development principles, mobilisation of domestic resources should play a
major role in meeting developing countries’ financing needs, including trade-related capacity building, but both
partners and donors see a high value for ODA in the next five years. Multilateral donors consider ODA the second most
important finance flow, as do bilateral donors. The question asked of partner countries concerned financing for firms
to connect to value chains rather than support for the business environment, infrastructure or other public goods.
ODA in this regard was considered most important by 27 partner countries and important by 28, while 16 considered
it unimportant (Figure 2.3). Concerning the next five years, partners also give slightly less weight to ODA compared to
foreign and domestic investment.
…especially for LDCs…
In the absence of significant domestic public investment and capital formation, ODA remains an important source
of finance for firms in LDCs. All donors see ODA as the indispensable source of finance for these countries (Figures 2.4
and 2.5). Both multilateral donors (10) and bilateral donors (18) consider ODA the most important finance flow. It was
considered the most important by seven South-South providers, followed by assistance from South-South partners.
0% 20% 40% 60% 80% 100%
Source: OECD/WTO Questionnaire 2013, www.aid4trade.org.
Number of responses are shown in white
1
1
Income remitted by migrants
1
Non-concessional financing
Official development assistance
Domestic public investment
Domestic private investment
Most important Important Less important Not sure
2
53 24
27
1
2 146
30
2827
3014
227
29
15
22
10
16
11
12
2
Foreign direct investment
12http://dx.doi.org/10.1787/888932854119

61AID FOR TRADE AT A GLANCE 2013: CONNECTING TO VALUE CHAINS - © OECD, WTO 2013
CHAPTER 2: AID-FOR-TRADE FLOWS AND FINANCING
Figure 2.4 Most important sources of finance for least developed countries
according to bilateral donors
(percentage of responses)
0% 20% 40% 60% 80% 100%
Source: OECD/WTO Questionnaire 2013, www.aid4trade.org.
Most important Important Not important Not sure
Number of responses are shown in white
181 2 5
Domestic public investment
121 7 7
Income remitted by migrants
91 7 8
Corporate philanthropic foundations
132 4 7
Domestic private investment
165 1 4
Assistance from South-South partners
138 2 4
Foreign direct investment
718 3
Official development assistance
Figure 2.5 Most important sources of finance for least developed countries
according to South-South providers
(percentage of responses)
0% 20% 40% 60% 80% 100%
Source: OECD/WTO Questionnaire 2013, www.aid4trade.org.
Most important Important Not important Not sure
Number of responses are shown in white
32 1
Foreign direct investment
22 1 1
Domestic private investment
13 2 1
Domestic public investment
3 1 2
Income remitted by migrants
4 1 1
Non-concessional financing
4 1 1
Corporate philanthropic foundations
6 3
Assistance from South-South partners
27
Official development assistance
12http://dx.doi.org//10.1787/888932854138
12http://dx.doi.org/10.1787/888932854157

62 AID FOR TRADE AT A GLANCE 2013: CONNECTING TO VALUE CHAINS - © OECD, WTO 2013
CHAPTER 2: AID-FOR-TRADE FLOWS AND FINANCING
…but it should be better targeted.
Recent evidence suggests that ODA flows can be both uncertain and volatile, so that these funds should be
targeted to ensure they leverage other sources of funding (OECD, 2012). The recent EU Agenda for Change (AfC)
points out that future EU development aid should target countries in the greatest need of external financing and
where development aid can really make a difference, including fragile states. Development co-operation should take
different approaches for countries already experiencing sustained growth or with sufficient own resources (EC, 2011).
HOW MUCH AID FOR TRADE IS PROVIDED AND WHAT DOES IT SUPPORT?
Aid for trade was affected by ODA decline in 2011...
The WTO Task Force on Aid for Trade noted that additional, predictable, sustainable and effective financing was
fundamental for fulfilling the aid-for-trade objectives (WTO, 2006:1). Donors have delivered on additional resources,
and aid for trade has increased by 57 percent since the agreed baseline for assessing progress (i.e. an average of aid
for trade provided between 2002 and 2005). In addition, aid for trade has maintained its share of sector allocable ODA
at around 33 percent, ending a decades-long decline in aid for the economic sectors. These substantial increases
have benefitted all aid-for-trade categories, with increases of 61 percent in aid-for-trade policy and regulation,
58 percent in aid for building productive capacity and 55.5 percent in aid for economic infrastructure. Aid for trade-
related adjustment, one of the driving forces of the Aid-for-Trade Initiative, has also expanded.
Progress has also been made on making aid more predictable. This is important because aid is more effective
when regular, detailed and timely information on aid volumes and allocations is available. Many donors have started
to provide detailed, reliable three- to five-year forward expenditure figures and implementation plans to developing
countries. However, a recent assessment indicated that several donors face legal and procedural constraints as well
as uncertainty about future aid allocations and therefore have difficulties making their aid more predictable (OECD,
2012). Nevertheless, several studies (OECD, 2011; Basnett, et al., 2012; Helble, et al. 2012) indicate that aid for trade is
well targeted and effective. The key question facing the aid-for-trade community is now: Are previous gains and the
current level of aid for trade sustainable?
In real terms, total ODA commitments fell in 2011. Reflecting this, sector allocable aid commitments declined by
11 percent in 2011 compared to 2010 (from USD 138 to 122 billion). Aid for trade was even more adversely affected,
declining by 14 percent to USD 41.5 billion (Figure 2.6). This is the first time aid-for-trade commitments have fallen
since the baseline period. One year does not constitute a trend, however, and the declining aggregate figures
disguise important changes at the sectoral level which represent shifting donor priorities for aid for trade. It is also the
case that 2011 aid-for-trade figures are comparable to 2008 and 2009 commitments – indicating perhaps that 2010
commitments were exceptionally high at USD 48 billion.

63AID FOR TRADE AT A GLANCE 2013: CONNECTING TO VALUE CHAINS - © OECD, WTO 2013
CHAPTER 2: AID-FOR-TRADE FLOWS AND FINANCING
Figure 2.6 Aid-for-trade commitments
(USD million, 2011 constant prices)
...but aid for building productive capacity continues to increase...
Reflecting the increasing priority that donors attach to private sector development (see Chapter 1), aid dedicated
to building productive capacity increased in 2011 by USD 171 million to reach USD 18.2 billion (Figure 2.6). Figure 2.7
shows that agriculture, fisheries and forestry received almost 60 percent (USD 10.6 billion) and that this amount has
doubled since the baseline period (USD 5.3 billion). The share of ODA for agriculture fell from about 17 percent in the
early 1980s to a low of 3 percent in 2005. In light of the food crisis in 2007-08, however, donors have responded by
increasing their support for the agricultural sector (OECD, 2010a). A recurring feature of aid projects in agriculture is an
emphasis on rural poverty and food security. For example, in one of the largest projects reported in 2011 the World
Bank committed USD 1 billion in loans to India for agricultural development through a national rural livelihoods project.
The United States government provided support to Afghanistan for improvements in technology and management
practices to increase organisational and market efficiency in order to promote resilience in production and livelihood
systems. The EU is addressing food security with USD 139 million for the poor and vulnerable in fragile situations
in countries such as Afghanistan, the Democratic Republic of the Congo, Haiti, Liberia, Madagascar, the Democratic
People’s Republic of Korea, Pakistan and Sudan.
...benefitting a range of economic sectors, including agriculture and business services...
Many projects have a clearly defined trade objective. For example, the EU has committed USD 21 million to
Tanzania to contribute to sustainable poverty reduction efforts through enhanced participation of smallholder
farmers and small-scale producers in trade. Switzerland is promoting pro-poor private sector growth in Mozambique
by targeting specific niches in investment and trade promotion. Other projects include assistance by Austria in
Uzbekistan for Fairtrade certification of fruits and vegetables. Namibia, with the support of Finland, is investigating
market possibilities for Namibian meat products beyond the existing markets. Spain is supporting a number of fair
trade certification projects for agricultural products in Latin America.
Source: OECD Creditor Reporting System Database, http://stats.oecd.org/index.aspx?DataSetCode=CRS1#.
Trade policy and regulations
Building productive capacity
Economic infrastructure
Trade-related adjustment
2002-05 avg.
60 000
50 000
40 000
30 000
10 000
20 000
02006-08 avg. 2009 2010 2011

64 AID FOR TRADE AT A GLANCE 2013: CONNECTING TO VALUE CHAINS - © OECD, WTO 2013
CHAPTER 2: AID-FOR-TRADE FLOWS AND FINANCING
Figure 2.7 Aid for building productive capacity
(USD million, 2011 constant prices)
For the private sector to grow, access to finance is essential. Donors provided USD 2.65 billion to support the
development of banking institutions and financial services in developing countries in 2011. This represents 6 percent
of total aid for trade and supports central banks, formal sector financial intermediaries, credit lines, and microcredit
and credit co-operatives.
In addition to credit, a healthy business and investment environment requires trade and business associations,
legal and regulatory reform, private sector institution capacity building and advice, trade information, and public-
private sector networking at trade fairs. These business services received funding of USD 2.2 billion in 2011, which
has grown steadily in recent years and by 55 percent compared to the baseline (USD 1.4 billion). For example, the
United States provided grants totalling USD 82 million to Jordan to improve the capacity of businesses to integrate into
domestic and international markets through increases in productivity, improvements in corporate governance, and
the development and application of modern technology and marketing practices. Business capacity development
programmes include activities that help firms and associations to respond to international market opportunities. The
International Trade Centre (ITC) provided over USD 64 million to build business productive capacity and assist firms to
take part in international trade. The ITC has also launched a major initiative to support “Sourcing from Women Vendors”.
…and supporting small and medium-sized enterprises in developing countries…
As a result of the expansion of value chains, aid provided to support industrial development grew more strongly
than that provided to support other productive sectors. Aid for industry totalled USD 2.2 billion in 2011. The majority of
this aid aims to promote small and medium-sized enterprises (SMEs). Rapid growth of SMEs is a powerful engine of job
creation in a wide range of economies, yet more than two-thirds of SMEs in developing countries have no access to
finance from the formal financial sector. This market failure (the large gap between the demand for and supply of SME
finance) is a serious constraint on efforts to promote a strong and sustainable global recovery. The G20 has recently
taken up this cause with the SME Finance Challenge in order to identify ways that governments and public institutions
can be more effective in catalysing private finance for SMEs in developing countries. The initiative received a number
of commitments in 2011 from Canada, Korea, the United States and the Inter-American Development Bank.3
Source : OECD Creditor Reporting System Database, http://stats.oecd.org/index.aspx?DataSetCode=CRS1#.
1
Agriculture, forestry and fisheries
Industry
Business and other services
Mineral resources and mining
Tourism
2002-05 avg.
18 000
14 000
10 000
6 000
2 000
02006-08 avg. 2009 2010 2011
65AID FOR TRADE AT A GLANCE 2013: CONNECTING TO VALUE CHAINS - © OECD, WTO 2013
CHAPTER 2: AID-FOR-TRADE FLOWS AND FINANCING
Some donors support the framework conditions for SMEs growth and employment, for example Germany with
USD 24 million in grants to Nigeria. Similarly, Japan supports Bangladesh with a USD 63 million loan to the financial
sector project for the development of SMEs. Others provide aid to enhance the competitiveness of SMEs. Japan has a
USD 376 million project to promote energy saving in SMEs in India. Other aid projects are targeted to specific sectors.
The EU, for example, is aiding Jordan in the enhancement of the services sector with value-adding and sustainable
businesses so it can become more productive and globally connected. Canada is helping to rebuild the private sector
in Haiti through increased export activity. The main goal is to develop and promote artisans’ craftwork in order to
increase Haitian exports in the home decor and gift sectors. It is clear from many of these projects that support
is provided to strengthen the private sector so as to achieve a range of development objectives such as poverty
reduction.
Other activities, such as mining and tourism, attract much less aid. Support for the mining sector has declined
steadily, from USD 852.8 million in the baseline period to USD 416 million in 2011. This is probably a consequence of the
availability of other sources of finance and the commercial viability of mining projects. Aid provided for tourism policy
and administrative management has also been falling steadily in recent years. It received very low levels of support of
USD 121 million in 2011 – just 6 percent above the baseline. Tourism is one of the top three exports of the majority of
developing countries and is the lead export of at least 11 LDCs. This sector is employment intensive and has linkages
with many parts of the economy.
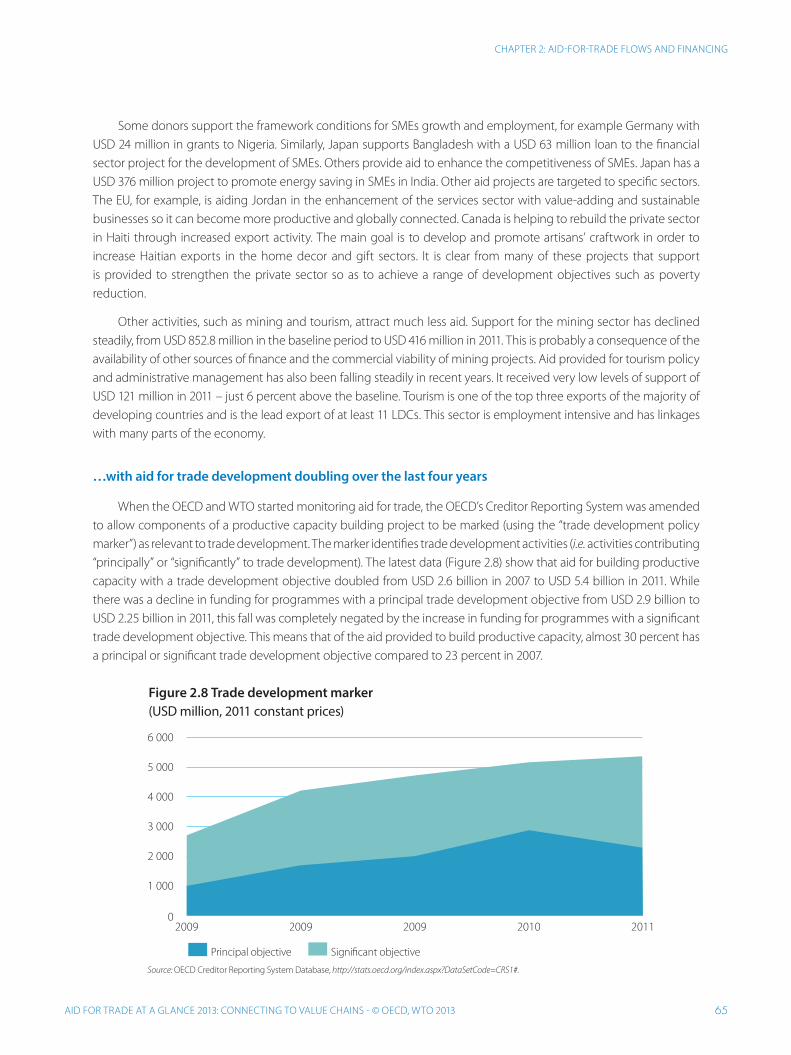
…with aid for trade development doubling over the last four years
When the OECD and WTO started monitoring aid for trade, the OECD’s Creditor Reporting System was amended
to allow components of a productive capacity building project to be marked (using the “trade development policy
marker”) as relevant to trade development. The marker identifies trade development activities (i.e. activities contributing
“principally” or “significantly” to trade development). The latest data (Figure 2.8) show that aid for building productive
capacity with a trade development objective doubled from USD 2.6 billion in 2007 to USD 5.4 billion in 2011. While
there was a decline in funding for programmes with a principal trade development objective from USD 2.9 billion to
USD 2.25 billion in 2011, this fall was completely negated by the increase in funding for programmes with a significant
trade development objective. This means that of the aid provided to build productive capacity, almost 30 percent has
a principal or significant trade development objective compared to 23 percent in 2007.
Figure 2.8 Trade development marker
(USD million, 2011 constant prices)
Source: OECD Creditor Reporting System Database, http://stats.oecd.org/index.aspx?DataSetCode=CRS1#.
Principal objective Significant objective
6 000
5 000
3 000
4 000
2 000
1 000
02009 20092009 2010 2011
66 AID FOR TRADE AT A GLANCE 2013: CONNECTING TO VALUE CHAINS - © OECD, WTO 2013
CHAPTER 2: AID-FOR-TRADE FLOWS AND FINANCING
Aid for business services has a high proportion of programmes with a trade development objective. In fact,
fully half the amount provided for projects on average during 2010 and 2011 had a principal trade development
objective and another 10 percent had a significant trade development objective. Half the aid provided to industry had
a trade development objective and almost one-third of aid for tourism had a principal trade development objective
in 2010-11, with another 10 percent having a significant trade development objective. Trade development is much less
prevalent in regard to agriculture. Only 6 percent of aid for agriculture had a principal trade development objective
in 2010-11, although another 12 percent had a significant trade development objective. Overall, the data show that
private sector development and building productive capacity are increasingly important areas of focus for donors and
that, within this support, the trade development dimension is increasing.
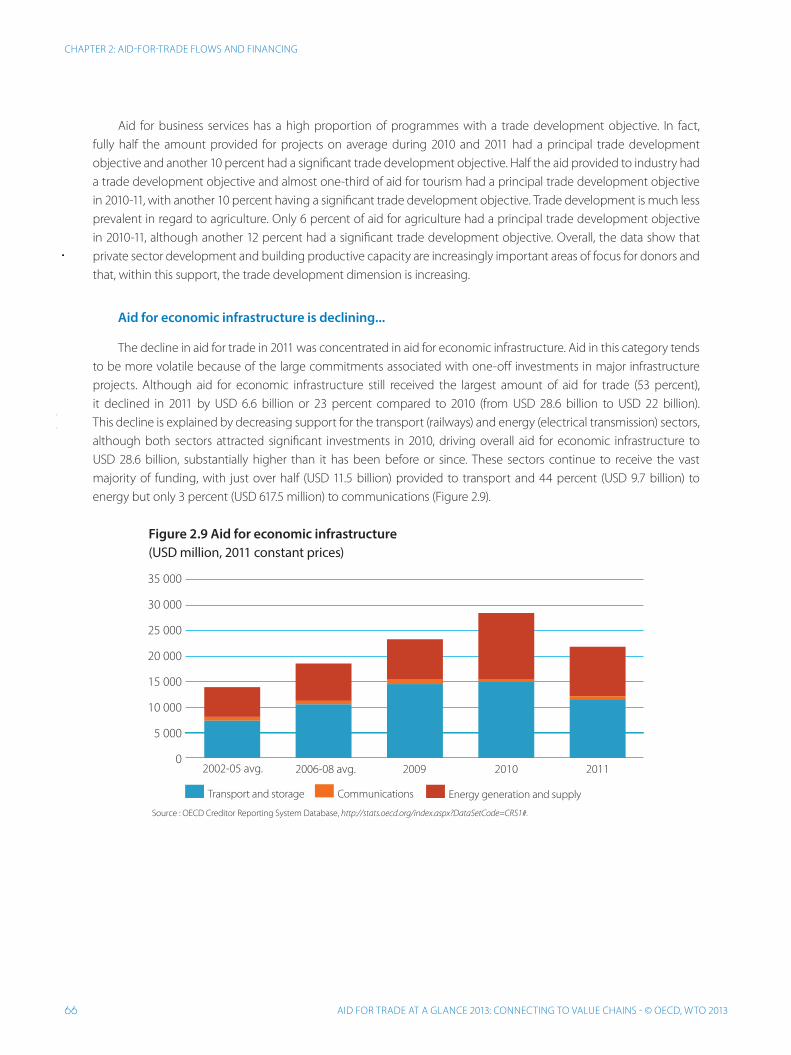
Aid for economic infrastructure is declining...
The decline in aid for trade in 2011 was concentrated in aid for economic infrastructure. Aid in this category tends
to be more volatile because of the large commitments associated with one-off investments in major infrastructure
projects. Although aid for economic infrastructure still received the largest amount of aid for trade (53 percent),
it declined in 2011 by USD 6.6 billion or 23 percent compared to 2010 (from USD 28.6 billion to USD 22 billion).
This decline is explained by decreasing support for the transport (railways) and energy (electrical transmission) sectors,
although both sectors attracted significant investments in 2010, driving overall aid for economic infrastructure to
USD 28.6 billion, substantially higher than it has been before or since. These sectors continue to receive the vast
majority of funding, with just over half (USD 11.5 billion) provided to transport and 44 percent (USD 9.7 billion) to
energy but only 3 percent (USD 617.5 million) to communications (Figure 2.9).
Figure 2.9 Aid for economic infrastructure
(USD million, 2011 constant prices)
Source : OECD Creditor Reporting System Database, http://stats.oecd.org/index.aspx?DataSetCode=CRS1#.
Transport and storage Energy generation and supplyCommunications
2002-05 avg.
35 000
30 000
20 000
15 000
25 000
10 000
5 000
02006-08 avg. 2009 2010 2011

67AID FOR TRADE AT A GLANCE 2013: CONNECTING TO VALUE CHAINS - © OECD, WTO 2013
CHAPTER 2: AID-FOR-TRADE FLOWS AND FINANCING
...mostly for electrical transmission and railways…
Aid flows for electrical transmission (to build infrastructure for distribution from power sources to end users) were
exceptionally high in 2010 at USD 4.3 billion. A number of large projects contributed to this, including a USD 454 million
loan from Japan to Indonesia to “improve power supply reliability” and a USD 286 million loan from Japan to Pakistan
to “improve the quality of power supply”. The World Bank also made a loan to Kenya (USD 211 million) to increase
the capacity, efficiency and quality of electricity supply and expand energy access. This loan is part of a longer-term
plan to finance construction of a 280 megawatt geothermal generation facility. There were also large commitments
to Bangladesh, Egypt, Ethiopia, Tanzania and Viet Nam. While there were 12 projects involving commitments of over
USD 100 million in 2010, there were only four of these in 2011 and total resources for transmission almost halved to
USD 2.5 billion. Projects included a USD 232 million loan from Japan to India for the Madhya Pradesh Transmission
System Modernisation Project and a USD 232 million loan, also from Japan to India, to enhance high voltage distribution
systems in rural areas. The World Bank made loans of USD 148 million for rural electrification and renewable energy in
Bangladesh and USD 106 million for electrical infrastructure in Bolivia.
Similarly, in 2010 aid provided for rail infrastructure, rail equipment, locomotives, light rail (tram) and underground
systems amounted to over USD 4.2 billion, including USD 2.5 billion in loans from Japan to India to construct a dedicated
freight corridor, extend the Delhi Mass Rapid Transit system and construct other transportation systems.4 Another half
billion dollars in loans was provided by Japan to Turkey for construction of the Bosphorus Rail Tube Crossing, which
will link the Asian and European sides of Istanbul by rail for the first time.5 In contrast, in 2011 flows for railways declined
to just USD 833 million. Japan provided USD 249 million to support construction of the Bangalore Metro in India.
France was also a major donor for railways, with loans for the integrated urban project of East Central Medellin in
Colombia (USD 187 million) and construction of the Santo Domingo metro line number two in the Dominican Republic
(USD 155 million).
...but there is more support for road transport…
On the positive side, aid for road transportation reached its highest level yet in 2011 at USD 8.8 billion, 40 percent
of total aid for economic infrastructure. Buys, Deichmann and Wheeler (2006) and Shepherd and Wilson (2008) have
found that road improvements can have substantial positive effects on trade volumes. Japan provided loans of
USD 454 million to the Philippines for maintenance of national roads and USD 395 million to Sri Lanka for construction
of an expressway in Colombo. The Asian Development Bank (ADB) supported road transport in Afghanistan with a
loan of USD 340 million to improve the road network, including rehabilitation of the Qaisar-Bala Murghab section
(90 km) of the Herat-Andkhoy road, which would include overall project and contract management, construction
supervision and monitoring, security arrangements and related community development works. This project will help
rehabilitate the primary road network, damaged during two decades of conflict and neglect.
However, the overall level of support for road transport may be exaggerated due to current difficulties associated
with the largest project committed to in 2011– construction of the Padma Bridge, a USD 2.9 billion project linking
the south-western to the northern and eastern regions of Bangladesh. The World Bank committed USD 660 million
for the Padma Multipurpose Bridge Project in 2011, but in February 2013 the government of Bangladesh informed
the World Bank that it was withdrawing its request for International Development Association (IDA) financing.
The Japanese International Cooperation Agency (JICA) also committed USD 429 million to this project in 2011 and the
ADB committed USD 76 million.

68 AID FOR TRADE AT A GLANCE 2013: CONNECTING TO VALUE CHAINS - © OECD, WTO 2013
CHAPTER 2: AID-FOR-TRADE FLOWS AND FINANCING
…and for coal-fired power stations...
While there was an overall decline in aid for energy, there was a resurgence in the support provided for coal-
fired power stations, reversing an earlier trend which saw donor support move towards renewable energy sources.
Japan provided almost all of the USD 1.2 billion for constructing coal-fired power stations. A project in Viet Nam,
the Nghi Son Thermal Power Plant Construction Project,6 accounts for USD 880.5 million of the total. In Serbia the
Flue Gas Desulphurisation Construction Project at the Thermal Power Plant Nikola Tesla accounts for USD 354 million.
The Nikola Tesla plant is the largest such plant in Serbia. The project will reduce pollutant emissions and improve
energy efficiency.7
…aid-for-trade policy and regulations has declined…
Aid for trade, in its narrowest sense of support for trade policy and regulations, attracted USD 1.3 billion in 2011,
3 percent of total aid for trade (Figure 2.10). Despite years of impressive growth, aid in this category declined between
2010 and 2011 by 18.4 percent. Trade policy and planning includes support to ministries and departments responsible
for trade policy, trade-related legislation and regulatory reforms, policy analysis and implementation of multilateral
trade agreements, e.g. technical barriers to trade (TBT) and sanitary and phytosanitary (SPS) measures. It also covers
costs associated with mainstreaming trade in national development strategies (e.g. poverty reduction strategy papers).
Trade policy and planning is the most heavily supported sub-category related to TPR with USD 697 million in 2011.
Figure 2.10 Aid-for-trade policy and regulation
(USD million, 2011 constant prices)
Source : OECD Creditor Reporting System Database, http://stats.oecd.org/index.aspx?DataSetCode=CRS1#.
2002-05 avg.
Trade Policy and Regulation
Trade Facilitation
1 800
1 600
1 200
1 000
1 400
800
400
600
200
02006-08 avg. 2009 2010 2011
USD 16 million was committed to support developing countries’ effective participation in the multilateral trade
negotiations, including training of trade negotiators, assessing impacts of negotiations and covering the costs of WTO
accession. Trade education/training, which includes both human resources development and university programmes
in trade, stands at USD 39 million. Aid to all trade policy areas has increased since the baseline, with the exception of
multilateral negotiations. Perhaps due to the impasse in the Doha Round, aid to support the negotiations declined by
15 percent in 2011 compared to 2010 and by 4 percent compared to the baseline.
69AID FOR TRADE AT A GLANCE 2013: CONNECTING TO VALUE CHAINS - © OECD, WTO 2013
CHAPTER 2: AID-FOR-TRADE FLOWS AND FINANCING
The largest project supporting trade policy and regulations in 2011 was a USD 125 million commitment by the
Netherlands to finance the Sustainable Trade Initiative (IDH), which promotes sustainable international trade chains
delivered through non-governmental organisations (NGOs). The Netherlands provides another USD 41 million for a
global producer support initiative, a public-private partnership which aims to create and sustain agri-supply chains.
The EU assisted Egypt with USD 28 million for the Ministry of Industry and Trade to implement and execute key policy
reforms (from 2011 to 2013) to help that country further integrate into the regional and global economy. The EU also
provided USD 21 million to help the African, Caribbean and Pacific Group of States (ACP) to cope with technical barriers
to trade. Canada is funding researchers to undertake a set of country case studies aimed at better understanding the
nature and extent of media piracy in Brazil, India and South Africa.8
…and aid for trade facilitation has faltered after steady growth
Aid for trade facilitation covers support provided for the simplification and harmonisation of international import
and export procedures (e.g. customs valuation, licensing procedures, payments and insurance), customs departments
and tariff reforms. Aid for trade facilitation commitments have increased substantially in recent years, and by
365 percent since the 2002-05 baseline, amounting to USD 381 million in 2011. While there was a 10 percent decline
in 2010, this was less than the overall 14 percent decline in aid-for-trade commitments (Figure 2.10). Increased aid
for trade facilitation commitments have largely benefitted Africa. In 2011 commitments to Africa stood at USD 200
million, a 17-fold increase since the baseline. Flows to the Americas increased in 2011 to USD 62 million because of EU
support to the Caribbean. Flows to Asia have fluctuated over the years. Support dropped to USD 39 million in 2011,
while in Europe flows were up compared to previous years at USD 35 million. Finally, aid to Oceania for trade facilitation
declined by almost USD 40 million to USD 6 million in 2011, following the USD 40 million EU commitment in 2010 to a
project to “strengthen Pacific economic integration through trade”.
Donors provided USD 168 million (44 percent of the total) in regional trade facilitation programmes and another
USD 40 million in multi-country programmes in 2011.9 Denmark provided USD 24 million for a programme in the
East African Community (Burundi, Kenya, Rwanda, Tanzania and Uganda) to foster economic integration through
the establishment of a Common Market with the aim of promoting economic growth. Five donors (Denmark,
Japan, Switzerland, the EU and the World Bank Group) provided 86 percent of total aid for trade facilitation. The EU
provided almost USD 95 million in the largest programme, to “support the construction of a competitive regional
market in the context of the Economic Partnership Agreements” in Africa.10 The World Bank provided the bulk of its
USD 52 million in aid for trade facilitation to Cameroon (USD 11.2 million), Ghana (USD 20 million) and Rwanda
(over USD 17.5 million). Switzerland provided USD 33.2 million and Denmark USD 30 million for global programmes.
Japan provided USD 26 million, of which USD 20 million funded technical co-operation in the Asia region.
Donors are providing information and assistance for imports into their own markets…
Page (2011) noted that a lack of market information posed challenges for developing country producers, claiming
that only a few bilateral donors offered specific information and assistance for imports into their own markets. She
considered this an important gap, given that donors are best placed to provide information on these markets. There
are signs, however, that donors are starting to respond. Both the Netherlands and Switzerland scaled up their market
information support in 2011, offering specific information and assistance for imports into their own markets.
70 AID FOR TRADE AT A GLANCE 2013: CONNECTING TO VALUE CHAINS - © OECD, WTO 2013
CHAPTER 2: AID-FOR-TRADE FLOWS AND FINANCING
Switzerland committed USD 31 million for the Swiss Import Promotion Programme (SIPPO) within the framework
of its economic development co-operation. SIPPO assists importers from Switzerland and the EU with finding suitable
partners and high-quality products from selected developing and transition countries. SIPPO’s advisory services, which
concentrate on promoting the import of products from the food, non-food, and sustainable tourism sectors, are
active in 14 countries on four continents. The Netherlands provided USD 208 million to the Centre for the Promotion
of Imports from Developing Countries (CBI) for trade promotion in Africa. The CBI is an agency of the Netherlands
Ministry of Foreign Affairs that helps producers/exporters to get a foothold in the Netherlands market. The CBI also
provides support to Business Support Organisations in improving their capabilities and acts as a matchmaker between
suppliers and buyers. The EU’s Export Helpdesk has been operating since 2004 as a single point of access for online
information for developing country firms about exporting to Europe.
...and are providing more aid for trade-related adjustment.
Aid for trade-related adjustment helps developing countries with the costs associated with trade liberalisation,
such as tariff reductions, preference erosion, or declining terms of trade. A specific purpose code was added to the CRS
to track resources for adjustment in 2007. Initially reporting was incomplete and only two members reported activities,
but this has improved with six donors reporting. The flows of trade-related adjustment activities amounted to almost
USD 63 million in 2011.
The EU is the largest provider of aid for trade-related adjustment. The reform of the EU Sugar Regime in 2006
involved a loss of quotas and gradual reductions in the price guaranteed by the EU. It forced EU Sugar Protocol countries
to introduce measures to improve the competitiveness of their sugarcane sectors, and to mitigate the negative
economic and social impact of the reform. In 2006, the European Commission announced an eight-year aid scheme
to support these changes: the Accompanying Measures for Sugar Protocol Countries (AMS). Under this scheme the EU
committed USD 43 million in sector budget support to the sugar industry in Jamaica in 2011 to “develop and maintain
a sustainable private-sector led sugar cane industry”.11 This support represents almost 70 percent of aid for trade-
related adjustment, although Finland (USD 10.7 million) and Switzerland (USD 7.5 million) also provide such support.
USD 174 billion in aid for trade was disbursed since 2006.
Aid-for-trade disbursements were less affected by the 2011 slowdown in ODA. In real terms, disbursements
declined by 3.7 percent to USD 33.5 billion (Figure 2.11). As a consequence of higher commitments in previous
years, economic infrastructure received the lion’s share of disbursements with USD 17.7 billion. However, as with
commitments, infrastructure disbursements were the category most affected by the decrease in spending, down
USD 1 billion from 2010. Aid for building productive capacity was maintained at 2010 levels, with a slight increase to
USD 14.8 billion. Disbursements for trade policy and regulation decreased by USD 300 million, from USD 1.2 billion in
2010 to USD 982 million in 2011.

71AID FOR TRADE AT A GLANCE 2013: CONNECTING TO VALUE CHAINS - © OECD, WTO 2013
CHAPTER 2: AID-FOR-TRADE FLOWS AND FINANCING
Figure 2.11 Aid-for-trade disbursements
(USD million, 2011 constant prices)
Source: OECD Creditor Reporting System Database, http://stats.oecd.org/index.aspx?DataSetCode=CRS1#.
Trade policy and regulations
Building productive capacity
Economic infrastructure
Trade-related adjustment
40 000
35 000
30 000
25 000
20 000
10 000
15 000
5 000
02006 2007 2008 2009 2010 2011
Annual disbursements increased by 53 percent between 2006 and 2011. In total, USD 174 billion in aid for trade
was disbursed between 2006 and 2011. Ten countries received 35 percent of these disbursements, dominated by
Asia, which has routinely been the largest regional recipient of commitments. India is the largest recipient with
USD 11 billion (6.4 percent of the total), followed by Viet Nam with just over USD 9 billion (5.3 percent) and
Afghanistan with USD 8.2 billion (4.7 percent). Disbursements may represent past priorities; for example, Iraq received
USD 6.9 billion, largely for post-war reconstruction, and commitments to that country have since diminished.
Commitments to China and Indonesia have also declined, but these countries received disbursements of USD 5.8 billion
(3 percent) and USD 4.4 billion (2.5 percent) respectively. North Africa has also benefitted from high disbursements.
Egypt and Morocco are among the ten largest recipients with USD 4 billion (2.3 percent) and USD 3.8 billion
(2.2 percent). Ethiopia is the only Sub-Saharan African country in the top ten with USD 3.96 billion (2.2 percent),
followed by Turkey, the only country in Europe, with USD 3.35 billion (1.9 percent). Five donors provided 66 percent of
total aid-for-trade disbursements between 2006 and 2011. Japan was the largest donor, with disbursements of USD 36
billion (21 percent of the total), followed by the United States with USD 24 billion (13.8 percent), the World Bank with
USD 24 billion (13.7 percent), the EU with USD 16.3 billion (9.4 percent) and Germany with USD 14 billion (8 percent).
WHO ARE THE RECIPIENTS OF AID FOR TRADE?
Aid-for-trade commitments were made to 146 countries in 2011. Several countries no longer receive any aid for
trade, including Anguilla, Barbados, Croatia, Mayotte, Oman and Trinidad and Tobago, all of which have now graduated
from recipient status. South Sudan, which became independent in 2011, is included in the list of recipients for the first
time. Aid-for-trade volumes vary considerably across countries. This section examines the recipients in terms of region,
income group and individual countries.
72 AID FOR TRADE AT A GLANCE 2013: CONNECTING TO VALUE CHAINS - © OECD, WTO 2013
CHAPTER 2: AID-FOR-TRADE FLOWS AND FINANCING
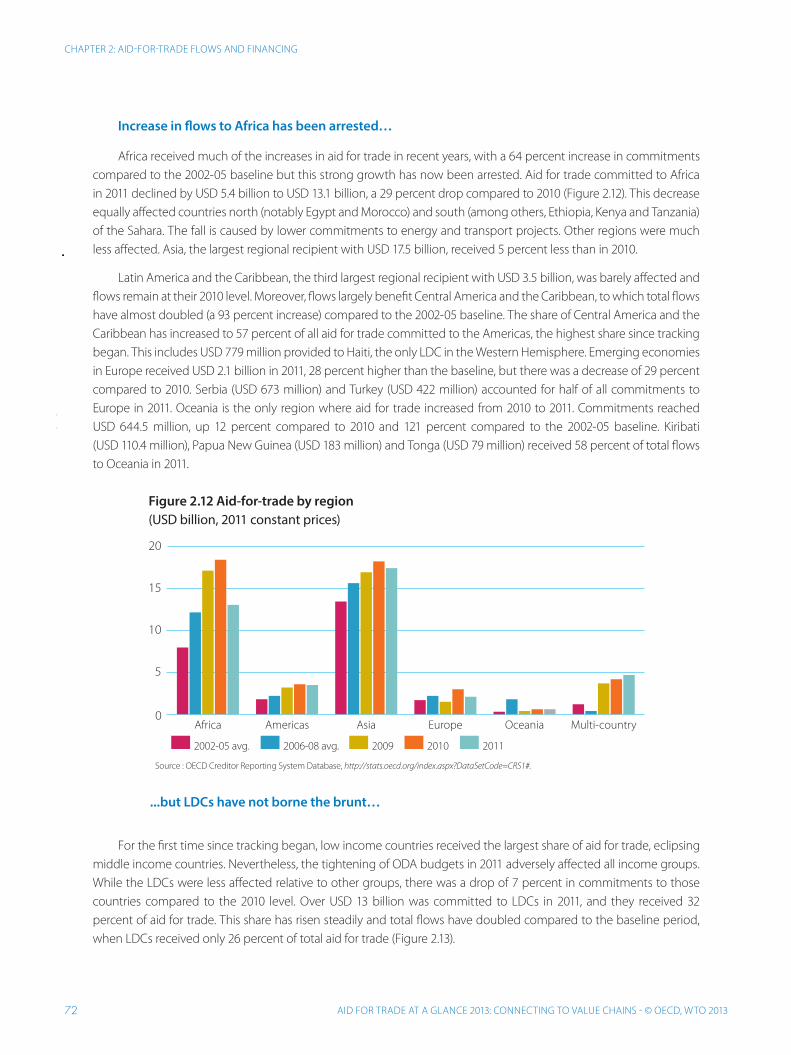
Increase in flows to Africa has been arrested…
Africa received much of the increases in aid for trade in recent years, with a 64 percent increase in commitments
compared to the 2002-05 baseline but this strong growth has now been arrested. Aid for trade committed to Africa
in 2011 declined by USD 5.4 billion to USD 13.1 billion, a 29 percent drop compared to 2010 (Figure 2.12). This decrease
equally affected countries north (notably Egypt and Morocco) and south (among others, Ethiopia, Kenya and Tanzania)
of the Sahara. The fall is caused by lower commitments to energy and transport projects. Other regions were much
less affected. Asia, the largest regional recipient with USD 17.5 billion, received 5 percent less than in 2010.
Latin America and the Caribbean, the third largest regional recipient with USD 3.5 billion, was barely affected and
flows remain at their 2010 level. Moreover, flows largely benefit Central America and the Caribbean, to which total flows
have almost doubled (a 93 percent increase) compared to the 2002-05 baseline. The share of Central America and the
Caribbean has increased to 57 percent of all aid for trade committed to the Americas, the highest share since tracking
began. This includes USD 779 million provided to Haiti, the only LDC in the Western Hemisphere. Emerging economies
in Europe received USD 2.1 billion in 2011, 28 percent higher than the baseline, but there was a decrease of 29 percent
compared to 2010. Serbia (USD 673 million) and Turkey (USD 422 million) accounted for half of all commitments to
Europe in 2011. Oceania is the only region where aid for trade increased from 2010 to 2011. Commitments reached
USD 644.5 million, up 12 percent compared to 2010 and 121 percent compared to the 2002-05 baseline. Kiribati
(USD 110.4 million), Papua New Guinea (USD 183 million) and Tonga (USD 79 million) received 58 percent of total flows
to Oceania in 2011.
Figure 2.12 Aid-for-trade by region
(USD billion, 2011 constant prices)
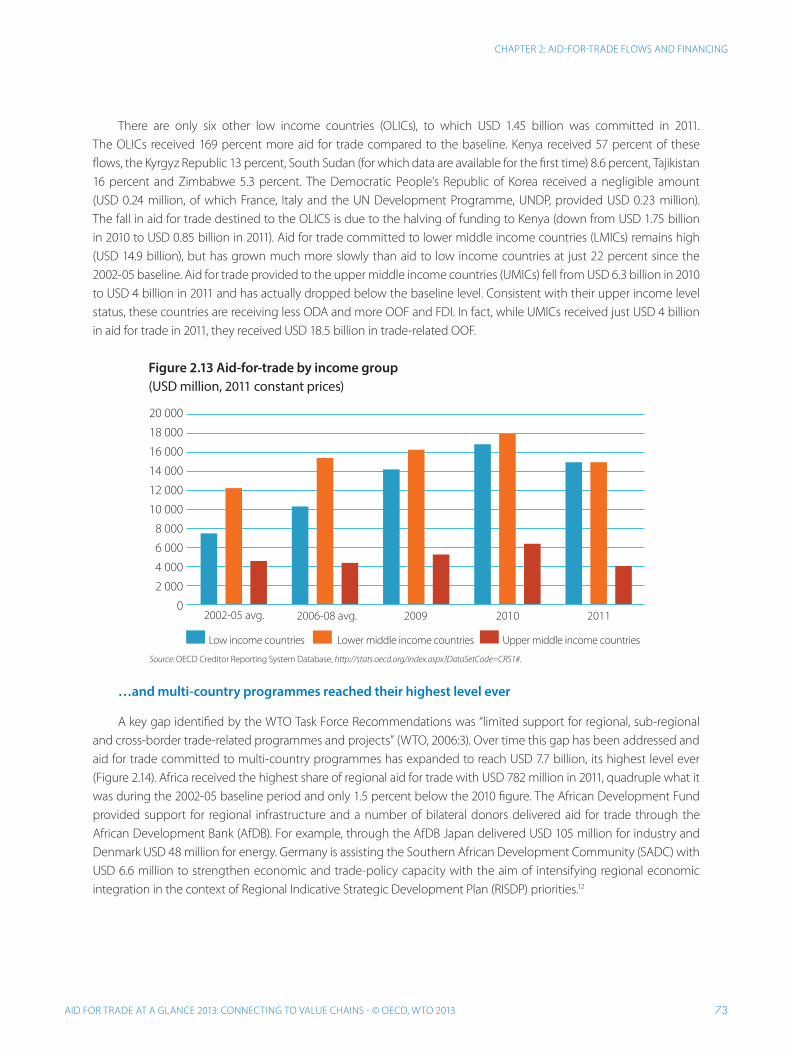
...but LDCs have not borne the brunt…
For the first time since tracking began, low income countries received the largest share of aid for trade, eclipsing
middle income countries. Nevertheless, the tightening of ODA budgets in 2011 adversely affected all income groups.
While the LDCs were less affected relative to other groups, there was a drop of 7 percent in commitments to those
countries compared to the 2010 level. Over USD 13 billion was committed to LDCs in 2011, and they received 32
percent of aid for trade. This share has risen steadily and total flows have doubled compared to the baseline period,
when LDCs received only 26 percent of total aid for trade (Figure 2.13).
Source : OECD Creditor Reporting System Database, http://stats.oecd.org/index.aspx?DataSetCode=CRS1#.
20
15
10
5
0
2002-05 avg. 20092006-08 avg. 2010 2011
Multi-countryOceaniaEuropeAsiaAmericasAfrica
73AID FOR TRADE AT A GLANCE 2013: CONNECTING TO VALUE CHAINS - © OECD, WTO 2013
CHAPTER 2: AID-FOR-TRADE FLOWS AND FINANCING
There are only six other low income countries (OLICs), to which USD 1.45 billion was committed in 2011.
The OLICs received 169 percent more aid for trade compared to the baseline. Kenya received 57 percent of these
flows, the Kyrgyz Republic 13 percent, South Sudan (for which data are available for the first time) 8.6 percent, Tajikistan
16 percent and Zimbabwe 5.3 percent. The Democratic People’s Republic of Korea received a negligible amount
(USD 0.24 million, of which France, Italy and the UN Development Programme, UNDP, provided USD 0.23 million).
The fall in aid for trade destined to the OLICS is due to the halving of funding to Kenya (down from USD 1.75 billion
in 2010 to USD 0.85 billion in 2011). Aid for trade committed to lower middle income countries (LMICs) remains high
(USD 14.9 billion), but has grown much more slowly than aid to low income countries at just 22 percent since the
2002-05 baseline. Aid for trade provided to the upper middle income countries (UMICs) fell from USD 6.3 billion in 2010
to USD 4 billion in 2011 and has actually dropped below the baseline level. Consistent with their upper income level
status, these countries are receiving less ODA and more OOF and FDI. In fact, while UMICs received just USD 4 billion
in aid for trade in 2011, they received USD 18.5 billion in trade-related OOF.
Figure 2.13 Aid-for-trade by income group
(USD million, 2011 constant prices)
Source: OECD Creditor Reporting System Database, http://stats.oecd.org/index.aspx?DataSetCode=CRS1#.
Low income countries Upper middle income countriesLower middle income countries
2002-05 avg.
20 000
18 000
14 000
10 000
6 000
2 000
16 000
12 000
8 000
4 000
02006-08 avg. 2009 2010 2011
…and multi-country programmes reached their highest level ever
A key gap identified by the WTO Task Force Recommendations was “limited support for regional, sub-regional
and cross-border trade-related programmes and projects” (WTO, 2006:3). Over time this gap has been addressed and
aid for trade committed to multi-country programmes has expanded to reach USD 7.7 billion, its highest level ever
(Figure 2.14). Africa received the highest share of regional aid for trade with USD 782 million in 2011, quadruple what it
was during the 2002-05 baseline period and only 1.5 percent below the 2010 figure. The African Development Fund
provided support for regional infrastructure and a number of bilateral donors delivered aid for trade through the
African Development Bank (AfDB). For example, through the AfDB Japan delivered USD 105 million for industry and
Denmark USD 48 million for energy. Germany is assisting the Southern African Development Community (SADC) with
USD 6.6 million to strengthen economic and trade-policy capacity with the aim of intensifying regional economic
integration in the context of Regional Indicative Strategic Development Plan (RISDP) priorities.12

74 AID FOR TRADE AT A GLANCE 2013: CONNECTING TO VALUE CHAINS - © OECD, WTO 2013
CHAPTER 2: AID-FOR-TRADE FLOWS AND FINANCING
Regional programmes in Asia (USD 336 million) and the Americas (USD 125.7 million) were more modest, but
have grown slightly since 2010 and substantially since the baseline with a 310 percent increase in regional support to
Asia and a 60.5 percent increase in that to the Americas. The EU provided almost USD 20 million to South-East Asia to
support Association of Southeast Asian Nations (ASEAN) economic integration with projects designed to strengthen
the institutional framework to manage integration. Australia committed USD 20 million (2013-2014) to the ASEAN-
Australia-New Zealand Free Trade Area (AANZFTA) Economic Cooperation Support Programme (AECSP), which assists
developing ASEAN member states to implement their commitments under the AANZFTA and thus participate in the
benefits of greater trade liberalisation and regional economic integration. Germany funded 72 percent of all regional
programmes in the Americas, with USD 47.6 million to strengthen regional financial institutions and USD 25 million
to improve regional energy supply. Global programmes have grown strongly since the 2002-05 baseline. This growth
continued in 2011, to reach USD 4.7 billion. The largest global programme involved a USD 572.5 million commitment
from the Netherlands for private sector investment to support pilot investments in developing countries. Pilot projects
encourage (Dutch) investments in emerging markets and trade relations with local companies in emerging markets.
Figure 2.14 Multi-country programmes
(USD million, 2011 constant prices)
Source : OECD Creditor Reporting System Database, http://stats.oecd.org/index.aspx?DataSetCode=CRS1#.
Africa
5 000
4 000
4 500
3 000
2 500
3 500
2 000
1 000
1 500
500
0Americas Asia Global
2002-05 avg. 20092006-08 avg. 2010 2011
WHO ARE THE PROVIDERS OF AID FOR TRADE?
Bilateral aid for trade has declined, but remains the major source...
Bilateral donors still provide the majority of aid of trade, accounting for 60 percent of total support in 2011.
However, the total amount they provided in that year fell from 65 percent in 2010 (Figure 2.15). The 24 members
of the Development Assistance Committee (DAC) provided USD 28 billion in 2011, a decline of 19 percent on 2010.
Every member of the Group of Seven (G7) provided less aid for trade in 2011. This reduction of nearly USD 6.4 billion
accounts for almost the entire decline in aid for trade (USD 6.6 billion). Japan remained the largest donor in 2011 at
USD 7.9 billion, a 22 percent decline on 2010 although this figure is 30 percent greater than the 2002-05 baseline. Japan
is the DAC donor most specialised in aid for trade. Of its total sectoral allocable ODA, 60 percent was channelled to aid
for trade. Germany was the second largest bilateral donor at USD 3.7 billion, up 176 percent compared to the baseline
but down 20 percent on 2010. German aid for trade declined in 2011 compared to 2010, but not to 2009. This may be
explained by the surge in aid for trade in 2010 due to the commitment to “fast start” climate finance, particularly for
renewable energy activities, following the UN Climate Change Conference in Copenhagen.

75AID FOR TRADE AT A GLANCE 2013: CONNECTING TO VALUE CHAINS - © OECD, WTO 2013
CHAPTER 2: AID-FOR-TRADE FLOWS AND FINANCING
A steep reduction in aid for trade from the United States saw commitments fall from USD 5.9 billion in 2010 to
USD 3.6 billion in 2011, a 40 percent decline. The 2011 level of support from the United States was 8.5 percent below
the baseline. This underscores the move by the United States away from aid for trade towards social programmes.
Moreover, only 19 percent of total sector allocable ODA was provided for aid for trade. The EU provided USD 3.2 billion,
with only a 2 percent decline compared to 2010. This was an 8 percent increase on the 2002-05 baseline. France
provided USD 1.3 billion, a 29 percent decline on 2010 but still almost 60 percent higher than the baseline. Bilateral
commitments by the United Kingdom fell by 22 percent compared to 2010, although the UK continues to deliver
significant support through multilateral institutions (see section below).
Beyond the G7, Spain’s aid-for-trade commitments fell by almost half (to 54 percent) compared to 2010 while
Denmark, Italy and Portugal committed less aid for trade in 2011 than during the baseline period. Some donors,
however, did increase resources. The Netherlands doubled its 2010 level of aid for trade to USD 1.2 billion. Norway
provided just over USD 1 billion, a similar level to 2010. It remains one of the top ten donors. New Zealand’s
USD 187 million represents an increase of 165 percent on 2010 and 720 percent on the 2002-05 baseline. Belgium’s
flows increased by 7 percent in 2011 compared to 2010, reaching USD 478 million. Remarkably, both Greece (3 percent)
and Ireland (2.7 percent) increased their aid-for-trade commitments in 2011. Other bilateral donors, such as the Czech
Republic and the United Arab Emirates, added another USD 204 million.
Figure 2.15 Top ten aid-for-trade donors
(USD million, 2011 constant prices)
Source : OECD Creditor Reporting System Database, http://stats.oecd.org/index.aspx?DataSetCode=CRS1#.
Japan
12 000
10 000
8 000
6 000
4 000
2 000
0
Germany
World Bank
United States
ADB
EU Instit
utions
Netherlands
France
Arab Fund
Norway
2002-05 avg. 20092006-08 avg. 2010 2011
…and the G20 is slightly off track in regard to its aid-for-trade pledge…
Meeting at the Seoul Summit on 11-12 November 2010, the assembled leaders of the Group of 20 pledged to
(at least) maintain aid-for-trade levels that reflected the average of the period 2006-08 beyond 2011 and tasked the
OECD and the WTO to monitor progress. The latest data for 2011 indicate that the G20 is no longer on track to meet
this commitment (Figure 2.16). G20 aid-for-trade commitments reached USD 23.3 billion in 2011, down by 24 percent
in real terms (USD 7.3 billion) from 2010 and 3.4 percent below the 2006-08 baseline. The G20 has continued to provide
resources to LDCs, representing 22.5 percent of total aid for trade. USD 5.2 billion was committed to LDCs in 2011,
3.4 percent higher than the 2006-08 average in real terms. Still, resources for LDCs declined by 24 percent compared
to 2010.

76 AID FOR TRADE AT A GLANCE 2013: CONNECTING TO VALUE CHAINS - © OECD, WTO 2013
CHAPTER 2: AID-FOR-TRADE FLOWS AND FINANCING
Figure 2.16 G20 aid-for-trade pledge
(USD million, 2011 constant prices)
…while multilateral providers are maintaining their funding
In 2011 multilateral donors maintained aid-for-trade resources at 2010 levels (USD 16.6 billion, or 40 percent
of total aid for trade).13 The World Bank is the largest multilateral donor and the second largest donor overall at
USD 7.3 billion. The Bank increased its provision of aid for trade by 46 percent compared to the baseline and by
29 percent (USD 1.6 billion) compared to 2010. The Asian Development Bank Special Funds committed USD 1.45 billion
in 2011, a decline of 10 percent after a significant increase in 2010. The increase in aid for trade from the World Bank
offset declines from other multilateral donors including the African Development Fund (down USD 851 million) and
the Arab donors, specifically the Kuwait Fund For Arab Economic Development (down USD 540 million) and the OPEC
Fund for International Development (down USD 194 million). The Arab Fund for Economic and Social Development
has consistently provided over USD 1 billion per year since 2008.
HOW IS AID FOR TRADE DELIVERED?
Grants and concessional loans are equally distributed…
Aid for trade is part and parcel of regular ODA, which is composed of grants and loans meeting certain conditions
(i.e. transactions that are concessional in character and convey a grant element of at least 25 percent). Half of aid for
trade is in grant form and half in the form of concessional loans. This distribution has been more or less consistent
in recent years (Figure 2.17). Grants were less affected by the decline in 2011, falling by 10 percent to USD 20.3 billion,
whereas the total amount of loans provided fell by 16 percent. Twenty-two aid providers committed USD 21.3 billion
in loans in 2011. USD 16.6 billion was committed by the five largest lenders: France, Germany, Japan, the World Bank
and the Arab Fund for Economic and Social Development. Poorer countries tend to benefit from more concessional
forms of finance. Of the support received by LDCs, 60 percent is in grant form while UMICs receive only 23.8 percent
of their aid for trade as grants. Nevertheless, the choice of the finance instrument used tends to be more dependent
on the project type. Almost all (97 percent) trade policy and regulations projects are funded with grants, compared to
just 36.5 percent of economic infrastructure projects. For building productive capacity, 60 percent of the aid provided
is in grant form and 40 percent in the form of loans. Trade-related adjustment remains small, but is also dominated by
grants (83 percent).
Source : OECD Creditor Reporting System Database, http://stats.oecd.org/index.aspx?DataSetCode=CRS1#.
2006-08
30 000
25 000
20 000
10 000
15 000
5 000
02009 2010 2011

77AID FOR TRADE AT A GLANCE 2013: CONNECTING TO VALUE CHAINS - © OECD, WTO 2013
CHAPTER 2: AID-FOR-TRADE FLOWS AND FINANCING
The United States was the largest provider of grants in 2011 at USD 3.6 billion. It does not provide any loans.
The EU provided USD 3.2 billion in grants and does not currently include any ODA loans in its reporting. Other major
donors use loans extensively to finance their programmes. Japan provided the bulk of its assistance in the form of
loans at USD 6.5 billion, with USD 1.43 billion in grants. Similarly, the World Bank through the International Development
Association (IDA) provided USD 5.7 billion in loans and USD 1.66 billion in grants. The majority of French and German
support in 2011 was also in the form of loans. Both countries traditionally have a higher proportion of loans than grants
in their aid-for-trade programmes.
Because of the repayments deducted from ODA loans, grants constitute a greater proportion of aid-for-
trade disbursements. Grants averaged 54 percent of total disbursements between 2006 and 2011 and stood at
52.6 percent in 2011. They increased by just 36 percent compared to 2006, while loans grew by 76 percent (reflecting
the higher commitments of loans in recent years). Such loans normally have a grace period of ten years, so higher loan
disbursements will decline in the future due to repayments.
Figure 2.17 Loans and grants for aid-for-trade disbursements
(USD million, 2011 constant prices)
Source: OECD Creditor Reporting System Database, http://stats.oecd.org/index.aspx?DataSetCode=CRS1#.
Grants Loans
40 000
35 000
30 000
25 000
20 000
10 000
15 000
5 000
02006 2007 2008 2009 2010 2011
…and non-concessional Other Official Flows have fallen
It is not just concessional loans which are provided by the official sector. Other Official Flows (OOF) provided
by the official sector are transactions that do not meet the eligibility conditions for ODA, mainly because they have
a grant element of less than 25 percent (i.e. they are low concessional loans). As noted in previous Aid for Trade at a
Glance reports, these flows can play a crucial role in financing trade-related activities (mainly in the area of economic
infrastructure and building productive capacity). There was a surge in trade-related OOF in 2009 due to increased
crisis-related lending from multilateral donors. Since this peak of USD 50 billion, flows declined by 9 percent in 2010
and a further 18 percent in 2011 to USD 37.7 billion (with declines in aid to all sectors) (Figure 2.18). OOF for economic
infrastructure represented 57 percent of the total in 2011 and stood at USD 21.4 billion. Flows for building productive
capacity were 42.5 percent of the total, while less than 1 percent went to trade policy and regulations.

78 AID FOR TRADE AT A GLANCE 2013: CONNECTING TO VALUE CHAINS - © OECD, WTO 2013
CHAPTER 2: AID-FOR-TRADE FLOWS AND FINANCING
Figure 2.18 Trade-related other official flows
(USD million, 2011 constant prices)
Middle income countries are the main recipients of OOF…
On average since 2002, only 3 percent of OOF has been provided to least developed countries while other low
income countries have received less than 1 percent. This is in contrast to upper middle income countries, which
averaged over 57 percent, and lower middle income countries, which received 37 percent (Figure 2.19). Five countries
(Brazil, China, India, Indonesia and Turkey) received 41 percent of total OOF, dominating the flows.
Figure 2.19 Trade-related other official flows by income group
(USD million, 2011 constant prices)
Source : OECD Creditor Reporting System Database, http://stats.oecd.org/index.aspx?DataSetCode=CRS1#.
Trade policy and regulations Building productive capacityEconomic infrastructure
2002-05 avg.
60 000
50 000
40 000
30 000
20 000
10 000
02006-08 avg. 2009 2010 2011
Source: OECD Creditor Reporting System Database, http://stats.oecd.org/index.aspx?DataSetCode=CRS1#.
Low income countries Lower middle income countries
Upper middle income countries Unallocated
2002-05 avg.
30 000
10 000
25 000
20 000
15 000
5 000
02006-08 avg. 2009 2010 2011

79AID FOR TRADE AT A GLANCE 2013: CONNECTING TO VALUE CHAINS - © OECD, WTO 2013
CHAPTER 2: AID-FOR-TRADE FLOWS AND FINANCING
…provided mostly by multilaterals
In 2011 multilateral institutions continued to fund significantly more trade-related non-concessional flows than
their bilateral counterparts. The World Bank was the largest provider of trade-related OOF, with 25 percent of the total
or USD 9.4 billion. However, a large cutback in funding from the Bank through the International Bank for Reconstruction
and Development (IBRD) saw a USD 9 billion drop from 2010. The World Bank was not the only multilateral to decrease
its provision of OOF. Resources provided by the European Bank for Reconstruction and Development (EBRD) dropped
by USD 1.2 billion. However, the World Bank’s decreased provision of OOF is clearly the main reason for the falling off
in trade-related OOF. In 2011 growth in the use of this non-concessional instrument continued, with Korea increasing
funding to USD 5.9 billion, an increase of USD 1.8 billion compared to 2010. The Korean Exim Bank provided over
USD 1.45 billion for industrial development in China, as well as USD 933 for industrial development in Indonesia,
USD 675 for minerals and mining in Brazil, and USD 500 million for oil and gas development in Iran. Germany provided
58 percent of its OOF for banking and finance (USD 730 million out of a total of USD 1.25 billion). The United States
was the only other major bilateral provider of trade-related OOF with loans amounting to USD 574 million, including
USD 192 million to India for energy and USD 90 million to Liberia for business and other services.
South-South trade-related co-operation is significant and increasing...
The world has become increasingly integrated and multi-polar. In particular, the dynamism of emerging
economies and many developing countries in recent years has sparked a shift in economic power from west to east
and north to south. The “rise of the South” has become a stimulus for expanding South-South economic links, most
notably in trade, but also in FDI, aid and remittances. According to the OECD report Perspectives on Global Development
2010: Shifting Wealth, developing countries accounted for 40 percent of world GDP in 2000. In 2010 they were reported
to represent 49 percent and by 2030 they will represent 57 percent (adjusted for purchasing power parity) (OECD,
2010b). The contribution of these countries to the growth of the international economy in the last five years represents
65 percent of the total. This shift has been most evident in global patterns of trade. “Between 1990 and 2008, world
trade expanded four-fold, while South-South trade multiplied by more than 20 times its initial levels over the same
period of time” (UN, 2011: 3). South-South trade accounts for 37 percent of global trade (OECD, 2010b: 18) and more
than 50 percent of all developing country trade.
One characteristic of the Aid-for-Trade Initiative is its emphasis on South-South co-operation among developing
countries as “a valuable tool to deliver effective results” in trade capacity building “because of their common experience
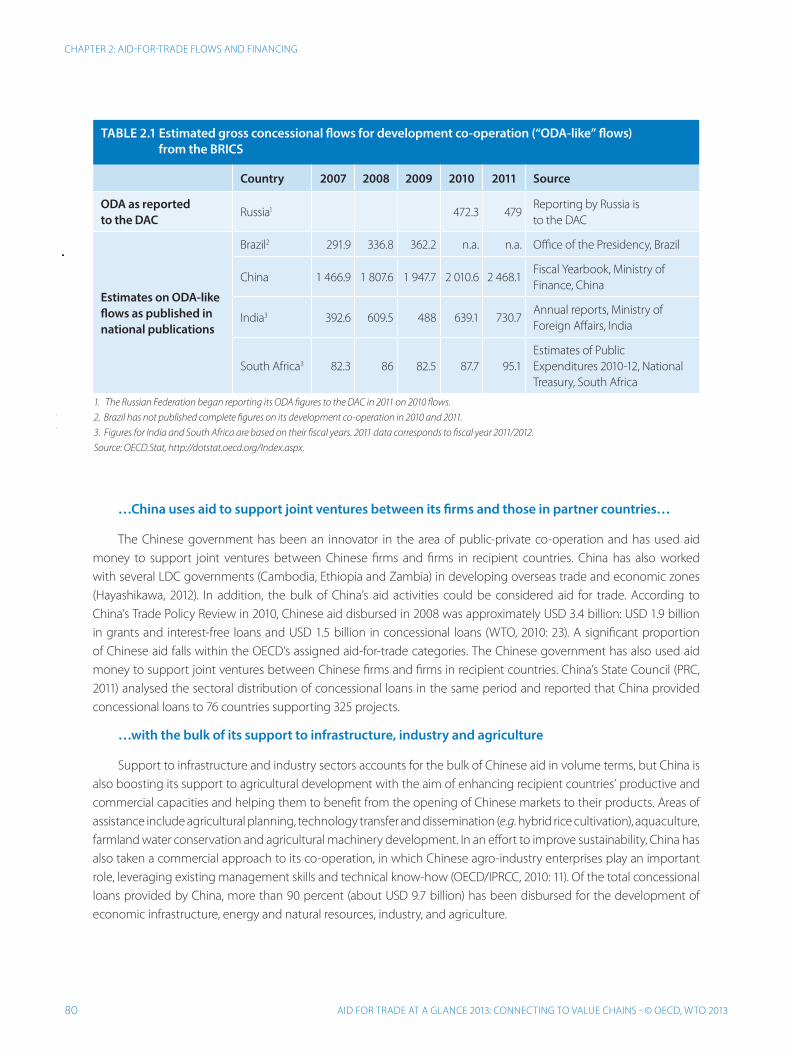
and understanding of the challenges they face” (Hayashikawa, 2012). The OECD estimates gross concessional flows for
development co-operation (“ODA-like” flows) on the basis of official sources (Table 2.1). According to these figures, China
and India are the most significant providers of aid. They use various instruments, such as non-concessional finance,
preferential trade agreements, and investment schemes that are not classed as ODA but are still used to help partner
countries build capacity for self-development. China and India are two of the leaders in South-South co-operation,
which typically combines aid with investment and enhanced market access opportunities, delivering “expertise and
financial support to foster the economic and social welfare of other developing countries” (Zimmermann and Smith,
2011: 726). The increase in South-South co-operation means additional financial resources and a wider choice for
developing countries to address their developmental needs.
80 AID FOR TRADE AT A GLANCE 2013: CONNECTING TO VALUE CHAINS - © OECD, WTO 2013
CHAPTER 2: AID-FOR-TRADE FLOWS AND FINANCING
TABLE 2.1 Estimated gross concessional flows for development co-operation (“ODA-like” flows) from the BRICS
Country 2007 2008 2009 2010 2011 Source
ODA as reported
to the DACRussia1 472.3 479
Reporting by Russia is
to the DAC
Estimates on ODA-like
flows as published in
national publications
Brazil2 291.9 336.8 362.2 n.a. n.a. Office of the Presidency, Brazil
China 1 466.9 1 807.6 1 947.7 2 010.6 2 468.1Fiscal Yearbook, Ministry of
Finance, China
India3 392.6 609.5 488 639.1 730.7Annual reports, Ministry of
Foreign Affairs, India
South Africa3 82.3 86 82.5 87.7 95.1
Estimates of Public
Expenditures 2010-12, National
Treasury, South Africa
1. The Russian Federation began reporting its ODA figures to the DAC in 2011 on 2010 flows.
2. Brazil has not published complete figures on its development co-operation in 2010 and 2011.
3. Figures for India and South Africa are based on their fiscal years. 2011 data corresponds to fiscal year 2011/2012.
Source: OECD.Stat, http://dotstat.oecd.org/Index.aspx.
…China uses aid to support joint ventures between its firms and those in partner countries…
The Chinese government has been an innovator in the area of public-private co-operation and has used aid
money to support joint ventures between Chinese firms and firms in recipient countries. China has also worked
with several LDC governments (Cambodia, Ethiopia and Zambia) in developing overseas trade and economic zones
(Hayashikawa, 2012). In addition, the bulk of China’s aid activities could be considered aid for trade. According to
China’s Trade Policy Review in 2010, Chinese aid disbursed in 2008 was approximately USD 3.4 billion: USD 1.9 billion
in grants and interest-free loans and USD 1.5 billion in concessional loans (WTO, 2010: 23). A significant proportion
of Chinese aid falls within the OECD’s assigned aid-for-trade categories. The Chinese government has also used aid
money to support joint ventures between Chinese firms and firms in recipient countries. China’s State Council (PRC,
2011) analysed the sectoral distribution of concessional loans in the same period and reported that China provided
concessional loans to 76 countries supporting 325 projects.
…with the bulk of its support to infrastructure, industry and agriculture
Support to infrastructure and industry sectors accounts for the bulk of Chinese aid in volume terms, but China is
also boosting its support to agricultural development with the aim of enhancing recipient countries’ productive and
commercial capacities and helping them to benefit from the opening of Chinese markets to their products. Areas of
assistance include agricultural planning, technology transfer and dissemination (e.g. hybrid rice cultivation), aquaculture,
farmland water conservation and agricultural machinery development. In an effort to improve sustainability, China has
also taken a commercial approach to its co-operation, in which Chinese agro-industry enterprises play an important
role, leveraging existing management skills and technical know-how (OECD/IPRCC, 2010: 11). Of the total concessional
loans provided by China, more than 90 percent (about USD 9.7 billion) has been disbursed for the development of
economic infrastructure, energy and natural resources, industry, and agriculture.

81AID FOR TRADE AT A GLANCE 2013: CONNECTING TO VALUE CHAINS - © OECD, WTO 2013
CHAPTER 2: AID-FOR-TRADE FLOWS AND FINANCING
India is providing trade-related technical assistance and lines of credit.
No official sources are available that provide a breakdown of Indian development co-operation, but according to
Agrawal (2007: 7) 60 percent is used to train civil servants, engineers and public-sector managers in other developing
countries; 30 percent is provided as concessional export credits (lines of credit) to enable foreign governments to
purchase Indian equipment and services; and 10 percent funds project-related activities such as feasibility studies and
the deployment of technical experts from India. India often delivers aid as part of a larger package of investments
and trade deals. Hence, commercial considerations can be an integral component of its development co-operation
programme. India is also engaged in infrastructure development through concessional lending and technical assistance.
In 2010 its export finance institution, the Exim Bank, extended a USD 3 billion new line of credit, of which USD 1 billion
was for Bangladesh alone, the highest one-off amount to any country from India. In 2011 the Exim Bank approved 12
new lines of credit worth USD 473.30 million to ten countries to finance various projects, ranging from agriculture and
agro-industry (sugar industry, cassava plantation, milk processing), mining (limestone) and energy (rural electrification,
solar energy, bio-diesel, power generation) to construction of broadcasting facilities and a multi-specialty hospital
(GOI, 2012).
The 2013 Confederation of Indian Industry (CII) India-Africa Project Partnership Conclave discussed emerging
opportunities to boost bilateral investment co-operation. The essence of the Conclave was to encourage Indian
exporters to access African countries and to increase their presence in the region – the target is to top USD 100 billion
by 2015. Indian acquisitions, in terms of value, made up one-third of total acquisitions in Sub-Saharan Africa in 2010.
Traditionally, Indian investment has been in the southern and eastern regions of Africa, but Indian business is now
attracted to West Africa. Increased African manufacturing will mean more investments in infrastructure projects. In total,
475 projects worth USD 64 billion, mainly in infrastructure and capacity building, were discussed at the CII Conclave.
WHAT IS THE OUTLOOK FOR AID-FOR-TRADE FLOWS?
Donors have significantly increased aid for trade…
As noted in this chapter, many donors have significantly increased their aid-for-trade commitments in recent
years. According to the findings of the OECD/WTO aid-for-trade survey, nine bilateral donors (or one-third) indicated
that they had significantly increased their aid-for-trade commitments while another four had increased resources by
less than 10 percent since 2009. Seven donors had not changed their overall commitments. Five had decreased their
support (Figure 2.20).
Figure 2.20 Aid-for-trade expenditure changes since the onset of the economic crisis
(percentage of responses)
0% 20% 40% 60% 80% 100%
Source: OECD/WTO Questionnaire 2013, www.aid4trade.org.
Significant increase (>10%) Increase (by 10% or less) No change
Decrease (by 10% or less) Significant decrease (>10%) Not sure
Number of responses are shown in white
2 2 4 1
South-South providers
5 6 2 1 1
Multilateral donors
9 4 7 1 4 2
Bilateral donors
12http://dx.doi.org/10.1787/888932854176

82 AID FOR TRADE AT A GLANCE 2013: CONNECTING TO VALUE CHAINS - © OECD, WTO 2013
CHAPTER 2: AID-FOR-TRADE FLOWS AND FINANCING
…but the outlook appears less positive to bilateral donors…
Bilateral donors are less optimistic about the future than multilateral donors and South-South providers, with no
bilateral donor foreseeing a significant increase in aid for trade in the next five years (Figure 2.21). For the most part,
these donors are unable to assess future budgetary outlays for aid for trade accurately. Ten donors (37 percent) are
not sure how aid budgets will evolve. Eleven (41 percent) do not envisage any change in the current level of funding,
while five (18.5 percent) predict some moderate increases. Only one bilateral donor foresees declining flows. All in all,
bilateral donors indicate that their aid-for-trade budgets will hold up in spite of budget pressures. But they expect
pressure on budgets and the need to show value for money in regard to public expenditure to continue to drive a
focus on results, with 32 donors indicating that this will be important in the next five years (20 indicated that results
are the most important factor in aid for trade moving forward).
One year of data does not represent a trend, but the outlook for aid for trade as of 2013 is not reassuring. Based
on aggregate 2012 ODA figures, a further decline in aid for trade is likely, with overall ODA declining by 4 percent in
real terms following a 2 percent fall in 2011. Furthermore, the latest aid figures show that aid is shifting away from the
world’s poorest countries, including in Sub-Saharan Africa, and towards middle income countries such as China, India,
Indonesia and Viet Nam, traditionally large recipients of aid for trade. Bilateral aid to the African continent declined by
almost 10 percent and aid to Sub-Saharan Africa fell by 7.9 percent in real terms compared to 2011. This indicates that
the decline in aid for trade to Africa in 2011 is likely to continue into 2012. While the least developed countries did not
bear the brunt of the decline in aid for trade in 2011, bilateral net ODA to the LDCs fell by 12.8 percent in real terms in
2012.
Overall aid by Japan, the largest aid-for-trade donor, dropped by over 2 percent in 2012 due to a fall in bilateral
grants and reduced contributions to international organisations. Germany provided 0.7 percent less, but mostly in the
form of reduced multilateral contributions. The United States continued to be the largest donor by volume in 2012,
but its aid contracted by 2.8 percent. This fall was mainly due to a reduction in bilateral net debt relief, so aid for trade
may not be affected.
Figure 2.21 Expected changes in total aid-for-trade in the next five years
(percentage of responses)
0% 20% 40% 60% 80% 100%
Source: OECD/WTO Questionnaire 2013, www.aid4trade.org.
Significant increase (>10%) Increase (by 10% or less) No change
Decrease (by 10% or less) Significant decrease (>10%) Not sure
Number of responses are shown in white
2 3 4
South-South providers
5 4 2 1 3
Multilateral donors
5 11 1 10
Bilateral donors
12http://dx.doi.org/10.1787/888932854195

83AID FOR TRADE AT A GLANCE 2013: CONNECTING TO VALUE CHAINS - © OECD, WTO 2013
CHAPTER 2: AID-FOR-TRADE FLOWS AND FINANCING
…multilaterals are more upbeat…
Multilateral donors are more positive. Over 70 percent of them have increased aid for trade since 2009 (five
agencies or one-third have provided significantly more). Concerning the next five years, multilaterals have more clarity
about expected future spending than most bilateral donors and will continue to provide more, with over 60 percent
of respondents indicating further spending increases (Figure 2.21). Only one multilateral agency indicated less funding.
Moreover, in the next five years multilaterals will continue to focus on results while regional integration, private sector
development, poverty reduction and green growth will remain important. These cross-cutting themes necessitate an
increase in cross-agency joint initiatives/projects and collaborative efforts.
According to the OECD Multilateral Aid Report 2012, members of the Development Assistance Committee (DAC)
increased their level of multilateral aid to USD 38 billion in 2011. This is likely to lead to an increase in subsequent
outflows from the multilateral system to partner countries in 2012 (OECD, 2013). However, bilateral donors are
more discerning in regard to where they direct their resources. For example, based on the findings of the United
Kingdom’s Department for International Development (DFID) Multilateral Aid Review, DFID will focus on working
with what the Review considered to be the most effective international organisations in line with delivering the UK’s
development priorities.
…and providers of South-South co-operation will continue to increase available resources
Providers of South-South co-operation are the most optimistic about their future resources; with five indicating
increased spending (including two providing significantly more) and four indicating that they will not change the
current level of funding (Figure 2.21). Future areas of focus include regional integration (the most strongly identified
issue), poverty reduction, and private sector development. South-South providers also place importance on the green
growth agenda.
CONCLUSIONS
This chapter has outlined mixed results for aid for trade in 2011. In the context of the economic crisis in many
OECD members, overall aid for trade (scaled up since 2005) has for the most part been maintained. Aid-for-trade
flows declined in 2011, with decreasing support for infrastructure, particularly in Africa. But the flows indicate an
evolution of the aid-for-trade concept towards private sector development and value chain promotion. Consequently,
flows continue to increase to meet trade objectives in agriculture, industry, business services and tourism. While the
aggregate declines are disappointing, the poorest countries are least affected. Donors are facing challenges, but they
must continue to strive to meet their pledges, in particular the G20 countries.
Beyond 2012, the DAC Forward Spending Plans indicate that a moderate recovery in aid levels is expected in
2013. However, such forecasts did not predict the declines which subsequently materialised in 2011 and 2012.
Of course, trade-related support is provided by many donors beyond the DAC, including multilateral institutions, Arab
donors, and providers of South-South trade-related co-operation, for which the outlook is more positive. South-South
trade-related co-operation is significant and increasing. The Fourth Global Review will also explore ways in which the
private sector can further bolster value chains and trade capacity building efforts. Aid for trade has therefore passed
the additionality test; it continues to evolve; and, based on the available evidence, the increased support provided in
recent years is likely to be sustained.

84 AID FOR TRADE AT A GLANCE 2013: CONNECTING TO VALUE CHAINS - © OECD, WTO 2013
CHAPTER 2: AID-FOR-TRADE FLOWS AND FINANCING
NOTES
1. Australia; Austria; Belgium; Canada; Czech Republic; Denmark; European Union; Finland; France; Germany;
Greece; Iceland; Ireland; Italy; Japan; Luxembourg; Netherlands; New Zealand; Norway; Portugal; South Korea;
Spain; Sweden; Switzerland; United Kingdom; United States.
2. The G7 consists of Canada, France, Germany, Italy, Japan, the United Kingdom and the United States.
3. The goal of the Challenge is to solicit innovative and scalable proposals from the private sector to identify
ways that governments and public institutions can be more effective in catalysing private finance for SMEs in
developing countries. Canada supported this initiative with USD 20 million in 2011. Canada, Korea, the United
States and the Inter-American Development Bank (IDB) have agreed to launch an SME Finance Innovation Fund
and have committed a total of USD 528 million to support the fund.
See: www.changemakers.com/g20media/pressrelease11-12-10.
4. Global monitoring of aid-for-trade flows is based on proxies derived from categories of assistance reported to
the OECD Creditor Reporting System. India has communicated that, based on its national definition of aid for
trade, the amount received in 2010 was USD 1.38 billion, lower than the figures derived using CRS proxies.
5. This project is due to be completed later in 2013.
See: www.railjournal.com/index.php/signalling/istanbuls-bosphorus-rail-link-to-open-next-year.html.
6. www.jica.go.jp/english/news/press/2011/pdf/111102_04.pdf.
7. www.jica.go.jp/balkan/english/office/topics/press111123.html.
8. The Ford Foundation is supporting additional country studies in Russia and the United States. The project is
expected to provide the basis for more rational debate on the issue of media piracy and give Southern actors
greater leverage in North-South trade negotiations over access to knowledge goods, especially software.
9. Almost one-third of aid for trade facilitation (USD 125 million) was delivered through multilateral institutions
in 2011. The most important channels for support were the World Bank Group, the WTO, UN agencies and
regional development banks. For example, Australia and other donors provided funding through the Asian
Development Bank in support of “Trade and Transport Facilitation in the Greater Mekong Sub-region (GMS)”.
The project aims to address the most significant constraints to efficient cross-border trade in the Mekong sub-
region. Aid for trade facilitation has also involved interesting collaborations between partner countries and
donors. While the Caribbean has not traditionally been a major aid-for-trade recipient, the EU provided USD 32
million to the Dominican Republic and USD 26 million to Haiti in a programme to expand the Dajabon market
on the border between these countries through the construction of additional infrastructure for Dominican
and Haitian customs.
10. Economic Partnership Agreements are a scheme to create a free trade area (FTA) between the EU and the
African, Caribbean and Pacific Group of States (ACP).
11. http://ec.europa.eu/europeaid/documents/aap/2011/af_aap_2011_sugar_jam.pdf.
12. The Regional Indicative Strategic Development Plan (RISDP) is a comprehensive development and
implementation framework guiding the Regional Integration agenda of the Southern African Development
Community over a period of 15 years (2005-20). It is designed to provide clear strategic direction with respect
to SADC programmes, projects and activities in line with the SADC Common Agenda and strategic priorities, as
enshrined in the SADC Treaty of 1992.

85AID FOR TRADE AT A GLANCE 2013: CONNECTING TO VALUE CHAINS - © OECD, WTO 2013
CHAPTER 2: AID-FOR-TRADE FLOWS AND FINANCING
13. DAC member countries disbursed over USD 40 billion to multilateral agencies in 2011. The United Kingdom
was the largest donor to multilaterals at USD 5.4 billion, followed by Germany (USD 5.4 billion), France (USD
4.5 billion), Japan (USD 4.2 billion) and the United States (USD 3.7 billion). The EU was the largest beneficiary of
DAC multilateral contributions at USD 13.1 billion in 2011, followed by the World Bank Group at USD 10.7 billion.
Disbursements to Regional Development Banks amounted to USD 4 billion. The African Development Bank
received just over USD 2 billion, while Japan disbursed half of its total DAC contribution of USD 1.6 billion to the
Asian Development Bank. UN agencies received disbursements of USD 6.5 billion, led by the UN Development
Programme (UNDP) (USD 1 billion), the UN Children’s Fund (UNICEF) (USD 685 million) and the UN High
Commissioner for Refugees (UNHCR) (USD 450 million). Support to other multilateral institutions (including the
Global Fund and the GAVI Alliance) from the DAC countries amounted to USD 5.6 billion.

86 AID FOR TRADE AT A GLANCE 2013: CONNECTING TO VALUE CHAINS - © OECD, WTO 2013
CHAPTER 2: AID-FOR-TRADE FLOWS AND FINANCING
REFERENCES
Agrawal, S. (2007), Emerging Donors in International Development Assistance: The India Case, International Development
Research Center, Ottawa, www.idrc.ca/EN/Documents/Case-of-India.pdf.
Basnett, Y., J. Engel, J. Kennan, C. Kingombe, I. Massa and D.W. Te Velde (2012), Increasing the effectiveness of Aid for
Trade: The circumstances under which it works best, Overseas Development Institute (ODI), Working Paper 353,
London, www.odi.org.uk/sites/odi.org.uk/files/odi-assets/publications-opinion-files/7793.pdf.
Bhinda, N. and M. Martin (2009), Private Capital Flows to Low-Income Countries: Dealing with Boom and Bust, Foreign
Private Capital Capacity Building Programme (FPC CBP), Debt Relief International Ltd, London.
Buys, P., U. Deichmann and D. Wheeler (2006), Road Network Upgrading and Overland Trade Expansion in Sub-Saharan
Africa, World Bank, Washington, D.C., http://elibrary.worldbank.org/content/workingpaper/10.1596/1813-9450-4097.
EC (European Commission) (2011), Increasing the Impact of EU Development Policy: An Agenda for Change, EC, Brussels,
http://ec.europa.eu/europeaid/what/development-policies/documents/agenda_for_change_en.pdf.
GOI (Government of India) (2012), India’s Statement, 23rd Session on Aid for Trade of the Committee on Trade and
Development, 29 March 2012, WTO, Geneva.
Hayashikawa, M. (2012), Trade-Related South-South Co-Operation: China, COM/DCD/TAD(2012)9, OECD, Paris,
www.oecd.org/dac/aft/South-South_China.pdf.
Helble, M., C. Mann and J. Wilson (2012), Aid-for-trade facilitation, Review of World Economics, Vol. 148(2), 357-376.
OECD (2010a), Measuring Aid to Agriculture, OECD, Paris, www.oecd.org/dac/stats/44116307.pdf.
OECD (2010b), Perspectives on Global Development 2010: Shifting Wealth, OECD, Paris, http://dx.doi.org/10.1787/9789264084728-en.
OECD (2011), Strengthening Accountability in Aid for Trade, The Development Dimension, OECD, Paris,
http://dx.doi.org/10.1787/9789264123212-en.
OECD (2012), 2012 DAC Report on Aid Predictability: Survey on Donors’ Forward Spending Plans 2012-2015 and efforts since
HLF-4, OECD, Paris, www.oecd.org/dac/aid-architecture/2012_DAC_Report_on_Aid_Predictability.pdf.
OECD (2013), 2012 DAC Report on Multilateral Aid 2012, DCD/DAC(2012)33, OECD, Paris.
OECD/IPRCC (International Poverty Reduction Center in China) (2010), Agricultural Transformation, Growth and Poverty
Reduction, China-DAC Study Group, OECD, Paris, www.oecd.org/dac/povertyreduction/46767135.pdf.
Page, S. (2011), The achievements and risks of Aid for Trade, Trade Negotiations Insights, Vol. 10(7), International Centre
for Trade and Sustainable Development (ICTSD), Geneva.
PRC (People’s Republic of China) (2011), China’s Foreign Aid, Information Office of the State Council, Beijing.
Shepherd, B. and J.S. Wilson (2008), Trade Facilitation in ASEAN Member Countries: Measuring Progress and Assessing
Priorities, Policy Research Working Paper 4615, World Bank Development Research Group Trade Team,
Washington, D.C., https://openknowledge.worldbank.org/bitstream/handle/10986/6715/wps4615.pdf?sequence=1.
UN (United Nations) (2011), The State of South-South Co-operation: Report of the Secretary-General, A/66/229, New York,
http://ssc.undp.org/content/dam/ssc/documents/SG%20Reports/SG%20Report%20on%20SSC%202011.pdf.
UNCTAD Stat, http://unctadstat.unctad.org/ReportFolders/reportFolders.aspx.

87AID FOR TRADE AT A GLANCE 2013: CONNECTING TO VALUE CHAINS - © OECD, WTO 2013
CHAPTER 2: AID-FOR-TRADE FLOWS AND FINANCING
WTO (World Trade Organization) (2006), Recommendations of the Task Force on Aid for Trade, WT/AFT/1, WTO, Geneva,
www.wto.org/english/tratop_e/devel_e/a4t_e/implementing_par57_e.htm.
WTO (2010), China, Report by the Secretariat, Trade Policy Review, WT/TPR/S/230/Rev.1, WTO, Geneva.
Zimmermann, F. and K. Smith (2011), More Actors, More Money, More Ideas for International Development Co-operation,
Journal of International Development, Vol. 23(5), pp 722-738.


