Embed Size (px)
Citation preview

Chapter 17: Macroeconomics in an OpenEconomy
Yulei Luo
SEF of HKU
April 16, 2012

Learning Objectives
1. Explain how the balance of payments is calculated.
2. Explain how exchange rates are determined and how changesin exchange rates affect the prices of imports and exports.
3. Explain the saving and investment equation in an openeconomy.
4. Explain the effect of a government budget deficit oninvestment in an open economy.
5. Discuss the difference between the effectiveness of monetaryand fiscal policy in an open economy and in a closed economy.

The Balance of Payments
I Closed economy: An economy that has no interactions intrade or finance with other economies.
I Open economy: An economy that has interactions in trade orfinance with other economies. Consumers, firms, and investorsroutinely interact with consumers, firms, and investors inother economies.
I Balance of payments (BOP): The record of a country’s tradewith other countries in G&S and assets. It is the best way tounderstand the interactions bw two countries.
I BOPs include: Current account, financial account, and capitalaccount.
The Current Account
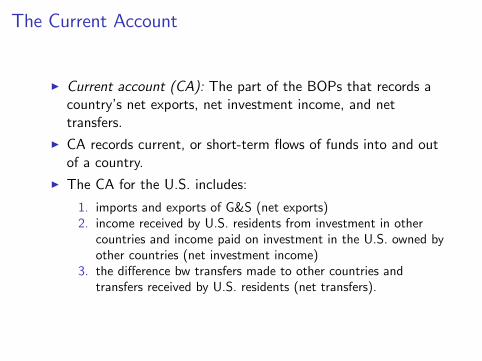
I Current account (CA): The part of the BOPs that records acountry’s net exports, net investment income, and nettransfers.
I CA records current, or short-term flows of funds into and outof a country.
I The CA for the U.S. includes:
1. imports and exports of G&S (net exports)2. income received by U.S. residents from investment in othercountries and income paid on investment in the U.S. owned byother countries (net investment income)
3. the difference bw transfers made to other countries andtransfers received by U.S. residents (net transfers).

Balance of Trade
I BOT is the largest part of the CA and is the difference bw.the value of the goods a country exports and the value of thegoods a country imports.
I If a country exports more than (less than) its imports, it has atrade surplus (trade deficit).
I Net Exports equals the sum of the balance of trade and thebalance of services.
I In 2008, the U.S. had a TD of about $700.

The Financial Account
I Financial account (FA): The part of the balance of paymentsthat records purchases of assets a country has made abroadand foreign purchases of assets in the country.
I The FA records long-term flows of funds into and out of acountry.
I Capital outflow: A home country investor buys a bond issuedby a foreign company or gov. (foreign portfolio investment) orwhen a firm builds a factory in a foreign country (foreigndirect investment).
I Capital inflow: A foreign investor buys a bond issued by ahome company or gov. or when a foreign firm builds a factoryin a home country.
I Net foreign investment: The difference between capitaloutflows from a country and capital inflows, also equal to netforeign direct investment plus net foreign portfolio investment.

I (Cont.) Net capital flows: Another way of thinking of thebalance of the FA. The difference bw capital inflows andcapital outflows
I Net foreign investment: The difference between capitaloutflows (An investor buys a bond issued by a foreigncompany or gov. or when a firm builds a factory in a foreigncountry) from a country and capital inflows, also equal to netforeign direct investment plus net foreign portfolio investment.
I Net capital flows and net foreign investment are always equalbut have opposite signs.

The Capital Account
I Capital Account: The part of the BOPs that records relativelyminor transactions, such as migrants’transfers, and sales andpurchases of nonproduced, nonfinancial assets.
I A nonproduced, nonfinancial asset is a copI yright, patent, trademark, or right to natural resources.I Note that the capital account prior to 1999 recorded all thetransactions included now in both the FA and the capitalaccount.
I Today the capital account is so small, so for simplicity we willignore it in our discussion.

7 of 36Copyright © 2010 Pearson Education, Inc. · Macroeconomics · R. Glenn Hubbard, Anthony Patrick O’Brien, 3e.
Cha
pter
17:
Mac
roec
onom
ics
in a
n O
pen
Econ
omy
The Balance of Payments: Linking the United States to the International Economy
Table 17-1The Balance of Payments of the United States, 2008 (billions of dollars)
The Current Account
Explain how the balance of payments is calculated.
17.1 LEARNING OBJECTIVE

8 of 36Copyright © 2010 Pearson Education, Inc. · Macroeconomics · R. Glenn Hubbard, Anthony Patrick O’Brien, 3e.
Cha
pter
17:
Mac
roec
onom
ics
in a
n O
pen
Econ
omy
The Balance of Payments: Linking the United States to the International Economy
Net Exports Equals the Sum of the Balance of Trade and the Balance of Services
The Current Account
Explain how the balance of payments is calculated.
17.1 LEARNING OBJECTIVE
The balance of services is the difference between the value of the services a country exports and the value of the services a country imports. Notice that, technically, net exports is not equal to the current account balance because the current account balance also includes net income on investments and net transfers. But these other two items are relatively small.

9 of 36Copyright © 2010 Pearson Education, Inc. · Macroeconomics · R. Glenn Hubbard, Anthony Patrick O’Brien, 3e.
Cha
pter
17:
Mac
roec
onom
ics
in a
n O
pen
Econ
omy
The Current Account
Figure 17-1Trade Flows for the United States and Japan, 2008Panel (a) shows that in 2008, the United States ran a trade deficit with all its major trading partners and with every region of the world. Panel (b) shows that Japan ran trade deficits with China, the Middle East, and Africa, and it ran trade surpluses with other regions. In each panel, the green arrows represent exports from the United States or Japan, and the red arrows represent imports.
The Balance of Payments: Linking the United States to the International Economy
Explain how the balance of payments is calculated.
17.1 LEARNING OBJECTIVE

Why Is the Balance of Payments Always Zero?
I BOP is always 0 because the sum of the CA balance and thefinancial account balance must equal zero.
I Consider the following case, in 2008, the U.S. had a CA deficitof $706 billion. What happened to that $706 billion? Everydollar of $706 billion must be either added to foreign holdingsof dollars or used by foreign agents to invest in the U.S.
I Note that there is nowhere else for the dollars to go: Sincethey weren’t spent on U.S. G&S (otherwise, they would haveshown up in the CA), they must have been spent oninvestment in the U.S. or not spent at all.
I Foreign investment and foreign holdings of dollars bothincrease the U.S. FA balance. Therefore, a CA deficit must beexactly offset by a FA surplus, leaving the BOP equal to zero.
I If they cannot be offset, there must have some measurementerrors because some transactions must not have beenaccounted for. Need the statistical discrepancy be included inthe BOP.

13 of 36Copyright © 2010 Pearson Education, Inc. · Macroeconomics · R. Glenn Hubbard, Anthony Patrick O’Brien, 3e.
Cha
pter
17:
Mac
roec
onom
ics
in a
n O
pen
Econ
omy
Solved Problem 17-1Understanding the Arithmetic of Open Economies
Test your understanding of the relationship between the current account and the financial account by evaluating the following assertion by a political commentator:
“The industrial countries are committing economic suicide. Every year, they invest more and more in developing countries. Every year, more U.S., Japanese, and European manufacturing firms move their factories to developing countries. With extensive new factories and low wages, developing countries now export far more to the industrial countries than they import.”
YOUR TURN: For more practice, do related problems 1.7 , 1.8 and 1.9 at the end of this chapter.
Explain how the balance of payments is calculated.
17.1 LEARNING OBJECTIVE
The Foreign Exchange Market and Exchange Rates
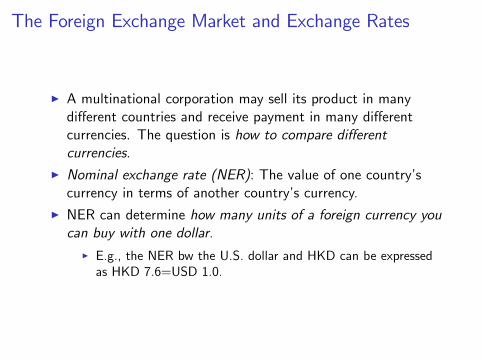
I A multinational corporation may sell its product in manydifferent countries and receive payment in many differentcurrencies. The question is how to compare differentcurrencies.
I Nominal exchange rate (NER): The value of one country’scurrency in terms of another country’s currency.
I NER can determine how many units of a foreign currency youcan buy with one dollar.
I E.g., the NER bw the U.S. dollar and HKD can be expressedas HKD 7.6=USD 1.0.
15 of 36Copyright © 2010 Pearson Education, Inc. · Macroeconomics · R. Glenn Hubbard, Anthony Patrick O’Brien, 3e.
Cha
pter
17:
Mac
roec
onom
ics
in a
n O
pen
Econ
omy
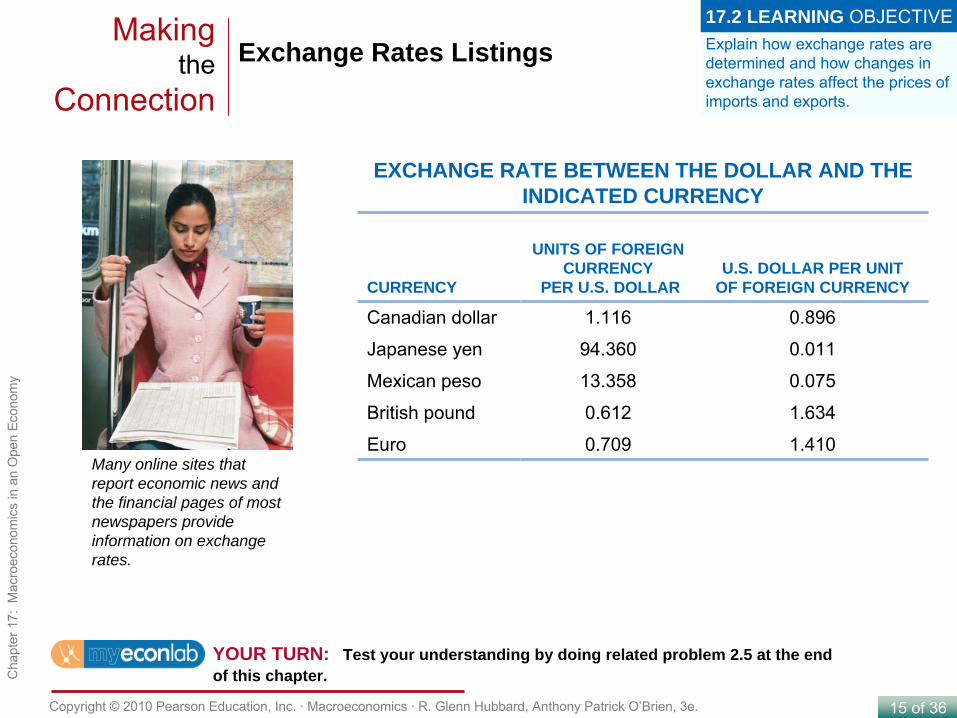
Exchange Rates Listings
EXCHANGE RATE BETWEEN THE DOLLAR AND THE INDICATED CURRENCY
CURRENCY
UNITS OF FOREIGN CURRENCY
PER U.S. DOLLARU.S. DOLLAR PER UNIT
OF FOREIGN CURRENCY
Canadian dollar 1.116 0.896
Japanese yen 94.360 0.011
Mexican peso 13.358 0.075
British pound 0.612 1.634
Euro 0.709 1.410
Making the
Connection
Many online sites that report economic news and the financial pages of most newspapers provide information on exchange rates.
YOUR TURN: Test your understanding by doing related problem 2.5 at the end of this chapter.
Explain how exchange rates are determined and how changes in exchange rates affect the prices of imports and exports.
17.2 LEARNING OBJECTIVE

Equilibrium in the Market for Foreign Exchange
I Banks are the most active participants in the FEX market.Businesses and individuals usually obtain foreign currencyfrom banks in their own countries.
I The market Foreign ER is determined by the interaction ofdemand and supply. There are three sources of foreigncurrency demand for the U.S. dollar:
1. Foreign firms and households who want to buy goods andservices produced in the U.S.
2. Foreign firms and households who want to invest in the U.S.either through foreign direct investment– buying or buildingfactories or other facilities in the U.S.– or through foreignportfolio investment– buying stocks and bonds issued in theUnited States.
3. Currency traders who believe that the value of the dollar in thefuture will be greater than its value today.

17 of 36Copyright © 2010 Pearson Education, Inc. · Macroeconomics · R. Glenn Hubbard, Anthony Patrick O’Brien, 3e.
Cha
pter
17:
Mac
roec
onom
ics
in a
n O
pen
Econ
omy
The Foreign Exchange Market and Exchange RatesEquilibrium in the Market for Foreign Exchange
Figure 17-2Equilibrium in the Foreign Exchange MarketWhen the exchange rate is ¥150 to the dollar, it is above its equilibrium level, and there will be a surplus of dollars. When the exchange rate is ¥100 to the dollar, it is below its equilibrium level, and there will be a shortage of dollars. At an exchange rate of ¥120 to the dollar, the foreign exchange market is in equilibrium.
Explain how exchange rates are determined and how changes in exchange rates affect the prices of imports and exports.
17.2 LEARNING OBJECTIVE

I (Cont.) Currency appreciation An increase in the market valueof one currency relative to another currency.
I Currency depreciation A decrease in the market value of onecurrency relative to another currency.

How Do Shifts in Demand and Supply Affect the ExchangeRate?
I Three main factors cause the demand and supply curves in theFEX market to shift:
1. Changes in the demand for U.S.-produced goods and servicesand changes in the demand for foreign-produced goods andservices
2. Changes in the desire to invest in the United States andchanges in the desire to invest in foreign countries
3. Changes in the expectations of currency traders about thelikely future value of the dollar and the likely future value offoreign currencies
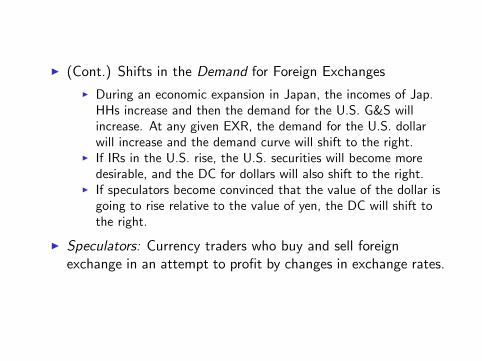
I (Cont.) Shifts in the Demand for Foreign ExchangesI During an economic expansion in Japan, the incomes of Jap.HHs increase and then the demand for the U.S. G&S willincrease. At any given EXR, the demand for the U.S. dollarwill increase and the demand curve will shift to the right.
I If IRs in the U.S. rise, the U.S. securities will become moredesirable, and the DC for dollars will also shift to the right.
I If speculators become convinced that the value of the dollar isgoing to rise relative to the value of yen, the DC will shift tothe right.
I Speculators: Currency traders who buy and sell foreignexchange in an attempt to profit by changes in exchange rates.

I (Cont.) Shifts in the Supply for Foreign ExchangesI An expansion in the U.S. increases the incomes of U.S. HHsand increases their demand for G&S, including G&S made inJapan. Consequently, U.S. agents must supply dollars i.e.f.yen, which causes the supply curve for dollars to shift to theright.
I An increase in IR in Japan will make financial investments inJapan more attractive, which also shift the SD to the rightbecause more yen need more yen.
I Finally, if speculators believe that the value of the yen will behigher relative to the dollar in the future, the SD will also shiftto the right.
I Adjustment to a New Equilibrium: The factors that affect thedemand and supply for currencies are constantly changing.Whether the EXR increases or decreases depends on thedirection and size of the shifts in the demand curve andsupply curve.
22 of 36Copyright © 2010 Pearson Education, Inc. · Macroeconomics · R. Glenn Hubbard, Anthony Patrick O’Brien, 3e.
Cha
pter
17:
Mac
roec
onom
ics
in a
n O
pen
Econ
omy
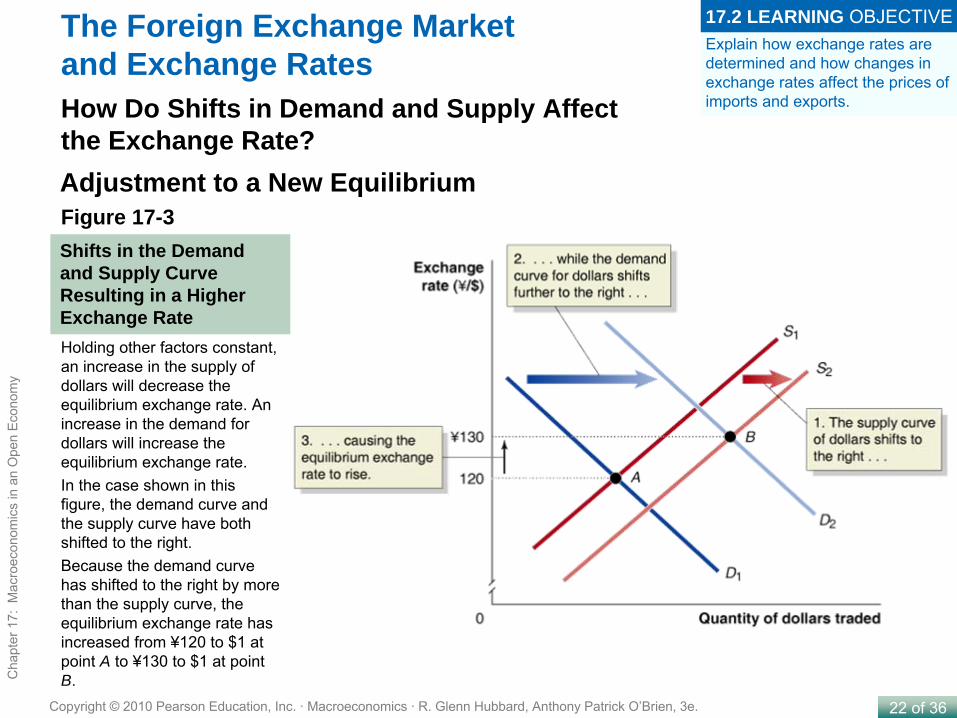
How Do Shifts in Demand and Supply Affect the Exchange Rate?Adjustment to a New EquilibriumFigure 17-3Shifts in the Demand and Supply Curve Resulting in a Higher Exchange Rate
The Foreign Exchange Market and Exchange Rates
Holding other factors constant, an increase in the supply of dollars will decrease the equilibrium exchange rate. An increase in the demand for dollars will increase the equilibrium exchange rate. In the case shown in this figure, the demand curve and the supply curve have both shifted to the right. Because the demand curve has shifted to the right by more than the supply curve, the equilibrium exchange rate has increased from ¥120 to $1 at point A to ¥130 to $1 at point B.
Explain how exchange rates are determined and how changes in exchange rates affect the prices of imports and exports.
17.2 LEARNING OBJECTIVE

23 of 36Copyright © 2010 Pearson Education, Inc. · Macroeconomics · R. Glenn Hubbard, Anthony Patrick O’Brien, 3e.
Cha
pter
17:
Mac
roec
onom
ics
in a
n O
pen
Econ
omy
What Explains the Fall and Rise and Fall of the Dollar?
Making the
Connection
YOUR TURN: Test your understanding by doing related problems 2.12 and 2.13 at the end of this chapter.
Explain how exchange rates are determined and how changes in exchange rates affect the prices of imports and exports.
17.2 LEARNING OBJECTIVE
Low U.S. interest rates have played a role in the declining value of the dollar. Second, many investors and some central banks became convinced that the value of the dollar was too high in 2002 and that it was likely to decline in the future.

I Some ERs Are Not Determined by the MarketI Some currencies have fixed ERs that don’t change over longperiods. E.g., China fixed the EXR to 8.28 yuan per dollar formore than 10 years; Argentina fixed the EXR before the bankpanic.
I How Movements in the ER Affect Exports and ImportsI If the economy is currently below potential GDP, then, holdingall other factors constant, a depreciation in the domesticcurrency should increase net exports, AD, and real GDP.
I An appreciation in the domestic currency should have theopposite effect: Exports should fall, and imports should rise,which will reduce net exports, AD, and real GDP.

25 of 36Copyright © 2010 Pearson Education, Inc. · Macroeconomics · R. Glenn Hubbard, Anthony Patrick O’Brien, 3e.
Cha
pter
17:
Mac
roec
onom
ics
in a
n O
pen
Econ
omy
Solved Problem 17-2Using Exchange Rates
Explain how exchange rates are determined and how changes in exchange rates affect the prices of imports and exports.
17.2 LEARNING OBJECTIVE
YOUR TURN: For more practice, do related problem 2.9 at the end of this chapter.
Calculate the price of the bottle of California wine in the euro area, using the current exchange rate.
Calculate the price of the bottle of French wine in the United States using the current exchange rate.

The Real Exchange Rate
I The relative prices of each country’s goods determines thelevel of a country’s exports to and imports from anothercountries.
I The relative prices are determined by two factors that can becombined to determine the real EXR:
1. The relative price levels in two countries.2. The nominal EXR
I Real exchange rate The price of domestic goods in terms offoreign goods. They are reported as index numbers with oneyear chosen as the base year.
RER = NER × domestic price levelforeign price level
. (1)

27 of 36Copyright © 2010 Pearson Education, Inc. · Macroeconomics · R. Glenn Hubbard, Anthony Patrick O’Brien, 3e.
Cha
pter
17:
Mac
roec
onom
ics
in a
n O
pen
Econ
omy
The International Sector and National Saving and Investment
Figure 17-4U.S. Imports and Exports, 1970–2008
Explain the saving and investment equation.
17.3 LEARNING OBJECTIVE
Imports and exports are much larger fractions of GDP today than they were before 1970. Imports have increased faster than exports, which has made net exports negative every year since 1975.

Domestic Saving, DI, and Net FI
I In the U.S., net FI is negative nearly every year, DI (I) mustbe greater than national saving (S).
I In China and Japan, saving has been well above domesticinvestment, which means that it runs high levels of Net FI.

28 of 36Copyright © 2010 Pearson Education, Inc. · Macroeconomics · R. Glenn Hubbard, Anthony Patrick O’Brien, 3e.
Cha
pter
17:
Mac
roec
onom
ics
in a
n O
pen
Econ
omy
The International Sector and National Saving and InvestmentNet Exports Equal Net Foreign Investment
Current account balance + Financial account balance = 0
or:
Current account balance = -Financial account balance
or:
Net exports = Net foreign investment
Explain the saving and investment equation.
17.3 LEARNING OBJECTIVE

29 of 36Copyright © 2010 Pearson Education, Inc. · Macroeconomics · R. Glenn Hubbard, Anthony Patrick O’Brien, 3e.
Cha
pter
17:
Mac
roec
onom
ics
in a
n O
pen
Econ
omy
The International Sector and National Saving and InvestmentDomestic Saving, Domestic Investment, and Net Foreign Investment
National saving = Private saving + Public saving
S = Sprivate
+ Spublic
Private saving = National income –
Consumption -
TaxesSprivate
= Y – C – T
Government saving = Taxes –
Government spendingSpublic
= T – G
Explain the saving and investment equation.
17.3 LEARNING OBJECTIVE

30 of 36Copyright © 2010 Pearson Education, Inc. · Macroeconomics · R. Glenn Hubbard, Anthony Patrick O’Brien, 3e.
Cha
pter
17:
Mac
roec
onom
ics
in a
n O
pen
Econ
omy
The International Sector and National Saving and Investment
Saving and investment equation An equation that shows that national saving is equal to domestic investment plus net foreign investment.
Remember the basic macroeconomic equation for GDP or national income:
Y = C + I + G + NX
National saving = Domestic investment + Net foreign investment
S = I + NFI
Explain the saving and investment equation.
17.3 LEARNING OBJECTIVE
Domestic Saving, Domestic Investment, and Net Foreign Investment
The Effect of a Government Budget Deficit on Investment
I When the gov runs a budget deficit, national saving willdecline (unless private saving increases the same amount),thereby reducing either DI or net FI. The mechanism is asfollow:
1. The U.S. treasury must raise an amount of deficit by sellingbonds. To attract investors, they must have to increase the IRson their bonds. As a result, other IRs will also increase.
2. Higher IRs will reduce DI and attract foreign investors to investmore in U.S. assets. This greater demand for dollars willincrease its value and then reduce net exports as well as net FI.
I When a gov BD leads to a decline in net exports, the result isreferred to as the twin deficits (BD and CA deficit).

I (Cont.) Many economists believe that the CA deficits of1980s were closely related to the federal BDs.
I As the BD narrowed in the mid-1990s and disappeared in thelate 1990s, the large CA deficits continued because foreigninvestors continued in investing in the U.S. despite low IRs.The reasons are:
1. Some countries suffered severe economic problems (SouthKorea, Russia, etc.), many investors sold their investmentsthere and bought investments in the U.S.
2. The strong performance of the U.S. stock market alsoattracted many investors.
3. The sharp decline in private saving in U.S. during the late1990s also contributed to the large CA deficit.
I This can be seen as a vote of confidence in the strength of theU.S. economy. The large negative net FI help U.S. maintainthe high levels of DI required for EG.

31 of 36Copyright © 2010 Pearson Education, Inc. · Macroeconomics · R. Glenn Hubbard, Anthony Patrick O’Brien, 3e.
Cha
pter
17:
Mac
roec
onom
ics
in a
n O
pen
Econ
omy
The Effect of a Government Budget Deficit on Investment
Figure 17-5The Twin Deficits, 1978–2008
Explain the effect of a government budget deficit on investment in an open economy.
17.4 LEARNING OBJECTIVE
During the early 1980s, large federal budget deficits occurred at the same time as large current account deficits, but twin deficits did not occur in the 1990s.

32 of 36Copyright © 2010 Pearson Education, Inc. · Macroeconomics · R. Glenn Hubbard, Anthony Patrick O’Brien, 3e.
Cha
pter
17:
Mac
roec
onom
ics
in a
n O
pen
Econ
omy
Why Is the United States Called the “World’s Largest Debtor”?
Making the
Connection
Large current account deficits have resulted in foreign investors purchasing large amounts of U.S. assets.
YOUR TURN: Test your understanding by doing related problem 4.6 at the end of this chapter.
Explain the effect of a government budget deficit on investment in an open economy.
17.4 LEARNING OBJECTIVE

Monetary Policy in an Open Economy
I When the Fed uses the expansionary MP to stimulate theopen economy (lower the IR and increase AD), lower IRs willalso affect the ER bw the dollar and other currencies:
I Lower IRs will make investors switch from investing in U.S.assets to investing in foreign assets, thereby reducing thedemand for the dollar, the value of it, and then increase thenet exports. Hence, the MP can increase AD by increasing netexports.
I Similarly, contractionary MP can reduce AD by reducing netexports.
I MP has a larger impact on AD in an open economy than in aclosed economy.

34 of 36Copyright © 2010 Pearson Education, Inc. · Macroeconomics · R. Glenn Hubbard, Anthony Patrick O’Brien, 3e.
Cha
pter
17:
Mac
roec
onom
ics
in a
n O
pen
Econ
omy
Solved Problem 17-5Monetary and Fiscal Policy in a Recession
Discuss the difference between the effectiveness of monetary and fiscal policy in an open economy and in a closed economy.
17.5 LEARNING OBJECTIVE
YOUR TURN: For more practice, do related problem 5.7 at the end of this chapter.
To answer the question, think about:
Explaining if the United States had a closed economy, the Federal Reserve would have to lower the federal funds rate by more or less than 50 basis points in order to have the same impact on aggregate demand as in an open economy.
Explaining which value of the MPI an income tax cut would have the greater impact on aggregate demand.

Fiscal Policy in an Open Economy
I An expansionary FP (increase GP or cut taxes) may result inhigher IRs. In an open economy, increasing IRs will alsoincrease the value of the dollar and then reduce net exports,thereby reducing AD. In open economies, expansionary FP isless effective because the crowding out effect may be larger.
I Similarly, a contractionary FP reduces the BD (or increasesBS), which may reduce the IRs. Consequently, in openeconomies, reductions in the IRs increase net exports and thenincrease AD, which offsets the effects of the contractionaryFP.
I FP has a smaller effect on AD in an open economy than in aclosed economy.

Key Terms
I Balance of payments; Balance of tradeI Current account; Capital account; Financial accountI Closed economy; Open economyI Currency appreciation; Currency depreciationI Net foreign investmentI Nominal exchange rate; Real exchange rateI Saving and investment equationI Speculators