Embed Size (px)
Citation preview

PISA FOR DEVELOPMENT TECHNICAL REPORT 1 Chapter 15
Chapter 15: PROFICIENCY SCALE CONSTRUCTION
INTRODUCTION
This chapter discusses the methodology used to develop descriptions of the reporting scales for PISA-D and presents the outcomes of that development process for the three assessed cognitive domains: Mathematics, Reading, and Science. The reporting scale descriptions define the levels of student proficiency based on item characteristics.
In both PISA and PISA-D, the reporting scales are called “proficiency scales” rather than “performance scales” because they describe what students at given levels of proficiency typically know and can do, rather than how individuals who were tested actually performed on a single test administration. This emphasis reflects the primary goal of PISA, which is to report general population-level results rather than the results for individual students.
As explained in earlier chapters of this report, PISA uses samples of students and items to make estimates about populations. A sample of 15-year-old students is selected to represent all 15-year-old students in a country, and a sample of test items from a larger item pool is administered to each student. Results are then analysed using statistical models that estimate the likely proficiency of the population based on this sampling.
The PISA-D test design makes it necessary to use techniques of modern item response modelling (see Chapter 9) to estimate both the ability of all students taking the PISA-D assessment and the statistical characteristics of all cognitive test items. The mathematical model employed to analyse the PISA-D data is implemented through test analysis software that uses iterative procedures to estimate the distribution of students along the proficiency dimension assessed by the test, as well as a mathematical function that describes the association of student proficiency and the likelihood of a correct response for each item on the test.
The result of these procedures is a set of item parameters that represents, among other things, estimated locations of the items on a proficiency continuum reflecting the domain being assessed. On that continuum, it is possible to estimate the distribution of groups of students, and thereby the average (location) and range (variability) of their skills and knowledge within the domain. This continuum represents the overall PISA scale in the relevant test domain of Mathematics, Reading, or Science.
PISA-D assesses students and uses the outcomes of that assessment to produce estimates of students’ proficiency in relation to the skills and knowledge being assessed in each domain. The skills and knowledge of interest, as well as the kinds of tasks that represent those abilities, are described in the PISA-D assessment and analytical framework. For each domain, a scale is defined, ranging from very low levels of proficiency to very high levels. Students whose ability

PISA FOR DEVELOPMENT TECHNICAL REPORT 2 Chapter 15
estimates place them at a certain point on a PISA-D proficiency scale would more likely be able to successfully complete tasks at or below that point. Those students would be increasingly more likely to complete tasks located at progressively lower points on the scale, and increasingly less likely to complete tasks located at progressively higher points on the scale. Figure 15.1 depicts a simplified hypothetical Science proficiency scale, ranging from relatively low levels of Science proficiency at the bottom of the figure to relatively high levels toward the top. Six items of varying difficulty are placed along the scale, as are three students of varying ability. The relationship between the students and items at various levels is described.
Figure 15.1
Simplified relationship between items and students on a proficiency scale
In addition to defining the numerical range of the proficiency scale, it is also possible to define the scale by describing the competencies typical of students at particular points along the scale. The distribution of students along this proficiency scale is estimated, and locations of students can be derived from this distribution and their responses on the test. Those location estimates are then aggregated in various ways to generate and report useful information about the proficiency levels of 15-year-old students within and among participating countries.
The development of a method for describing proficiency in PISA Mathematics, Reading, and

PISA FOR DEVELOPMENT TECHNICAL REPORT 3 Chapter 15
Science occurred in the lead-up to the reporting of outcomes of the PISA 2000 survey and was revised in the lead-up to each of the subsequent PISA surveys from 2003 through 2015. Essentially the same methodology has again been used to revise the proficiency descriptions for PISA-D.
The proficiency descriptions that had been developed for the Science domain in PISA 2015, for the Mathematics domain in PISA 2012, and for Reading in 2009 were used again to report the PISA-D results, but in each of these cases the description of the lower end of the distribution of proficiency was enhanced by using items introduced in the PISA-D design. The PISA-D assessment design made it possible to base this report on significantly more data than had been possible in previous cycles due to the larger number of items included in the domains.
DEVELOPMENT OF THE DESCRIBED SCALES
The revision of the description of the proficiency scales in PISA-D was carried out by the expert groups and the item development team through the process described in the following sections.
Classification of items
As part of the item selection process for PISA-D, test developers and members of the subject matter expert group reviewed the existing content and process classifications of all items based on the specifications provided in the framework for each domain. Classifications were revised as needed for the items selected from other sources.
Defining the overall proficiency scale
As part of its work in developing the PISA-D framework, the expert group reviewed existing descriptors of the proficiency levels for each of the domains based on the knowledge and competency dimensions defined in the corresponding frameworks. These descriptors, presented as an initial hypothesis, were shared as part of the framework to inform item selection and represent the increase in the range of skills and ability reflected across the levels.
Item parameters were estimated for all items in the assessment. Using this information on item performance, the subject matter expert group reviewed each of the items and their coding guides, where applicable, and discussed key characteristics that differentiated performance along the proficiency scale. As part of that review process, the final descriptors for each level in the overall proficiency scale were refined and finalised.
Identifying possible subscales
For each domain in PISA-D, reporting included an overall proficiency scale based on the combined results for all items within that domain. But different from previous PISA cycles, reporting by subscale was not done in PISA-D as the intention was to report with the approximate same precision for each of the three domains while extending the proficiency of the scale toward the lower proficiency levels. Subscale classification of the items was considered, nonetheless, to describe the items in the assessment.

PISA FOR DEVELOPMENT TECHNICAL REPORT 4 Chapter 15
Developing an item map
Based on item performance in the Main Survey, the test items in the study could be ordered from easiest to most difficult and this range of difficulty described using an item map. The item map contains a brief description of a selected number of released items along with their scale values. These descriptions explain the specific skills each item is designed to assess and are linked to the descriptions of performance at each level for the overall scale. As a result, the item map provides some insight into the range of skills and knowledge required of students and the proficiencies they need to demonstrate at various points along the scale.
Defining the proficiency levels
The proficiency levels for each of the PISA domains were originally defined in previous cycles when each was first a major domain, and were later revised when the domain was a major one again. The goal of that process was to decide how to divide the proficiency continuum into levels that might have some utility and, having defined those levels, decide how to assign students to a particular level.
The relationship between the observed responses on the one hand, and student proficiency and item characteristics on the other hand, is probabilistic. That is, there is some probability that a particular student can correctly solve any particular item and each item can be differentially responsive to the proficiency being measured. One of the basic tenets of the measurement of human skills or proficiencies is this: If a student’s proficiency level exceeds the item’s demands, the probability that the student can successfully complete that item is relatively high, and if the student’s proficiency is lower than that required by the item, the probability of success for that student on that item is relatively low. The rate of change of the probability of success across the range of proficiency for each item is also affected by the sensitivity of the item to the proficiency scale.
This leads to the question as to the precise criterion that should be used to locate a student on the same scale as that on which the items are located. How can we assign a location that represents student proficiency in meaningful ways? When placing a student at a particular point on the scale, what probability of success should we deem sufficient in relation to items located at the same point on the scale? If a student were given a test comprising a large number of items, each with the same item characteristics, what proportion of those items would we expect the student to successfully complete? Or, thinking of it in another way, if a large number of students of equal ability were given a single test item with a specified item characteristic, about how many of those students would we expect to successfully complete the item?
The answers to these questions depend on assumptions about how items differ in their characteristics or how items function, as well as on what level of probability is deemed a sufficient probability of success. In order to define and report PISA outcomes in a consistent manner, an approach was needed to defining performance levels and to associating students with those levels. The methodology that was developed and used for previous cycles of PISA has been essentially retained throughout the PISA cycles and PISA-D.

PISA FOR DEVELOPMENT TECHNICAL REPORT 5 Chapter 15
Several principles were considered in developing and establishing a useful meaning of being at a level, and therefore for determining an approach to locating cut-off points between levels and associating students with them. In order for the levels to provide useful information to PISA stakeholders, it is important to develop a common understanding of what performance at each of those levels means.
First, it is important to understand that the skills measured in each PISA domain fall along a continuum: There are no natural breaking points to mark borderlines between stages along this continuum. Dividing the continuum into levels, though useful for communication about students’ development, is essentially arbitrary. Like the definition of units on, for example, a scale of length, there is no fundamental difference between 1 metre and 1.5 metres—it is a matter of degree. It is useful, however, to define stages, or levels along the continua, because they enable us to communicate about the proficiency of students in terms other than continuous numbers. This is a rather common concept, an approach we all know from categorising shoes or shirts in levels of size (S, M, L, XL, etc.). The approach adopted for PISA 2000 was that it would only be useful to regard students as having attained a particular level if it would mean we could have certain expectations about what these students are capable of, in general, when they are said to be at that level. It was thus decided that this expectation would have to mean, at a minimum, that students at a particular level would be more likely than not to successfully complete tasks at that level. By implication, it must be expected that they would succeed on at least half of the items on a test composed of items uniformly spread across that level. This definition of being “at a level” is useful in helping to interpret the proficiency of students at different points across the proficiency range defined at each level.
For example, the expectation is that students located at the bottom of a level would complete at least 50% of tasks correctly on a test set at the level, while students at the middle and top of each level would be expected to achieve a higher success rate. At the top border of a level would be the students who have mastered that level. These students would be likely to solve a high proportion of the tasks at that level. But, being at the top border of that level, they would also be at the bottom border of the next highest level where, according to the reasoning here, they should have at least a 50% likelihood of solving any tasks defined to be at that higher level.
Further, the meaning of being at a level for a given scale should be more or less consistent for each level and, indeed, also for scales from the different domains. In other words, to the extent possible within the substantively based definition and description of levels, cut-off points should create levels of more or less constant breadth. Some small variation may be appropriate, but in order for interpretation and definition of cut-off points and levels to be consistent, the levels have to be about equally broad within each scale. The exception would be the highest and lowest proficiency levels, which are unbounded.
Thus, a more or less consistent approach should be taken to defining levels for the different scales. Their breadth may not be exactly the same for the proficiency scales in different domains, but the same kind of interpretation should be possible for each scale that is developed. This approach links the two variables mentioned in the preceding paragraphs, and a third related
PISA FOR DEVELOPMENT TECHNICAL REPORT 6 Chapter 15
variable. The three variables can be expressed as follows:
the expected success of a student at a particular level on a test containing items at that level (proposed to be set at a minimum that is near 50% for the student at the bottom of the level, and greater for students who are higher in the level);
the width of the levels in that scale (determined largely by substantive considerations of the cognitive demands of items at the level and data related to student performance on the items); and
the probability that a student in the middle of a level would correctly answer an item of average difficulty for that level (in fact, the probability that a student at any particular level would get an item at the same level correct), sometimes referred to as the “RP-value” for the scale, where “RP” indicates “response probability.”
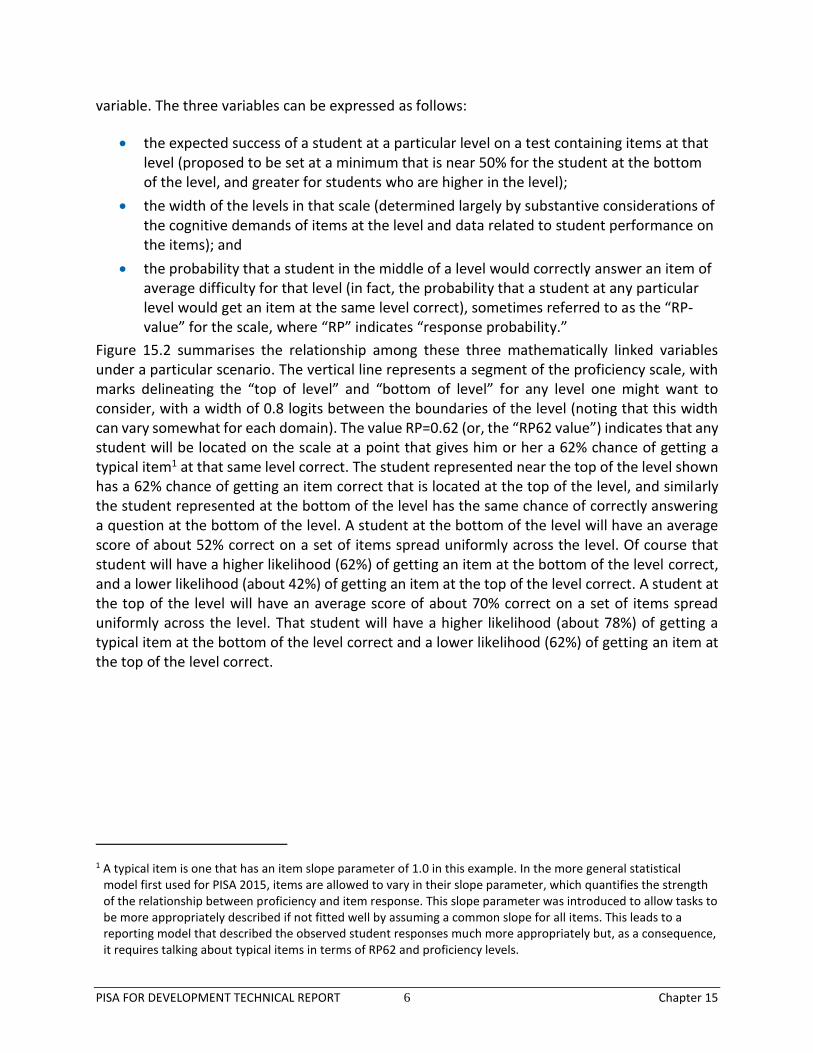
Figure 15.2 summarises the relationship among these three mathematically linked variables under a particular scenario. The vertical line represents a segment of the proficiency scale, with marks delineating the “top of level” and “bottom of level” for any level one might want to consider, with a width of 0.8 logits between the boundaries of the level (noting that this width can vary somewhat for each domain). The value RP=0.62 (or, the “RP62 value”) indicates that any student will be located on the scale at a point that gives him or her a 62% chance of getting a typical item1 at that same level correct. The student represented near the top of the level shown has a 62% chance of getting an item correct that is located at the top of the level, and similarly the student represented at the bottom of the level has the same chance of correctly answering a question at the bottom of the level. A student at the bottom of the level will have an average score of about 52% correct on a set of items spread uniformly across the level. Of course that student will have a higher likelihood (62%) of getting an item at the bottom of the level correct, and a lower likelihood (about 42%) of getting an item at the top of the level correct. A student at the top of the level will have an average score of about 70% correct on a set of items spread uniformly across the level. That student will have a higher likelihood (about 78%) of getting a typical item at the bottom of the level correct and a lower likelihood (62%) of getting an item at the top of the level correct.
1 A typical item is one that has an item slope parameter of 1.0 in this example. In the more general statistical model first used for PISA 2015, items are allowed to vary in their slope parameter, which quantifies the strength of the relationship between proficiency and item response. This slope parameter was introduced to allow tasks to be more appropriately described if not fitted well by assuming a common slope for all items. This leads to a reporting model that described the observed student responses much more appropriately but, as a consequence, it requires talking about typical items in terms of RP62 and proficiency levels.

PISA FOR DEVELOPMENT TECHNICAL REPORT 7 Chapter 15
Figure 15.2
Calculating the RP values used to define PISA proficiency level
Beginning with PISA 2000, the following process was implemented: Start with the range of described abilities for each bounded level in each scale (the desired band breadth), and then determine the highest possible RP value that will be common across domains potentially having bands of slightly differing breadth that would give effect to the broad interpretation of the meaning of being at a level (an expectation of correctly responding to a minimum of 50% of the items in a test comprising items spread uniformly across that level). The RP62 is a probability value that satisfied the logistic equations for typical items in that level through which the scaling model is defined, subject to the two constraints mentioned earlier (a width per level of about 0.8 logits and the expectation that a student would get at least half of the items correct on a hypothetical test composed of items spread evenly across the level). In fact, RP=0.62 satisfied the requirements for any scales having band widths up to about 0.97 logits.
The highest and lowest levels are unbounded. For a certain high point on the scale and below a certain low point, the proficiency descriptions could, arguably, cease to be applicable. At the high end of the scale, this is not such a problem since extremely proficient students could reasonably be assumed to be capable of at least the achievements described for the highest level. At the other end of the scale, however, the same argument does not hold. A lower limit therefore needs to be determined for the lowest described level, below which no meaningful description of proficiency is possible. It was proposed that the floor of the lowest described level be set so that it was the same breadth as the other described levels. Student performance below this level is lower than that which PISA can reliably assess and, more importantly, describe.
PISA FOR DEVELOPMENT TECHNICAL REPORT 8 Chapter 15
The Reading proficiency scale in PISA 2009 included performance bands from Level 1b (the lowest proficiency) to Level 6 (highest proficiency). The Mathematics proficiency scale in PISA 2012 included performance bands from Level 1 (lowest proficiency) through Level 6 (highest proficiency). For PISA 2015, the Science proficiency scale was extended on the lower end to include Level 1b (previously below Level 1) through Level 6 (highest proficiency). As PISA-D countries were predicted to produce lower overall proficiency scores than existing PISA countries, the PISA-D framework further extended the lower end of the proficiency scales for all domains, introducing a proficiency level of 1c for Reading and Science, and both 1b and 1c for Mathematics (the Level 1 band was renamed as Level 1a).
REPORTING THE RESULTS FOR THE PISA-D DOMAINS
In this section, the way in which levels of proficiency are defined, described, and reported will be discussed. The levels will be illustrated using a subset of released items from previous PISA cycles.
In May 2018, expert groups in each of the domains reviewed the existing PISA-D framework and item maps, refined the descriptors, and revisited the examples used for each level. Example items in the framework come from released items from previous cycles of PISA. For the Science and Reading domains, the item maps were expanded to include a Level 1c (below 1b) based on the RP62 levels for the PISA-D Main Survey; a Level 1b and Level 1c were added to the Mathematics item map. In all three domains, the summary descriptions, example items, and levels assigned to existing items were reviewed and updated as necessary. The proposed level descriptors and examples were also based on the RP62 levels of the items from the PISA-D Main Survey.
Building an item map for Science
The data from the PISA-D Science assessment were analysed to estimate a set of item characteristics for the items included in the Main Survey.2 During the process of item development, each item was classified to reflect the scientific competency and type of knowledge it required. In addition, items were classified based on specific content knowledge, or systems (physical systems, living systems, or earth and space systems), as well as their context (personal, local/national, or global). Following data analysis, the items were associated with their difficulty estimates and framework classifications.
Table 15.1 shows the item map, which includes this information along with a brief qualitative description for the released items from the PISA 2015 test. Each row in Table 15.1 represents an individual item. The selected items have been ordered according to their difficulty, with the most difficult at the top and the least difficult at the bottom. The difficulty estimate for each item is given, along with the associated classifications and descriptions.
When an item map such as this is prepared, it becomes possible to look for factors that are associated with item difficulty. This can be done by referring to the ways in which science proficiency is associated with questions located at different points ranging from the bottom to
2 For a detailed description of the scaling procedures used in PISA-D, see Chapter 9 of this report.

PISA FOR DEVELOPMENT TECHNICAL REPORT 9 Chapter 15
the top of the scale. For example, the item map in Table 15.1 shows that the easiest items tend to require the application of everyday content knowledge and the ability to recognise aspects of simple scientific phenomena. The most difficult items, by contrast, draw on a range of interrelated scientific ideas and concepts and require the application of sophisticated procedural and epistemic knowledge to offer explanatory hypotheses of novel scientific phenomena, events, and processes.
Table 15.1 A map for selected Science items
Code Item Name Item
Dif
ficu
lty
(RP
=0.6
2)
Item Demands Expla
in P
henom
ena
Evalu
ate
& D
esig
n
Scie
ntific E
nquiry
Inte
rpre
t D
ata
&
Evid
ence
Conte
nt
Pro
cedura
l
Epis
tem
ic
Physic
al
Liv
ing
Eart
h a
nd S
pace
CS601Q01 Sustainable Fish Farming
744 Use multiple sources of information to evaluate a system in an unfamiliar context and the interaction among elements in that system.
CS656Q02 Bird Migration 634 Identify a factor that could result in an inadequate or inaccurate set of data and explain its effect.
CS637Q05 Slope-Face Investigation
593 Draw on epistemic knowledge and use provided data to identify the appropriate conclusion from an experiment using controls and provide a reason that justifies that choice.
CS601Q04 Sustainable Fish Farming
589 Go beyond the provided information to identify a procedure that would meet a specified goal.
CS656Q04 Bird Migration 577 Identify one or more statements supported by information provided in two moderately complex representations of data.
CS637Q01 Slope-Face Investigation
521 Draw on epistemic knowledge to explain why a simple experimental design includes two independent measures of a phenomenon.
CS656Q01 Bird Migration 504 Draw on knowledge of life science to identify an explanation of a familiar phenomenon.
CS641Q01 Meteoroids & Craters
487 Use simple scientific knowledge to identify the effect of Earth’s mass on the speed of objects entering the atmosphere.
CS601Q02 Sustainable Fish Farming
460 Identify one component of a system that will result in a desired outcome, given an explanation of the function performed by each component.
PISA FOR DEVELOPMENT TECHNICAL REPORT 10 Chapter 15
Code Item Name Item
Dif
ficu
lty
(RP
=0.6
2)
Item Demands Expla
in P
henom
ena
Evalu
ate
& D
esig
n
Scie
ntific E
nquiry
Inte
rpre
t D
ata
&
Evid
ence
Conte
nt
Pro
cedura
l
Epis
tem
ic
Physic
al
Liv
ing
Eart
h a
nd S
pace
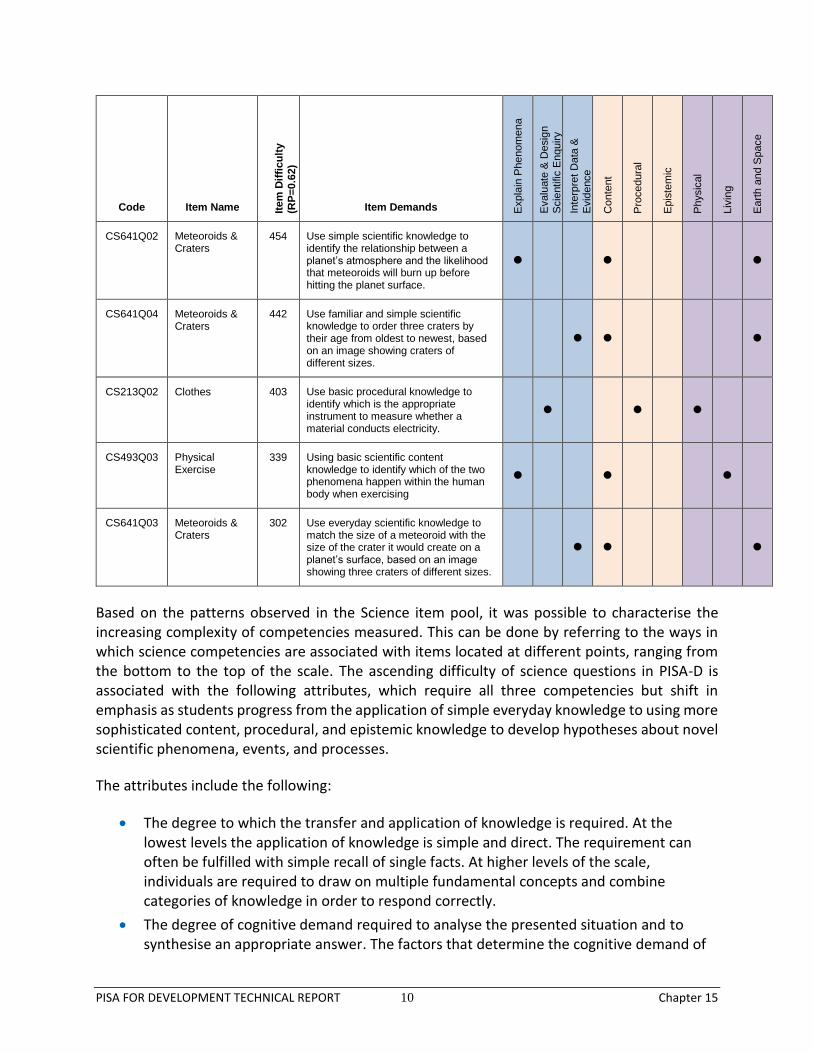
CS641Q02 Meteoroids & Craters
454 Use simple scientific knowledge to identify the relationship between a planet’s atmosphere and the likelihood that meteoroids will burn up before hitting the planet surface.
CS641Q04 Meteoroids & Craters
442 Use familiar and simple scientific knowledge to order three craters by their age from oldest to newest, based on an image showing craters of different sizes.
CS213Q02 Clothes 403 Use basic procedural knowledge to identify which is the appropriate instrument to measure whether a material conducts electricity.
CS493Q03 Physical Exercise
339 Using basic scientific content knowledge to identify which of the two phenomena happen within the human body when exercising
CS641Q03 Meteoroids & Craters
302 Use everyday scientific knowledge to match the size of a meteoroid with the size of the crater it would create on a planet’s surface, based on an image showing three craters of different sizes.
Based on the patterns observed in the Science item pool, it was possible to characterise the increasing complexity of competencies measured. This can be done by referring to the ways in which science competencies are associated with items located at different points, ranging from the bottom to the top of the scale. The ascending difficulty of science questions in PISA-D is associated with the following attributes, which require all three competencies but shift in emphasis as students progress from the application of simple everyday knowledge to using more sophisticated content, procedural, and epistemic knowledge to develop hypotheses about novel scientific phenomena, events, and processes.
The attributes include the following:
The degree to which the transfer and application of knowledge is required. At the lowest levels the application of knowledge is simple and direct. The requirement can often be fulfilled with simple recall of single facts. At higher levels of the scale, individuals are required to draw on multiple fundamental concepts and combine categories of knowledge in order to respond correctly.
The degree of cognitive demand required to analyse the presented situation and to synthesise an appropriate answer. The factors that determine the cognitive demand of
PISA FOR DEVELOPMENT TECHNICAL REPORT 11 Chapter 15
items in Science include: the number of elements of knowledge and their degree of complexity; the level of familiarity and prior knowledge that students may have of the content, procedural, and epistemic knowledge involved; the cognitive operation required by the item (e.g., recall, analysis, evaluation); and the extent to which forming a response is dependent on models or abstract scientific ideas.
The degree of analysis needed to answer a question is also an important driver of difficulty. This includes the demands arising from the requirement to discriminate among issues presented in the situation under analysis, identify the appropriate knowledge domain, and use appropriate evidence for claims or conclusions. The analysis may include the extent to which the scientific demands of the situation are clearly apparent or whether students must differentiate among components of the situation to clarify the scientific issues as opposed to other nonsalient or nonscientific issues.
The degree of synthesis required may impact item complexity. Synthesis may range from a single piece of evidence where no real construction of justification or argument is required to situations requiring students to apply multiple sources of evidence and compare competing lines of evidence and different explanations to adequately argue a position.
Defining levels of science proficiency
The reporting approach used by the OECD has been defined in previous cycles of PISA and is based on the definition of a number of levels of Science proficiency. Descriptions were developed to characterise typical student performance at each level. The levels were used to summarise the performance of students, to compare performances across subgroups of students, and to compare average performances among groups of students, in particular among the students from different participating countries. A similar approach has been used here to analyse and report PISA-D outcomes for Science.
For PISA-D Science, student scores were transformed to the PISA scale, and levels of proficiency on the PISA scale were reviewed and descriptions were refined as necessary. In accordance with the approach taken for the other PISA domains, the Science scale has been extended to describe one level below the lowest previously described level. Thus the PISA-D Science scale has eight described levels instead of the seven defined for PISA 2015. One level was defined below the existing Level 1b, and this was named Level 1c.
The science level definitions on the PISA scale are given in Table 15.2.

PISA FOR DEVELOPMENT TECHNICAL REPORT 12 Chapter 15
Table 15.2 Science performance band definitions on the PISA scale
Level Score points on the PISA scale
6 Higher than 707.93
5 Higher than 633.33 and less than or equal to 707.93
4 Higher than 558.73 and less than or equal to 633.33
3 Higher than 484.14 and less than or equal to 558.73
2 Higher than 409.54 and less than or equal to 484.14
1a Higher than 334.94 and less than or equal to 409.54
1b Higher than 260.543 and less than or equal to 334.94
1c 185.94 to less than or equal to 260.54
Information about the items in each level is used to develop summary descriptions of the kinds of scientific knowledge associated with different levels of proficiency. These summary descriptions can then be used to encapsulate typical science proficiency of students associated with each level.
Table 15.3 Summary descriptions of the eight levels on the Science proficiency scale
Level What students can typically do
6
At Level 6, students can draw on a range of interrelated scientific ideas and concepts from the physical, life, and earth and space sciences and use content, procedural, and epistemic knowledge in order to offer explanatory hypotheses of novel scientific phenomena, events, and processes or to make predictions. In interpreting data and evidence, they are able to discriminate between relevant and irrelevant information and can draw on knowledge external to the normal school curriculum. They can distinguish between arguments that are based on scientific evidence and theory and those based on other considerations. Level 6 students can evaluate competing designs of complex experiments, field studies, or simulations and justify their choices.
5
At Level 5, students can use abstract scientific ideas or concepts to explain unfamiliar and more complex phenomena, events, and processes involving multiple causal links. They are able to apply more sophisticated epistemic knowledge to evaluate alternative experimental designs and justify their choices and use theoretical knowledge to interpret information or make predictions. Level 5 students can evaluate ways of exploring a given question scientifically and identify limitations in interpretations of data sets including sources and the effects of uncertainty in scientific data.
3 Level 1b bandwidth is slightly narrower than others.

PISA FOR DEVELOPMENT TECHNICAL REPORT 13 Chapter 15
Level What students can typically do
4
At Level 4, students can use more complex or more abstract content knowledge, which is either provided or recalled, to construct explanations of more complex or less familiar events and processes. They can conduct experiments involving two or more independent variables in a constrained context. They are able to justify an experimental design, drawing on elements of procedural and epistemic knowledge. Level 4 students can interpret data drawn from a moderately complex data set or less familiar context, draw appropriate conclusions that go beyond the data, and provide justifications for their choices.
3
At Level 3, students can draw upon moderately complex content knowledge to identify or construct explanations of familiar phenomena. In less familiar or more complex situations, they can construct explanations with relevant cueing or support. They can draw on elements of procedural or epistemic knowledge to carry out a simple experiment in a constrained context. Level 3 students are able to distinguish between scientific and nonscientific issues and identify the evidence supporting a scientific claim.
2
At Level 2, students are able to draw on scientific content knowledge or procedural knowledge to identify an appropriate scientific explanation, interpret data, and identify the question being addressed in a simple experimental design. They can use basic or everyday scientific knowledge to identify a valid conclusion from a simple data set. Level 2 students demonstrate basic epistemic knowledge by being able to identify questions that could be investigated scientifically.
1a
At Level 1a, students are able to draw on basic scientific content or procedural knowledge to recognise or identify explanations of simple scientific phenomena presented using scientific language. With support, they can undertake structured scientific enquiries with no more than two variables. They are able to identify simple causal or correlational relationships and interpret graphical and visual data that require a low level of cognitive demand. Level 1a students can select the best scientific explanation for given data in familiar personal, local, and global contexts. When presented with multiple factors of varying complexity requiring a low level of content knowledge or cognitive demand, students can select the best scientific explanations or procedures in a question in most but not all instances.
1b
At Level 1b, students can draw on everyday scientific knowledge to recognise aspects of familiar or simple phenomena presented using minimal scientific language. They are able to identify simple patterns in data, recognise basic scientific terms, identify the real-world features represented by simple models, and follow explicit instructions to carry out a scientific procedure.
1c
At Level 1c, students can recall an element of everyday scientific information or observations of common macroscopic phenomena to identify a correct scientific explanation or conclusion which has been communicated using nontechnical or nonacademic language and supported by illustrations.
Building an item map for Mathematics
The analysis of items, described earlier, was carried out for the Mathematics items. This analysis included judgments about the elements of the PISA-D Mathematics framework that were relevant to each item. Following data analysis, the items and item steps were associated with their difficulty estimates, their framework classifications, and their brief qualitative descriptions.
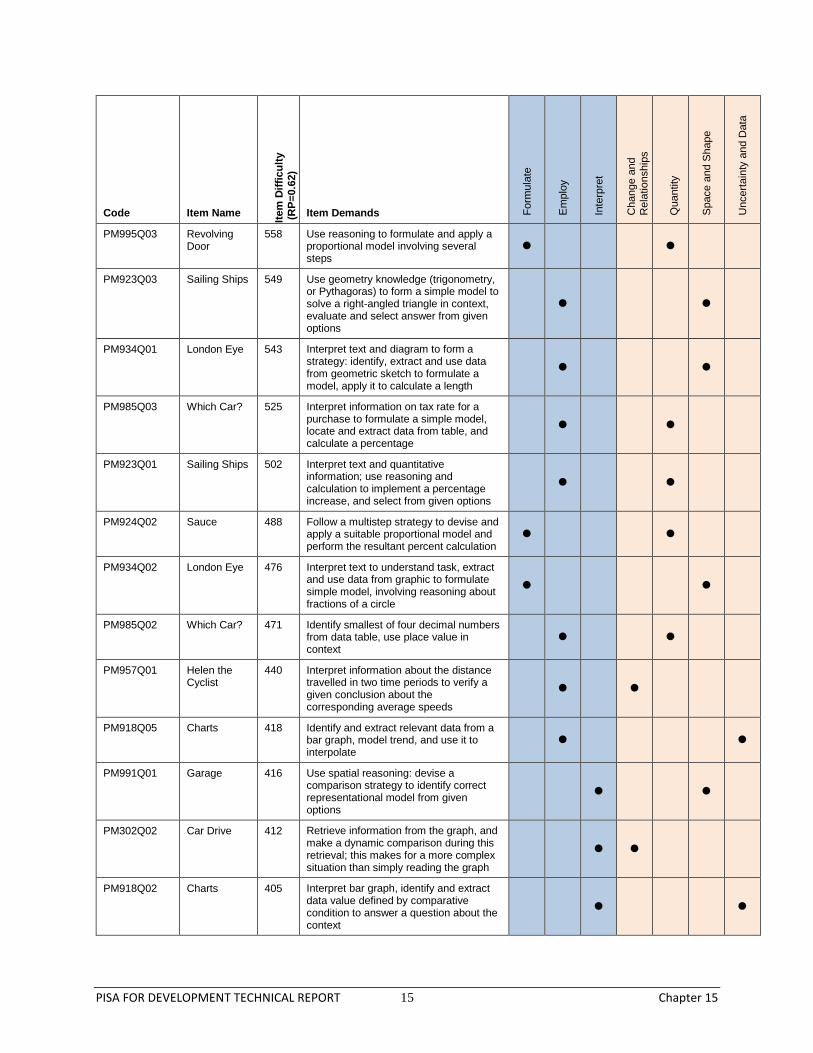
Table 15.4 shows a map of some of this information from a sample of items from previous PISA cycles. Each row in Table 15.4 represents an individual item or item step. The selected items and item steps have been ordered according to their difficulty, with the most difficult of these steps

PISA FOR DEVELOPMENT TECHNICAL REPORT 14 Chapter 15
at the top, and the least difficult at the bottom. The difficulty estimate for each item and step is given in PISA scale units, along with the associated classifications and descriptions.
When a map such as this is prepared using all available items, it becomes possible to look for factors that are associated with item difficulty. This can be done by referring to the ways in which mathematics proficiency is associated with questions located at different points ranging from the bottom to the top of the scale. For example, the item map in Table 15.4 shows that the easiest items tend to involve identifying mathematical information presented in simple representation (e.g., tabular or graphic) and linking that information to some element of the problem context. The most difficult items, by contrast, are based on knowledge of particular mathematical content or procedures, and they involve several steps that require some creativity or strategic control in linking the context to the mathematical representation of aspects of the context, and often substantial mathematical processing or calculation to devise a solution.
Table 15.4 A map for selected Mathematics items
Code Item Name
Item
Dif
ficu
lty
(R
P=
0.6
2)
Item Demands Fo
rmu
late
Em
plo
y
Inte
rpre
t
Change a
nd
Rela
tio
nship
s
Quantity
Space a
nd S
hape
Uncert
ain
ty a
nd D
ata
PM995Q02 Revolving Door
840 Apply knowledge of circle geometry and reasoning to interpret a given geometric model and to formulate it mathematically, enabling a solution
PM923Q04 Sailing Ships 710 Devise and implement a multistep strategy involving significant modelling and extended calculation to formulate then solve a complex real world problem involving fuel costs and volume, and equipment costs
PM957Q03 Helen the Cyclist (E)
696 Interpret information about distance and speed, devise a representation to help formulate a model for average speed, calculate average speed including converting units
PM991Q02 Garage 663 Interpret task demand from text and diagrams, formulate area calculation process from given measurements and specification (correct working and justification)
PM00FQ01 Apartment Purchase
566 Interpret graphic representation, use geometric reasoning to identify relevant dimensions needed to carry out specified area calculation with several components
PM957Q02 Helen the Cyclist
562 Interpret information about distance and speed, devise a simple proportional model to calculate a time corresponding to given distance and average speed
PISA FOR DEVELOPMENT TECHNICAL REPORT 15 Chapter 15
Code Item Name
Item
Dif
ficu
lty
(R
P=
0.6
2)
Item Demands Fo
rmu
late
Em
plo
y
Inte
rpre
t
Change a
nd
Rela
tio
nship
s
Quantity
Space a
nd S
hape
Uncert
ain
ty a
nd D
ata
PM995Q03 Revolving Door
558 Use reasoning to formulate and apply a proportional model involving several steps
PM923Q03 Sailing Ships 549 Use geometry knowledge (trigonometry, or Pythagoras) to form a simple model to solve a right-angled triangle in context, evaluate and select answer from given options
PM934Q01 London Eye 543 Interpret text and diagram to form a strategy: identify, extract and use data from geometric sketch to formulate a model, apply it to calculate a length
PM985Q03 Which Car? 525 Interpret information on tax rate for a purchase to formulate a simple model, locate and extract data from table, and calculate a percentage
PM923Q01 Sailing Ships 502 Interpret text and quantitative information; use reasoning and calculation to implement a percentage increase, and select from given options
PM924Q02 Sauce 488 Follow a multistep strategy to devise and apply a suitable proportional model and perform the resultant percent calculation
PM934Q02 London Eye 476 Interpret text to understand task, extract and use data from graphic to formulate simple model, involving reasoning about fractions of a circle
PM985Q02 Which Car? 471 Identify smallest of four decimal numbers from data table, use place value in context
PM957Q01 Helen the Cyclist
440 Interpret information about the distance travelled in two time periods to verify a given conclusion about the corresponding average speeds
PM918Q05 Charts 418 Identify and extract relevant data from a bar graph, model trend, and use it to interpolate
PM991Q01 Garage 416 Use spatial reasoning: devise a comparison strategy to identify correct representational model from given options
PM302Q02 Car Drive 412 Retrieve information from the graph, and make a dynamic comparison during this retrieval; this makes for a more complex situation than simply reading the graph
PM918Q02 Charts 405 Interpret bar graph, identify and extract data value defined by comparative condition to answer a question about the context

PISA FOR DEVELOPMENT TECHNICAL REPORT 16 Chapter 15
Code Item Name
Item
Dif
ficu
lty
(R
P=
0.6
2)
Item Demands Fo
rmu
late
Em
plo
y
Inte
rpre
t
Change a
nd
Rela
tio
nship
s
Quantity
Space a
nd S
hape
Uncert
ain
ty a
nd D
ata
PM918Q01 Charts 344 Interpret bar graph, identify and extract data value to answer a question about the context
PM985Q01 Which Car? 318 Identify data in a table meeting specifications of simple mathematical relationships
PM302Q01 Car Drive 255 Retrieve the correct information from a graph containing several categories of data
More generally, the difficulty of mathematics questions in PISA-D is associated with a number of item characteristics that can be seen as calling forth varying levels of activation by students of each member of the set of fundamental mathematical capabilities described in the Mathematics framework. That set of capabilities has been useful in exposing the ways in which cognitive demand varies among different items, and has provided a rich means of describing different levels of proficiency.
Mathematical communication involves understanding the stated task objectives and the mathematical language used, and recognising what information is relevant and what is the nature of the response needed; it also may involve the active steps including some or all of presenting the response, solution steps, description of the reasoning used, and justification of the answer provided. Demand for this capability increases according to the complexity of material to be interpreted in understanding the task, the need to link multiple information sources or to move repeatedly among information elements, and with the need to provide a detailed written solution or explanation.
Item complexity and difficulty is also affected by the nature and extent of strategic thinking that is required to progress toward a problem solution. In the simplest problems, the solution path is specified or it is obvious and involves perhaps just a single processing step, while in other problems a solution strategy may involve drawing on several elements of mathematical knowledge, linking them in a particular sequence of related steps, and exercising quite a degree of control to keep sight of the objective and the way the stages of a solution will lead to meeting essential subgoals that will fit together in achieving the overall problem objective.
PISA problems very frequently are set in some context of the kind individuals may encounter in their school, work, or daily life. Contextualised problems may require the student to impose a transformation of information into a suitable mathematical form. This process of mathematisation lies at the heart of the mathematical process referred to as formulating. In the most difficult problems it can involve making simplifying assumptions, identifying relevant variables and devising a suitable way to express them

PISA FOR DEVELOPMENT TECHNICAL REPORT 17 Chapter 15
mathematically, and understanding the relationships between the contextual elements and their mathematical expression. It can also involve forging links between mathematical results or mathematical information and the situation that information is intended to describe. Translating or interpreting mathematical results in relation to specific elements of the problem context, and validating the adequacy of the solution with respect to the context, are also part of this mathematical capability.
A widely recognised element of much mathematical work is the myriad ways in which mathematical information, relationships, and processes can be expressed. Mathematical representations can take the form of equations, graphs, charts, tables, formulae, and so on. These vary in familiarity to students, and in their complexity, and this variation can directly affect the difficulty of tasks that involve the use or construction of mathematical representations. Students may be presented with mathematical representations they must use or process in some way. Or they may be required to create or devise a representation of data, information, or relationships in order to solve a problem. Representations can be simple or more complex. Multiple representations may be involved or required in order to solve a problem, and tasks that involve linking two or more different representations tend to be more difficult.
One of the most important drivers of item difficulty lies in the particular mathematical content knowledge that must be activated to solve problems, such as the number and nature of definitions, facts, rules, algorithms, and procedures, especially the need to understand and manipulate symbolic expressions, formulae, functional relations, or other algebraic expressions, but also the need to perform arithmetic calculations and to understand the formal rules that govern them. A problem that requires counting or adding small integers clearly imposes a different level of cognitive demand compared to an item that requires manipulating and solving an equation or applying the Pythagoras theorem.
Finally, the nature of the reasoning involved in solving a mathematical problem, and the degree to which mathematical argumentation must be understood or applied as part of the solution process contribute in important ways to item difficulty. The nature, number, or complexity of elements that need to be brought together in making inferences, and the length and complexity of the chain of inferences, needed are significant contributors to increased demand for activation of the reasoning and argument competency.
Defining levels of mathematics proficiency
The approach to reporting used by the OECD has been defined in previous cycles of PISA and is based on the definition and description of a number of levels of mathematics proficiency. Descriptions were developed to characterise typical student performance at each level. The levels were used to summarise the performance of students, to compare performances across subgroups of students, and to compare average performances among groups of students, in particular among the students from different participating countries. A similar approach has been used here to analyse and report PISA-D outcomes for Mathematics.

PISA FOR DEVELOPMENT TECHNICAL REPORT 18 Chapter 15
For Mathematics in PISA-D, student scores were transformed to the PISA scale, and levels of proficiency were reviewed and descriptions were refined as necessary. In accordance with the approach taken for the other PISA domains, the Mathematics scale has been extended to describe two levels below the lowest previously described level. Thus the PISA-D Mathematics scale has eight described levels instead of the six defined for PISA 2012. Two levels were defined below the existing Level 1a and were named Levels 1b and 1c.
The Mathematics level definitions on the PISA scale are given in Table 15.5.
Table 15.5 Mathematics performance band definitions on the PISA scale
Level Score points on the PISA scale
6 Higher than 669.30
5 Higher than 606.99 and less than or equal to 669.30
4 Higher than 544.68 and less than or equal to 606.99
3 Higher than 482.38 and less than or equal to 544.68
2 Higher than 420.07 and less than or equal to 482.38
1a Higher than 357.77 and less than or equal to 420.07
1b Higher than 295.47 and less than or equal to 357.77
1c 233.17 to less than or equal to 295.47
The information about the items in each band is used to develop summary descriptions of the kinds of mathematical knowledge and understanding associated with different levels of proficiency. These summary descriptions can then be used to encapsulate typical mathematical proficiency of students associated with each level.

PISA FOR DEVELOPMENT TECHNICAL REPORT 19 Chapter 15
Table 15.6 Summary descriptions of the eight levels on the Mathematics proficiency scale
Level What students can typically do
6 At Level 6, students can conceptualise, generalise, and utilise information based on their investigations and modelling of complex problem situations, and can use their knowledge in relatively nonstandard contexts. They can link different information sources and representations and flexibly translate among them. Students at this level are capable of advanced mathematical thinking and reasoning. These students can apply this insight and understanding, along with a mastery of symbolic and formal mathematical operations and relationships, to develop new approaches and strategies for attacking novel situations. Students at this level can reflect on their actions, and can formulate and precisely communicate their actions and reflections regarding their findings, interpretations, arguments, and the appropriateness of these to the original situation.
5 At Level 5, students can develop and work with models for complex situations, identifying constraints and specifying assumptions. They can select, compare, and evaluate appropriate problem-solving strategies for dealing with complex problems related to these models. Students at this level can work strategically using broad, well-developed thinking and reasoning skills, appropriate linked representations, symbolic and formal characterisations, and insight pertaining to these situations. They begin to reflect on their work and can formulate and communicate their interpretations and reasoning.
4 At Level 4, students can work effectively with explicit models for complex concrete situations that may involve constraints or call for making assumptions. They can select and integrate different representations, including symbolic, linking them directly to aspects of real-world situations. Students at this level can utilise their limited range of skills and can reason with some insight in straightforward contexts. They can construct and communicate explanations and arguments based on their interpretations, arguments, and actions.
3 At Level 3, students can execute clearly described procedures, including those that require sequential decisions. Their interpretations are sufficiently sound to be a base for building a simple model or for selecting and applying simple problem-solving strategies. Students at this level can interpret and use representations based on different information sources and reason directly from them. They typically show some ability to handle percentages, fractions, and decimal numbers, and to work with proportional relationships. Their solutions reflect that they have engaged in basic interpretation and reasoning.
2 At Level 2, students can interpret and recognise situations in contexts that require no more than direct inference. They can extract relevant information from a single source and make use of a single representational mode. Students at this level can employ basic algorithms, formulae, procedures, or conventions to solve problems involving whole numbers. They are capable of making literal interpretations of the results.
1a At Level 1a, students can answer questions involving familiar contexts where all relevant information is present and the questions are clearly defined. They are able to identify information and to carry out routine procedures according to direct instructions in explicit situations. They can perform actions that are almost always obvious and follow immediately from the given stimuli.
1b At Level 1b, students can respond to questions involving easy to understand contexts where all relevant information is clearly given in a simple representation (for example, tabular or graphic) and defined in a short, syntactically simple text. They are able to follow clearly prescribed instructions.
PISA FOR DEVELOPMENT TECHNICAL REPORT 20 Chapter 15
Level What students can typically do
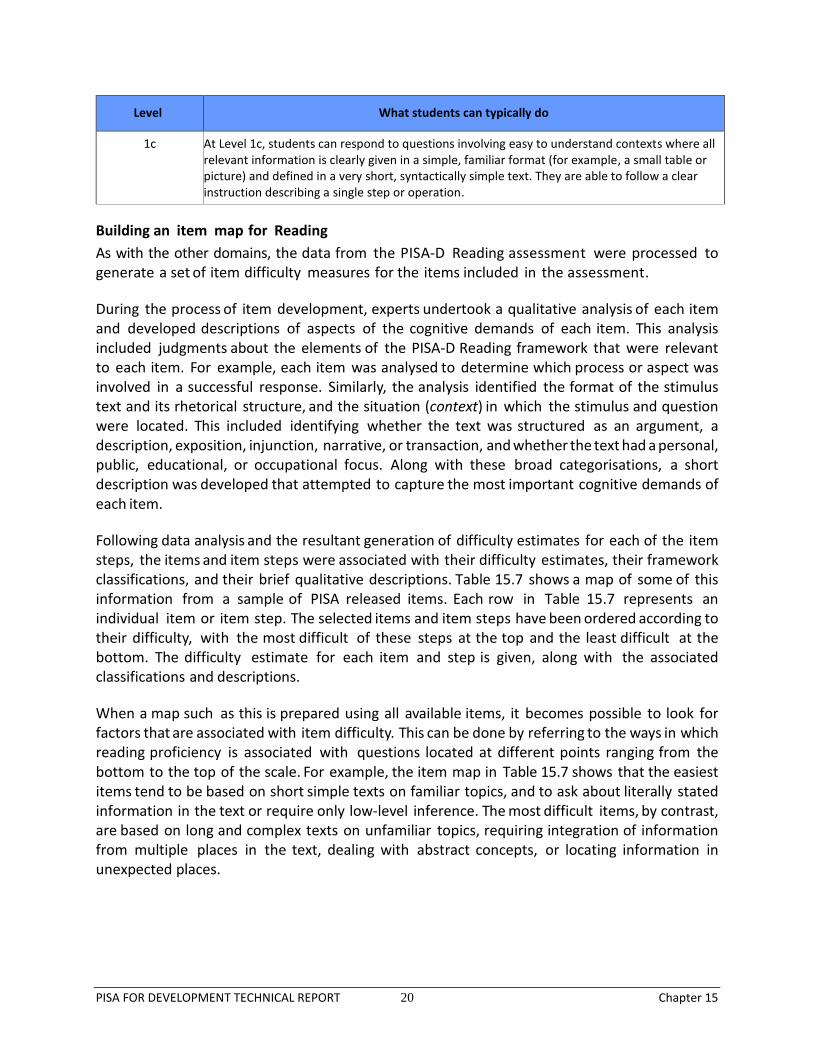
1c At Level 1c, students can respond to questions involving easy to understand contexts where all relevant information is clearly given in a simple, familiar format (for example, a small table or picture) and defined in a very short, syntactically simple text. They are able to follow a clear instruction describing a single step or operation.
Building an item map for Reading
As with the other domains, the data from the PISA-D Reading assessment were processed to generate a set of item difficulty measures for the items included in the assessment.
During the process of item development, experts undertook a qualitative analysis of each item and developed descriptions of aspects of the cognitive demands of each item. This analysis included judgments about the elements of the PISA-D Reading framework that were relevant to each item. For example, each item was analysed to determine which process or aspect was involved in a successful response. Similarly, the analysis identified the format of the stimulus text and its rhetorical structure, and the situation (context) in which the stimulus and question were located. This included identifying whether the text was structured as an argument, a description, exposition, injunction, narrative, or transaction, and whether the text had a personal, public, educational, or occupational focus. Along with these broad categorisations, a short description was developed that attempted to capture the most important cognitive demands of each item.
Following data analysis and the resultant generation of difficulty estimates for each of the item steps, the items and item steps were associated with their difficulty estimates, their framework classifications, and their brief qualitative descriptions. Table 15.7 shows a map of some of this information from a sample of PISA released items. Each row in Table 15.7 represents an individual item or item step. The selected items and item steps have been ordered according to their difficulty, with the most difficult of these steps at the top and the least difficult at the bottom. The difficulty estimate for each item and step is given, along with the associated classifications and descriptions.
When a map such as this is prepared using all available items, it becomes possible to look for factors that are associated with item difficulty. This can be done by referring to the ways in which reading proficiency is associated with questions located at different points ranging from the bottom to the top of the scale. For example, the item map in Table 15.7 shows that the easiest items tend to be based on short simple texts on familiar topics, and to ask about literally stated information in the text or require only low-level inference. The most difficult items, by contrast, are based on long and complex texts on unfamiliar topics, requiring integration of information from multiple places in the text, dealing with abstract concepts, or locating information in unexpected places.

PISA FOR DEVELOPMENT TECHNICAL REPORT 21 Chapter 15
Table 15.7 A map for selected Reading items
Code Item Name
Item
Dif
ficu
lty (
RP
=0.6
2)
Item Demands Contin
uous
Noncontin
uous
Mu
ltip
le
Access a
nd R
etr
ieve
Inte
gra
te a
nd I
nte
rpre
t
Refle
ct and E
valu
ate
Educatio
nal
Occupatio
nal
Pers
onal
Public
R452Q03 The Play’s the Thing
723 Locate a reference to action taking place before the events of a play. The information is explicitly stated but in an unexpected place, in the middle of a lengthy text. Strongly distracting information appears earlier in the text and much more prominently.
R414Q11 Mobile Phone Safety
662 Recognise the relationship between a generalised highly abstract statement external to the text and a pair of statements in a table dealing with contradictory research findings. The topic of the research described is everyday and familiar, but the findings are expressed in academic language.
R417Q03 Balloon 582 Locate two pieces of information in a diagrammatic descriptive text by making a synonymous match between a category provided in the question and instances in the text.
R414Q02 Mobile Phone Safety
566 Recognise the purpose of a section (a table) in an expository text, distinguishing what the content implies from what each part of the section states.
R452Q07 The Play’s the Thing
555 Recognise the conceptual theme of a section of a play. The theme is literary and abstract.
R458Q01 Tele-Commuting
54a5 Recognise the relationship (contrast) between two short argumentative texts dealing with dealing with a part of everyday adult life.
R433Q05 Miser 527 Relate a detail in a very short fable to its main idea.
R458Q07 Tele-Commuting
518 Use prior knowledge to generate an example that fits a category described in a text dealing with a part of everyday adult life, and explain why example fits this category.
R414Q06 Mobile Phone Safety
515 Use prior knowledge to reflect on an abstract category presented in a text and generate a relevant example that would fit the category. The category can only be understood with reference to an adjacent piece of text.

PISA FOR DEVELOPMENT TECHNICAL REPORT 22 Chapter 15
Code Item Name
Item
Dif
ficu
lty (
RP
=0.6
2)
Item Demands Contin
uous
Noncontin
uous
Mu
ltip
le
Access a
nd R
etr
ieve
Inte
gra
te a
nd I
nte
rpre
t
Refle
ct and E
valu
ate
Educatio
nal
Occupatio
nal
Pers
onal
Public
R417Q04 Balloon 508 Identify the purpose of an illustration in a diagrammatic descriptive text explaining details of the personal achievement of an individual. Recognise that the purpose is comparative and provides a frame of reference for the main topic of the text.
R414Q09 Mobile Phone Safety
479 Recognise an assumption in an injunctive section of an expository text dealing with abstract features associated with a familiar object.
R452Q04 The Play’s the Thing
473 Infer the meaning of a sentence (simile) in a play using references to the textual structure described by one of the characters. The relationship described in the simile appears contradictory.
R429Q08 Blood Donation Notice
423 Make links across a short text to reach a conclusion, using conditional information provided in a public notice (advertisement).
R417Q06 Balloon 398 Recognise the purpose of linked illustrations in a diagrammatic descriptive text (emphasis on one feature of the object portrayed).
R403Q04 Brushing your Teeth
381 Recognise the purpose of a simple analogy in a short text describing very familiar everyday experience.
R433Q01 Miser 374 Organise the events in a very short fable into the sequence in which they occur.
R417Q08 Balloon 367 Recognise the main idea of a diagrammatic descriptive text using information explicitly and prominently stated several times at the beginning of the text.
R429Q09 Blood Donation Notice
358 Recognise the persuasive purpose of a phrase in an advertisement dealing with an everyday topic (public health). There is little plausible competing information.
R403Q02 Brushing your Teeth
345 Locate a synonymous match between a term in the question (recommended action) and information in an expository text dealing with a very familiar everyday health topic.
R403Q01 Brushing your Teeth
337 Recognise the main idea of a short expository text dealing with a very familiar everyday topic.

PISA FOR DEVELOPMENT TECHNICAL REPORT 23 Chapter 15
Code Item Name
Item
Dif
ficu
lty (
RP
=0.6
2)
Item Demands Contin
uous
Noncontin
uous
Mu
ltip
le
Access a
nd R
etr
ieve
Inte
gra
te a
nd I
nte
rpre
t
Refle
ct and E
valu
ate
Educatio
nal
Occupatio
nal
Pers
onal
Public
R433Q07 Miser 319 Locate information (an action leading to a specified result) that is explicitly stated in the opening sentence of a short story (a fable).
R403Q03 Brushing your Teeth
296 Locate information (the reason for a very familiar everyday action) explicitly stated in a short expository text.
More generally, the ascending difficulty of Reading questions in PISA-D is associated with the following characteristics, some of which are closely related to features of tasks, some to features of texts, but most to the interaction between these two sets of features:
Number of features and conditions: how many elements the reader needs to locate in the text, or to account for, in order to answer the question. The fewer the features and conditions required, the easier the task.
Proximity of pieces of required information: how close to each other the relevant pieces of information in the text are. The closer to each other the required pieces of information are, the easier the task tends to be.
Extent of competing information: how much information there is in the text that is similar in one or more respects to the target information and therefore likely to be mistakenly identified by the reader as the target information. The more competing information there is in a text, the more difficult the associated task is likely to be.
Prominence of necessary textual information: how easy it is for the reader to locate the information required for the response. Information is more prominent (and therefore easier to find) when it is clearly indicated by headings, or is near the beginning of a text, or is part of a very short text.
Relationship between task and required information: how transparent the task is in relation to the text. The more transparent the relationship, the easier the task is likely to be. If the task’s wording is linguistically complex or requires an inference on the part of the reader to recognise its relationship to the text, the task is likely to be more difficult. Moreover, tasks that require the reader to generate criteria for their response are more difficult than those that provide the reader with explicit directions about the criteria.
Semantic match between task and text: the extent to which tasks use the same word or words from the same lexical field as relevant parts of the text. The closer the lexical match, the easier the task.
Concreteness of information: the kind of information that the reader needs to access. The more abstract the information, the harder the task is likely to be.
PISA FOR DEVELOPMENT TECHNICAL REPORT 24 Chapter 15
Familiarity of information needed to answer the question: how well acquainted the reader is with the content or topic of the task. The more familiar the information, the easier the task.
Register of the text: how formal and syntactically complex the text is. The more personal and idiomatic the text, the easier the task. By contrast, use of lower-frequency words and complex syntactical structures such as passives and nominalisation make a text more formal and more difficult.
Extent to which information from outside the text is required to answer the question: the extent to which the reader needs to draw on prior knowledge. In the sense that active reading requires the reader to construct the text, all texts assume some prior knowledge. Nevertheless some tasks, especially those where students are required to reflect upon and evaluate the text, more explicitly draw on what the reader brings to the text, and by implication tend on average to be more difficult.
Defining levels of reading proficiency
The approach to reporting used by the OECD has been defined in previous cycles of PISA and is based on the definition of a number of levels of reading proficiency. Descriptions were developed to characterise typical student performance at each level. The levels were used to summarise the performance of students, to compare performances across subgroups of students, and to compare average performances among groups of students, in particular among the students from different participating countries. A similar approach has been used here to analyse and report PISA-D outcomes for Reading.
For Reading in PISA-D, student scores were transformed to the PISA scale, and levels of proficiency were reviewed and descriptions were refined as necessary. In accordance with the approach taken for the other PISA domains, the Reading scale has been extended to describe one level below the lowest previously described level. Thus the PISA-D Reading scale has eight described levels instead of the seven defined for PISA 2009. One level was defined below the existing Level 1b and was named Level 1c.
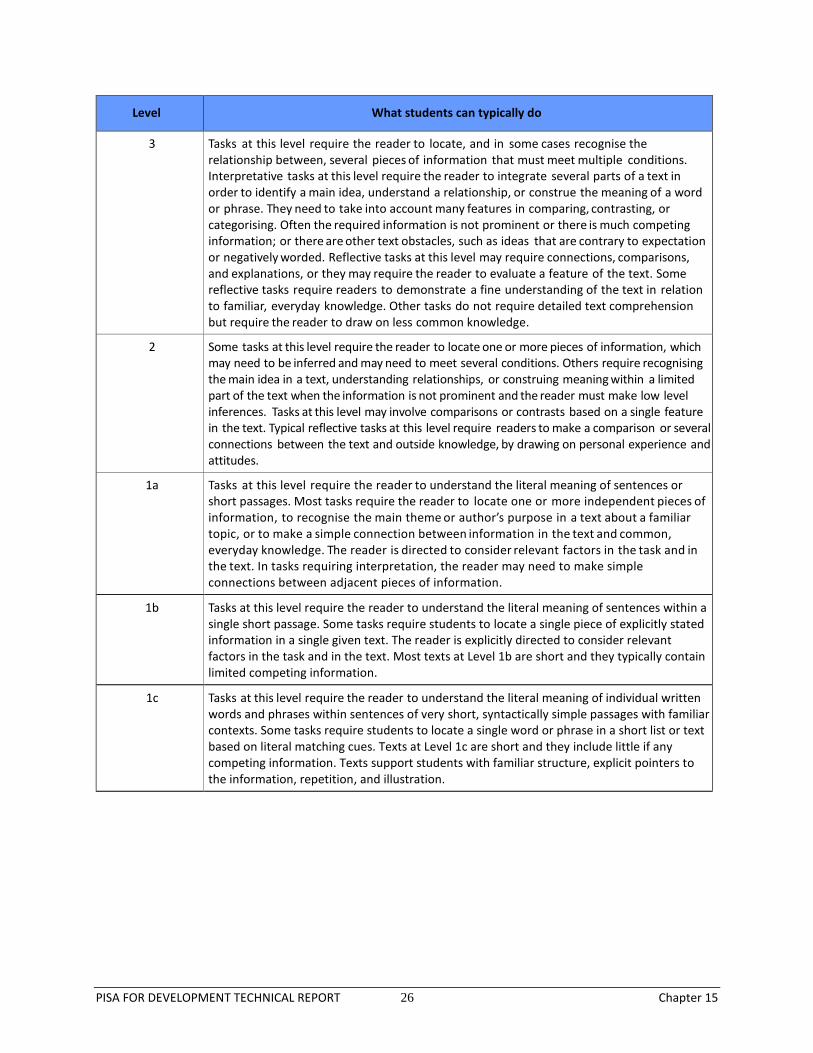
The Reading level definitions on the PISA scale are given in Table 15.8.

PISA FOR DEVELOPMENT TECHNICAL REPORT 25 Chapter 15
Table 15.8 Reading performance band definitions on the PISA scale
Level Score points on the PISA scale
6 Higher than 698.32
5 Higher than 625.61 and less than or equal to 698.32
4 Higher than 552.89 and less than or equal to 625.61
3 Higher than 480.18 and less than or equal to 552.89
2 Higher than 407.47 and less than or equal to 480.18
1a Higher than 334.75 and less than or equal to 407.47
1b Higher than 262.04 and less than or equal to 334.75
1c 189.33 to less than or equal to 262.04
The information about the items in each band is used to develop summary descriptions of the kinds of reading literacy associated with different levels of proficiency. These summary descriptions can then be used to encapsulate typical reading proficiency of students associated with each level.
Table 15.9 Summary descriptions of the eight l evels on the Reading proficiency scale
Level What students can typically do
6 Tasks at this level typically require the reader to make multiple inferences, comparisons, and contrasts that are both detailed and precise. They require demonstration of a full and detailed understanding of one or more texts and may involve integrating information from more than one text. Tasks may require the reader to deal with unfamiliar ideas, in the presence of prominent competing information, and to generate abstract categories for interpretations. Reflect and evaluate tasks may require the reader to hypothesise about or critically evaluate a complex text on an unfamiliar topic, taking into account multiple criteria or perspectives, and applying sophisticated understandings from beyond the text. A salient condition for access and retrieve tasks at this level is precision of analysis and fine attention to detail that is inconspicuous in the texts.
5 Tasks at this level that involve retrieving information require the reader to locate and organise several pieces of deeply embedded information, inferring which information in the text is relevant. Reflective tasks require critical evaluation or hypothesis, drawing on specialised knowledge. Both interpretative and reflective tasks require a full and detailed understanding of a text whose content or form is unfamiliar. For all aspects of reading, tasks at this level typically involve dealing with concepts that are contrary to expectations.
4 Tasks at this level that involve retrieving information require the reader to locate and organise several pieces of embedded information. Some tasks at this level require interpreting the meaning of nuances of language in a section of text by taking into account the text as a whole. Other interpretative tasks require understanding and applying categories in an unfamiliar context. Reflective tasks at this level require readers to use formal or public knowledge to hypothesise about or critically evaluate a text. Readers must demonstrate an accurate understanding of long or complex texts whose content or form may be unfamiliar.
PISA FOR DEVELOPMENT TECHNICAL REPORT 26 Chapter 15
Level What students can typically do
3 Tasks at this level require the reader to locate, and in some cases recognise the relationship between, several pieces of information that must meet multiple conditions. Interpretative tasks at this level require the reader to integrate several parts of a text in order to identify a main idea, understand a relationship, or construe the meaning of a word or phrase. They need to take into account many features in comparing, contrasting, or categorising. Often the required information is not prominent or there is much competing information; or there are other text obstacles, such as ideas that are contrary to expectation or negatively worded. Reflective tasks at this level may require connections, comparisons, and explanations, or they may require the reader to evaluate a feature of the text. Some reflective tasks require readers to demonstrate a fine understanding of the text in relation to familiar, everyday knowledge. Other tasks do not require detailed text comprehension but require the reader to draw on less common knowledge.
2 Some tasks at this level require the reader to locate one or more pieces of information, which may need to be inferred and may need to meet several conditions. Others require recognising the main idea in a text, understanding relationships, or construing meaning within a limited part of the text when the information is not prominent and the reader must make low level inferences. Tasks at this level may involve comparisons or contrasts based on a single feature in the text. Typical reflective tasks at this level require readers to make a comparison or several connections between the text and outside knowledge, by drawing on personal experience and attitudes.
1a Tasks at this level require the reader to understand the literal meaning of sentences or short passages. Most tasks require the reader to locate one or more independent pieces of information, to recognise the main theme or author’s purpose in a text about a familiar topic, or to make a simple connection between information in the text and common, everyday knowledge. The reader is directed to consider relevant factors in the task and in the text. In tasks requiring interpretation, the reader may need to make simple connections between adjacent pieces of information.
1b Tasks at this level require the reader to understand the literal meaning of sentences within a single short passage. Some tasks require students to locate a single piece of explicitly stated information in a single given text. The reader is explicitly directed to consider relevant factors in the task and in the text. Most texts at Level 1b are short and they typically contain limited competing information.
1c Tasks at this level require the reader to understand the literal meaning of individual written words and phrases within sentences of very short, syntactically simple passages with familiar contexts. Some tasks require students to locate a single word or phrase in a short list or text based on literal matching cues. Texts at Level 1c are short and they include little if any competing information. Texts support students with familiar structure, explicit pointers to the information, repetition, and illustration.