Embed Size (px)
Citation preview

Chapter 12
Multiple Access
12.1 Copyright © The McGraw-Hill Companies, Inc. Permission required for reproduction or display.

Figure 12.1 Data link layer divided into two functionality-oriented sublayers
12.2

Figure 12.2 Taxonomy of multiple-access protocols discussed in this chapter
12.3

1212--1 1 RANDOM ACCESSRANDOM ACCESS
InIn randomrandom accessaccess oror contentioncontention methods,methods, nono stationstation isissuperiorsuperior toto anotheranother stationstation andand nonenone isis assignedassigned thethecontrolcontrol overover anotheranother.. NoNo stationstation permits,permits, oror doesdoes notnotpermit,permit, anotheranother stationstation toto sendsend.. AtAt eacheach instance,instance, aastationstation thatthat hashas datadata toto sendsend usesuses aa procedureprocedure defineddefinedbb hh ll kk d i id i i h hh hbyby thethe protocolprotocol toto makemake aa decisiondecision onon whetherwhether oror notnot totosendsend..
ALOHATopics discussed in this section:Topics discussed in this section:
Carrier Sense Multiple AccessCarrier Sense Multiple Access with Collision DetectionC i S M lti l A ith C lli i A id
12.4
Carrier Sense Multiple Access with Collision Avoidance

Figure 12.3 Frames in a pure ALOHA network
12.5

Figure 12.4 Procedure for pure ALOHA protocol
12.6

Example 12.1
The stations on a wireless ALOHA network are amaximum of 600 km apart. If we assume that signalspropagate at 3 × 10⁸ m/s, we find
(6 5 ) ( 8 )Tp = (600 × 105 ) / (3 × 10⁸ ) = 2 ms.Now we can find the value of TB for different values ofK .
F K 1 h i {0 1} Th i d |a. For K = 1, the range is {0, 1}. The station needs to|generate a random number with a value of 0 or 1. This
h T i i h 0 (0 2) 2 (1 2)means that TB is either 0 ms (0 × 2) or 2 ms (1 × 2),based on the outcome of the random variable.
12.7
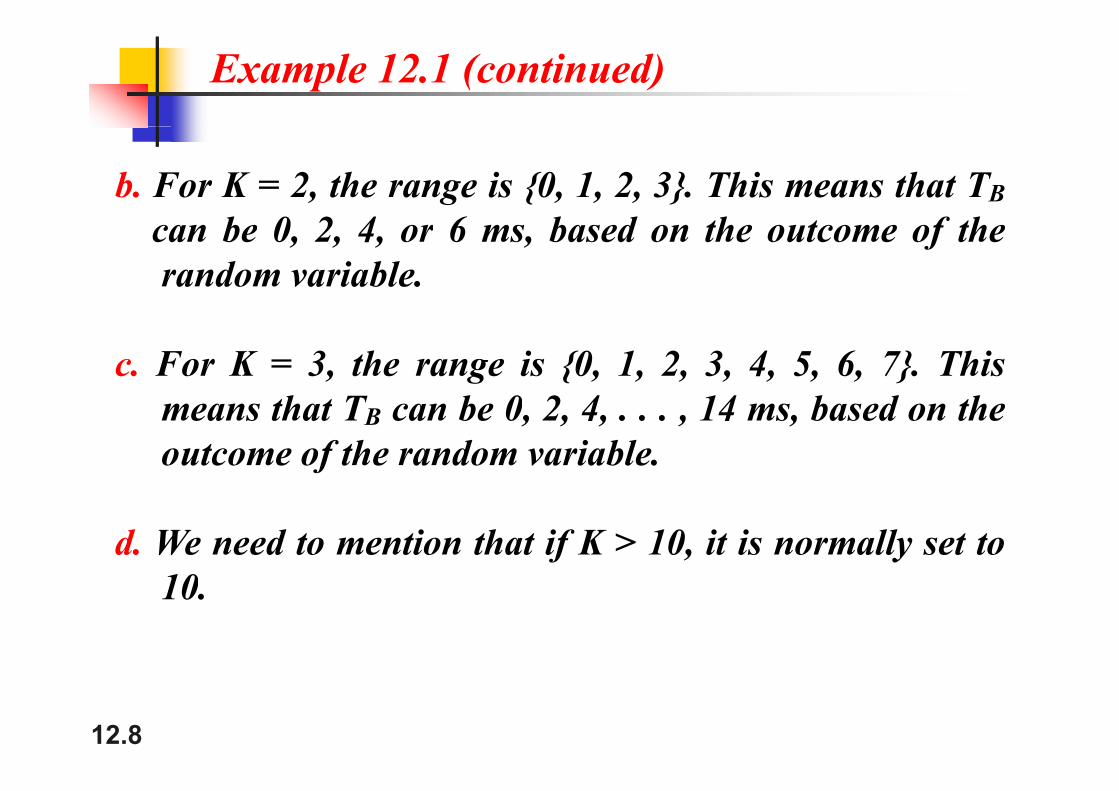
Example 12.1 (continued)
b. For K = 2, the range is {0, 1, 2, 3}. This means that TBcan be 0, 2, 4, or 6 ms, based on the outcome of therandom variable.
c. For K = 3, the range is {0, 1, 2, 3, 4, 5, 6, 7}. Thish b 0 2 4 14 b d hmeans that TB can be 0, 2, 4, . . . , 14 ms, based on the
outcome of the random variable.
d. We need to mention that if K > 10, it is normally set to1010.
12.8

Figure 12.5 Vulnerable time for pure ALOHA protocol
12.9
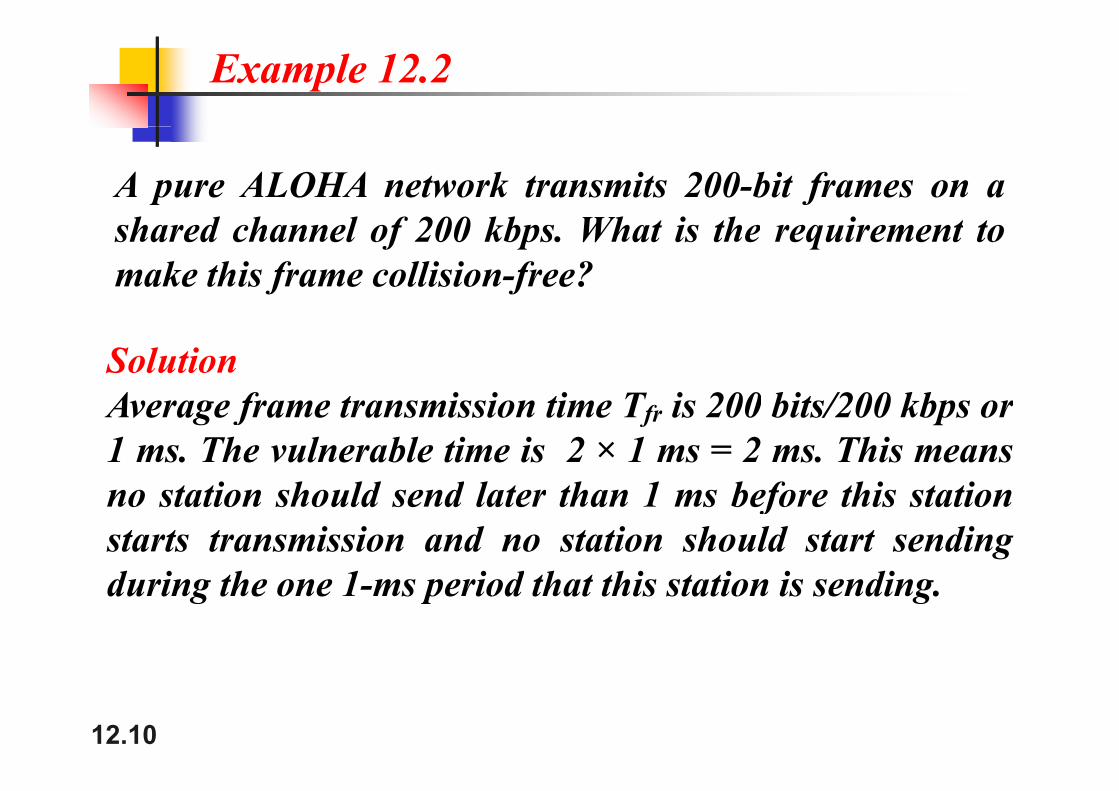
Example 12.2
A pure ALOHA network transmits 200-bit frames on ashared channel of 200 kbps. What is the requirement tomake this frame collision-free?
SolutionA f i i i T i 200 bi /200 kbAverage frame transmission time Tfr is 200 bits/200 kbps or1 ms. The vulnerable time is 2 × 1 ms = 2 ms. This means
t ti h ld d l t th 1 b f thi t tino station should send later than 1 ms before this stationstarts transmission and no station should start sendingd i th 1 i d th t thi t ti i diduring the one 1-ms period that this station is sending.
12.10

Note
The throughput for pure ALOHA is S G 2GS = G × e −2G .
The maximum throughputSmax = 0.184 when G= (1/2).
12.11

Example 12.3
A pure ALOHA network transmits 200-bit frames on ashared channel of 200 kbps. What is the throughput if thef p g p fsystem (all stations together) producesa. 1000 frames per second b. 500 frames per secondf p f pc. 250 frames per second.
SolutionSolutionThe frame transmission time is 200/200 kbps or 1 ms.a If the system creates 1000 frames per second this is 1a. If the system creates 1000 frames per second, this is 1
frame per millisecond. The load is 1. In this caseS = G× e−2 G or S = 0 135 (13 5 percent) This meansS = G× e 2 G or S = 0.135 (13.5 percent). This meansthat the throughput is 1000 × 0.135 = 135 frames. Only135 frames out of 1000 will probably survive
12.12
135 frames out of 1000 will probably survive.

Example 12.3 (continued)
b. If the system creates 500 frames per second, this is(1/2) frame per millisecond. The load is (1/2). In this( ) f p ( )case S = G × e −2G or S = 0.184 (18.4 percent). Thismeans that the throughput is 500 × 0.184 = 92 and thatg ponly 92 frames out of 500 will probably survive. Notethat this is the maximum throughput case,g ppercentagewise.
c. If the system creates 250 frames per second, this is (1/4)frame per millisecond. The load is (1/4). In this casef pS = G × e −2G or S = 0.152 (15.2 percent). This meansthat the throughput is 250 × 0.152 = 38. Only 38
12.13frames out of 250 will probably survive.

Figure 12.6 Frames in a slotted ALOHA network
12.14
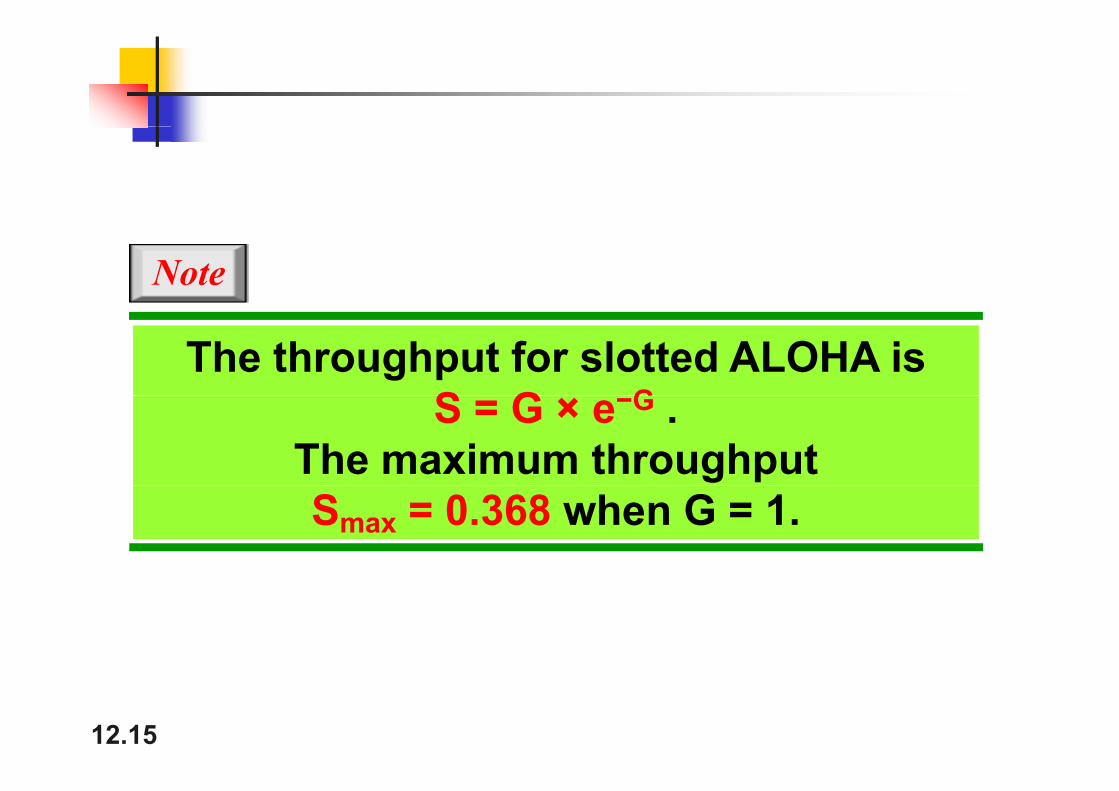
Note
The throughput for slotted ALOHA is S G GS = G × e−G .
The maximum throughput Smax = 0.368 when G = 1.
12.15

Figure 12.7 Vulnerable time for slotted ALOHA protocol
12.16

Example 12.4
A slotted ALOHA network transmits 200-bit frames on ashared channel of 200 kbps. What is the throughput if thef p g p fsystem (all stations together) producesa. 1000 frames per second b. 500 frames per secondf p f pc. 250 frames per second.
SolutionSolutionThe frame transmission time is 200/200 kbps or 1 ms.a If the system creates 1000 frames per second this is 1a. If the system creates 1000 frames per second, this is 1
frame per millisecond. The load is 1. In this caseS = G× e−G or S = 0 368 (36 8 percent) This meansS = G× e G or S = 0.368 (36.8 percent). This meansthat the throughput is 1000 × 0.0368 = 368 frames.Only 386 frames out of 1000 will probably survive
12.17
Only 386 frames out of 1000 will probably survive.

Example 12.4 (continued)
b. If the system creates 500 frames per second, this is(1/2) frame per millisecond. The load is (1/2). In this( ) f p ( )case S = G × e−G or S = 0.303 (30.3 percent). Thismeans that the throughput is 500 × 0.0303 = 151.g pOnly 151 frames out of 500 will probably survive.
c. If the system creates 250 frames per second, this is (1/4)frame per millisecond. The load is (1/4). In this casef pS = G × e −G or S = 0.195 (19.5 percent). This meansthat the throughput is 250 × 0.195 = 49. Only 49g p yframes out of 250 will probably survive.
12.18

Figure 12.8 Space/time model of the collision in CSMA
12.19

Figure 12.9 Vulnerable time in CSMA
12.20

Figure 12.10 Behavior of three persistence methods
12.21

Figure 12.11 Flow diagram for three persistence methods
12.22

Figure 12.12 Collision of the first bit in CSMA/CD
12.23

Figure 12.13 Collision and abortion in CSMA/CD
12.24

Example 12.5
A network using CSMA/CD has a bandwidth of 10 Mbps.If the maximum propagation time (including the delays inIf the maximum propagation time (including the delays inthe devices and ignoring the time needed to send ajamming signal as we see later) is 25 6 μs what is thejamming signal, as we see later) is 25.6 μs, what is theminimum size of the frame?
S l iSolutionThe frame transmission time is Tfr = 2 × Tp = 51.2 μs.Thi i h i d iThis means, in the worst case, a station needs to transmitfor a period of 51.2 μs to detect the collision. The
i i i f h f i 10 Mb 51 2 512minimum size of the frame is 10 Mbps × 51.2 μs = 512bits or 64 bytes. This is actually the minimum size of thef f S d d E h
12.25
frame for Standard Ethernet.

Figure 12.14 Flow diagram for the CSMA/CD
12.26

Figure 12.15 Energy level during transmission, idleness, or collision
12.27
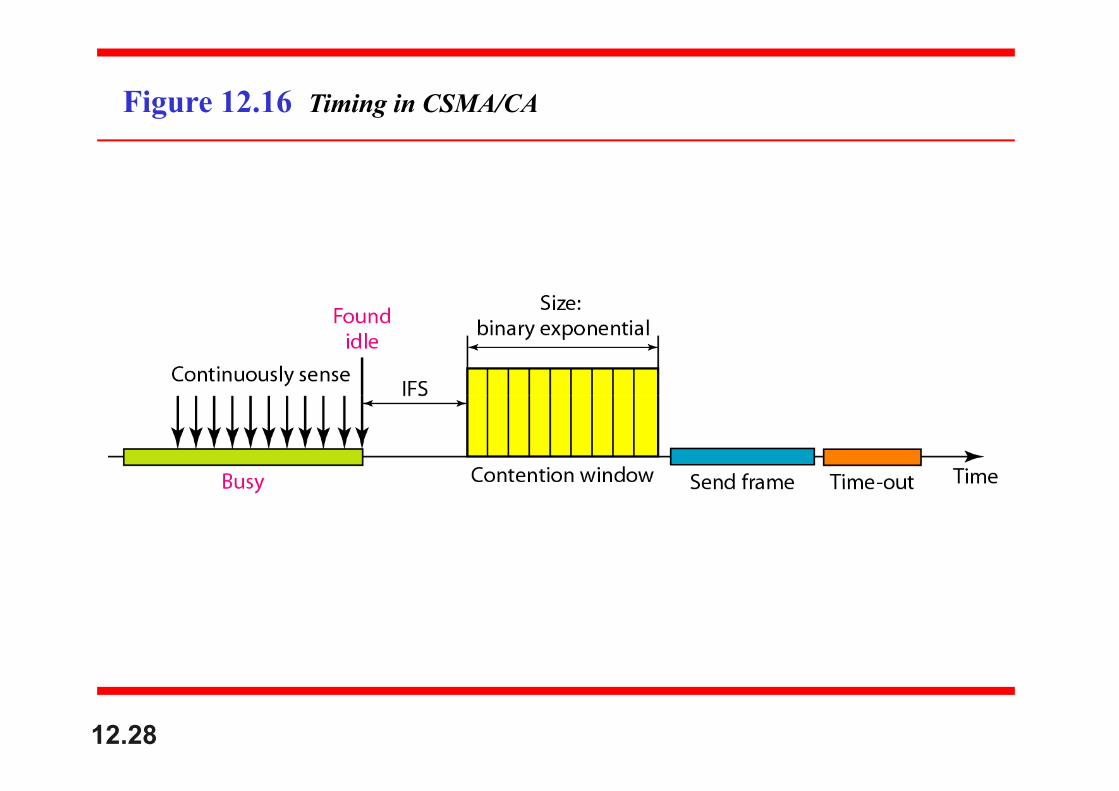
Figure 12.16 Timing in CSMA/CA
12.28

Note
In CSMA/CA, the IFS can also be used to d fi th i it f t ti fdefine the priority of a station or a frame.
12.29

Note
In CSMA/CA, if the station finds the h l b it d t t t thchannel busy, it does not restart the timer of the contention window;
it stops the timer and restarts it when the channel becomes idle.the channel becomes idle.
12.30

Figure 12.17 Flow diagram for CSMA/CA
12.31

1212--2 2 CONTROLLED ACCESSCONTROLLED ACCESS
II t ll dt ll d thth t tit ti ltlt ththInIn controlledcontrolled accessaccess,, thethe stationsstations consultconsult oneone anotheranothertoto findfind whichwhich stationstation hashas thethe rightright toto sendsend.. AA stationstation
tt dd ll itit hh bb th i dth i d bb ththcannotcannot sendsend unlessunless itit hashas beenbeen authorizedauthorized byby otherotherstationsstations.. WeWe discussdiscuss threethree popularpopular controlledcontrolled--accessaccess
th dth dmethodsmethods..
Topics discussed in this section:Topics discussed in this section:ReservationPollingToken Passing
12.32
Token Passing

Figure 12.18 Reservation access method
12.33

Figure 12.19 Select and poll functions in polling access method
12.34

Figure 12.20 Logical ring and physical topology in token-passing access method
12.35
1212--3 3 CHANNELIZATIONCHANNELIZATION
Ch li tiCh li ti ii lti llti l th dth d ii hi hhi hChannelizationChannelization isis aa multiplemultiple--accessaccess methodmethod inin whichwhichthethe availableavailable bandwidthbandwidth ofof aa linklink isis sharedshared inin time,time,ff th hth h dd b tb t diff tdiff t t tit tifrequency,frequency, oror throughthrough code,code, betweenbetween differentdifferent stationsstations..InIn thisthis section,section, wewe discussdiscuss threethree channelizationchannelization
t lt lprotocolsprotocols..
Frequency-Division Multiple Access (FDMA)Topics discussed in this section:Topics discussed in this section:
q y p ( )Time-Division Multiple Access (TDMA)Code-Division Multiple Access (CDMA)
12.36
Note
We see the application of all these th d i Ch t 16 hmethods in Chapter 16 when
we discuss cellular phone systems.
12.37

Figure 12.21 Frequency-division multiple access (FDMA)
12.38
Note
In FDMA, the available bandwidth f th h l i di id d i tof the common channel is divided into bands that are separated by guard
bands.
12.39

Figure 12.22 Time-division multiple access (TDMA)
12.40

Note
In TDMA, the bandwidth is just one h l th t i ti h d b tchannel that is timeshared between
different stations.
12.41

Note
In CDMA, one channel carries all t i i i lt ltransmissions simultaneously.
12.42

Figure 12.23 Simple idea of communication with code
12.43

Figure 12.24 Chip sequences
12.44

Figure 12.25 Data representation in CDMA
12.45

Figure 12.26 Sharing channel in CDMA
12.46

Figure 12.27 Digital signal created by four stations in CDMA
12.47

Figure 12.28 Decoding of the composite signal for one in CDMA
12.48

Figure 12.29 General rule and examples of creating Walsh tables
12.49

Note
The number of sequences in a Walsh t bl d t b N 2mtable needs to be N = 2m.
12.50

Example 12.6
Find the chips for a network witha. Two stations b. Four stations
SolutionWe can use the rows of W2 and W4 in Figure 12.29:a. For a two-station network, we have
[+1 +1] and [+1 −1].
b. For a four-station network we have [+1 +1 +1 +1], [+1 −1 +1 −1],
[+1 +1 −1 −1], and [+1 −1 −1 +1].
12.51

Example 12.7
What is the number of sequences if we have 90 stations inour network?
SolutionThe number of sequences needs to be 2m. We need to
7choose m = 7 and N = 27 or 128. We can then use 90of the sequences as the chips.
12.52

Example 12.8
Prove that a receiving station can get the data sent by aspecific sender if it multiplies the entire data on thechannel by the sender’s chip code and then divides it byh b f ithe number of stations.
SolutionSolutionLet us prove this for the first station, using our previousfour station example We can say that the data on thefour-station example. We can say that the data on the
channelD = (d c + d c + d c + d c )D = (d1 c1 + d2 c2 + d3 c3 + d4 c4).
The receiver which wants to get the data sent by station 1multiplies these data by c
12.53
multiplies these data by c1.

Example 12.8 (continued)
When we divide the result by N, we get d1 .
12.54


![Chapter 7 Transmission Media - Kasetsart Universityplw/dccn/presentation/ch07.pdf · Microsoft PowerPoint - ch07.ppt [Compatibility Mode] Author: Noi Created Date: 6/18/2009 10:42:51](https://img.dokumen.tips/doc/110x75/5a7dfddc7f8b9ae9398e18d7/chapter-7-transmission-media-kasetsart-university-plwdccnpresentationch07pdfmicrosoft.jpg)


![Chapter 5 Analog Transmission - Kasetsart Universityplw/dccn/presentation/ch05.pdf · Microsoft PowerPoint - ch05.ppt [Compatibility Mode] Author: Noi Created Date: 6/18/2009 10:41:24](https://img.dokumen.tips/doc/110x75/5b00e4c57f8b9a84338d53ba/chapter-5-analog-transmission-kasetsart-university-plwdccnpresentationch05pdfmicrosoft.jpg)