Embed Size (px)
Citation preview
Chapter 3
Data and Signals
3.1 Copyright © The McGraw-Hill Companies, Inc. Permission required for reproduction or display.

N t
To be transmitted data must be
Note
To be transmitted, data must be transformed to electromagnetic signals.
3.2

33--1 1 ANALOG AND DIGITALANALOG AND DIGITAL
DataData cancan bebe analoganalog oror digitaldigital.. TheThe termterm analoganalog datadata refersreferstoto informationinformation thatthat isis continuouscontinuous;; digitaldigital datadata refersrefers totototo informationinformation thatthat isis continuouscontinuous;; digitaldigital datadata refersrefers totoinformationinformation thatthat hashas discretediscrete statesstates.. AnalogAnalog datadata taketake ononcontinuouscontinuous valuesvalues DigitalDigital datadata taketake onon discretediscrete valuesvaluescontinuouscontinuous valuesvalues.. DigitalDigital datadata taketake onon discretediscrete valuesvalues..
Analog and Digital DataTopics discussed in this section:Topics discussed in this section:
Analog and Digital SignalsPeriodic and Nonperiodic Signals
3.3

Note
Data can be analog or digital. Analog data are continuous and takeAnalog data are continuous and take
continuous values.Di it l d t h di t t t dDigital data have discrete states and
take discrete values.
3.4
Note
Signals can be analog or digital. Analog signals can have an infiniteAnalog signals can have an infinite number of values in a range; digital
i l h l li it dsignals can have only a limited number of values.
3.5

Figure 3.1 Comparison of analog and digital signals
3.6
Note
In data communications, we commonly use periodic analog signals anduse periodic analog signals and
nonperiodic digital signals.
3.7
33--2 2 PERIODIC ANALOG SIGNALSPERIODIC ANALOG SIGNALS
PeriodicPeriodic analoganalog signalssignals cancan bebe classifiedclassified asas simplesimple ororcompositecomposite AA simplesimple periodicperiodic analoganalog signalsignal aa sinesine wavewavecompositecomposite.. AA simplesimple periodicperiodic analoganalog signal,signal, aa sinesine wavewave,,cannotcannot bebe decomposeddecomposed intointo simplersimpler signalssignals.. AA compositecompositeperiodicperiodic analoganalog signalsignal isis composedcomposed ofof multiplemultiple sinesineperiodicperiodic analoganalog signalsignal isis composedcomposed ofof multiplemultiple sinesinewaveswaves..
Topics discussed in this section:Topics discussed in this section:Sine WaveWavelengthTime and Frequency DomainComposite SignalsBandwidth
3.8
Bandwidth
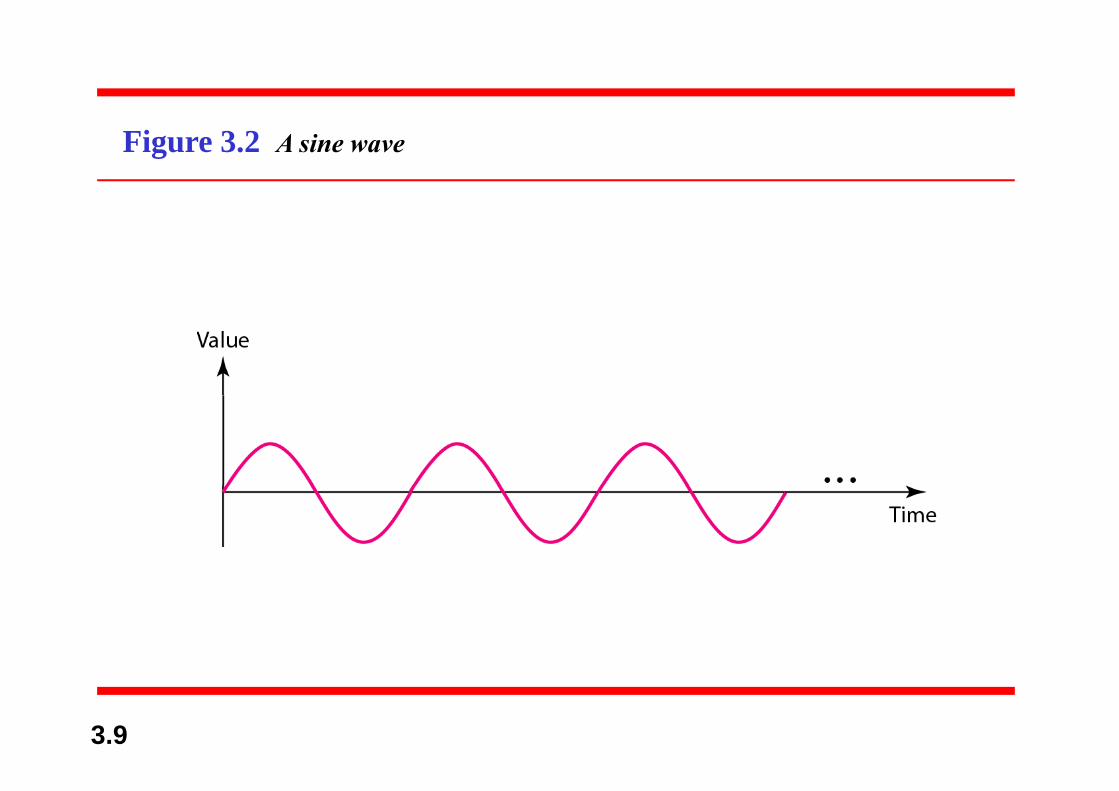
Figure 3.2 A sine wave
3.9

Note
We discuss a mathematical approach to
Note
ppsine waves in Appendix C.
3.10
Example 3.1
The power in your house can be represented by a sineThe power in your house can be represented by a sinewave with a peak amplitude of 155 to 170 V. However, itis common knowledge that the voltage of the power inis common knowledge that the voltage of the power inU.S. homes is 110 to 120 V. This discrepancy is due tothe fact that these are root mean square (rms) valuesthe fact that these are root mean square (rms) values.The signal is squared and then the average amplitude iscalculated The peak value is equal to 2½ × rms valuecalculated. The peak value is equal to 2½ × rms value.
3.11

Figure 3.3 Two signals with the same phase and frequency, but different amplitudesbut different amplitudes
3.12
Example 3.2
The voltage of a battery is a constant; this constant valueThe voltage of a battery is a constant; this constant valuecan be considered a sine wave, as we will see later. Forexample the peak value of an AA battery is normallyexample, the peak value of an AA battery is normally1.5 V.
3.13
N t
Frequency and period are the inverse of
Note
Frequency and period are the inverse of each other.
3.14
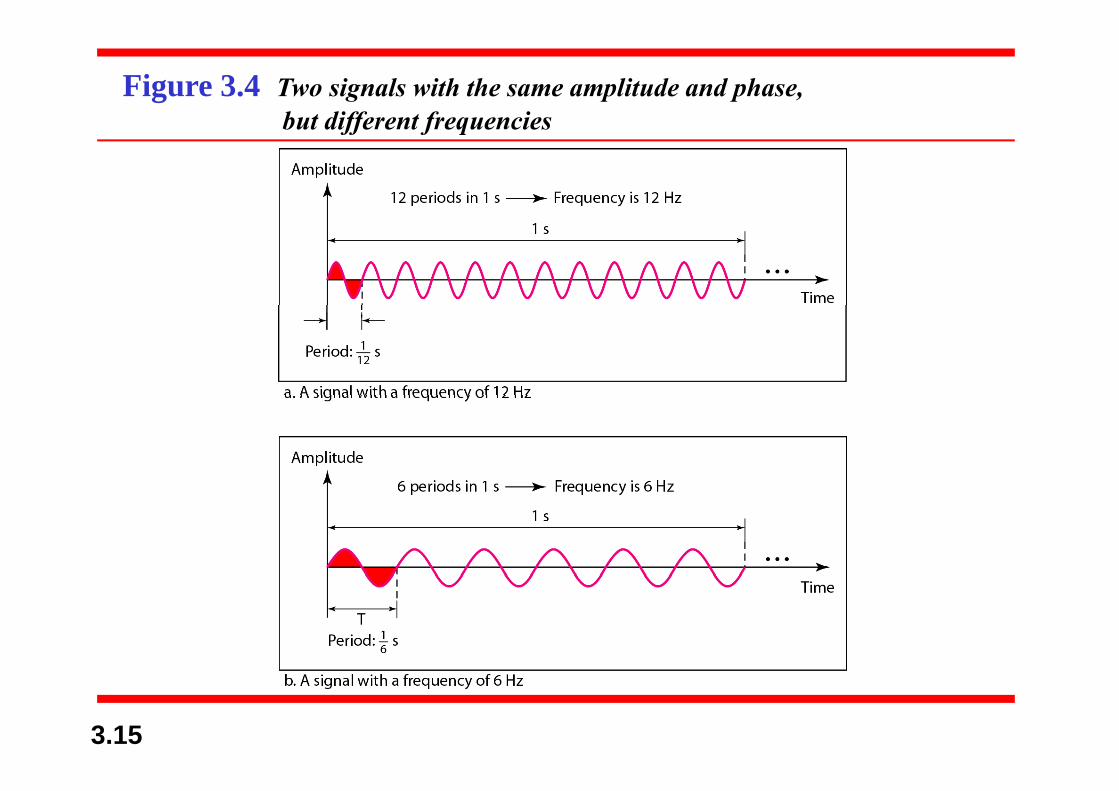
Figure 3.4 Two signals with the same amplitude and phase,but different frequenciesbut different frequencies
3.15
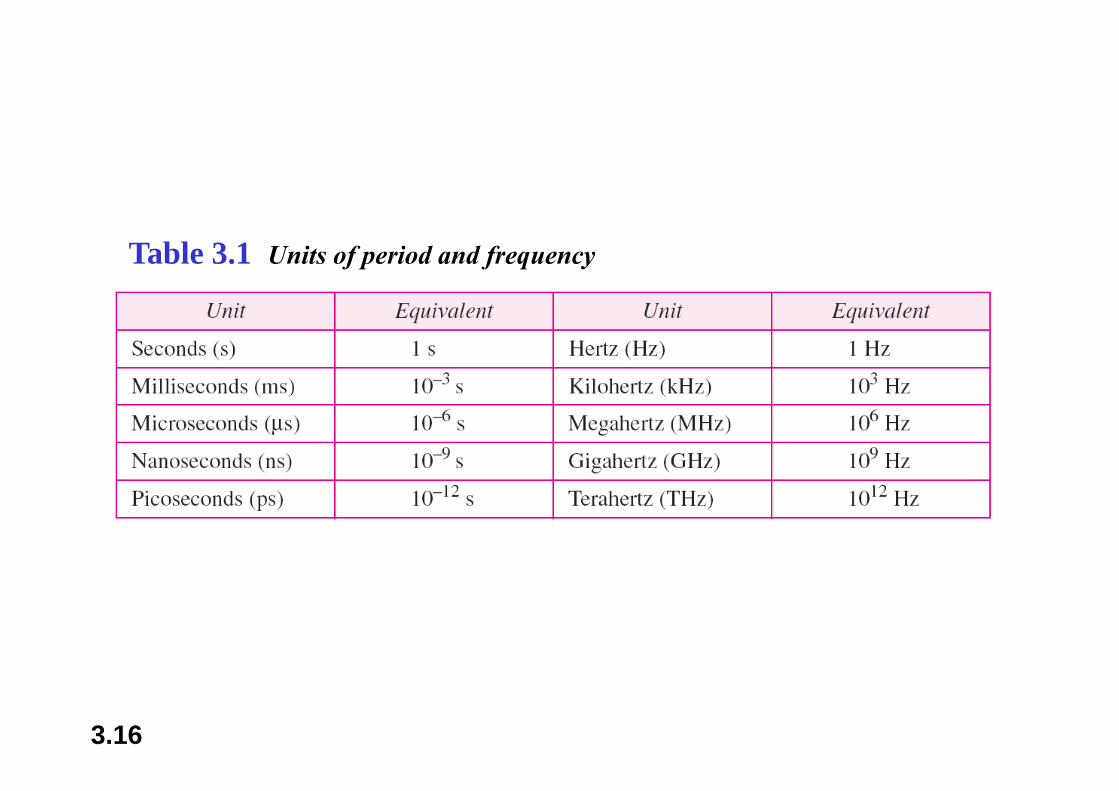
Table 3.1 Units of period and frequency
3.16

Example 3.3
The power we use at home has a frequency of 60 HzThe power we use at home has a frequency of 60 Hz.The period of this sine wave can be determined asfollows:follows:
3.17

Example 3.4
Express a period of 100 ms in microsecondsExpress a period of 100 ms in microseconds.
S l tiSolutionFrom Table 3.1 we find the equivalents of 1 ms (1 ms is10−3 ) d 1 (1 i 106 ) W k th f ll i10 3 s) and 1 s (1 s is 106 μs). We make the followingsubstitutions:.
3.18
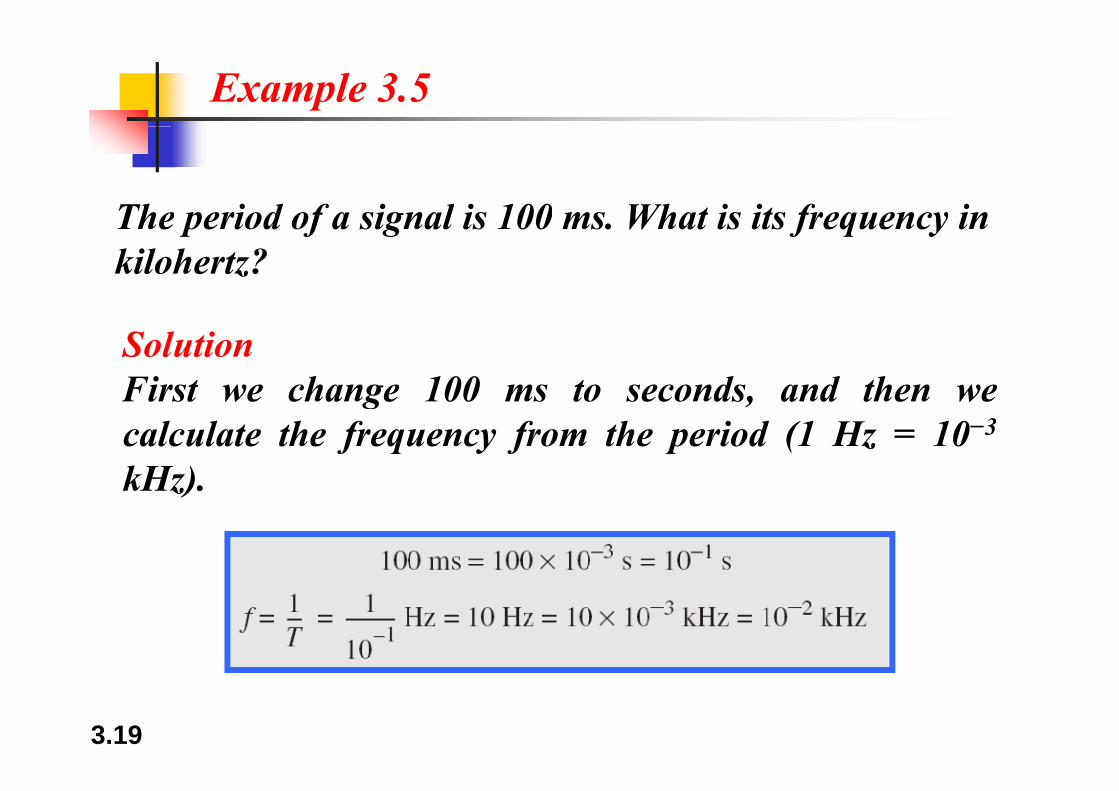
Example 3.5
The period of a signal is 100 ms What is its frequency inThe period of a signal is 100 ms. What is its frequency inkilohertz?
SolutionFirst we change 100 ms to seconds and then weFirst we change 100 ms to seconds, and then wecalculate the frequency from the period (1 Hz = 10−3
kHz).kHz).
3.19

Note
Frequency is the rate of change with respect to time.
Change in a short span of timemeans high frequencymeans high frequency.
Ch l fChange over a long span of time means low frequency.
3.20

Note
If a signal does not change at all, its ffrequency is zero.
If a signal changes instantaneously, its g g yfrequency is infinite.
3.21

Note
Phase describes the position of the
Note
Phase describes the position of the waveform relative to time 0.
3.22

Figure 3.5 Three sine waves with the same amplitude and frequency,but different phasesff p
3.23
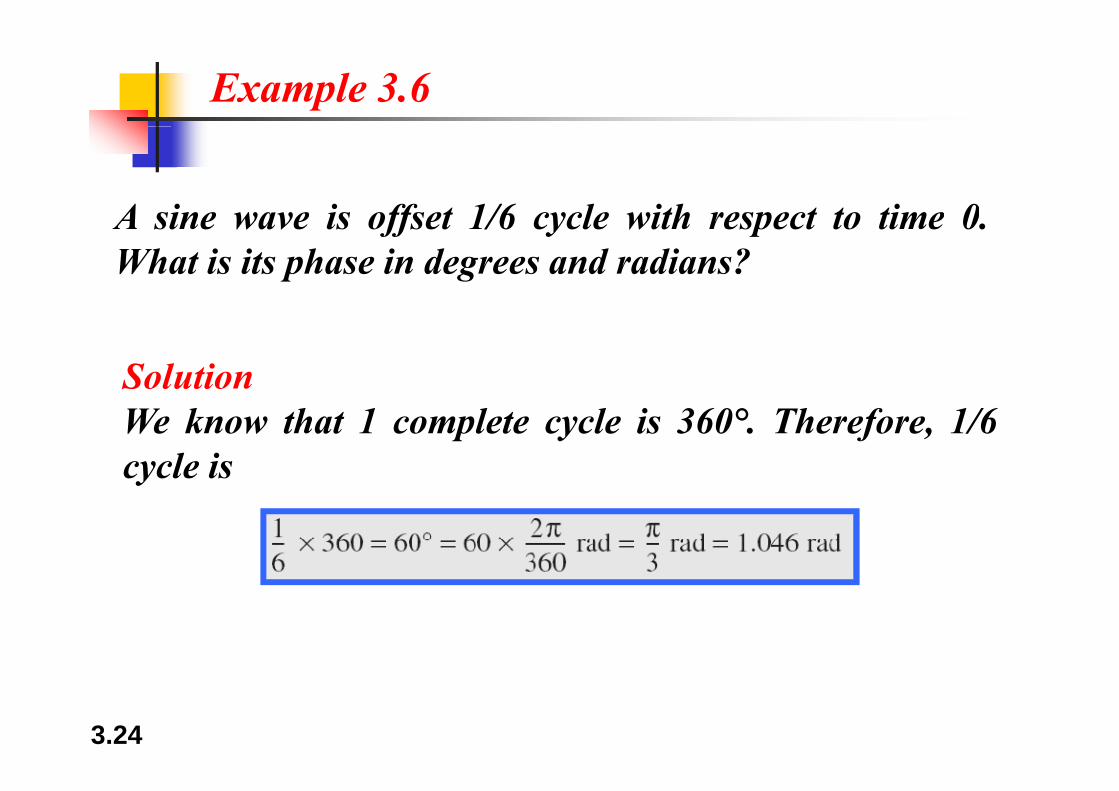
Example 3.6
A sine wave is offset 1/6 cycle with respect to time 0A sine wave is offset 1/6 cycle with respect to time 0.What is its phase in degrees and radians?
SolutionWe know that 1 complete cycle is 360°. Therefore, 1/6cycle isy
3.24
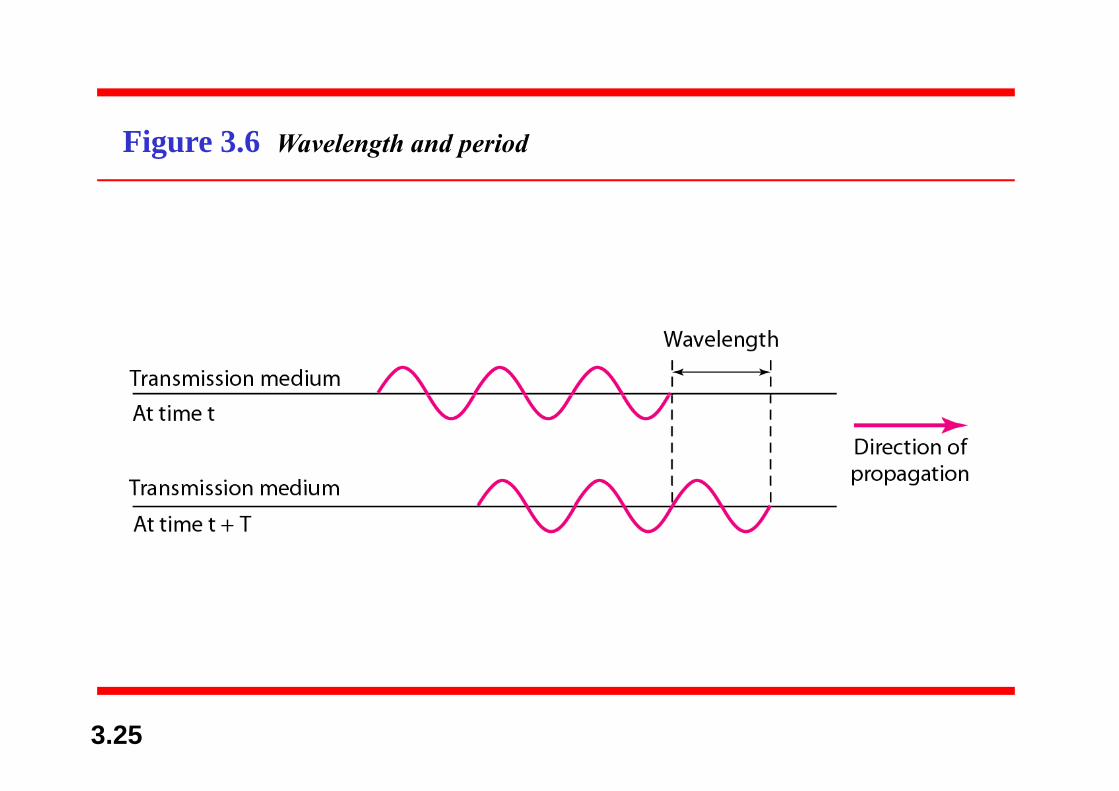
Figure 3.6 Wavelength and period
3.25
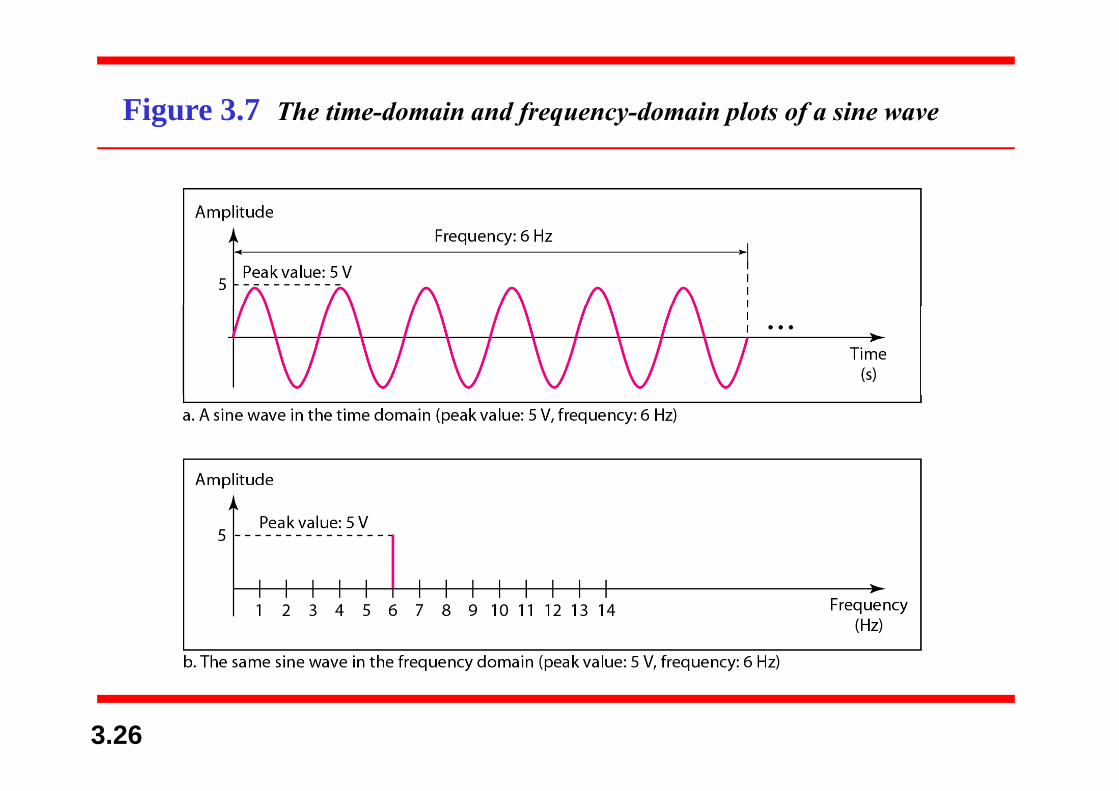
Figure 3.7 The time-domain and frequency-domain plots of a sine waveg
3.26

Note
A complete sine wave in the time
Note
A complete sine wave in the time domain can be represented by one
single spike in the frequency domainsingle spike in the frequency domain.
3.27
Example 3.7
The frequency domain is more compact andThe frequency domain is more compact anduseful when we are dealing with more than onesine wave For example Figure 3 8 shows threesine wave. For example, Figure 3.8 shows threesine waves, each with different amplitude andfrequency All can be represented by threefrequency. All can be represented by threespikes in the frequency domain.
3.28

Figure 3.8 The time domain and frequency domain of three sine waves
3.29
N t
A single-frequency sine wave is not
Note
A single frequency sine wave is not useful in data communications;
we need to send a composite signal awe need to send a composite signal, a signal made of many simple sine waves.
3.30

A di t F i l i
Note
According to Fourier analysis, any composite signal is a combination of
simple sine waves with different frequencies, amplitudes, and phases.eque c es, a p tudes, a d p ases
Fourier analysis is discussed in Appendix CAppendix C.
3.31

Note
If the composite signal is periodic the
Note
If the composite signal is periodic, the decomposition gives a series of signals
ith discrete freq encieswith discrete frequencies; if the composite signal is nonperiodic, the decomposition gives a combination
of sine waves with continuous frequencies.
3.32

Example 3.8
Figure 3 9 shows a periodic composite signal withFigure 3.9 shows a periodic composite signal withfrequency f. This type of signal is not typical of thosefound in data communications We can consider it to befound in data communications. We can consider it to bethree alarm systems, each with a different frequency.The analysis of this signal can give us a goodThe analysis of this signal can give us a goodunderstanding of how to decompose signals.
3.33
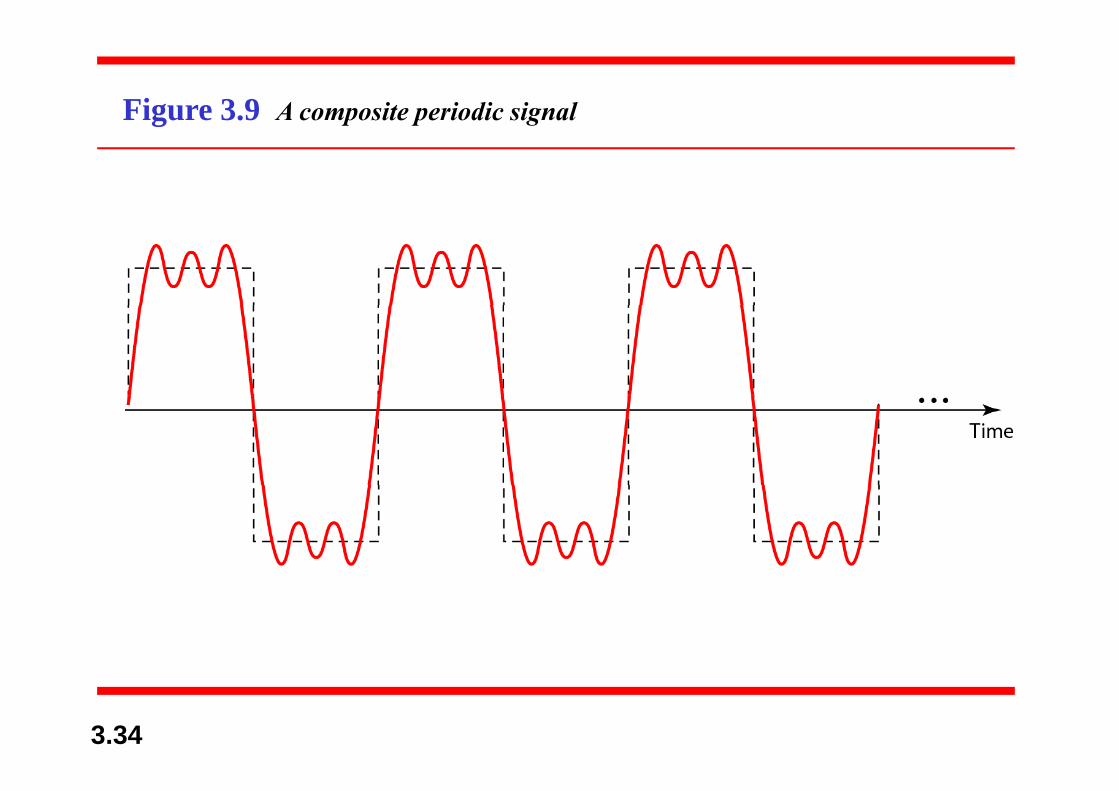
Figure 3.9 A composite periodic signalg
3.34
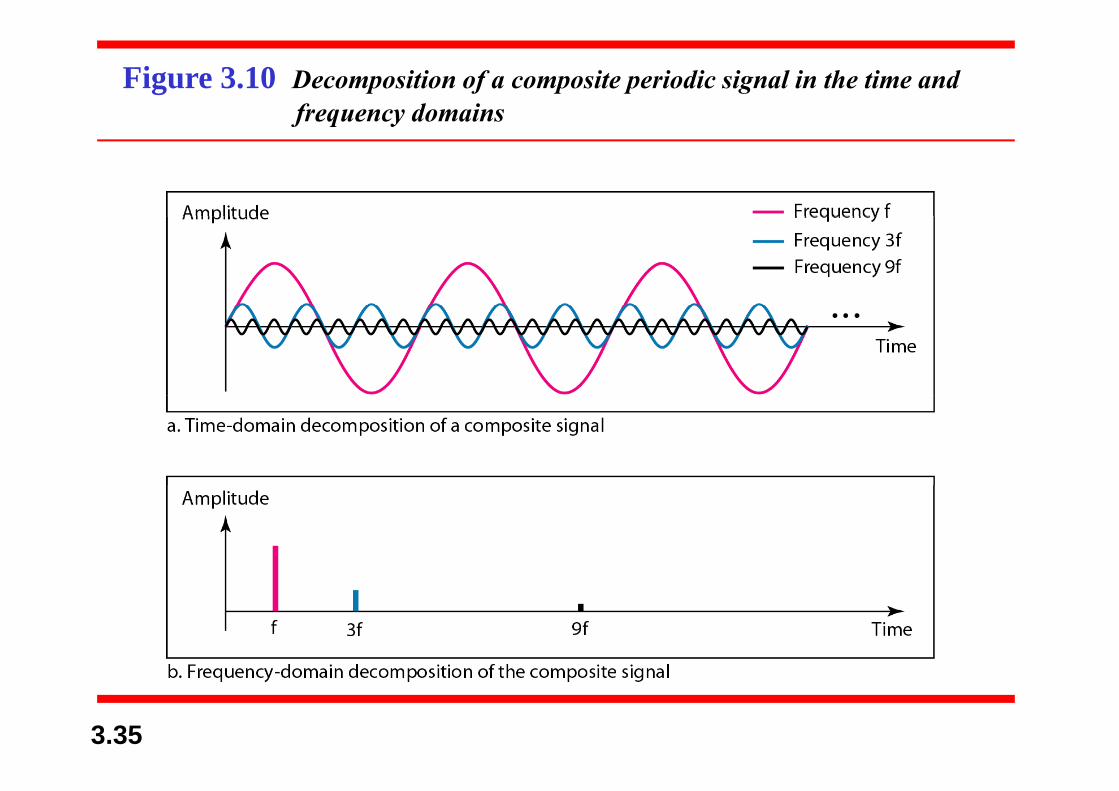
Figure 3.10 Decomposition of a composite periodic signal in the time andfrequency domainsf q y
3.35
Example 3.9
Figure 3 11 shows a nonperiodic composite signal ItFigure 3.11 shows a nonperiodic composite signal. Itcan be the signal created by a microphone or a telephoneset when a word or two is pronounced In this case theset when a word or two is pronounced. In this case, thecomposite signal cannot be periodic, because thatimplies that we are repeating the same word or wordsimplies that we are repeating the same word or wordswith exactly the same tone.
3.36

Figure 3.11 The time and frequency domains of a nonperiodic signal
3.37

Note
The bandwidth of a composite signal is the difference between thethe difference between the
highest and the lowest frequencies contained in that signal.
3.38

Figure 3.12 The bandwidth of periodic and nonperiodic composite signals
3.39

Example 3.10
If a periodic signal is decomposed into five sine wavesf p g p fwith frequencies of 100, 300, 500, 700, and 900 Hz, whatis its bandwidth? Draw the spectrum, assuming allp , gcomponents have a maximum amplitude of 10 V.SolutionLet fh be the highest frequency, fl the lowest frequency,and B the bandwidth. Then
The spectrum has only five spikes, at 100, 300, 500, 700,d 900 H ( Fi 3 13)
3.40
and 900 Hz (see Figure 3.13).
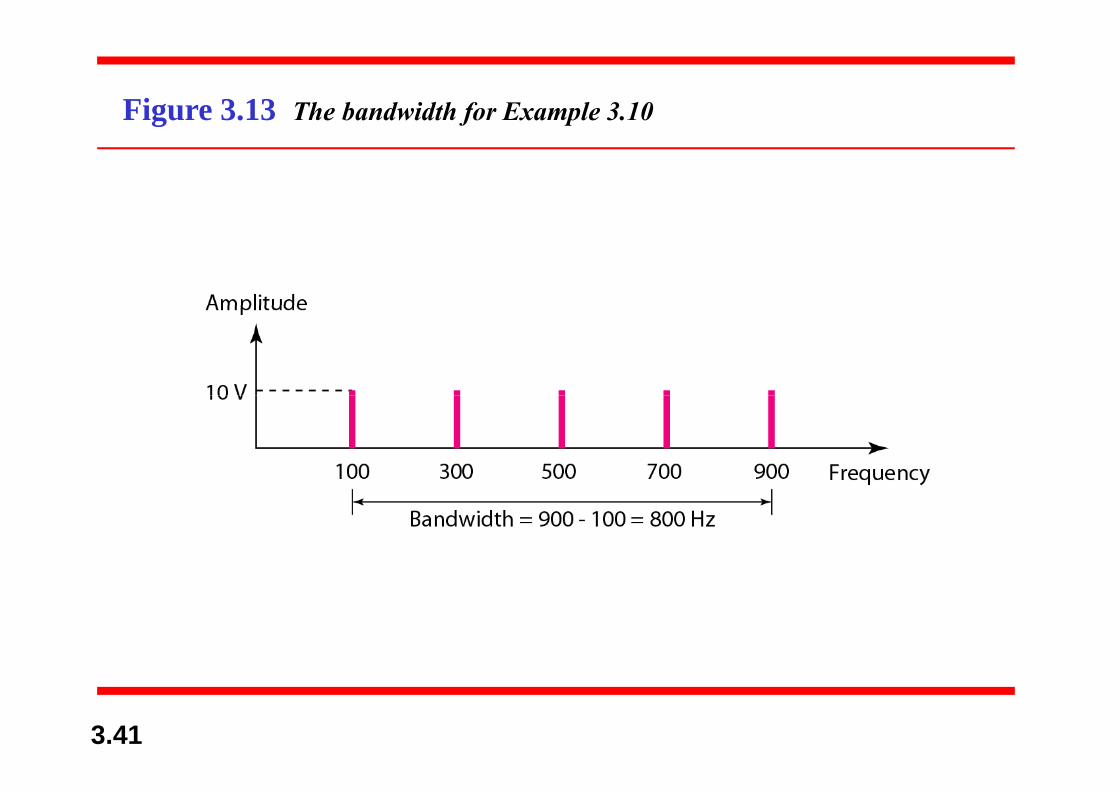
Figure 3.13 The bandwidth for Example 3.10g
3.41

Example 3.11
A periodic signal has a bandwidth of 20 Hz. The highestp g f z gfrequency is 60 Hz. What is the lowest frequency? Drawthe spectrum if the signal contains all frequencies of thep f g f q fsame amplitude.SolutionLet fh be the highest frequency, fl the lowest frequency,and B the bandwidth. Then
The spectrum contains all integer frequencies. We showthis by a series of spikes (see Figure 3.14).
3.42
this by a series of spikes (see Figure 3.14).

Figure 3.14 The bandwidth for Example 3.11
3.43

Example 3.12
A nonperiodic composite signal has a bandwidth of 200A nonperiodic composite signal has a bandwidth of 200kHz, with a middle frequency of 140 kHz and peakamplitude of 20 V The two extreme frequencies have anamplitude of 20 V. The two extreme frequencies have anamplitude of 0. Draw the frequency domain of thesignalsignal.
SolutionSolutionThe lowest frequency must be at 40 kHz and the highestat 240 kHz Figure 3 15 shows the frequency domainat 240 kHz. Figure 3.15 shows the frequency domainand the bandwidth.
3.44
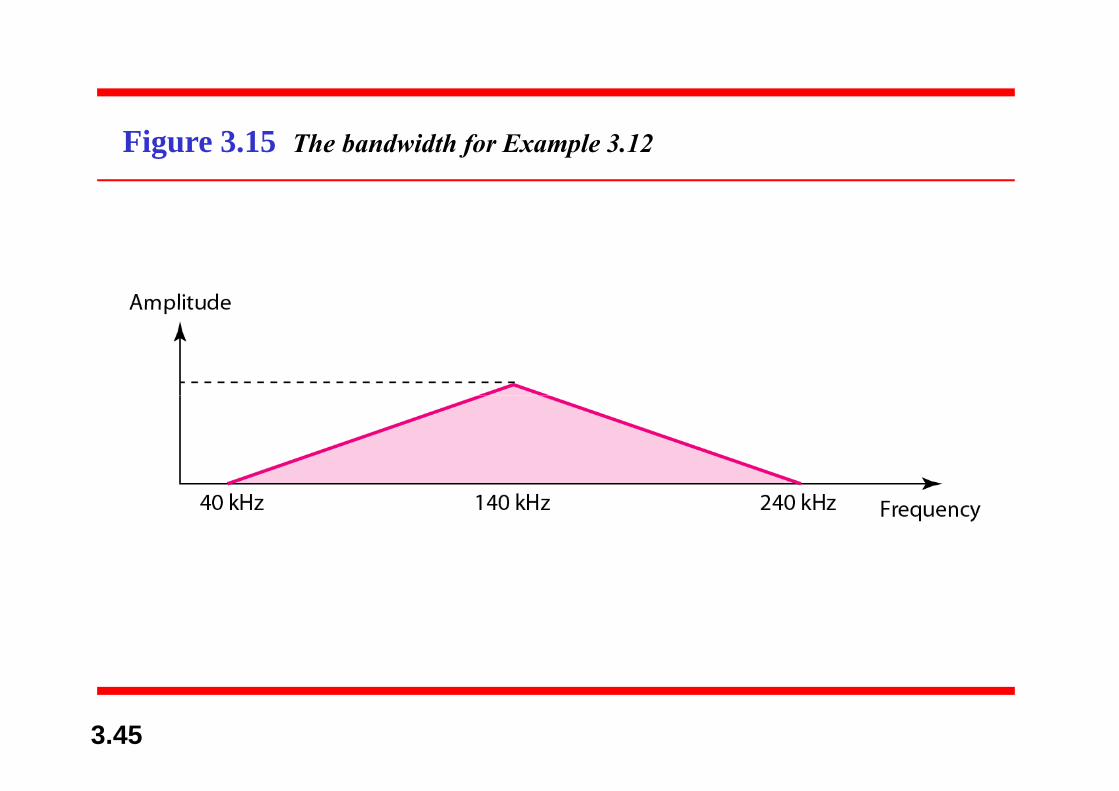
Figure 3.15 The bandwidth for Example 3.12
3.45
Example 3.13
An example of a nonperiodic composite signal is thep f p p gsignal propagated by an AM radio station. In the UnitedStates, each AM radio station is assigned a 10-kHz, gbandwidth. The total bandwidth dedicated to AM radioranges from 530 to 1700 kHz. We will show the rationaleg fbehind this 10-kHz bandwidth in Chapter 5.
3.46
Example 3.14
Another example of a nonperiodic composite signal isAnother example of a nonperiodic composite signal isthe signal propagated by an FM radio station. In theUnited States each FM radio station is assigned a 200United States, each FM radio station is assigned a 200-kHz bandwidth. The total bandwidth dedicated to FMradio ranges from 88 to 108 MHz We will show theradio ranges from 88 to 108 MHz. We will show therationale behind this 200-kHz bandwidth in Chapter 5.
3.47
Example 3.15
Another example of a nonperiodic composite signal isp f p p gthe signal received by an old-fashioned analog black-and-white TV. A TV screen is made up of pixels. If wep f p fassume a resolution of 525 × 700, we have 367,500pixels per screen. If we scan the screen 30 times perp p f psecond, this is 367,500 × 30 = 11,025,000 pixels persecond. The worst-case scenario is alternating black andgwhite pixels. We can send 2 pixels per cycle. Therefore,we need 11,025,000 / 2 = 5,512,500 cycles per second, or, , , , y p ,Hz. The bandwidth needed is 5.5125 MHz.
3.48
33--3 3 DIGITAL SIGNALSDIGITAL SIGNALS
InIn additionaddition toto beingbeing representedrepresented byby anan analoganalog signal,signal,informationinformation cancan alsoalso bebe representedrepresented byby aa digitaldigital signalsignal..informationinformation cancan alsoalso bebe representedrepresented byby aa digitaldigital signalsignal..ForFor example,example, aa 11 cancan bebe encodedencoded asas aa positivepositive voltagevoltageandand aa 00 asas zerozero voltagevoltage.. AA digitaldigital signalsignal cancan havehave moremoreandand aa 00 asas zerozero voltagevoltage.. AA digitaldigital signalsignal cancan havehave moremorethanthan twotwo levelslevels.. InIn thisthis case,case, wewe cancan sendsend moremore thanthan 11 bitbitforfor eacheach levellevel..forfor eacheach levellevel..
Bit RateTopics discussed in this section:Topics discussed in this section:Bit RateBit LengthDigital Signal as a Composite Analog Signal
3.49
Application Layer

Figure 3.16 Two digital signals: one with two signal levels and the otherwith four signal levelswith four signal levels
3.50

N tAppendix C reviews information about exponential and
l ith i f ti
Note
Appendix C reviews information aboutlogarithmic functions.Appendix C reviews information about exponential and logarithmic functions.
3.51

Example 3.16
A digital signal has eight levels How many bits areA digital signal has eight levels. How many bits areneeded per level? We calculate the number of bits fromthe formulathe formula
Each signal level is represented by 3 bits.
3.52

Example 3.17
A digital signal has nine levels How many bits areA digital signal has nine levels. How many bits areneeded per level? We calculate the number of bits byusing the formula Each signal level is represented byusing the formula. Each signal level is represented by3.17 bits. However, this answer is not realistic. Thenumber of bits sent per level needs to be an integer asnumber of bits sent per level needs to be an integer aswell as a power of 2. For this example, 4 bits canrepresent one levelrepresent one level.
3.53
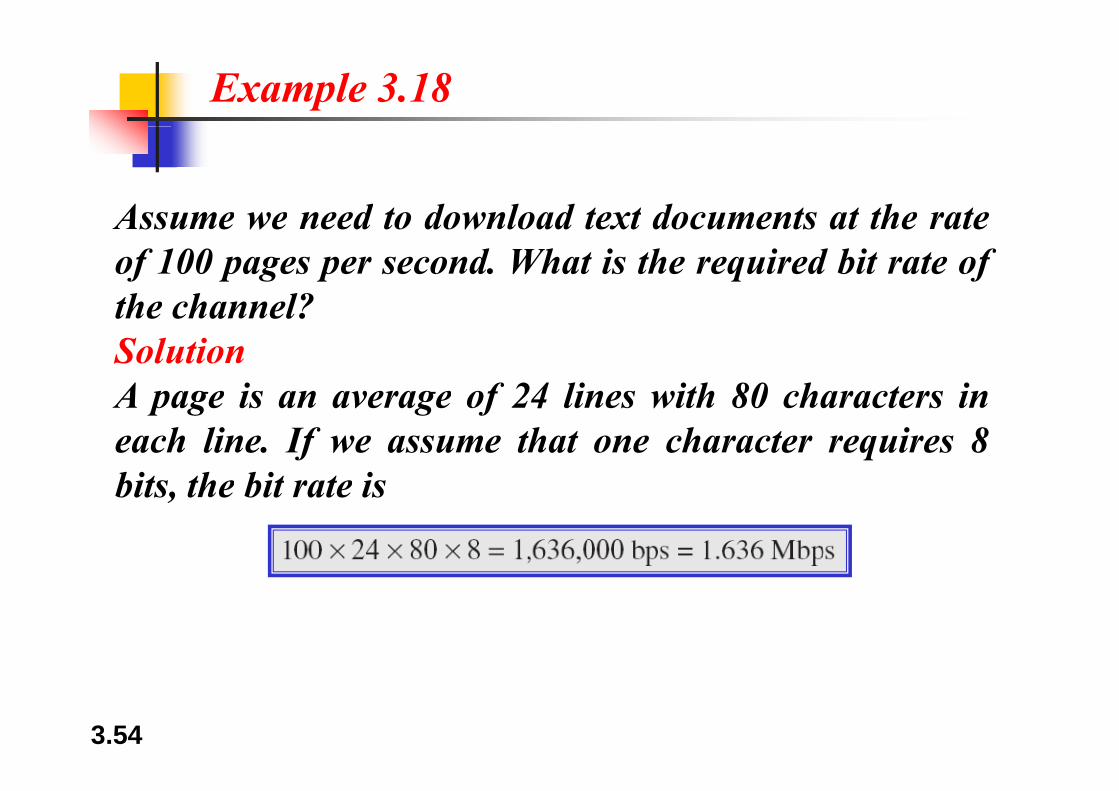
Example 3.18
Assume we need to download text documents at the rateAssume we need to download text documents at the rateof 100 pages per second. What is the required bit rate ofthe channel?the channel?SolutionA page is an average of 24 lines with 80 characters inA page is an average of 24 lines with 80 characters ineach line. If we assume that one character requires 8bits the bit rate isbits, the bit rate is
3.54
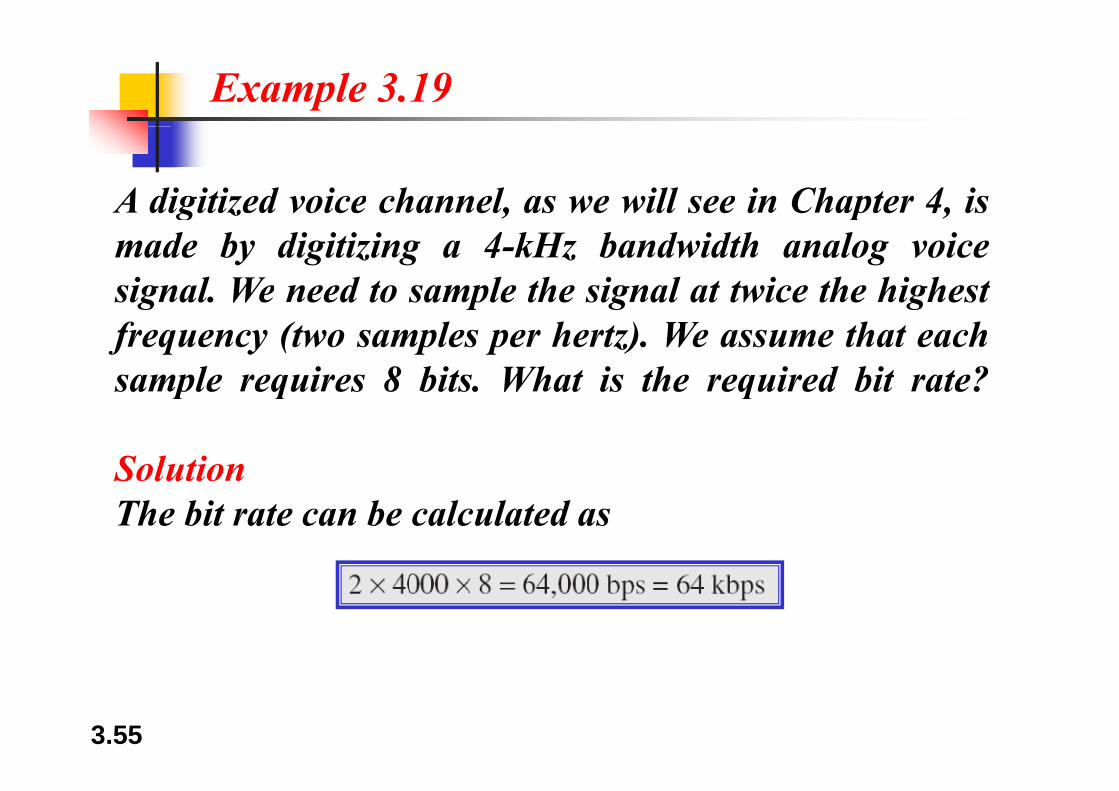
Example 3.19
A digitized voice channel, as we will see in Chapter 4, isg , p ,made by digitizing a 4-kHz bandwidth analog voicesignal. We need to sample the signal at twice the highestg p g gfrequency (two samples per hertz). We assume that eachsample requires 8 bits. What is the required bit rate?p q q
SolutionThe bit rate can be calculated as
3.55
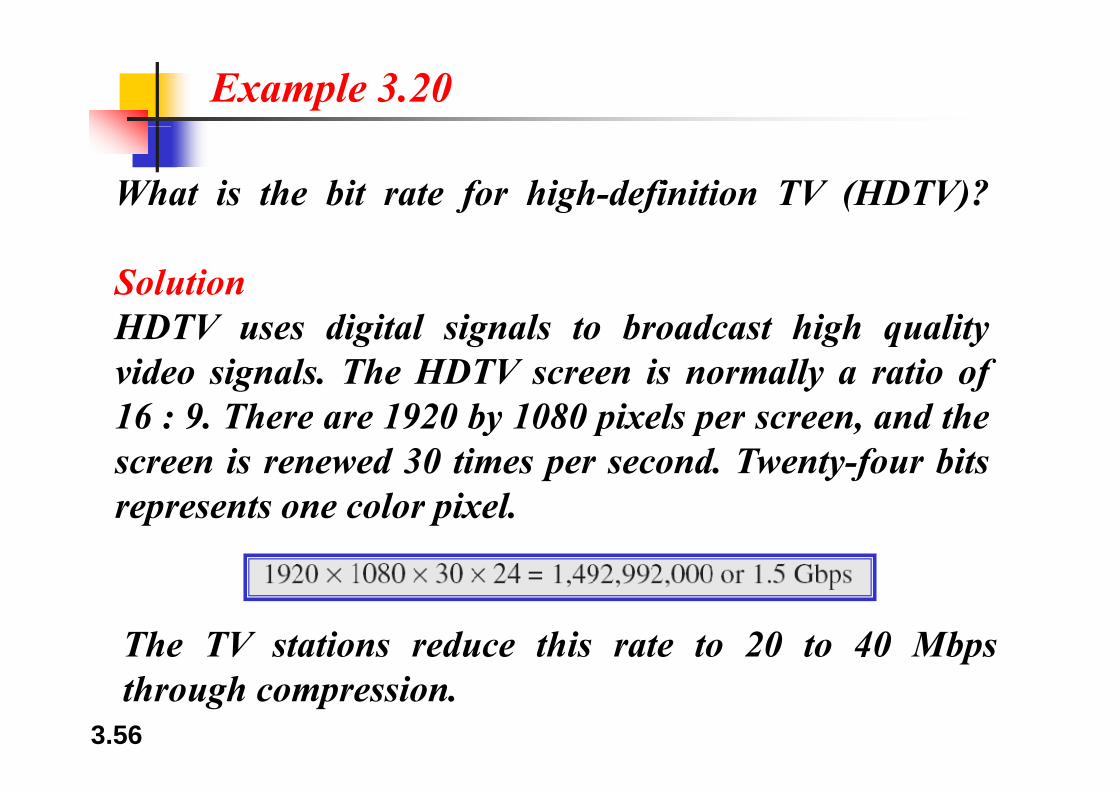
Example 3.20
What is the bit rate for high-definition TV (HDTV)?
SolutionHDTV uses digital signals to broadcast high qualityvideo signals. The HDTV screen is normally a ratio of16 : 9. There are 1920 by 1080 pixels per screen, and thescreen is renewed 30 times per second. Twenty-four bitsrepresents one color pixel.
The TV stations reduce this rate to 20 to 40 Mbps
3.56through compression.

Figure 3.17 The time and frequency domains of periodic and nonperiodicdigital signalsg g
3.57

Figure 3.18 Baseband transmission
3.58

N t
A digital signal is a composite analog
Note
A digital signal is a composite analog signal with an infinite bandwidth.
3.59
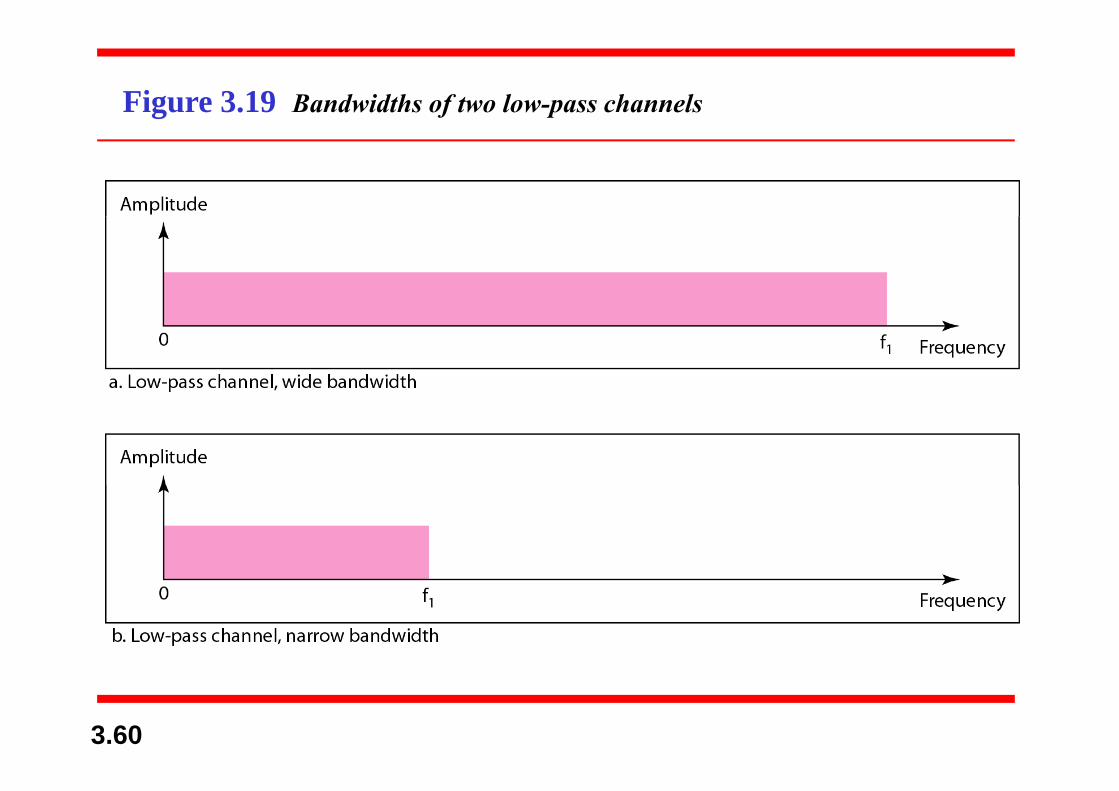
Figure 3.19 Bandwidths of two low-pass channels
3.60
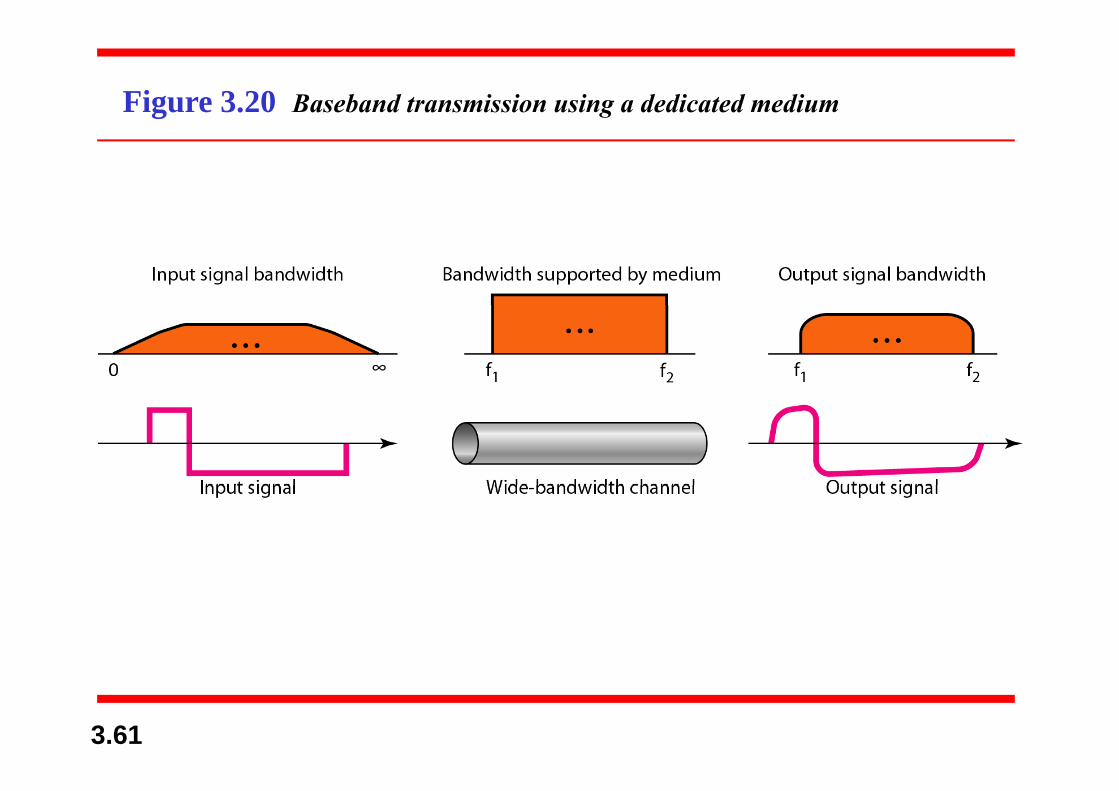
Figure 3.20 Baseband transmission using a dedicated medium
3.61

Note
Baseband transmission of a digital signal that preserves the shape of the g p p
digital signal is possible only if we have a low-pass channel with an infinite ora low pass channel with an infinite or
very wide bandwidth.
3.62

Example 3.21
An example of a dedicated channel where the entireAn example of a dedicated channel where the entirebandwidth of the medium is used as one single channelis a LAN. Almost every wired LAN today uses ais a LAN. Almost every wired LAN today uses adedicated channel for two stations communicating witheach other. In a bus topology LAN with multipointeach other. In a bus topology LAN with multipointconnections, only two stations can communicate witheach other at each moment in time (timesharing); theeach other at each moment in time (timesharing); theother stations need to refrain from sending data. In astar topology LAN, the entire channel between eachstar topology LAN, the entire channel between eachstation and the hub is used for communication betweenthese two entities. We study LANs in Chapter 14.
3.63
these two entities. We study LANs in Chapter 14.

Figure 3.21 Rough approximation of a digital signal using the first harmonic for worst case
3.64
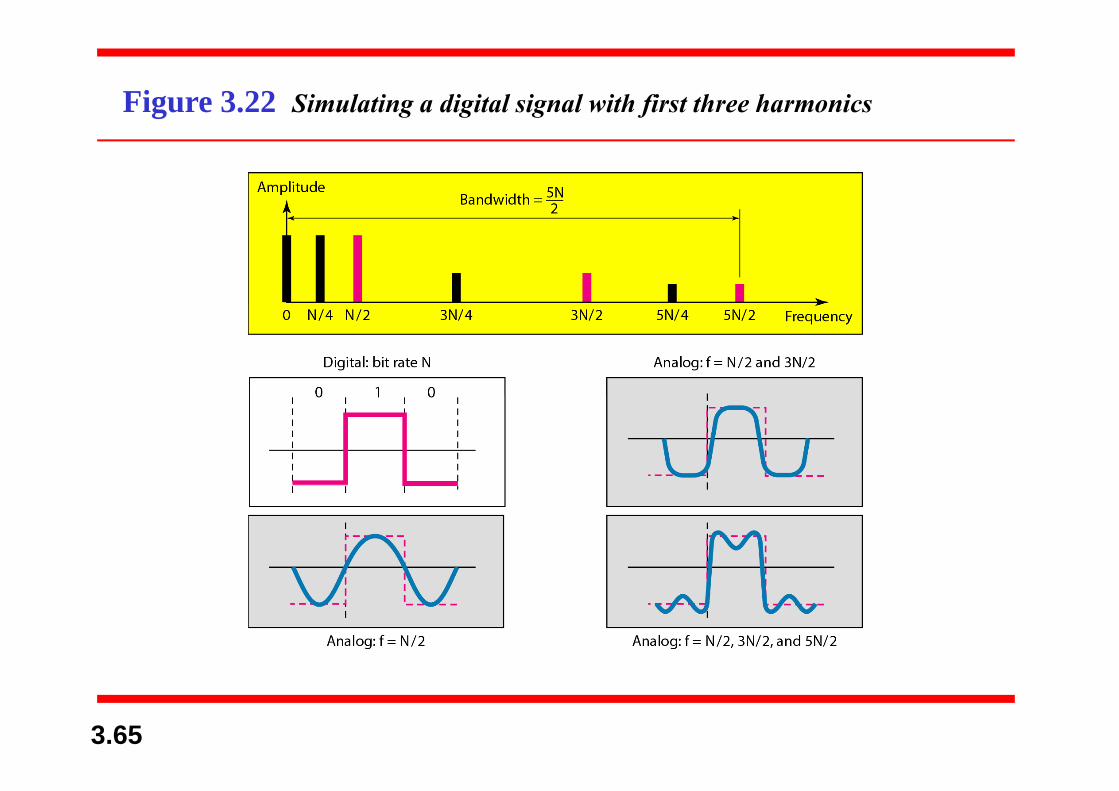
Figure 3.22 Simulating a digital signal with first three harmonics
3.65

NoteIn baseband transmission, the required bandwidth is
proportional to the bit rate;if we need to send bits faster, we need more bandwidth.
In baseband transmission, the required bandwidth is proportional to the bit rate;if we need to send bits faster, we need more bandwidth.bandwidth is proportional to the bit rate;if we need to send bits faster, we need
more bandwidthmore bandwidth.
3.66
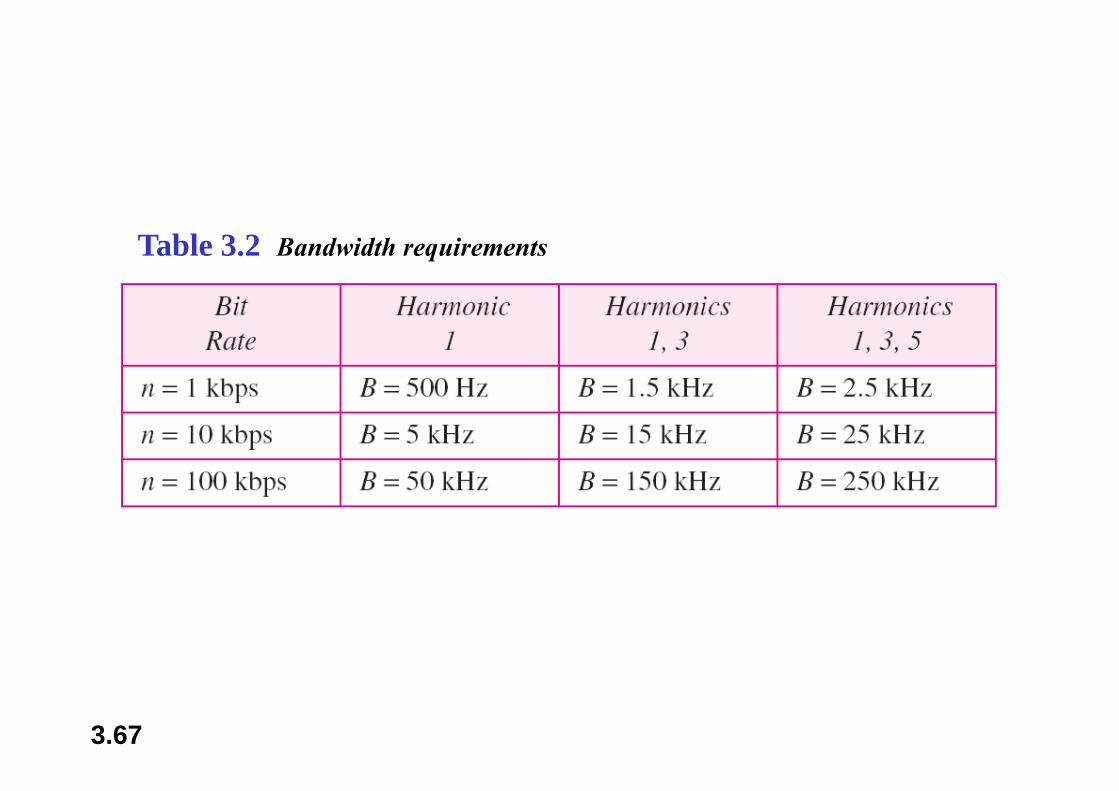
Table 3.2 Bandwidth requirements
3.67
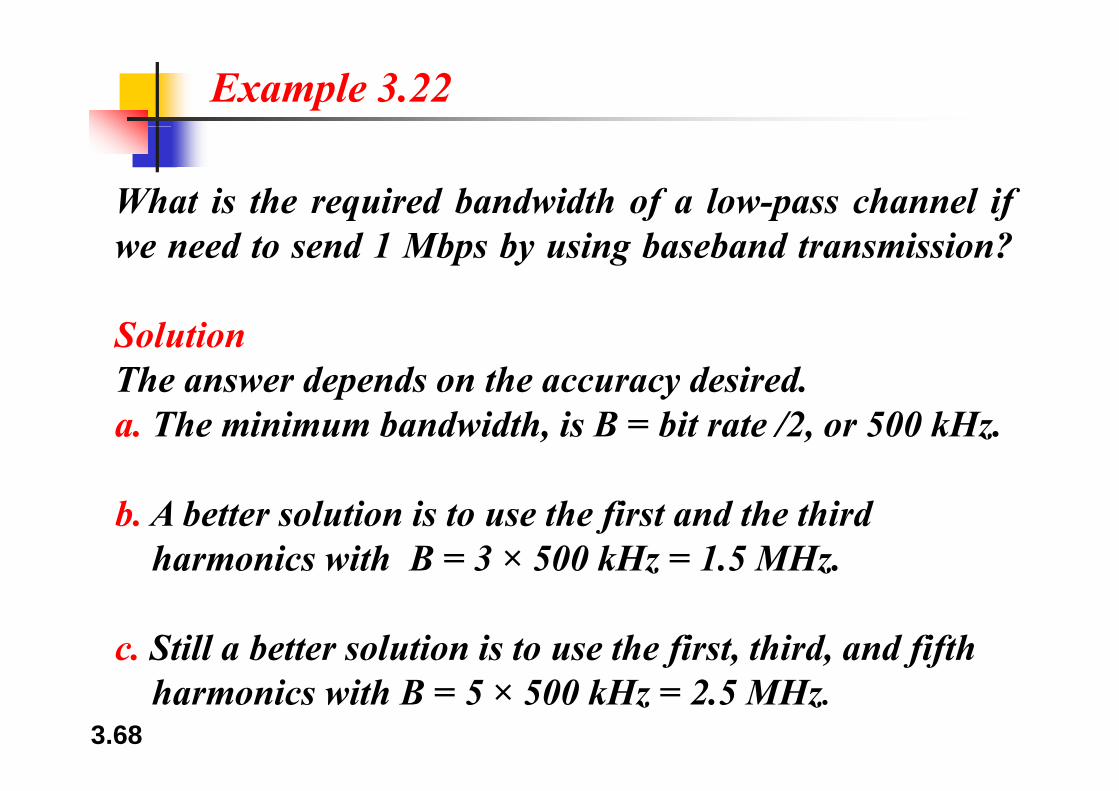
Example 3.22
What is the required bandwidth of a low-pass channel ifq f p fwe need to send 1 Mbps by using baseband transmission?
SolutionThe answer depends on the accuracy desired.p ya. The minimum bandwidth, is B = bit rate /2, or 500 kHz.
b. A better solution is to use the first and the thirdharmonics with B = 3 × 500 kHz = 1.5 MHz.
c. Still a better solution is to use the first, third, and fifth
3.68
f , , f fharmonics with B = 5 × 500 kHz = 2.5 MHz.

Example 3.22
We have a low-pass channel with bandwidth 100 kHz.What is the maximum bit rate of this
channel?
SolutionThe maximum bit rate can be achieved if we use the firstharmonic. The bit rate is 2 times the available bandwidth,or 200 kbps.
3.69

Figure 3.23 Bandwidth of a bandpass channel
3.70

N t
If the available channel is a bandpass
Note
If the available channel is a bandpass channel, we cannot send the digital
signal directl to the channelsignal directly to the channel; we need to convert the digital signal to an analog signal before transmission.
3.71

Figure 3.24 Modulation of a digital signal for transmission on a bandpass channel
3.72

Example 3.24
An example of broadband transmission usingp f gmodulation is the sending of computer data through atelephone subscriber line, the line connecting a residentp , gto the central telephone office. These lines are designedto carry voice with a limited bandwidth. The channel isyconsidered a bandpass channel. We convert the digitalsignal from the computer to an analog signal, and sendg f p g g ,the analog signal. We can install two converters tochange the digital signal to analog and vice versa at theg g g greceiving end. The converter, in this case, is called amodem which we discuss in detail in Chapter 5.
3.73
p
Example 3.25
A second example is the digital cellular telephone ForA second example is the digital cellular telephone. Forbetter reception, digital cellular phones convert theanalog voice signal to a digital signal (see Chapter 16)analog voice signal to a digital signal (see Chapter 16).Although the bandwidth allocated to a companyproviding digital cellular phone service is very wide weproviding digital cellular phone service is very wide, westill cannot send the digital signal without conversion.The reason is that we only have a bandpass channelThe reason is that we only have a bandpass channelavailable between caller and callee. We need to convertthe digitized voice to a composite analog signal beforethe digitized voice to a composite analog signal beforesending.
3.74
33--4 4 TRANSMISSION IMPAIRMENTTRANSMISSION IMPAIRMENT
SignalsSignals traveltravel throughthrough transmissiontransmission media,media, whichwhich areare notnotperfectperfect.. TheThe imperfectionimperfection causescauses signalsignal impairmentimpairment.. ThisThismeansmeans thatthat thethe signalsignal atat thethe beginningbeginning ofof thethe mediummedium isisnotnot thethe samesame asas thethe signalsignal atat thethe endend ofof thethe mediummedium..WhatWhat isis sentsent isis notnot whatwhat isis receivedreceived.. ThreeThree causescauses ofofimpairmentimpairment areare attenuationattenuation,, distortiondistortion,, andand noisenoise..
AttenuationTopics discussed in this section:Topics discussed in this section:AttenuationDistortionNoise
3.75

Figure 3.25 Causes of impairment
3.76
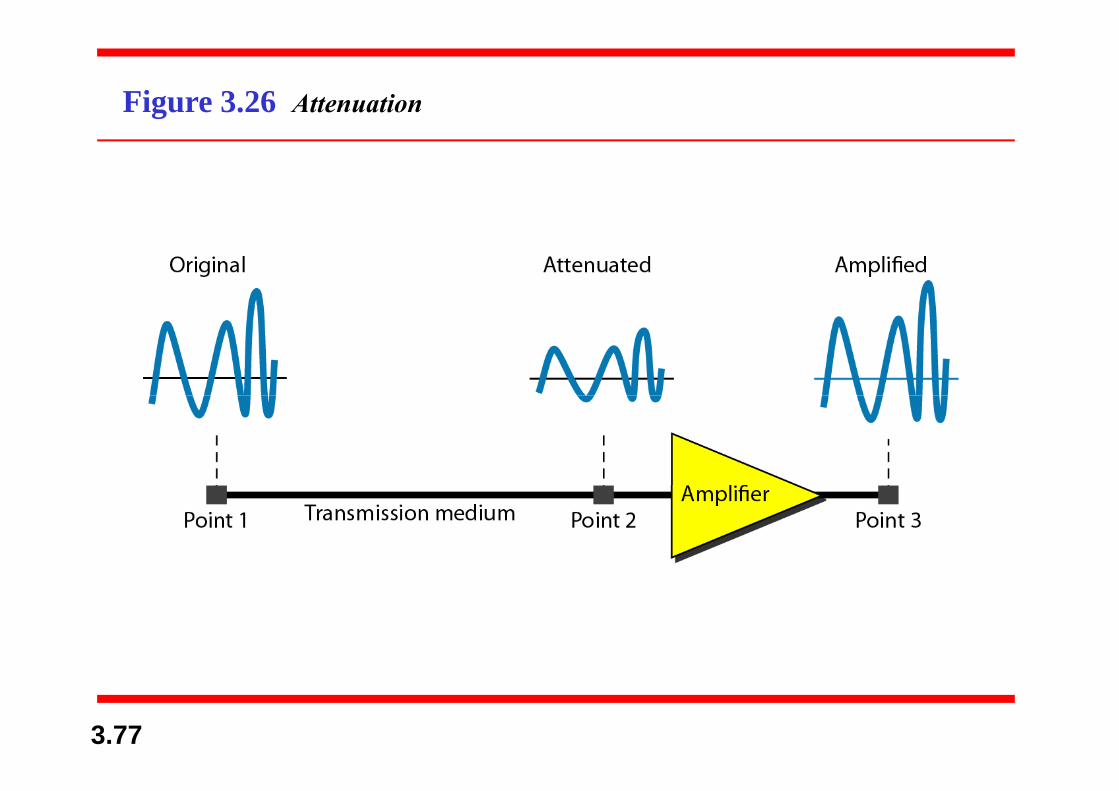
Figure 3.26 Attenuation
3.77
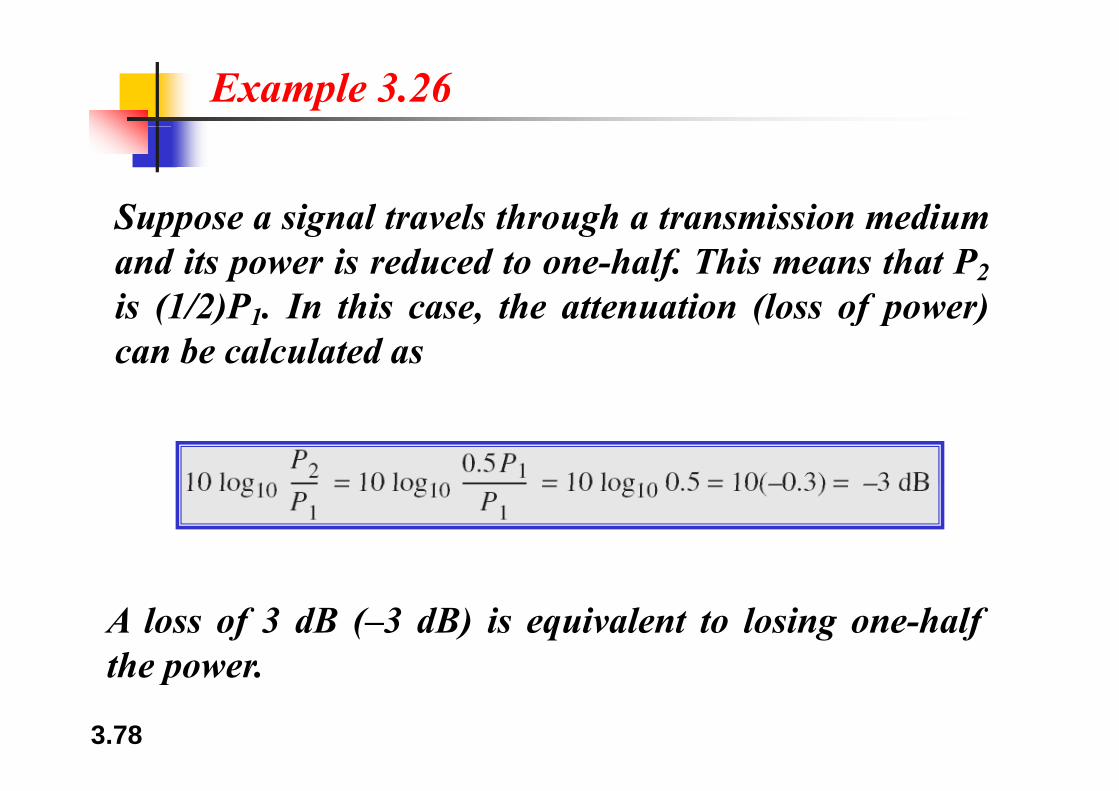
Example 3.26
Suppose a signal travels through a transmission mediumSuppose a signal travels through a transmission mediumand its power is reduced to one-half. This means that P2is (1/2)P In this case the attenuation (loss of power)is (1/2)P1. In this case, the attenuation (loss of power)can be calculated as
A loss of 3 dB (–3 dB) is equivalent to losing one-halfthe power
3.78
the power.

Example 3.27
A signal travels through an amplifier and its power isA signal travels through an amplifier, and its power isincreased 10 times. This means that P2 = 10P1 . In thiscase the amplification (gain of power) can be calculatedcase, the amplification (gain of power) can be calculatedas
3.79
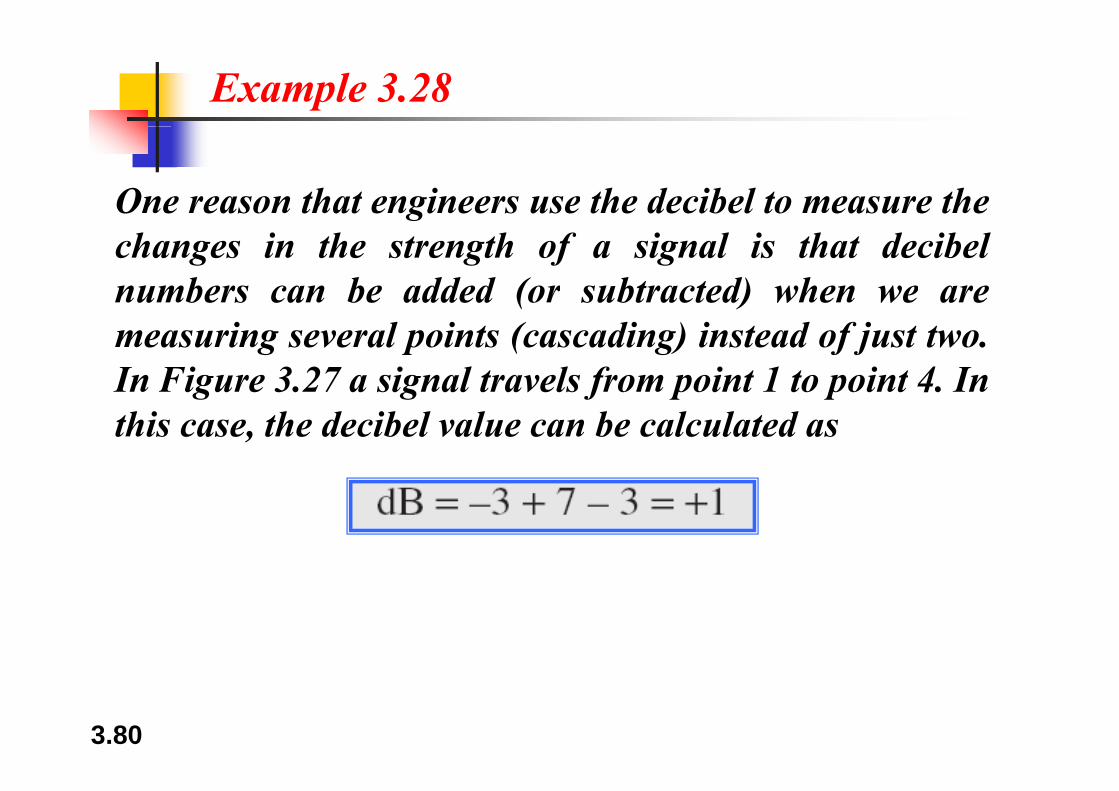
Example 3.28
One reason that engineers use the decibel to measure thegchanges in the strength of a signal is that decibelnumbers can be added (or subtracted) when we are( )measuring several points (cascading) instead of just two.In Figure 3.27 a signal travels from point 1 to point 4. Ing g f p pthis case, the decibel value can be calculated as
3.80
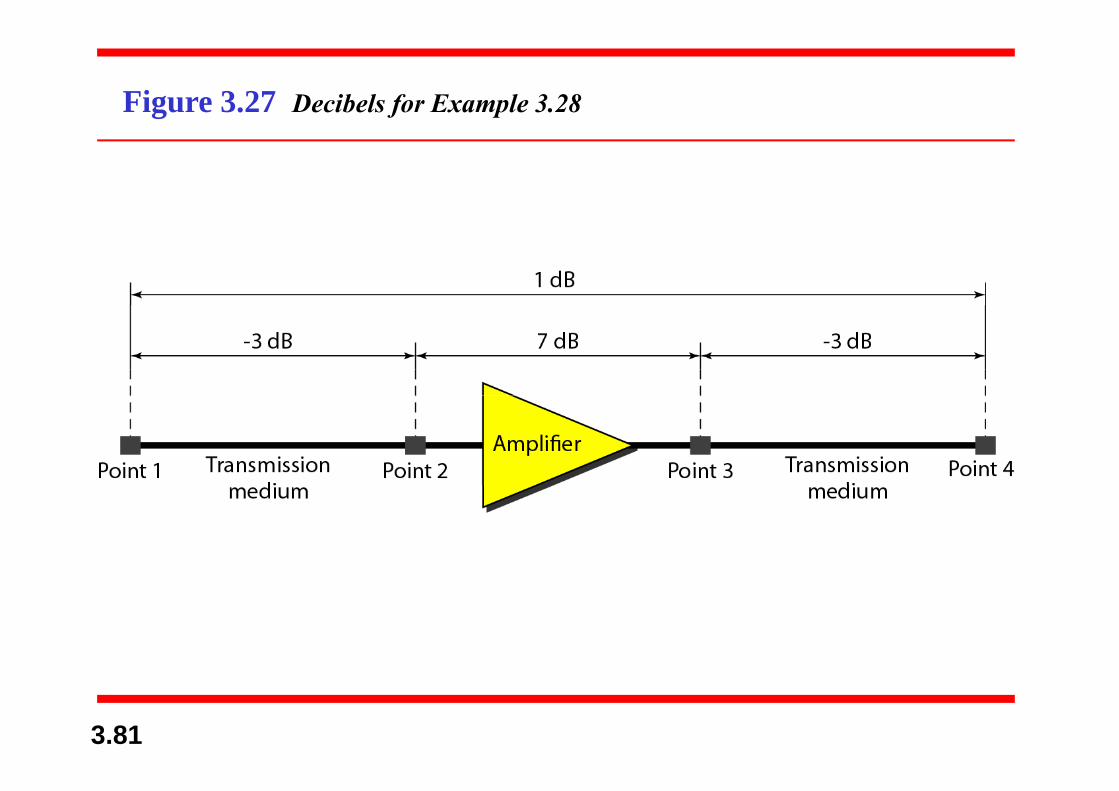
Figure 3.27 Decibels for Example 3.28
3.81

Example 3.29
Sometimes the decibel is used to measure signal powerSometimes the decibel is used to measure signal powerin milliwatts. In this case, it is referred to as dBm and iscalculated as dB = 10 log10 P where P is the powercalculated as dBm = 10 log10 Pm , where Pm is the powerin milliwatts. Calculate the power of a signal with dBm =−30−30.
SolutionSolutionWe can calculate the power in the signal as
3.82
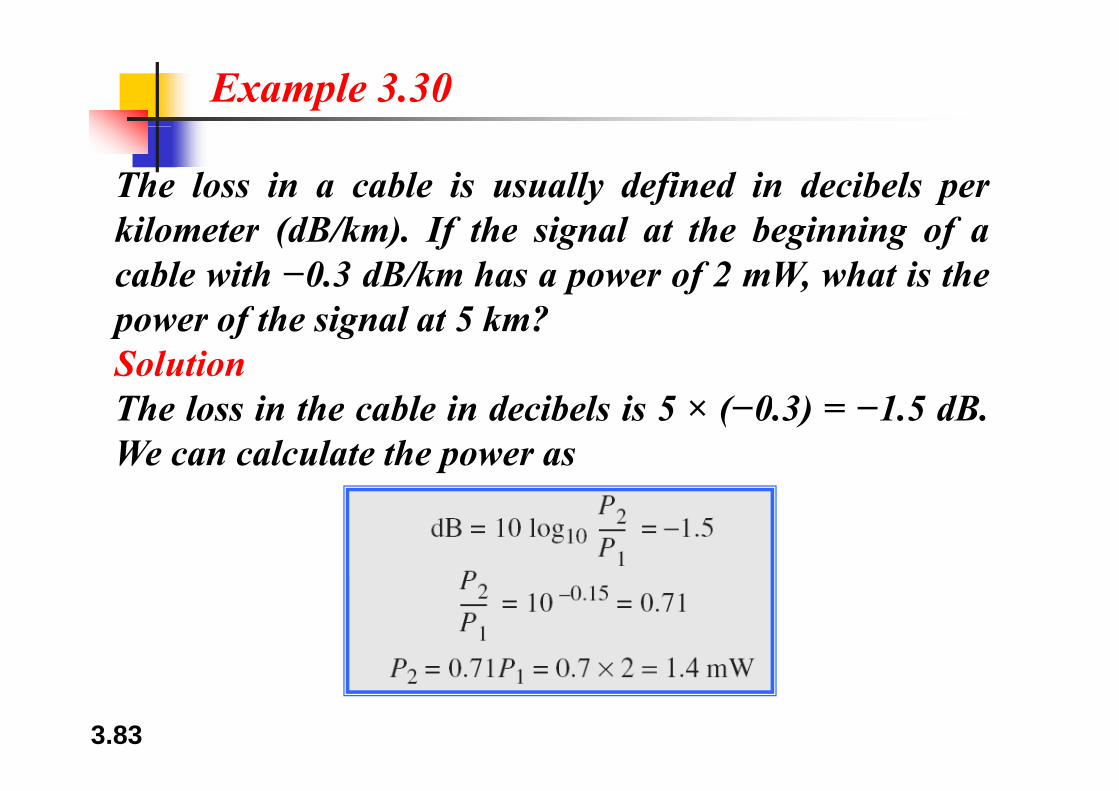
Example 3.30
The loss in a cable is usually defined in decibels perkilometer (dB/km). If the signal at the beginning of acable with −0.3 dB/km has a power of 2 mW, what is the
f h i l k ?power of the signal at 5 km?Solution
h l i h bl i d ib l i ( 0 3) 1 dThe loss in the cable in decibels is 5 × (−0.3) = −1.5 dB.We can calculate the power as
3.83

Figure 3.28 Distortion
3.84
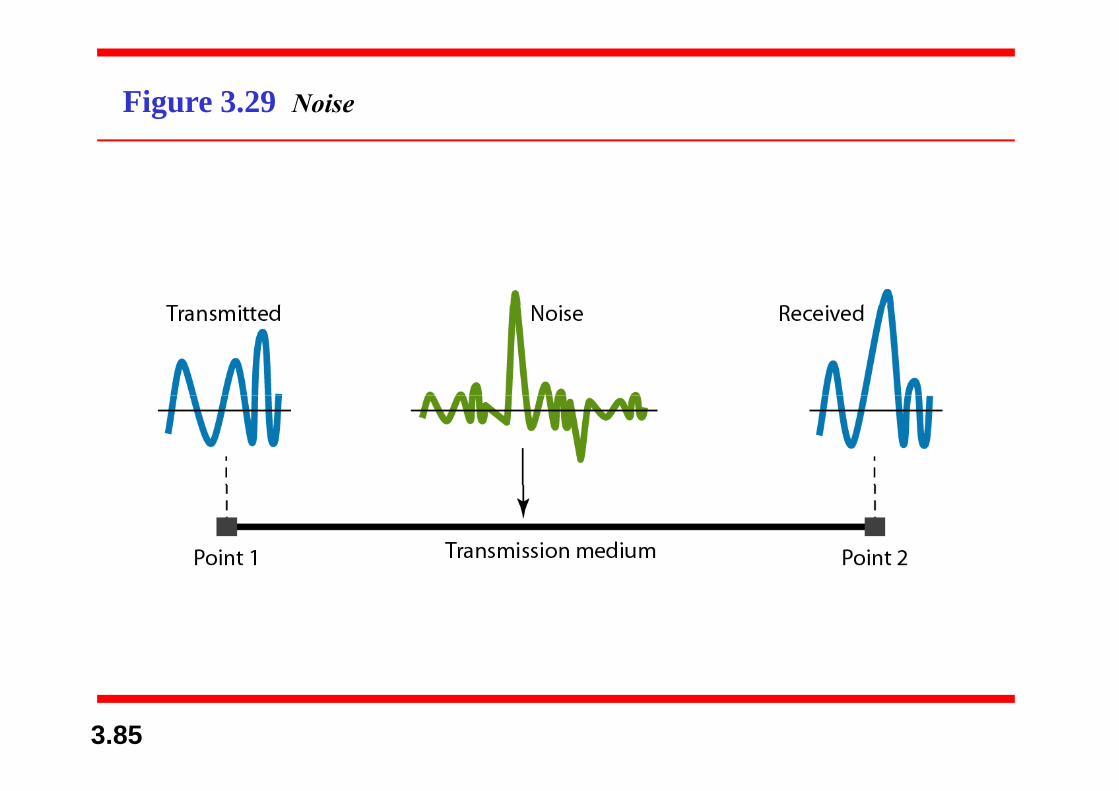
Figure 3.29 Noise
3.85

Example 3.31
The power of a signal is 10 mW and the power of theThe power of a signal is 10 mW and the power of thenoise is 1 μW; what are the values of SNR and SNRdB ?
SolutionThe values of SNR and SNR can be calculated asThe values of SNR and SNRdB can be calculated asfollows:
3.86

Example 3.32
The values of SNR and SNR for a noiseless channelThe values of SNR and SNRdB for a noiseless channelare
We can never achieve this ratio in real life; it is an ideal.
3.87
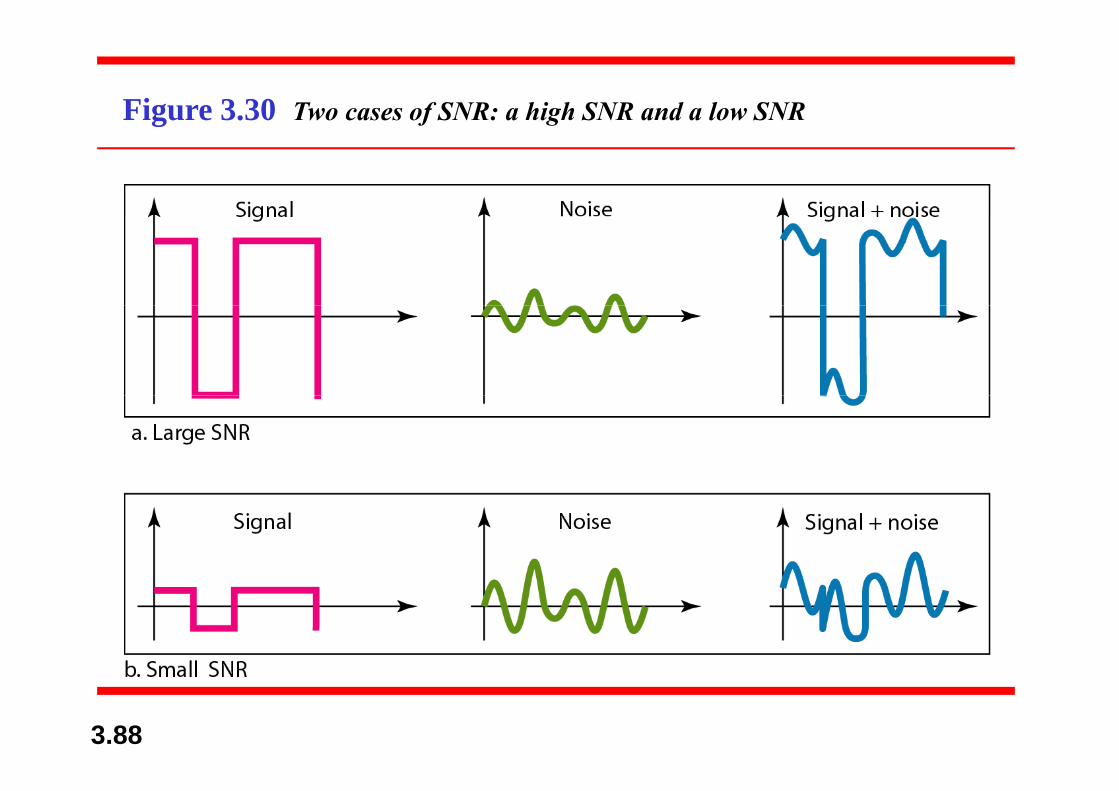
Figure 3.30 Two cases of SNR: a high SNR and a low SNRg
3.88

33--5 5 DATA RATE LIMITSDATA RATE LIMITS
AA veryvery importantimportant considerationconsideration inin datadata communicationscommunicationsisis howhow fastfast wewe cancan sendsend datadata inin bitsbits perper secondsecond overover aaisis howhow fastfast wewe cancan sendsend data,data, inin bitsbits perper second,second, overover aachannelchannel.. DataData raterate dependsdepends onon threethree factorsfactors::
11 TheThe bandwidthbandwidth availableavailable11.. TheThe bandwidthbandwidth availableavailable22.. TheThe levellevel ofof thethe signalssignals wewe useuse33 TheThe qualityquality ofof thethe channelchannel (the(the levellevel ofof noise)noise)33.. TheThe qualityquality ofof thethe channelchannel (the(the levellevel ofof noise)noise)
Noiseless Channel: Nyquist Bit RateTopics discussed in this section:Topics discussed in this section:Noiseless Channel: Nyquist Bit RateNoisy Channel: Shannon CapacityUsing Both Limits
3.89

Note
Increasing the levels of a signal may
Note
Increasing the levels of a signal may reduce the reliability of the system.
3.90
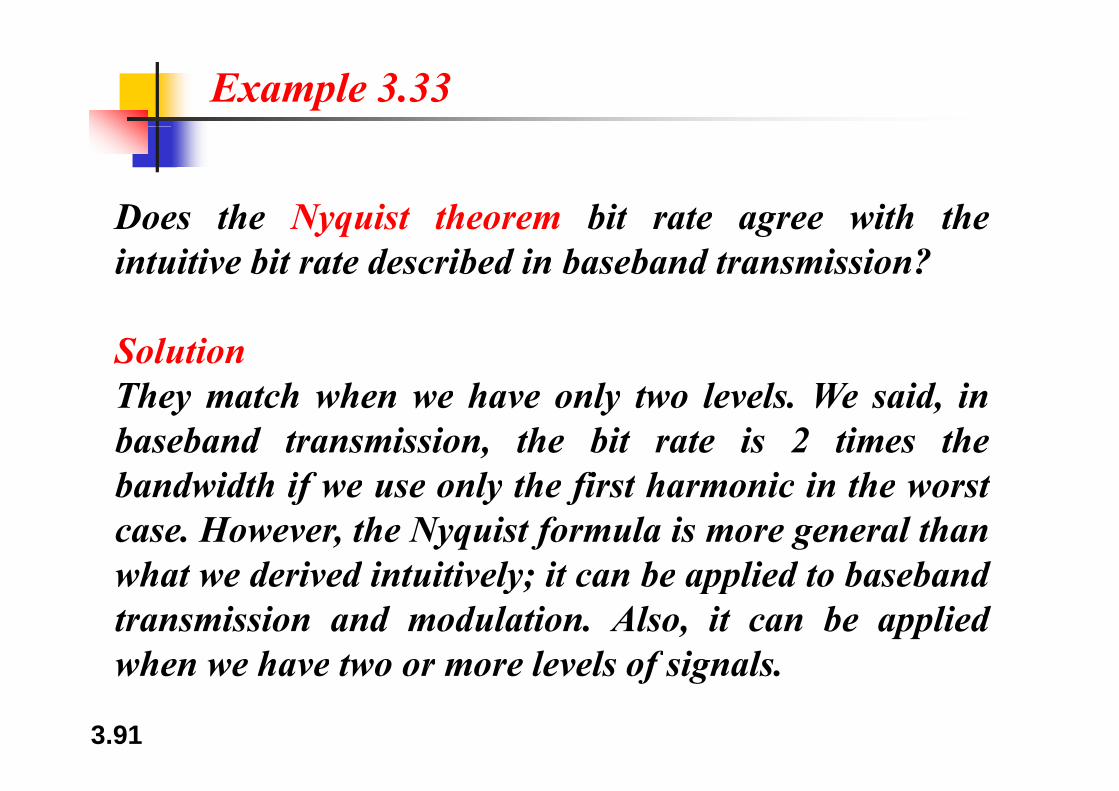
Example 3.33
Does the Nyquist theorem bit rate agree with theDoes the Nyquist theorem bit rate agree with theintuitive bit rate described in baseband transmission?
SolutionThey match when we have only two levels We said inThey match when we have only two levels. We said, inbaseband transmission, the bit rate is 2 times thebandwidth if we use only the first harmonic in the worstbandwidth if we use only the first harmonic in the worstcase. However, the Nyquist formula is more general thanwhat we derived intuitively; it can be applied to basebandwhat we derived intuitively; it can be applied to basebandtransmission and modulation. Also, it can be appliedwhen we have two or more levels of signals
3.91
when we have two or more levels of signals.
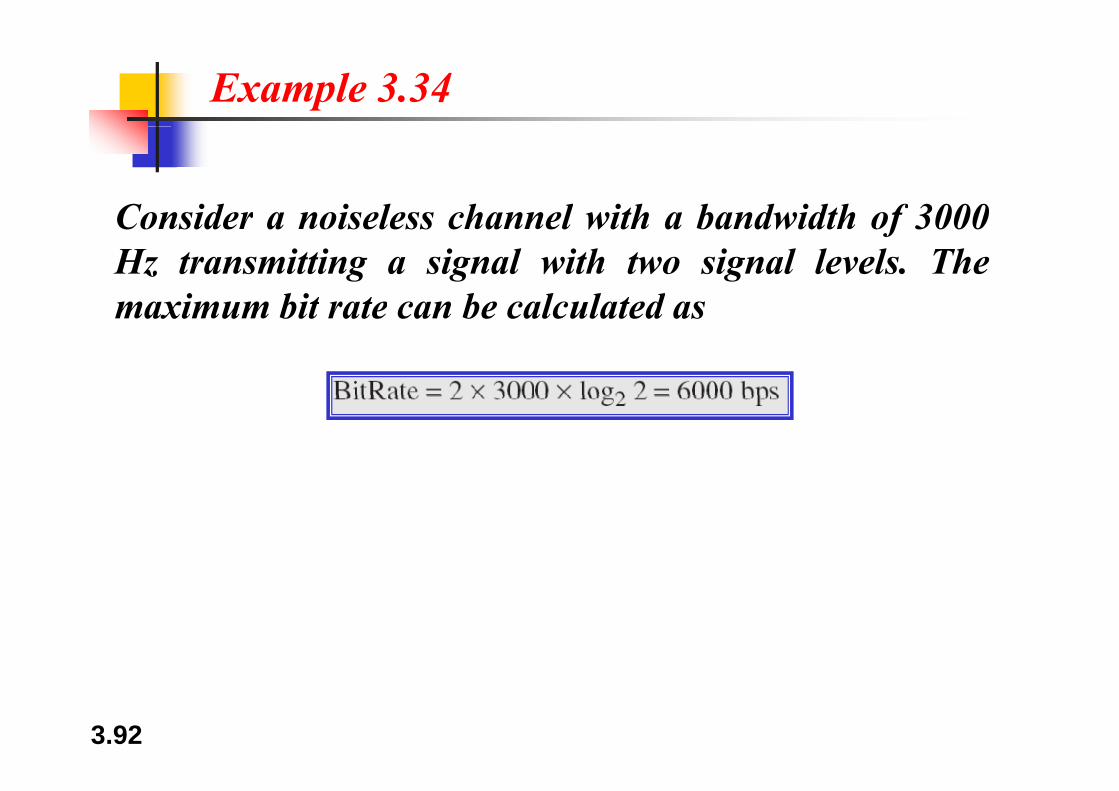
Example 3.34
Consider a noiseless channel with a bandwidth of 3000Consider a noiseless channel with a bandwidth of 3000Hz transmitting a signal with two signal levels. Themaximum bit rate can be calculated asmaximum bit rate can be calculated as
3.92
Example 3.35
Consider the same noiseless channel transmitting aConsider the same noiseless channel transmitting asignal with four signal levels (for each level, we send 2bits). The maximum bit rate can be calculated asbits). The maximum bit rate can be calculated as
3.93

Example 3.36
We need to send 265 kbps over a noiseless channel withWe need to send 265 kbps over a noiseless channel witha bandwidth of 20 kHz. How many signal levels do weneed?need?SolutionWe can use the Nyquist formula as shown:We can use the Nyquist formula as shown:
Since this result is not a power of 2, we need to eitherincrease the number of levels or reduce the bit rate. If wehave 128 levels, the bit rate is 280 kbps. If we have 64
3.94levels, the bit rate is 240 kbps.
Example 3.37
Consider an extremely noisy channel in which the valueConsider an extremely noisy channel in which the valueof the signal-to-noise ratio is almost zero. In otherwords, the noise is so strong that the signal is faint. Forwords, the noise is so strong that the signal is faint. Forthis channel the capacity C is calculated as
This means that the capacity of this channel is zeroregardless of the bandwidth. In other words, we cannotreceive any data through this channel.
3.95

Example 3.38
We can calculate the theoretical highest bit rate of aregular telephone line. A telephone line normally has abandwidth of 3000. The signal-to-noise ratio is usually3162. For this channel the capacity is calculated as
This means that the highest bit rate for a telephone lineis 34 860 kbps If we want to send data faster than thisis 34.860 kbps. If we want to send data faster than this,we can either increase the bandwidth of the line orimprove the signal-to-noise ratio
3.96
improve the signal-to-noise ratio.

Example 3.39
The signal-to-noise ratio is often given in decibels.Assume that SNRdB = 36 and the channel bandwidth is 2MHz. The theoretical channel capacity can be calculatedas
3.97
Example 3.40
For practical purposes, when the SNR is very high, weo p actical pu poses, when the SN is ve y high, wecan assume that SNR + 1 is almost the same as SNR. Inthese cases, the theoretical channel capacity can bet ese cases, t e t eo etical c a el capacity ca besimplified to
F l l l h h i l i fFor example, we can calculate the theoretical capacity ofthe previous example as
3.98

Example 3.41
We have a channel with a 1-MHz bandwidth. The SNRfor this channel is 63. What are the appropriate bit rateand signal level?
SolutionFirst, we use the Shannon formula to find the upperlimit.
3.99
Example 3.41 (continued)
The Shannon formula gives us 6 Mbps, the upper limit.For better performance we choose something lower, 4Mbps, for example. Then we use the Nyquist formula tofind the number of signal levels.
3.100
Note
The Shannon capacity gives us the upper limit; the Nyquist formula tells usupper limit; the Nyquist formula tells us
how many signal levels we need.
3.101

NextNext
3.102

33--6 6 PERFORMANCEPERFORMANCE
OneOne importantimportant issueissue inin networkingnetworking isis thethe performanceperformance ofofthth t kt k hh dd ii it?it? WW didi litlit ffthethe networknetwork——howhow goodgood isis it?it? WeWe discussdiscuss qualityquality ofofservice,service, anan overalloverall measurementmeasurement ofof networknetwork performance,performance,ii tt d t ild t il ii Ch tCh t 2424 II thithi titiinin greatergreater detaildetail inin ChapterChapter 2424.. InIn thisthis section,section, weweintroduceintroduce termsterms thatthat wewe needneed forfor futurefuture chapterschapters..
BandwidthTopics discussed in this section:Topics discussed in this section:BandwidthThroughputLatency (Delay)
3.103
Bandwidth-Delay Product

Note
In networking, we use the term bandwidth in two contexts.bandwidth in two contexts.
❏ The first, bandwidth in hertz, refers tothe range of frequencies in athe range of frequencies in acomposite signal or the range offrequencies that a channel can passfrequencies that a channel can pass.
❏ The second bandwidth in bits per❏ The second, bandwidth in bits persecond, refers to the speed of bittransmission in a channel or link.
3.104
transmission in a channel or link.

Example 3.42
The bandwidth of a subscriber line is 4 kHz for voice orThe bandwidth of a subscriber line is 4 kHz for voice ordata. The bandwidth of this line for data transmissioncan be up to 56 000 bps using a sophisticated modem tocan be up to 56,000 bps using a sophisticated modem tochange the digital signal to analog.
3.105
Example 3.43
If the telephone company improves the quality of the linef p p y p q y fand increases the bandwidth to 8 kHz, we can send112,000 bps by using the same technology as mentioned, p y g gyin Example 3.42.
3.106
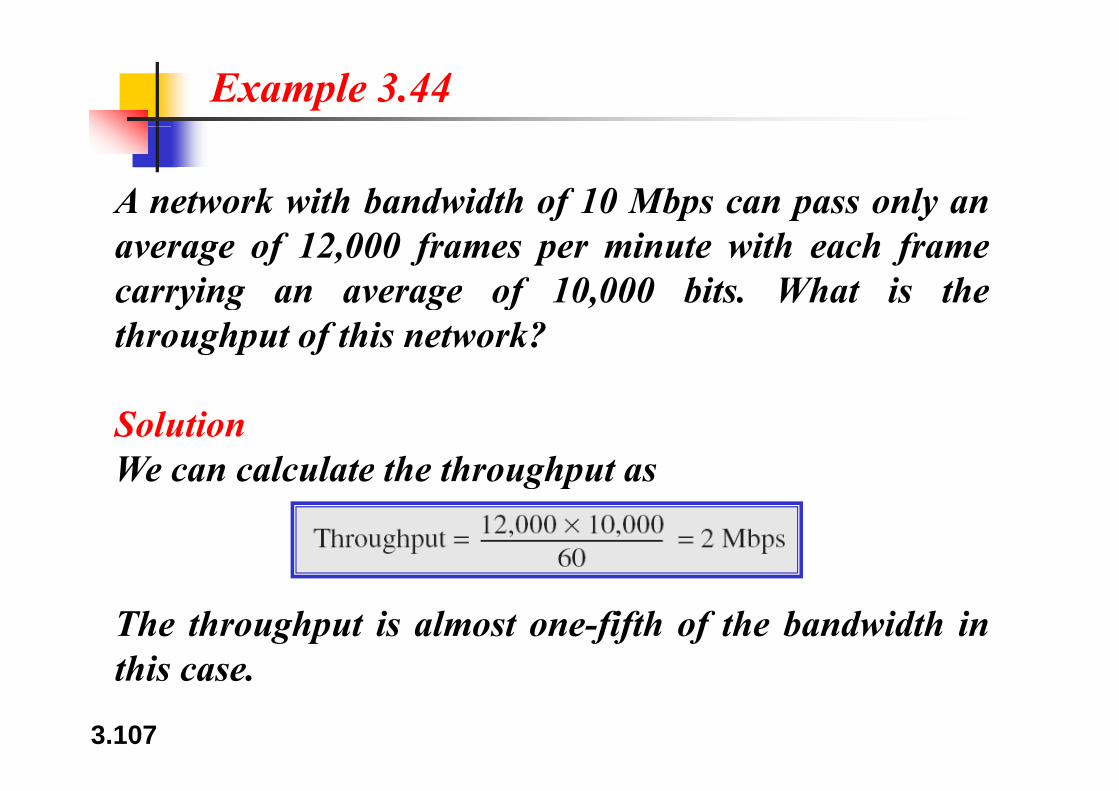
Example 3.44
A network with bandwidth of 10 Mbps can pass only anf p p yaverage of 12,000 frames per minute with each framecarrying an average of 10,000 bits. What is they g g f ,throughput of this network?
SolutionWe can calculate the throughput asg p
The throughput is almost one-fifth of the bandwidth inthis case
3.107
this case.
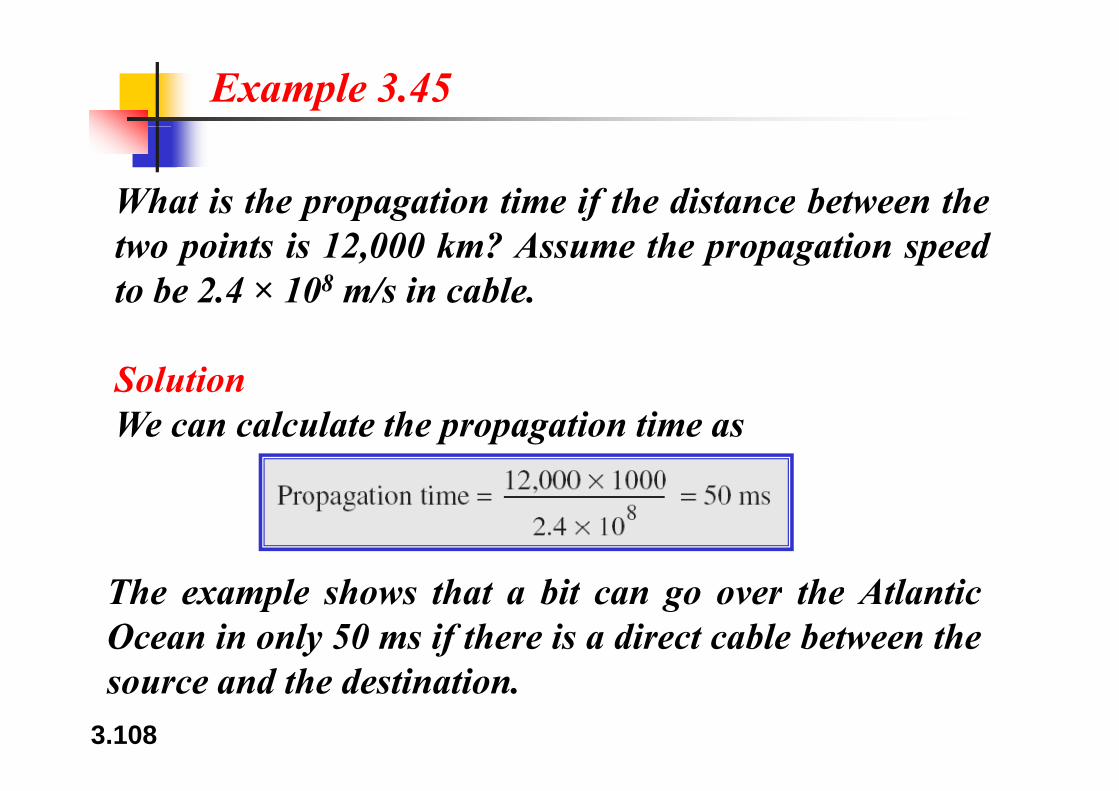
Example 3.45
What is the propagation time if the distance between thep p g ftwo points is 12,000 km? Assume the propagation speedto be 2.4 × 10⁸ m/s in cable.
SolutionWe can calculate the propagation time as
The example shows that a bit can go over the AtlanticOcean in only 50 ms if there is a direct cable between the
3.108
source and the destination.

Example 3.46
What are the propagation time and the transmissionp p gtime for a 2.5-kbyte message (an e-mail) if thebandwidth of the network is 1 Gbps? Assume that thef pdistance between the sender and the receiver is 12,000km and that light travels at 2.4 × 10⁸ m/s.g
SolutionWe can calculate the propagation and transmission timeas shown on the next slide:
3.109

Example 3.46 (continued)
Note that in this case, because the message is short andgthe bandwidth is high, the dominant factor is thepropagation time, not the transmission time. Thep p gtransmission time can be ignored.
3.110
Example 3.47
What are the propagation time and the transmissionp p gtime for a 5-Mbyte message (an image) if the bandwidthof the network is 1 Mbps? Assume that the distancef pbetween the sender and the receiver is 12,000 km andthat light travels at 2.4 × 10⁸ m/s.g
SolutionWe can calculate the propagation and transmissiontimes as shown on the next slide.
3.111
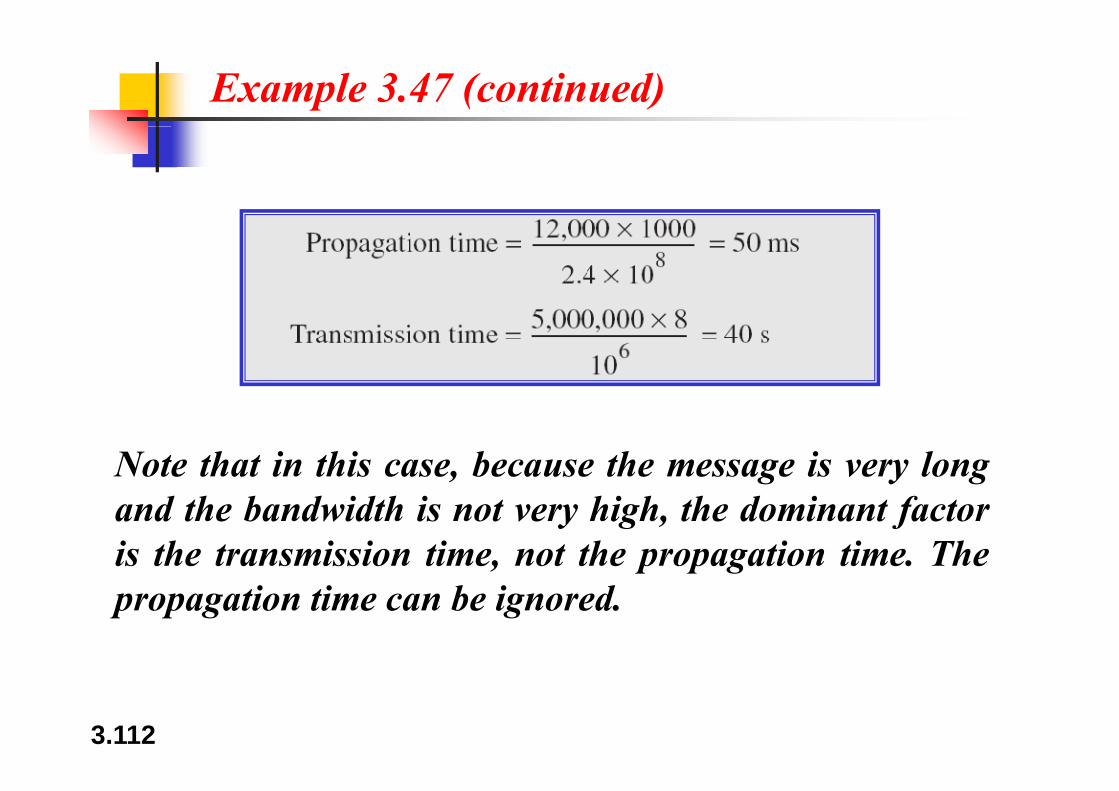
Example 3.47 (continued)
Note that in this case, because the message is very longand the bandwidth is not very high, the dominant factoris the transmission time, not the propagation time. Thepropagation time can be ignored.
3.112
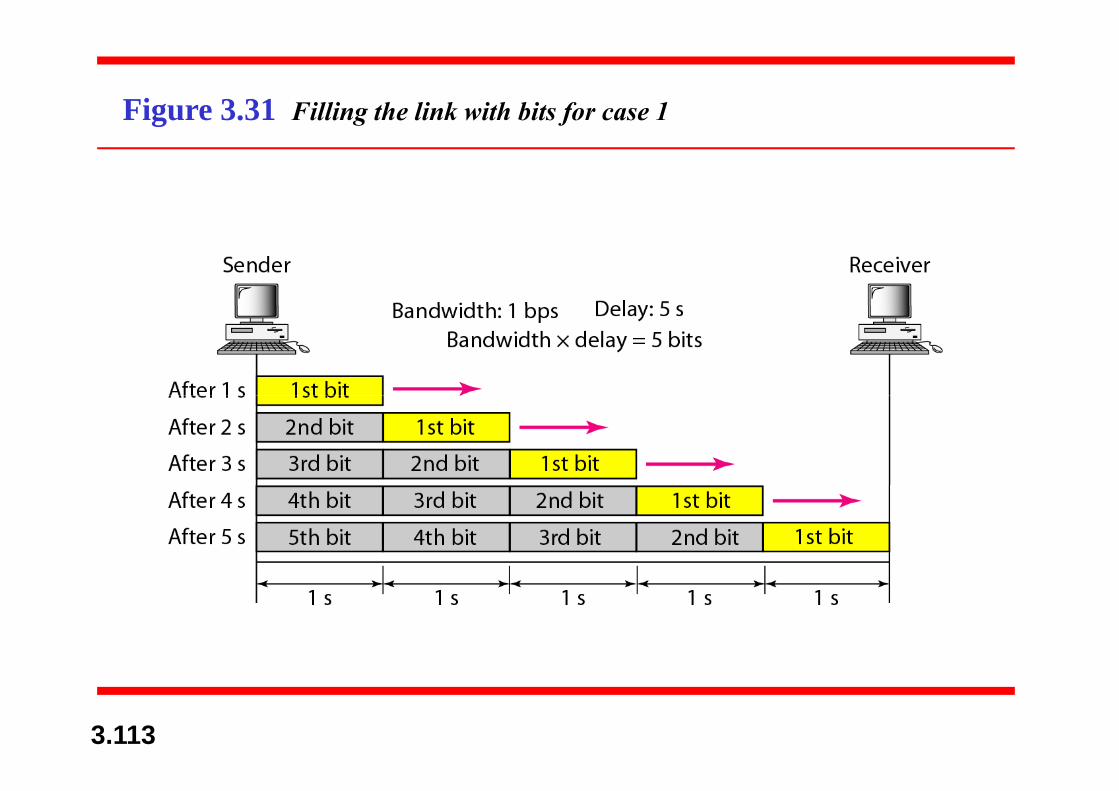
Figure 3.31 Filling the link with bits for case 1g
3.113

Example 3.48
We can think about the link between two points as aWe can think about the link between two points as apipe. The cross section of the pipe represents thebandwidth and the length of the pipe represents thebandwidth, and the length of the pipe represents thedelay. We can say the volume of the pipe defines thebandwidth delay product as shown in Figure 3 33bandwidth-delay product, as shown in Figure 3.33.
3.114

Figure 3.32 Filling the link with bits in case 2
3.115

Note
The bandwidth-delay product defines the number of bits that can fill the linkthe number of bits that can fill the link.
3.116
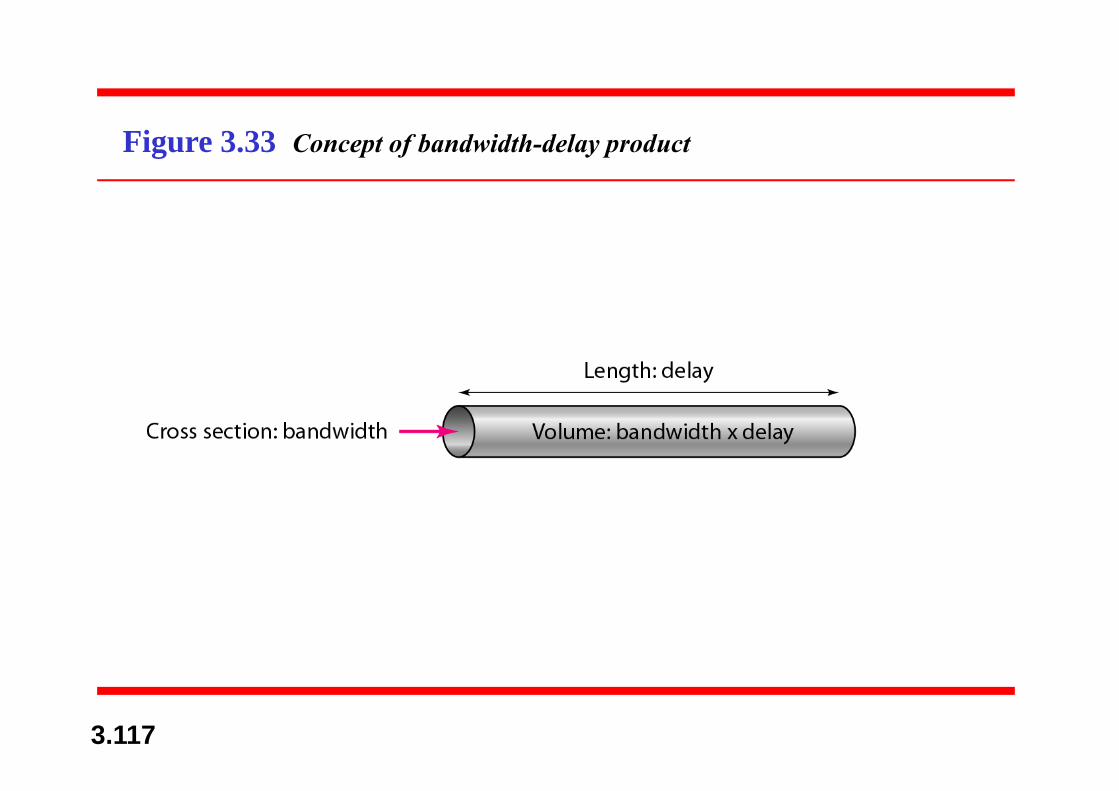
Figure 3.33 Concept of bandwidth-delay product
3.117


![Chapter 5 Analog Transmission - Kasetsart Universityplw/dccn/presentation/ch05.pdf · Microsoft PowerPoint - ch05.ppt [Compatibility Mode] Author: Noi Created Date: 6/18/2009 10:41:24](https://img.dokumen.tips/doc/110x75/5b00e4c57f8b9a84338d53ba/chapter-5-analog-transmission-kasetsart-university-plwdccnpresentationch05pdfmicrosoft.jpg)


![Chapter 7 Transmission Media - Kasetsart Universityplw/dccn/presentation/ch07.pdf · Microsoft PowerPoint - ch07.ppt [Compatibility Mode] Author: Noi Created Date: 6/18/2009 10:42:51](https://img.dokumen.tips/doc/110x75/5a7dfddc7f8b9ae9398e18d7/chapter-7-transmission-media-kasetsart-university-plwdccnpresentationch07pdfmicrosoft.jpg)


