Embed Size (px)
Citation preview

1
CHAPTER 1: ORIENTATION
1.1 Introduction
Effective supply chain management (SCM) has become a potentially valuable way of
securing competitive advantage and improving organizational performance since
competition is no longer between organizations, but among supply chains (Li et al.,
2006). Therefore, organizations have begun to realize that it is not enough to improve
efficiencies within an organization, but their whole supply chain has to be made
competitive. The understanding and practicing of supply chain management has
become an essential prerequisite for staying competitive in the global race and for
enhancing profitably (Tan et al., 2002).
This chapter comprises the general overview of manufacturing industries in Ethiopia,
research objectives, problem statement and research questions. It also contains
research hypotheses, significance and delimitations of the study.
1.2 General overview of Manufacturing Industries in Ethiopia
The history of industrial enterprises in Ethiopia is a very short one in view of the nations
early civilization and independence dating back over three thousand years (Daniel,
2006). Modern manufacturing was introduced to the Ethiopian economy towards the
end of the 19th century with the emergence of a strong central government and political
stability. Its introduction was more facilitated by the completion of the Ethio – Djibouti
rail way (B & M Development Consultants PLC., 2004).
In Ethiopia, the manufacturing industry is classified as large and medium scale
industries (LMSMI), mining and quarrying, small scale industries and handicrafts,
electricity and water, and construction sectors. According to the Ethiopian ministry of
Industry, manufacturing firms with paid up capital of more than Ethiopian birr 500,000
(around 30,000 US dollar) are classified as medium and large. The share of the

2
manufacturing industry to GDP has been in the range of 9 and 11 percent since the
early 1960s (EEA, 2006). This indicates that the development of the sector is yet in its
infancy. As a result, the sector forms only a small part of the economy; because of this
the country's industrial base is very low. Moreover, the sector is heavily dependent on
imports of semi-processed goods, raw materials, spare -parts and fuel.
Comparatively the contribution of the industrial sector, particularly manufacturing, to the
overall national income is one of the lowest in the world. In 2003/04 the industrial
contribution composed of manufacturing, construction, mining and electricity was only
about 11.4% of the GDP and that of manufacturing sector was only about 6.4% of the
GDP. On the other hand in 2003, the industrial sector of Sub Saharan African countries
and the world had an average share of about 29% and 28% respectively which implies
that Ethiopia is one of the least industrialized economies in Sub-Saharan Africa and the
world at large (EEA, 2005).
As far as the industrial growth is concerned over the past two decades, the trend of
growth in the sector was lethargic and changing at an insignificant rate. From 1991/92
to 2003/04 the sector was growing at an average growth rate of 6.1% annually and
similar average growth rate was also recorded in the manufacturing sector whereby it
grew at an average rate of 7.1% within the specified period (EEA, 2005).
Currently, the contribution of the manufacturing industry to the overall national income is
one of the lowest in the world. According to the Ethiopian National Bank Annual Report
(2007/08), in 2007/2008, the contribution of industry composed of manufacturing,
construction, mining and electricity was only about 11.6 percent of the GDP and that of
the manufacturing sector was only about 6.4 percent of the GDP.
According to the Central Statistics Agency (2010) LMSMI survey report, the total
number of large and medium scale manufacturing establishments in the country as a
whole stood at 2203 in 2008/2009. This shows an increase of 273 establishments or
14.1 percent compared to that of the previous year (see table 1.1). For the country as a
whole, establishments classified under manufacture of Other Non-Metallic Mineral
Products industrial group constituted the largest share accounting for 27.6 percent of
the total. The output of these industries include: glass and glass products, structural

3
clay products, cement, lime and plaster and article of concrete, cement and plaster
among others. Manufactures of food products and beverages, and furniture which
represented 25.5 and 16.5 percent of the total number of establishments respectively,
were in second and third position. That means the share of the three industrial groups
combined was 69.6 percent of the total number of manufacturing industries indicating
that the Ethiopian large and medium scale manufacturing industry is characterized by a
high concentration of a limited range of manufacturing activities.
On the other hand, the distribution of large and medium scale manufacturing industries
by regional states of the country is notably unbalanced. More than forty percent of the
total number of large and medium scale manufacturing industries, which were operating
in the reference year, were located in Addis Ababa. There were 148,817 employees in
the sector and the number of employees showed an increase of 12.9 percent compared
to that of the previous year. The increase in the number of employees could be
attributed to the increase in the number of establishments covered in the year
2008/2009.
The percentage distribution of value added, which indicates the contribution level of
large and medium scale manufacturing industries, to the total value added in the
manufacturing sector by industrial groups is also given for the year 2008/2009 (CSA
2010) (see Table 1.1).

4
Table 1.1 Number of LMSMI establishments, employees and gross value added of
production (2008/09).
s/n Major Industrial Group
No. of
establishments
No. of
employees
Value
added
in % Number % Number %
1 Food Products and Beverages 562 25.5 44,957 30.21 37.2
2 Tobacco Products 1 0.0 1,122 0.75 4.9
3 Textiles and textile products 88 4.0 25,863 17.38 5.7
4 Lather and lather products 89 4.0 8,750 5.88 2.9
5 Wood and Products of Wood, Except
Furniture
48 2.2 2,111 1.42 0.4
6 Paper Products and Printing 127 5.8 8,822 5.93 5.7
7 Chemicals and Chemical Products 75 3.4 8,031 5.40 8.9
8 Rubber and Plastic Products 87 3.9 11,958 8.04 5.9
9 Non-Metallic Mineral Products 608 27.6 19,790 13.30 16.4
10 Basic metals and engineering, N.E.C. 155 7.0 9,468 6.36 9.6
11 Furniture and N.E.C. 363 16.5 7,945 5.34 2.4
Total 2,203 100.0 148,817 100.0 100.0
Source: WWW.CSA.gov.et.
Note: - N.E.C. - Not Elsewhere Classified
1.3 Basic Metal and Engineering Industries (BMEIs) in Ethiopia
The types of industries covered under this study are large and medium sized public and
private BMEIs located within the radius of 50Km of the capital Addis Ababa. Large and
medium establishments of BMEIs considered for the study are those industries which
engage ten persons and above and use power-driven machinery. According to the
survey conducted by the Ethiopia Central Statistical Agency (2010), the total number of
LMSMI under the BMEI sub-sector around Addis Ababa and in the different regional

5
states of the country was 71 and 84 respectively. The numbers of industries which are
the focus of this study are classified in major groups as shown in Table 1.2.
Table 1.2: Distribution of large and medium public and private BMEIs, around the capital
Addis Ababa and the rest of the country’s Regional States, (2008/2009).
ISIC No.
Major BMEI sub-group
No. of BMEIs in Ethiopia Total No. of
BMEIs in Ethiopia
Addis Ababa Regional
states
27 Manufacture of Basic Iron and Steel
13 5 18
28
Manufacture of Fabricated Metal Products Except Machinery and Equipment
45 75 120
29 Manufacture of Machinery and Equipment N.E.C.
3 2 5
34 Manufacture of Motor Vehicles, Trailers and Semi-Trailers
10 2 12
Total 71 84 155
Source: - Central Statistical Agency, Report on LMSMI, 2009.
Note: - ISIC No. is International Standard Industrial Classification number of all
Economic Activities, Revision 3.1.
Asmamaw and Zelalem (2009) indicated that basic metals and engineering industries
play a vital role in enhancing the economic development of both developing and
developed countries. The value of metals processing as a development tool is based on
the principles that it helps enhance the rate of foreign exchange earnings by promoting
standard quality product exports; create jobs and increase income as well as offering an
opportunity of technology transfers to the country.
Over the years Ethiopian basic metals and engineering industries were limited in
achieving these objectives due to many reasons. There has been minimal benefit

6
created with a net drain on government resources. However, during the last five years,
the basic metal and engineering sector in Ethiopia is growing relatively well following the
consistent economical growth of the nation. Though there is a rapid development in the
sector, the benefit obtained is still low.
1.4 Research Objectives
The study has the following objectives:-
a. To assess the level of practical implementation of SCM practices in Ethiopian
BMEIs,
b. To analyze the relationship between SCM practices and organizational performance
in BMEIs,
c. Based on the research findings, to provide recommendations that could be helpful to
improve the organizational performance of BMEIs.
d. To create awareness about the concept of SCM and its practices in Ethiopian
BMEIs,
1.5 Problem statement
Ethiopian basic metals and engineering industries have serious weaknesses and facing
obstacles hampering their productivity and competitiveness. Most of the these
manufacturing industries are plagued with the problem of low financial and managerial
capacity, lack of machineries and facilities, inability to satisfy customer demands, and
shortage of highly qualified workers. Moreover, they have poor or under capacity
utilization and low level of total resource productivity. Even if the contribution of the
sector to import-substitution has increased over the last few years, the unexploited
potential, low market share of the manufacturing industry and unutilized capacity show
that there is a lot that remains to be done.
Thus, one of the problems which contributed a lot towards the above limitations and
backwardness of the sector could be the lack of conceptual framework and basic

7
knowledge of SCM amongst the business practitioners. Moreover, even though some of
the practitioners have realized the importance of SCM, they lack an understanding of
what constitutes a comprehensive set of SCM practices.
In this regard, the researcher could hardly find studies related to the know-how and
implementation of SCM practices as well as their impact on organizational performance
in Ethiopian basic metals and engineering industries. Therefore, the researcher needed
to study commonly advocated SCM practices used in previous researches Li et al.,
(2005), Li et al., (2006), Lori et al., (2011) that include strategic supplier partnership,
customer relationship, degree of information sharing as well as internal lean practices in
Ethiopian BMEIs.
1.6 Research questions
Considering the above stated research problem, the following major research questions
are established.
a. To what extent do the Ethiopian BMEIs implement supply chain management
practices?
b. Is there any relationship between supply chain management practices and
organizational performance in Ethiopian BMEIs?
1.7 Research hypotheses
According to Leedy et al., (2010), the research hypothesis is a reasonable conjecture,
an educated guess and its purpose is to provide a temporary objective, an operational
target, a logical framework that guides researchers as they collect and analyze data.
Therefore, based on the above mentioned literature and research problem the following
null (Ho) and research hypothesis (Ha) were used in the study:
Ho1: Strategic supplier partnership practice is not weak in Ethiopian BMEIs.
Ha1: Strategic supplier partnership practice is weak in Ethiopian BMEIs.

8
Ho2: Customer relationship practice is not weak in Ethiopian BMEIs.
Ha2: Customer relationship practice is weak in Ethiopian BMEIs.
Ho3: Information sharing practice is not weak in Ethiopian BMEIs.
Ha3: Information sharing practice is weak in Ethiopian BMEIs.
Ho4: Internal lean practice is not weak in Ethiopian BMEIs.
Ha4: Internal lean practice is weak in Ethiopian BMEIs.
Ho5: There is no relationship between the strategic supplier partnership and
organizational performance in Ethiopian BMEIs.
Ha5: There is relationship between the strategic supplier partnership and organizational
performance in Ethiopian BMEIs.
Ho6: There is no relationship between the customer relationship and organizational
performance in Ethiopian BMEIs.
Ha6: There is relationship between the customer relationship and organizational
performance in Ethiopian BMEIs.
Ho7: There is no relationship between information sharing and organizational
performance in Ethiopian BMEIs.
Ha7: There is relationship between information sharing and organizational performance
in Ethiopian BMEIs.
Ho8: There is no relationship between internal lean practice and organizational
performance in Ethiopian BMEIs.
Ha8: There is relationship between internal lean practice and organizational
performance in Ethiopian BMEIs.
1.8 Significance of the study
The significance of this research is to establish a conceptual framework and enhance
the level of understanding about supply chain management practices in BMEI members
in Ethiopia.
Moreover, the researcher believes that the study has explored how strategic supplier
partnership, customer relationship, information sharing and internal lean practices have
influenced the organizational performance of BMEIs. The research also points a way to

9
solve the problems encountered by BMEIs related to supply chain management which
ultimately help them to increase their contribution to import-substitution and GDP.
1.9 Delimitations of the study
This study is focused on the impact of supply chain management practices on those
large and medium scale basic metal and engineering industries’ organizational
performance situated within a 50km radius of the Ethiopian capital, Addis Ababa. The
total numbers of these industries under public and private ownership inside the
specified area are 71 (Central Statistics Agency, 2010).
BMEIs related to the Ministry of National Defense and other BMEIs located out of 50km
radius of Addis Ababa as well as micro and small level basic metal and engineering
enterprises are not considered in this research. The study is also limited to
manufacturers of basic iron and steel, manufacturing of fabricated metal products
except machinery and equipment, machinery and equipment manufacturers, and
manufacturers of motor vehicles, trailers and semi-trailers categorized under ISIC code
numbers 27, 28, 29 and 34 (see Table 1.2).
1.10 Definition of Terms
• Manufacturing:
According to International Standard of Industrial Classification (ISIC) Revision-3.1
manufacturing is defined as the physical or chemical transformation of materials or
components into new products, whether the work is performed by power-driven
machines or by hand, whether it is done in a factory or in the worker’s home, and
whether the products are sold at wholesale or retail. The assembly of the component
parts of manufactured products is also considered as manufacturing activities.
• Basic Metal and Engineering Industries (BMEIs):
BMEIs are one of the sub-sectors under the manufacturing industries classifications and
engaged in production of basic Iron and steel as well as metal engineering products.

10
Manufacture of basic metals includes the activities of smelting and/or refining ferrous
and non-ferrous metals from ore, pig or scrap, using electro metallurgic and other
process of metallurgic techniques. Units in this division also manufacture metal alloys
and super-alloys by introducing other chemical elements to pure metals. The output of
smelting and refining, usually in ingot form, is used in rolling, drawing and extruding
operations to make sheet, strip, bar, rod or wire, and in molten form to make castings
and other basic metal products classified under ISIC number 27. Whereas, engineering
activities concerned in manufacture of “pure” metal products (such as parts, containers
and structures), usually with a static, immovable function classified under ISIC number
28. It also include divisions under ISIC number 29 and 34 concern combinations or
assemblies of such metal products (sometimes with other materials) into more complex
units that, unless they are purely electrical, electronic or optical, work with moving parts.
These divisions cover the manufacture of fabricated metal products, machinery and
equipment as well as motor vehicles, trailers and semi-trailers (ISIC Revision3.1, 2002).
Ethiopian basic metal industries are those industries which produce primary products,
like billets, wire road, reinforcement bars, solid round and section bars etc., by melting,
heating and rolling technology. Whereas, the engineering industries are those industries
which produce different machinery components, tools, spare parts, household utensils,
motor vehicle body manufacturers and assembly plants, etc., using their raw material
from local and foreign basic metal products. The production technology these
engineering industries use are casting, machining, welding, shearing and forging etc.
1.11 Outline of the research report
This research contains five chapters. Chapter 1 presents an overview of the study, the
research problem and research questions. Chapter 2 contains a survey of the existing
literature on SCM. Chapter 3 details the research design and methodology. Chapter 4
contains the results obtained. In Chapter 5 the results of the study are discussed, and
conclusions and recommendations on the basis of the results are made.

11
CHAPTER 2: LITRATURE REVIEW
2.1 Introduction
In this chapter, the researcher reviewed literatures which are relevant to the core theme
of the project and research title. Moreover, the researcher presents the theoretical
framework of the research.
2.2 Supply chain management (SCM) 2.2.1 The concept of supply chain
Organizations are facing different kinds of challenges in their effort of competing in
today’s dynamic global markets. To remain competitive, organizations must recognize
the importance of supply chain practices that improve not only their own organizational
performance, but also coordinate with their supply chain partners to improve their joint
performance. Yet, despite the significant advances in research and practices, many
organizations continue to struggle to understand the complex issues associated with the
coordinated planning and supply activities amongst the members of their supply
networks (Lori et al., 2011).
To understand the term SCM in depth, the term supply chain must be clarified first
before the definition of management and the role of management as a base for
complete definition of SCM is given. According to Handfield (2002), supply chain
includes internal divisions of the company as well as external suppliers that provide
input to a focal company. A supplier for one company has its own set of suppliers that
provide input (also called second tier supplier). Supply chains are essentially a series of
linked suppliers and customers until products reach the ultimate customer.
Based on a comprehensive research study conducted by several co-authors, Mentzer
(2001), consolidated the definition of “supply chain” as a set of three or more entities
(organizations or individuals) directly involved in the upstream and downstream flows of

12
products, services, finances, and/ or information from a source to a customer” (Figure
2.1).
Figure 2.1 Tiers of supply chain management
Source: Supply chain management module (MBL93HY-2011) UNISA
2.2.2 Definition of SCM
The lack of a universal definition of supply chain management is, in part, due to the way
the concept of supply chain has been developed (Simon et al., 2000). In fact, as it will
be explained in the next section, the concept of supply chain has been considered from
different points of view in related body of literature.
Stadtler and Kilger (2005) define the supply chain as a network of organizations that are
involved, through upstream and downstream linkages, in the different processes and
activities that produce value in the form of products and services in the hands of the
ultimate customer. The chain involves two or more legally separated organizations that
are linked together by material, information or financial flows and includes the ultimate
customer. Supply Chain Management has the objective of governing all parts of the
supply chain as a unit, instead of single organizational elements, in order to achieve
increased competitiveness.

13
For the purpose of meeting customer needs better than what the competitors can do,
companies have tried to design effective business models as success depends on
building processes that can design, make, and deliver the innovative, high-quality, low
cost products and services that customer demands. However, most companies lack the
necessary resources and skills. Therefore, managers are beginning to look more
proactively beyond their companies’ wall to consider how the resources of suppliers and
customers can be used to create value. These efforts to align goals, share resources,
and collaborate across company boundaries are the essence of supply chain
management (Fawcett et al., 2007). Hence, SCM has attracted the attention of many
researchers from the academicians, consultants, and business managers, over the last
two decades. It is concerned with cost effective way of managing materials, information
and financial flows from the point of origin to the point of utilization to satisfy customer
requirements (Narasimha, 2007).
According to Simchi-Levi, Kaminsky, and Simchi-Levi, (2004) SCM is defined as a set of
approaches used to efficiently integrate suppliers, manufacturers, warehouses, and
stores so that merchandise is produced and distributed at the right quantities, to the
right locations, and at the right time in order to minimize system wide costs while
satisfying service-level requirements. Despite the diversity in the way SCM is defined in
the literature, central to all these definitions is “customer satisfaction” as a shared
objective of the whole supply chain (Keivan and Peter, 2007).
Wisner et al., (2005) also observed that the practice of supply chain management is a
recent trend because many businesses are only beginning to realize the benefits and
problems that accompany an integrated supply chain. The implication is that businesses
that practice supply chain management concepts continually improve their ability to
reduce waste, decrease time, be flexible and cut costs which ensures future profitability.
However, as competitive situations, products, technology and customers change, the
priorities for the supply chain should also change. Supply chains always require being
more flexible in responding quickly to these changes.

14
2.2.3 Basic objective of supply chain management
The basic objective of supply chain management is to optimize performance of the
chain to add as much value as possible for the least cost possible. In other words, it
aims to link all the supply chain agents to jointly cooperate within the firm as a way to
maximize productivity in the supply chain and deliver the most benefits to all related
parties (Finch, 2006). Moreover, Mentzer (2001) suggested that the major importance of
SCM is as a systematic, strategic coordination of the traditional business functions
within a particular company and across businesses within the supply chain, for the
purposes of improving the long term performance of the individual companies and the
supply chain as a whole. The short-term objectives of SCM are primarily to increase
productivity and reduce inventory and cycle time, while long-term objectives are to
increase market share and profits for all members of the supply chain (Li et al., 2006).
According to Lambert, (2008) SCM offers the opportunity to capture the full potential of
intra and inter-company integration and management. Therefore, SCM deals with
business process excellence and represents a new way of managing the business and
relationships with other members of the supply chain. Lambert (2008) added that if
executives understand the supply chain management processes and how they should
be implemented, they will be able to create more integrated supply chains which will
lead to higher revenues and increased profitability for all member firms.
2.2.4 Scope of SCM
The scope of SCM has expanded over time, and its importance has increased.
Originating from purchasing and supply management, SCM research has now evolved
into a body of knowledge focusing primarily on integration, customer satisfaction and
business results. Although SCM efforts sometimes fail to achieve the desired results it is
now a strategic tool to improve competitive position and is of a major concern to top-
level managers (Kenneth, Ron & Michael, 2006). In reality, a supply chain is much more
complex than shown in Figure 2.1. For a company in the middle of the supply chain like
a consumer goods manufacturer, the supply chain looks like an uprooted tree (see
Figure 2.2) where the root system represents the supplier network and the branches of
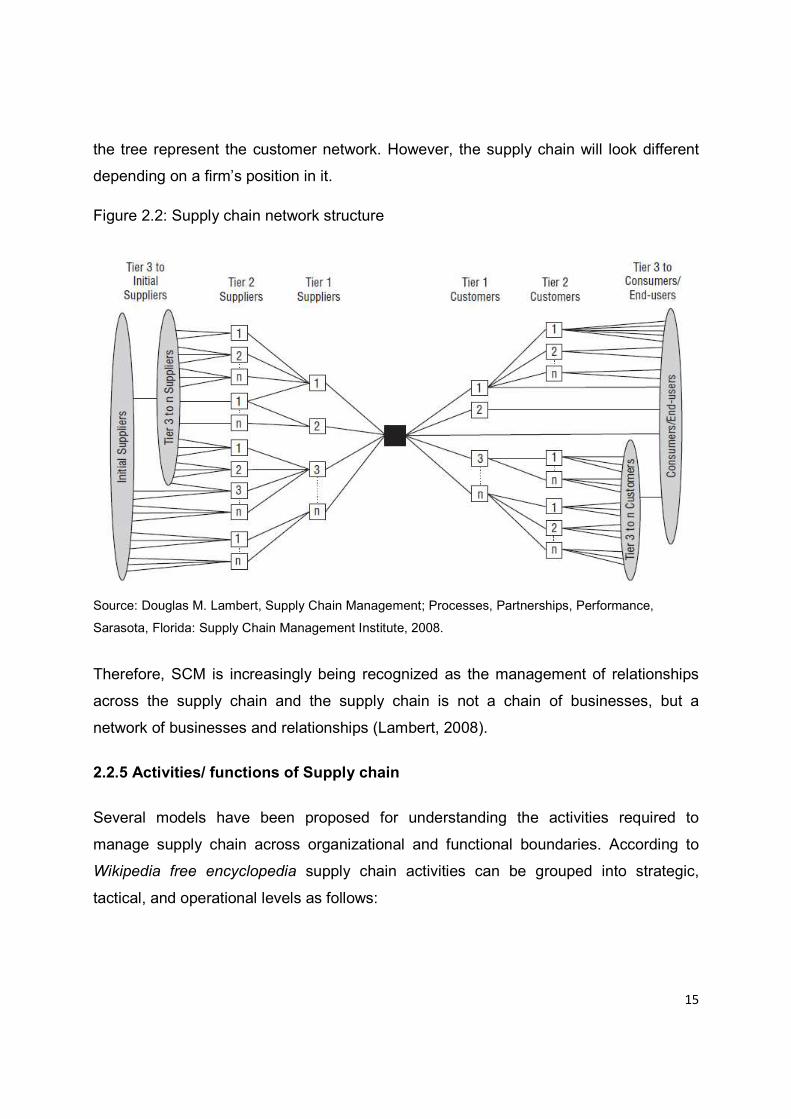
15
the tree represent the customer network. However, the supply chain will look different
depending on a firm’s position in it.
Figure 2.2: Supply chain network structure
Source: Douglas M. Lambert, Supply Chain Management; Processes, Partnerships, Performance,
Sarasota, Florida: Supply Chain Management Institute, 2008.
Therefore, SCM is increasingly being recognized as the management of relationships
across the supply chain and the supply chain is not a chain of businesses, but a
network of businesses and relationships (Lambert, 2008).
2.2.5 Activities/ functions of Supply chain
Several models have been proposed for understanding the activities required to
manage supply chain across organizational and functional boundaries. According to
Wikipedia free encyclopedia supply chain activities can be grouped into strategic,
tactical, and operational levels as follows:

16
Strategic level
• Strategic network optimization, including the number, location, and size of
warehousing, distribution centers, and facilities.
• Strategic partnerships with suppliers, distributors, and customers, creating
communication channels for critical information and operational improvements such
as cross docking, direct shipping, and third-party logistics.
• Product life cycle management, so that new and existing products can be optimally
integrated into the supply chain and capacity management activities.
• Information technology chain operations.
• Where-to-make and make-buy decisions.
• Aligning overall organizational strategy with supply strategy.
• It is for long term and needs resource commitment.
Tactical level
• Sourcing contracts and other purchasing decisions.
• Production decisions, including contracting, scheduling, and planning process
definition.
• Inventory decisions, including quantity, location, and quality of inventory.
• Transportation strategy, including frequency, routes, and contracting.
• Benchmarking of all operations against competitors and implementation of best
practices throughout the enterprise.
• Milestone payments.
• Focus on customer demand and habits.
Operational level
• Daily production and distribution planning, including all nodes in the supply chain.
• Production scheduling for each manufacturing facility in the supply chain (minute by
minute).
• Demand planning and forecasting, coordinating the demand forecast of all
customers and sharing the forecast with all suppliers.

17
• Sourcing planning, including current inventory and forecast demand, in collaboration
with all suppliers.
• Inbound operations, including transportation from suppliers and receiving inventory.
• Production operations, including the consumption of materials and flow of finished
goods.
• Outbound operations, including all fulfillment activities, warehousing and
transportation to customers.
• Order promising, accounting for all constraints in the supply chain, including all
suppliers, manufacturing facilities, distribution centers, and other customers.
• From production level to supply level accounting all transit damage cases and
arrange to settlement at customer level by maintaining company loss through
insurance company.
2.3 SCM practices
Supply chain management practices have been defined as the set of activities
undertaken in an organization to promote effective management of its supply chain. It is
also proposed to be a multi-dimensional concept, and hence viewed as a more
comprehensive concept than the narrower view (the supplier side, the internal side or
the customer side) taken in most prior researches (Li et al., 2005).
Several studies have examined SCM practices which involve various dimensions. For
example, Zhou et al., (2007) propose that SC practices consist of supply chain planning,
Just-In-Time production and delivery practices. On the other hand, Chow et al., (2008)
suggest that supply chain features, integration, and customer services are typical SCM
practices. Chin et al., (2004) viewed SCM practices rather loosely as a set of practices
consisting of customer channel, supplier channel, material flows, information technology
and corporate culture. In contrast, Chen et al., (2004) used a more structured approach
to describe SCM practices and this involves dimensions of strategic purchasing, supply
management, logistics integration and supply network coordination. Li et al., (2006)
propose that for an effective SCM the firm should consider the following practices:

18
strategic supplier partnership, customer relationship, level of information sharing, quality
of information sharing, and postponement.
Recently, organizations have identified SCM practices as a basis for enhancing
organizational performance as well as a source of competitive advantage (Hassini,
2008).
2.4 Organizational performance
Organizational performance refers to how well an organization achieves its market-
oriented goals as well as its financial goals (Yamin et al., 1999). Financial metrics have
served as a tool for comparing organizations and evaluating an organization’s behavior
over time (Holmberg, 2000). Any organizational initiative, including supply chain
management, should ultimately lead to enhanced organizational performance. A
number of prior studies have measured organizational performance using both financial
and market criteria, including Return On Investment (ROI), market share, profit margin
on sales, the growth of ROI, the growth of sales, the growth of market share, and overall
competitive position (as cited in Li et al., 2006).
There have been various definitions of organizational performance, with some studies
emphasizing operational measures, while others stressed financial measures. For
example, Li et al., (2005b) used delivery dependability and time to market as
performance measures, while firm performance defined by sales growth, market share
growth and profitability are used in other studies (Narasimhan et al., 2008; Narasimhan
and Kim, 2002). Many studies have selected a combination of pertinent operational and
financial measures to reflect overall organizational performance. For instance, Vereecke
and Muylle (2006) used factor analysis to extract five components of performance
related to delivery, cost, flexibility, procurement and quality. Tracey et al., (2005)
measure performance through four separate dimensions including perceived value,
customer loyalty, market performance and financial performance. Similarly, Tan et al.,
(2002) used six items for performance including product quality, customer service,
competitive position, market share, average selling price and return on assets. Chen

19
and Paulraj (2004a, b) used supplier performance and buyer performance to assess the
financial performance of the buying firm. Vickery et al., (2003) used customer service
performance followed by financial performance as the performance constructs. Finally,
Jin (2006) assessed operational supply chain role performance via three levels of
performance criteria: strategic, operational and financial. Strategic performance was
measured by market share and sales growth, operational performance was measured
by lead-time performance and financial performance was assessed through return on
investments and return on sales. Based on other SCM studies, organizational
performance was defined as a combination of operational and financial results relative
to competitors. The operational measures selected were commonly used to evaluate
operational excellence and measures a company’s relative performance with its main
competitors on three competitive priorities: speed, delivery and quality. Financial
performance was measured by the company’s cost and profit-related performance as
compared to their direct competitors. These metrics were commonly used to assess an
organization’s financial performance (as cited in Lori et al., 2011).
2.5 SCM practices and Organizational performance
Effective supply chain management has become a potentially valuable way of securing
competitive advantage and improving organizational performance since competition is
no longer between organizations, but among supply chains (Li et al., 2006). In their
research Li et al., (2006) had conceptualized and developed five dimensions of SCM
practices (strategic supplier partnership, customer relationship, level of information
sharing, quality of information sharing, and postponement) and tested the relationships
between these SCM practices and organizational performance (market and financial
performance). The result indicated that higher levels of SCM practice can lead to
enhanced organizational performance.
Similarly, Tracey et al., (2004) had tested the impact of supply-chain management
(SCM) capabilities on business performance so as to determine to what degree
customer-oriented SCM issues influence organizational performance. The result
showed that considerable positive relationships were existed among three types of SCM

20
capabilities (outside-in, inside-out, and spanning) and business performance (perceived
customer value, customer loyalty, market performance, and financial performance).
2.6 SCM practices in Ethiopian BMEIs
Ethiopia‘s economy is based on agriculture which in 2008/2009, contributed about 43
percent of the gross domestic product (GDP), 86 percent of foreign currency earning,
and 85 percent of rural employment. Generally, the overall economic growth of the
country has been highly associated with the performance of the agricultural sector
(Ethiopian Investment Guide, 2010).
The country adopted a free market economic policy in 1992, and in line with this has
promoted private investment. With the introduction of a free market economy, Ethiopia
has implemented a number of reforms including the privatization of state owned
enterprises, liberalization of foreign trade, deregulation of domestic prices, and
devaluation of the exchange rate. With its enormous resources, the country has
untapped investment opportunities, huge market access and low cost of doing business.
The country has an excellent climate, fertile soil and huge domestic raw material base.
Its location is strategically close to the lucrative markets of the Middle East, Asia and
Europe (Embassy of FDRE in London, 2011).
However, Ethiopia has not benefiting from these resources and opportunities available
due to several reasons including poor infrastructure in transport and communication as
well as shortage of electric power supply which created a challenge for most companies
in doing business in the country.
Limitations in physical infrastructure increase the cost of transportation and also hinder
the fast movement of products, information and money in business transactions. Poor
infrastructure also limits the size of the market available in nearby countries such as
Sudan and Kenya which could provide a potential source of customers for Ethiopian
business people. Air transport is also very limited access and at the same time the
carrier cost to use this route is too high.

21
Since SCM is concerned with cost effective ways of managing materials, information
and financial flows from the point of origin to the point of utilization to satisfy customer
requirements (Narasimha,2007), it is difficult to consider that SCM is properly practiced
in Ethiopian business environment.
Basic metal and engineering industries are indispensable to build up any country’s
physical economic base. In Ethiopia, however, since these industries are not developed
enough to meet emerging demand from user industries both quantitatively and
qualitatively, it is necessary to rely heavily on imports. Manufacturing and delivery of
basic metal and engineering product involve many parties that encompass foreign and
local suppliers of different kinds of inputs like metal scrap, ferroalloys, chemicals and
others; manufacturers of basic metals and engineering products, and distributors up to
the end users.
Supply of raw materials for the basic metal and engineering industries heavily depend
on imports. It is hard to distinguish clearly between imported and domestic materials as
final users often buy from agents without earmarking. However, most basic metal
industries which have melting furnaces are also using the main input-metal scrap from
the local suppliers that are operating on both a formal and informal basis.
Like other businesses activities in the country, the flow of money along the supply chain
of basic metal and engineering industries is conducted in cash and cheque transactions
or transfers to the beneficiary account, while information about business transactions
are transferred through FAX, telephone, and internet.
2.7 Research framework
Mentzer et al., (2004) had proposed seven elements of supply chain practice such as
agreed vision and goals, information sharing, risk and award sharing, cooperation,
process integration, long-term relationship and agreed supply chain leadership.
Likewise, using factor analysis, Tan et al., (2002) mentioned six elements of supply
chain practices: supply chain integration, information sharing, supply chain

22
characteristics, customer service management, geographical proximity and Just-in-time
(JIT) capability.
Considering the various dimensions of supply chain management practices and
measurement of organizational performance proposed by several researchers, the
researcher adapted a research framework that encompasses the following four
dimensions of supply chain management practices: strategic supplier partnership,
customer relationship, quality and degree of information sharing and internal lean
practice. For organizational performance measurement three operational (on-time
delivery, product and service quality, operating costs) and two market (sales growth,
market share growth) performance measurements were adapted.
Figure 3.1 Research framework
According to the literature review the four SCM practices proposed in this research
framework are described as follows:
• Strategic supplier partnership
According to Li et al., (2006) strategic supplier partnership is defined as “the long-term
relationship between the organization and its suppliers. It is designed to leverage the
Organizational performance
• Operational performance
• Market performance
Strategic supplier
partnership
Customer relationship
Internal lean practice Information sharing

23
strategic and operational capabilities of individual participating organizations to help
them achieve significant ongoing benefits”. Gyaneshwar et al., (2010) also suggested
that strategic partnership emphasizes direct, long-term association and encourages
mutual planning and problem solving efforts. Such strategic partnerships are entered
into to promote shared benefits among the parties and ongoing participation in one or
more key strategic areas such as technology, products, and markets. Strategic
partnerships with suppliers enable organizations to work more effectively with a few
important suppliers who are willing to share responsibility for the success of the
products.
• Customer relationship
Customer relationship comprises the entire array of practices that are employed for the
purpose of managing customer complaints, building long-term relationships with
customers, and improving customer satisfaction (Li et al., 2006). Gyaneshwar et al.,
(2010) also suggested that close customer relationship allows an organization to
differentiate its product from competitors, sustain customer loyalty, and dramatically
extend the value it provides to its customers. Close customer relationship allows
companies to be more responsive in fulfilling customers’ demand and improving
customer satisfaction by proactively seeking customers’ requirements and needs. The
ability to build close relationship with customers will bring companies into a lasting
competitive edge (Bowersox, 1999).
• Information sharing
A key element of supply chain partnering is the sharing of various types of information
between partners, including real-time communication, planning and operational data,
and even financial information. Information sharing is seen as one of the key success
factors in the functioning of strategic alliances and enables supply chains to be agile in
responding to competitive challenges (Andraski, 1998).
Integrating effective supply chain practices with effective information sharing becomes
critical for improving supply chain performance. The two aspect that information sharing

24
comprises are information content and information quality. Information content refers to
the information shared between manufacturers and customers. Information quality
measures the quality of information shared between manufacturers and customers
(Zhou et al., 2007).
Information quality includes such aspects as the accuracy, timeliness, adequacy, and
credibility of information exchanged (Monczka et al., 1998). While information sharing is
important, the significance of its impact on SCM depends on what information is shared,
when and how it is shared, and with whom (Chizzo, 1998; Holmberg, 2000). Jarrell
(1998) also noted that sharing information within the entire supply chain can create
flexibility, but this requires accurate and timely information (as cited in Li et al., 2005).
Fiala (2005) added that information sharing of customer demand has an impact on the
bullwhip effect and in general it is very important issue for coordinating actions.
Information sharing is an important aspect in achieving seamless integration in a supply
chain (Lee, 2000). Cross functional integration and inter organizational integration
require the visibility of information across the supply chain. Weak information sharing
between partners in a supply chain will result in poor coordination that will lead to many
serious problems such as high inventory levels, inaccurate forecast, low utilization, and
high production costs (Lee and Whang, 2000). Indeed, information sharing is highly
considered as the way to reduce demand uncertainty (Lee, 2002).
• Internal lean practices
In addition to upstream and downstream integration, SCM also emphasizes the
importance of both effectiveness and efficiency of a firm’s internal operations on its
performance (Handfield and Nichols, 1999). A firm’s internal operations are the basis
for creating best organizational performance before embarking into external
integrations. Weak internal operations can lead to failure in coordinating with external
partners.
As Li et al., 2005 argued citing Womack and Jones, 1996; McIvor, 2001; Taylor, 1999
internal lean practices are the practices of eliminating waste (cost, time, etc.) in a

25
manufacturing system, characterized by reduced set-up times, small lot sizes, and pull-
production. The term ‘‘lean’’ is used to refer to a system that uses less input to produce
at a mass production speed, while offering more variety to the end customers.
Elimination of waste is a fundamental idea within the lean system. Shah et al., (2003),
also define lean practices as a multi-dimensional approach that encompasses a wide
variety of management practices, including just-in-time, quality systems, work teams,
cellular manufacturing, supplier management, etc. in an integrated system. The core
thrust of lean practices are that these practices can work synergistically to create a
streamlined, high quality system that produces finished products at the pace of
customer demand with little or no waste.

26
CHAPTER 3: RESEARCH METHODOLOGY
3.1 Introduction
There are practical steps through which the researcher must pass in the journey of
research in order to find answers to the research questions. The path to finding answers
to the research questions constitutes research methodology.
This chapter provides details of the research methodology which was used in the study.
It is also includes a description of the research design, study population and sampling
techniques as well as instruments used to collect the relevant data. Furthermore, data
analysis strategies and the ethical considerations aspects are also addressed
respectively.
3.2 Research design
According to Leedy et al., (2010), there are two paradigms or categories that research
studies are normally grouped into, and they are (1) Qualitative and (2) Quantitative
research methodologies. The purpose of quantitative research is to make explanations
and predictions that will be generalized to other persons and places. In contrast,
qualitative research is used for better understanding of complex situations which is
sometimes exploratory in nature, and researchers may use their observations to build
theory from the ground up. Table 3.1 lists some common research methodologies and
the types of problems for which each is appropriate.

27
Table 3.1 Methodology and concomitant research goals
Method Characteristics of the method and the research goals the
method attempts to achieve
Case study A type of qualitative research in which in-depth data are gathered
relative to a single individual, program or event for the purpose of
learning more about unknown or poorly understood situation.
Content analysis A detailed and systematic examination of the contents of a
particular body of material for the purpose of identifying patterns,
themes etc. within the material.
Correlational
research
A statistical investigation of the correlation between two or more
variables. It looks at surface relationship but does not necessarily
probe for causal reasons underling them.
Ethnography A type of qualitative inquiry that involves an in-depth study of an
intact cultural group in a natural setting
Observation study A type of quantitative research in which a particular aspect of
behavior is observed systematically and with as much objectivity as
possible.
Phenomenological
research
A qualitative method that attempts to understand participants’
perspective and views of social realities.
Survey research A study designated to determine the incidence, frequency, and
distribution of certain characteristics in a population.
Source: Leedy 2010. Practical research: planning and design (9th edition).
Leedy et al., (2010) explained that descriptive survey involves acquiring information
about one or more groups of people through asking them questions and tabulating their
answers. The ultimate goal of survey research design is to learn about a large
population by surveying their representative sample, summarizing their responses in
percentages, frequency, or more sophisticated statistical tools.

28
Since the quantitative approach of descriptive survey is the easiest and economical
method of obtaining information through email and postal service from samples across
a geographically widespread area, the researcher have preferred to use descriptive and
Inferential statistics in the study.
Based on the literature review of Li et al., (2005), Li et al., (2006), Lori et al., (2011) the
researcher has adapted research instruments to collect data for the study. In this
respect, a five-point Likert scale was used to measure the respondents` strength of
likelihood with the research variables because this rating scale method is more useful
when a perception, behavior, attitude, or other phenomenon of interest needs to be
evaluated (Leedy et al., 2010). Moreover, the Likert scale that was used in this research
is considered as categories, not numerical points (1 - not at all, 2 - to a small extent, 3 -
to a moderate extent, 4 - to a great extent 5 - not applicable).
3.3 Research population and sample According to Diamantopoulos et al., (2000), a population is the totality of an entities in
which the researcher has an interest, means it is the collection of individuals, objects or
events in which the researcher wants to make inferences. A sample, on the other hand,
is defined as part of or subset of a given population and it is used to generalize the
findings to the entire population. Furthermore, sampling is the process by which
respondents are picked out of the population to represent that population. This process
can either be done through probability or non-probability methods (Leedy et al., 2005).
The population for the study includes 71 large and medium basic metals and
engineering firms classified under four categories as manufacturers of basic iron and
steel, manufacturing of fabricated metal products except machinery and equipment,
machinery and equipment manufacturers, and manufacturers of motor vehicles, trailers
and semi-trailers located within a 50 Km radius of the capital, Addis Ababa, where the
majority of the country’s industry population is located. The population was drawn from
the Ministry of Industry, the 2009 Business directories of Addis Ababa Chamber of

29
Commerce, and Ethiopian Association of Basic Metals and Engineering Industries
(EABMEIs) data bases.
Based on the available resources of the researcher, 30 large and medium basic metals
and engineering firms, making up 42% of the population, were selected randomly to get
a total number of 90 respondents (3 respondents from each company) for the research.
This fulfills the minimum sample size (30) requirement to conduct statistical procedure
(Diamantopoulos et al., 2000). Respondents were top managers and executives who
were expected to have experience about the operation and management of supply
chain practice in their organization, such as General Managers of the companies,
Commercial Managers and Production and Technical Managers.
3.4 Validity and Reliability According to Leedy et al., (2010), validity of a measurement instrument is defined as the
extent to which the instrument measures what it is actually intended to measure.
Whereas reliability of measurement instrument is defined as the extent to which the
instrument yields consistent result when the characteristics being measured has not
changed. Leedy et al., (2010) further defined the different forms of validity and reliability
as follows:
� Validity
• Content validity: is the extent to which the instrument is representative of the
content area being measured,
• Construct validity: is the extent to which the instrument measures characteristics
that are not obtainable by observation,
� Reliability
• Inter-rater reliability: is the extent to which two or more researchers evaluating
the same characteristic give the same results,
• Internal consistency reliability: is the extent to which similar items in the
instrument yield the same results.
To develop the research instrument and insure their validity and reliability Li et al.,
(2005), Li et al., (2006) and Lori et al., (2011) had passed through different phases such

30
as item generation, pre-pilot study, pilot study, large-scale data analysis as well as
interviews with academic experts and practitioners in the field. In this process the
reliabilities of instruments to measure SCM practice and organizational performance
were properly assessed. Therefore, the researcher believed that the adapted
instruments have high level of validity and reliability to conduct this study.
Moreover, to insure the validity and reliability of the instrument the researcher had
consulted with two local academicians and three SCM practitioners and adjustments
were made accordingly (Appendix B).
3.5 Data collection approach In order to collect the data from respondents, the questionnaire with a covering letter
which explained the objective of the study were distributed in person and via e-mail.
Additional follow-up and clarification were provided through telephone to selected
respondents, as required, to ascertain appropriate understanding was achieved.
3.6 Data analysis approach All hypotheses are tested with the help of the Statistical Package for Social Science
(SPSS-19) software. In order to analyze the data the two sets of Statistics: Descriptive
and Inferential statistics are used. Descriptive statistics summarizes and describes
quantitative information in the form of frequency distribution and measures of central
tendency, whereas inferential statistics is used to make conclusions.
During data analysis chi-square test is used to test for significance of differences
between the observed and the expected distributions of data, while Spearman rank
correlation is used to measure the direction and strength of the relationship between the
research variables. Furthermore, Kruskal-Wallis test is conducted to determine whether
the independent variables (strategic supplier partnership, customer relationship, quality
and degree of information sharing and internal lean practices) have an effect on
dependent variable (organization performance).

31
3.7 Ethical issue According to Leedy et al., (2010), most ethical issues fall into one of the following four
categories. Therefore, the researcher has considered these issues for the study.
• Informed consent: all participants had been briefed about the research and
joined with their full consent.
• Right to privacy: the researcher has kept the nature and quality of participants’
performance strictly confidential.
• Security: the researcher has not exposed the participants to unusual stress,
embarrassment, or loss of self-esteem.
• Honesty: the researcher has reported the findings in complete honesty.

32
CHAPTER 4: RESEARCH RESULTS
4.1 Introduction
This chapter presents the results of a statistical analysis of the data obtained from the
respondents. The results focus on answering the research questions stated in chapter
one. Therefore, demographic profile of respondents as well as descriptive statistics of
supply chain management practices currently experienced in Ethiopian basic metal and
engineering industries are presented first, followed by testing the null hypotheses.
4.2 Descriptive statistics and respondents profile
Descriptive statistics in the form of frequencies, arithmetic means and standard
deviations are computed for the various dimensions of demographic profile of
respondents and their perception on SCM practices in their respective companies.
4.2.1 Demographic profile of respondents
The demographic profile of the respondents which is considered crucial for this study is
presented as follows.
Table: 4.1: Employment position of respondents at the time of the study
Job title Frequency Percent Valid
Percent
Cumulative
Percent
Valid General Manager 14 15.6 25.9 25.9
Commercial manager 17 18.9 31.5 57.4
Production/technical manager
16 17.8 29.6 87.0
Marketing manager 7 7.8 13.0 100.0
Total 54 60.0 100.0
Missing System 36 40.0
Total 90 100.0

Table 4.1 provides details of the
participated in this study. As indicated
Commercial managers (31.5%), Production and technical Managers (29.6%) and
General Managers (25.9%) accounting for 87.0% of the
these managerial positions
applied in their industries. Therefore, their responses
Figure 4.1: Employment positions of respondents
Figure 4.2 Educational levels
As illustrated in Figure 4.2,
(65%), and second degree (20%). The remaining (15%) have their
Production/technic
al manager
29.6%
Marketing manager
13%
15%
0%
10%
20%
30%
40%
50%
60%
70%
College diploma
Percentage (%)
.1 provides details of the employment positions of the respondents that
. As indicated in Table 4.1, most of the respondents were
Commercial managers (31.5%), Production and technical Managers (29.6%) and
General Managers (25.9%) accounting for 87.0% of the total valid respondents. At
these managerial positions, they expected to be well informed about SCM practices
applied in their industries. Therefore, their responses are expected to be reliable.
mployment positions of respondents at the time of the study
levels of the respondents
As illustrated in Figure 4.2, the education level of most of the respondents is first degree
(65%), and second degree (20%). The remaining (15%) have their college
General manager
Production/technic
Marketing manager
65%
20%
College diploma First Degree Second degree
Educational level
33
employment positions of the respondents that
4.1, most of the respondents were
Commercial managers (31.5%), Production and technical Managers (29.6%) and
total valid respondents. At
well informed about SCM practices as
are expected to be reliable.
time of the study
the education level of most of the respondents is first degree
college diploma. This
General manager
25.9%
Commercial
manager
31.5%
0%
Doctoral degree

34
implied that the majority of respondents are well educated and have the ability to
understand the questions they were presented with.
Table: 4.2: Work Experience of respondents in the present company
Work Experience Frequency Percent Valid
Percent
Cumulative
Percent
Valid Under 2 years 5 5.6 9.3 9.3
3 to 5 years 17 18.9 31.5 40.8
6 to 10 years 3 3.3 5.6 46.3
Over 10 years 29 32.2 53.7 100.0
Total 54 60.0 100.0
Missing System 36 40.0
Total 90 100.0
As indicated in Table 4.2, more than half of the total respondents (53.7%) were serving
at their present industry for above 10 years, 31.5% for 3 to 5 years and 5.6 % for 6 to 10
years. The remaining 9.3% were serving for less than 2 years. This shows that the
respondents are well knowledgeable about their company supply chain management
practices.
Figure 4.3: Number of service years of respondents
9.3%
31.5%
5.6%
53.7%
0%
10%
20%
30%
40%
50%
60%
Under 2 years 3 to 5 years 6 to 10 years Over 10 years
Percentage (%)
Work Experience

35
4.2.2 Categories of selected Basic Metal and Engineering Industries by sub-
sector
Table: 4.3: Categories of selected Basic Metal and Engineering Industries by sub-sector
ISIC No.
Sub-Sector
Population Sample Respondent
Industry ownership of respondent companies
Freq.
% Freq.
% Freq. %
Public Private
Freq.
% Freq.
%
27 Manufacture of Basic Iron and Steel
13 18.3 11 36.6 5 27.8 0 0 5 29.4
28
Manufacture of Fabricated Metal Products Except Machinery and Equipment
45 63.4 12 40.0 9 50.0 1 100.0 8 47.0
29 Manufacture of Machinery and Equipment N.E.C.
3 4.2 2 66.7 2 11.1 0 0 2 11.8
34 Manufacture of Motor Vehicles, Trailers and Semi-Trailers
10 14.1 4 13.3 2 11.1 0 0 2 11.8
Total 71 100.0 30 100.0 18 100.0 1 100.0 17 100.0
Table 4.3 shows the type of industries situated within a 50 km radius of Addis Ababa
categorized by sub-sector, 13(18.3%) are basic iron and steel industries, 45(63.4%)
manufacturers of fabricated metal products except machinery and equipment, 3(4.2%)
manufacturers of machinery and equipment N.E.C. and 10(14.1%) manufacturers of
motor vehicle trailers and semi-trailers. Among these industries, 11(36.6%) are basic
iron and steel industries, 12(40.0%) manufacturers of fabricated metal products except
machinery and equipment, 2(66.7%) are manufactures of machinery and equipment
N.E.C. and 4(13.3%) manufacturers of motor vehicle trailers and semi-trailers. Samples
were randomly selected and 5(27.8%), 9(50.0%), 2(11.1%), 2(11.1%) of them were able
to return the feedback of the questionnaire respectively. Only one of them belongs to
the government while the remaining 17(94.4%) are privately owned.

36
4.2.3 Perception of respondents on the extent of SCM practices and
organizational performance
The purpose of this section is to understand the extent of practical implementation of
SCM practices in BMEIs. Therefore, data related to each of the SCM practices: strategic
supplier partnership, customer relationship, quality and degree of information sharing
and internal lean practices are summarized and the results are presented in the same
format as in the questionnaire.
4.2.3.1 Strategic supplier partnership
Respondents were asked to indicate the extent to which the five variables under
strategic supplier partnership practice were experienced in their respective industries.
These variables include the extent of the companies’ practices in identifying reliable
suppliers, regularly solving problems jointly with suppliers, having long term contract
agreement with reliable suppliers, organizing continuous improvement programs that
include key suppliers, involvement of suppliers in problem solving as well as goal-
setting activities.
Table 4.4: Extent of the current strategic supplier partnership practices
Variables Not at
all (%)
Small extent
(%)
Moderate extent
(%)
Great extent
(%) Mean Std.
deviation
Quality as number one criterion in selecting suppliers
1.9 13.0 59.3 25.9 3.09 0.680
Regularly solving problems jointly with suppliers 9.3 53.7 25.9 11.1 2.39 0.811
Long term contract agreement with reliable suppliers
18.5 63.0 13.0 5.6 2.06 0.738
Continuous improvement programs that include key suppliers
11.1 66.7 11.1 11.1 2.22 0.793
Involvement of key suppliers in planning and goal-setting activities
38.9 29.6 22.2 9.3 2.02 1.000

37
It is clear from means of values of variables mentioned in Table 4.4 that suppliers are
selected based on the quality of their performance to a ‘moderate extent’ (3.09), but that
the remaining means of values of variables are between 2.02 and 2.39. This implies that
experiences related to joint problem solving with suppliers, long term contractual ties
with reliable suppliers as well as involvement of key suppliers on continuous
improvement program and other critical activities were practiced “-to a small extent”.
Accordingly, one can conclude that strategic supplier partnership practices were not
properly applied in Ethiopian basic metal and engineering industries.
4.2.3.2 Customer relationship
In this sub-section respondents were asked to rate their practice of customer
relationship practices in five variables. These variables include the extent of the
companies’ practice in terms of frequent interaction with customers to set reliability and
responsiveness, measure of customer satisfaction and expectation, facilitate customers’
ability to seek assistance as well as establishing long-term contract with reliable
customers.
Table 4.5: Extent of the current customer relationship practices
Variables Not at
all (%)
Small extent
(%)
Moderate extent
(%)
Great extent
(%) Mean Std.
deviation
Frequent interaction with customers to set reliability, responsiveness, and other standards
0.0 11.1 42.6 46.3 3.35 0.677
Frequent measure of customer satisfaction 5.6 38.9 35.2 20.4 2.70 0.861
Frequent determination of future customer expectations
11.1 20.4 53.7 14.8 2.72 0.856
facilitate customers’ ability to seek assistance 7.4 42.6 46.3 3.7 2.46 0.693
Long term contract agreement with reliable customers
27.8 35.2 24.1 13.0 2.22 1.003

38
As indicated in Table 4.5, most of the respondents (42.6% and 46.3%) stated that they
had frequently worked together with their customers to set reliability, responsiveness,
and other standards from moderate up to great extent. On the other hand, mean values
of other practices such as frequent measure of customer satisfaction (2.70), frequent
determination of future customer expectations (2.72), facilitate for customers to get
assistance (2.46) and long term contract agreement with reliable customers (2.22) were
practiced between small and moderate extent.
4.2.3.3 Information sharing practices
Respondents were asked to assess their information sharing practice in terms of
forecast of demands, exclusiveness, timeliness, reliability and the means that
information were exchanged.
Table 4.6: Extent of the current information sharing practices
Variables Not at
all (%)
Small extent
(%)
Moderate extent
(%)
Great extent
(%) Mean Std.
deviation
We inform trading partners in advance of changing needs
16.7 51.9 24.1 7.4 2.22 0.816
Sharing proprietary information with trading partners
25.9 53.7 20.4 0.0 1.94 0.685
Information exchange between our trading partners and us is timely
5.6 66.5 22.2 5.6 2.28 0.656
Information exchange between our trading partners and us is reliable
11.1 57.4 29.6 1.9 2.22 0.664
We use web-based data exchange with our trading partners
16.7 59.3 13.0 11.1 2.17 0.863
Table 4.6 indicates that 51.9 % and 24.1% of the respondents had informed their
trading partners about changing needs to a small and moderate extent respectively,
while 16.7% of them did not provide such information at all. On the contrary, only 7.4%

39
of the respondents experienced such type of practice to a great extent. Regarding
proprietary information exchange with trading partners, 53.7% of respondents rated
their experience as being limited to a small extent and the remaining 25.9% noted they
lacked experience in this area. On the other hand, with respect to timeliness 66.7%,
reliability of information exchange 57.4% and web-based data and information
exchange with supply chain partners 59.3% of the respondents indicated that they had
such type of experience to a small extent.
Since all individual mean values of the above five variables in Table 4.6 are close to the
average mean value (2.17) then it can be concluded that information sharing among
supply chain partners in BMEIs is practiced to a smaller extent.
4.2.3.4 Internal lean practices
Respondents were asked to indicate the extent to which the five variables under internal
lean practice were experienced in their respective industries. These variables include
the extent of the companies’ practices related to reduction of set-up time; applying
continuous quality improvement program and a ‘‘Pull’’ production system. It also contain
variables that could show how industries are pushing for shorter lead-times as well as
facilitating the processes of ordering, receiving and other paperwork from suppliers.

40
Table 4.7: Extent of the current internal lean practices
Variables Not at
all (%)
Small extent
(%)
Moderate extent
(%)
Great extent
(%) Mean Std.
deviation
Our firm reduces set-up time 0.0 46.3 38.9 14.8 2.69 0.722
Our firm has continuous quality improvement program
7.4 22.2 66.7 3.7 2.67 0.673
Our firm uses a ‘‘Pull’’ production system 3.7 5.6 48.1 42.6 3.30 0.743
Our firm pushes suppliers for shorter lead-times 14.8 22.2 37.0 25.9 2.74 1.013
Our firm streamlines ordering, receiving and other paperwork from suppliers
11.1 14.8 46.3 27.8 2.89 0.927
As can be seen from Table 4.7, 48.1% of the respondents indicated that they had
moderate levels of practice with respect to applying ‘‘Pull’’ production system and 46.3%
indicated that their firms have been streamlining of ordering, receiving and other
paperwork from suppliers while 42.6% and 27.8% of the respondents indicated that they
had practiced these variables to a great extent respectively.
On the other hand, the mean values for these two supply chain practices, which are
3.30 and 2.89 respectively, were more than the average mean value(2.86), whereas
mean values of other practices such as reduction of set-up time (2.69), continuous
quality improvement endeavors (2.67) and pushing suppliers for shorter lead-times
(2.74) were under the average mean value (2.86).
4.2.3.5 Organizational performance
In this sub-section respondents were asked to rate their level of organizational
performance in comparison to their competitors using five variables. These variables

41
were used to assess the relative performances of each industry with respect to on-time
delivery, product and service quality, operating costs as well as the extent to which
industries’ sales and market share are growing. In this stage the researcher used
relative organizational performance measures because firms may not be willing to
provide actual financial performances.
Table 4.8: Extent of organizational performance
Variables Not at
all (%)
Small extent
(%)
Moderate extent
(%)
Great extent
(%) Mean Std.
deviation
Our on-time delivery performance is better than our competitors
5.6 40.7 46.3 7.4 2.56 0.72
Our product and service quality is better than our competitors
5.6 13.0 53.7 27.8 3.04 0.80
Our operating costs are lower than our competitors 29.6 31.5 35.2 3.7 2.13 0.89
Our sales is growing 11.1 48.1 40.7 0.0 2.30 0.66
Our market share is growing 16.7 44.4 35.2 3.7 2.26 0.78
As indicated in table 4.8, 53.7 % and 46.3% of the respondents had stated that product
and service quality as well as on-time delivery of their industries had moderate
performance. In response to the other dimensions of organizational performances: sales
growth, market share growth and reduction of operating costs of industries, 48.1%,
44.4% and 31.5% of the respondents were agreed that they had relatively small level of
performance respectively. Similarly, the mean values of the same responses 2.30, 2.26
and 2.13 were also observed under the average mean values (2.46) respectively.
4.3 Hypotheses testing
The two main objectives of this research study were (1) to determine the extent to which
the supply chain management practices were implemented and (2) to determine the
42
significance of relationships between supply chain management practices and
organizational performance of BMEIs in Ethiopia.
In order to address these research objectives and guide the research, eight hypotheses
were formulated. The aim of the empirical data was to either accept or reject the null
hypotheses. In this study the supply chain management practices (strategic supplier
partnership, customer relationship, information sharing and internal lean practices) are
independent variables while organizational performance which includes five variables
(on-time delivery, product and service quality, operating costs, sales and market share
growth) are dependent variables. The statistical nonparametric tests that were
conducted were the chi-square and Spearman’s rank-order correlation tests. The
reason why only nonparametric analysis was conducted was because the data were
ordinal.
The first four hypotheses (H1 up to H4) were tested by chi-square statistical test to
determine whether there was a significant difference between the expected frequencies
and the observed frequencies in one or more categories. To test these null hypotheses
the researcher assumed that the expected and observed frequencies are equally
categorized. It means that half (50%) of the respondents will fail in the category of rating
from “not at all” to “moderate extent” (categorized as weak supply chain management
practices) while the remaining half (50%) of the respondents fall in the category of “to a
great extent” (categorized as strong supply chain management practices).
Based on the critical chi-square value and frequency distribution, it is possible to test
whether or not the null hypothesis was valid or not. Therefore, if the calculated chi-
square value was greater than the significance value (p= 0.05), then there was no
evidence to reject the null hypotheses in favor of alternative hypostases. The reverse
was true if the calculated chi-square value was less than the significance value.
Accordingly, hypotheses H1 up to H4 were tested as follows.
4.3.1 Hypothesis 1
Ho1: Strategic supplier partnership practice is not weak in Ethiopian BMEIs.
Ha1: Strategic supplier partnership practice is weak in Ethiopian BMEIs.

43
Table 4.9: Statistical chi-square test for strategic supplier partnership practices
Quality as
number one
criterion in
selecting
suppliers
Regularly
solving
problems
jointly with
suppliers
Long term
contract
agreement
with reliable
suppliers
Continuous
improvement
programs
that include
key
suppliers
Involvement
of key
suppliers in
planning and
goal-setting
activities
Chi-
Square a
40.074 27.333 43.333 50.000 10.148
df 3 3 3 3 3
Asymp. Sig.
.000 .000 .000 .000 .017
a 0 cells (.0%) have expected frequencies less than 5. The minimum expected cell frequency is 13.5.
As indicated in Table 4.9 the calculated chi-square values of all variables were less than
the critical value of 0.05. Therefore, the null hypothesis, Ho1: “strategic supplier
partnership practice is not weak in Ethiopian BMEIs” was rejected in favor of the
alternative hypothesis, Ha1: “strategic supplier partnership practice is weak in Ethiopian
BMEIs”. This clearly shows that Ethiopian BMEIs have serious weaknesses in practicing
strategic supplier partnership practices. It also implies that Ethiopian BMEIs are far
behind in applying modern SCM practices in terms of selecting suppliers on the basis of
quality performance, regularly solving problems jointly with suppliers, establishing long
term contract agreement with reliable suppliers, participating key suppliers in continuous
improvement programs and planning activities.
4.3.2 Hypothesis 2
Ho2: Customer relationship practice is not weak in Ethiopian BMEIs.
Ha2: Customer relationship practice is weak in Ethiopian BMEIs.

44
Table 4.10: Statistical chi-square test for customer relationship practices
Frequent
interaction with
customers to
set reliability,
responsiveness,
and other
standards
Frequent
measure of
customer
satisfaction
Frequent
determination
of future
customer
expectations
Facilitate
customers’
ability to
seek
assistance
Long term
contract
agreement
with reliable
customers
Chi-
Squarea
20.648 15.037 24.667 32.963 5.556
df 2 3 3 3 3
Asymp. Sig. .000 .002 .000 .000 .135
a 0 cells (.0%) have expected frequencies less than 5. The minimum expected cell frequency is 13.5.
The chi-square test results indicated in Table 4.10 show that all calculated chi-square
values except long term contract agreement with reliable customers were less than the
level of significance 0.05. Therefore, the null hypothesis “customer relationship practice
is not weak in Ethiopian BMEIs” was rejected while the alternative hypothesis “customer
relationship practice is weak in Ethiopian BMEIs” was supported.
This shows that Ethiopian BMEIs have challenges with working frequently together with
customers to set reliability, responsiveness, and other standards; frequent measure of
customer satisfaction and determination of their future expectations as well as
facilitating customers’ ability to seek assistance. On the contrary, they are relatively
strong in building and maintaining long term contract agreement with reliable customers.
4.3.5 Hypothesis 3
Ho3: Information sharing practice is not weak in Ethiopian BMEIs.
Ha3: Information sharing practice is weak in Ethiopian BMEIs.
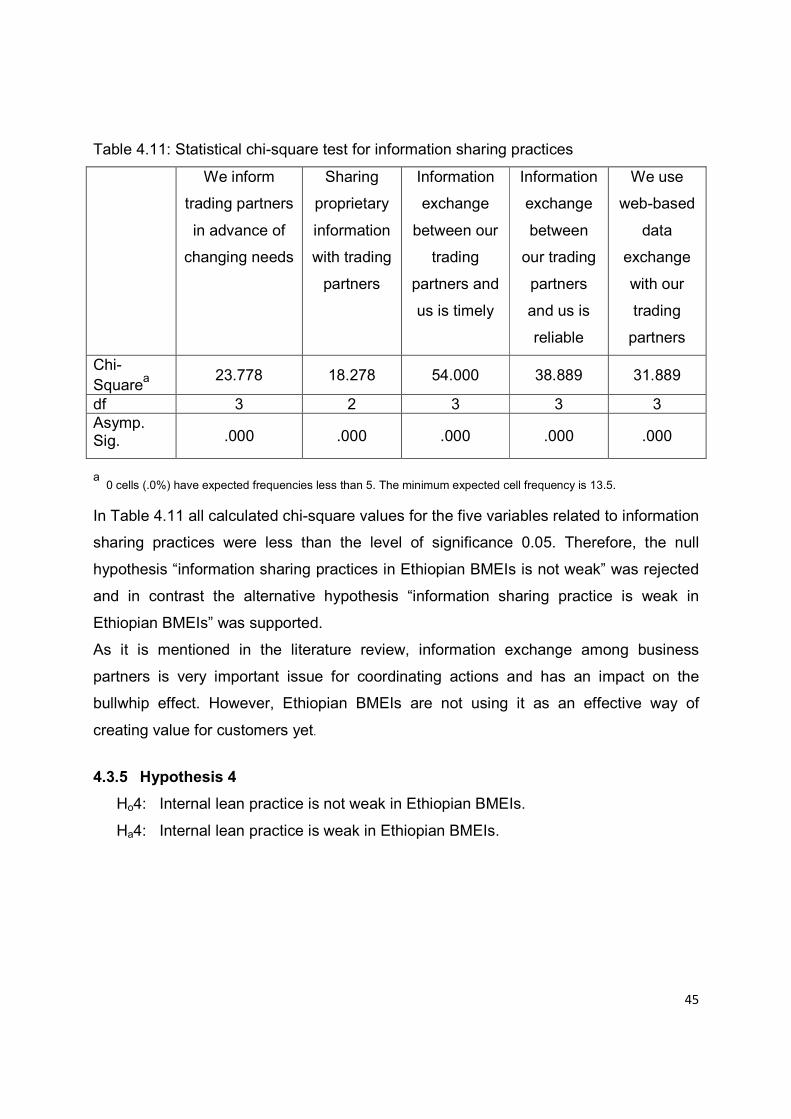
45
Table 4.11: Statistical chi-square test for information sharing practices
We inform
trading partners
in advance of
changing needs
Sharing
proprietary
information
with trading
partners
Information
exchange
between our
trading
partners and
us is timely
Information
exchange
between
our trading
partners
and us is
reliable
We use
web-based
data
exchange
with our
trading
partners
Chi-
Squarea
23.778 18.278 54.000 38.889 31.889
df 3 2 3 3 3
Asymp. Sig. .000 .000 .000 .000 .000
a
0 cells (.0%) have expected frequencies less than 5. The minimum expected cell frequency is 13.5.
In Table 4.11 all calculated chi-square values for the five variables related to information
sharing practices were less than the level of significance 0.05. Therefore, the null
hypothesis “information sharing practices in Ethiopian BMEIs is not weak” was rejected
and in contrast the alternative hypothesis “information sharing practice is weak in
Ethiopian BMEIs” was supported.
As it is mentioned in the literature review, information exchange among business
partners is very important issue for coordinating actions and has an impact on the
bullwhip effect. However, Ethiopian BMEIs are not using it as an effective way of
creating value for customers yet.
4.3.5 Hypothesis 4
Ho4: Internal lean practice is not weak in Ethiopian BMEIs.
Ha4: Internal lean practice is weak in Ethiopian BMEIs.

46
Table 4.12: Statistical chi-square test for internal lean practices
Our firm reduces set-up
time
Our firm has
continuous
quality
improvement
program
Our firm
uses a ‘‘Pull’’
production
system
Our firm
pushes
suppliers
for shorter
lead-times
Our firm streamlines
ordering, receiving and other paperwork
from suppliers
Chi-
Squarea
16.204 54.148 36.222 5.556 18.000
df 2 3 3 3 3
Asymp. Sig. .000 .000 .000 .135 .000
a
0 cells (.0%) have expected frequencies less than 5. The minimum expected cell frequency is 13.5.
As indicated in table 4.12 the calculated chi-square values of all variables except
pushing suppliers for shorter lead-times were less than the critical value of 0.05.
Therefore, the null hypothesis “internal lean practice is not weak in Ethiopian BMEIs”
was rejected in favor of the alternative hypothesis “internal lean practice is weak in
Ethiopian BMEIs”. It is evident from the result found that Ethiopian BMEIs have
weaknesses in terms of reducing set-up time, having continuous quality improvement
program, using a ‘‘Pull’’ production system as well as simplifying ordering, receiving and
other paperwork from suppliers. In contrast, they are relatively strong in pushing
suppliers for shorter lead-times.
4.3.5 Hypothesis 5
Ho5: There is no relationship between strategic supplier partnership and
organizational performance in Ethiopian BMEIs.
Ha5: There is relationship between strategic supplier partnership and organizational
performance in Ethiopian BMEIs.
The purpose of this hypothesis was to determine whether there was a correlation
between strategic supplier partnership on the supply side of BMEIs and their
organizational performance compared to their rivals. In order to determine this
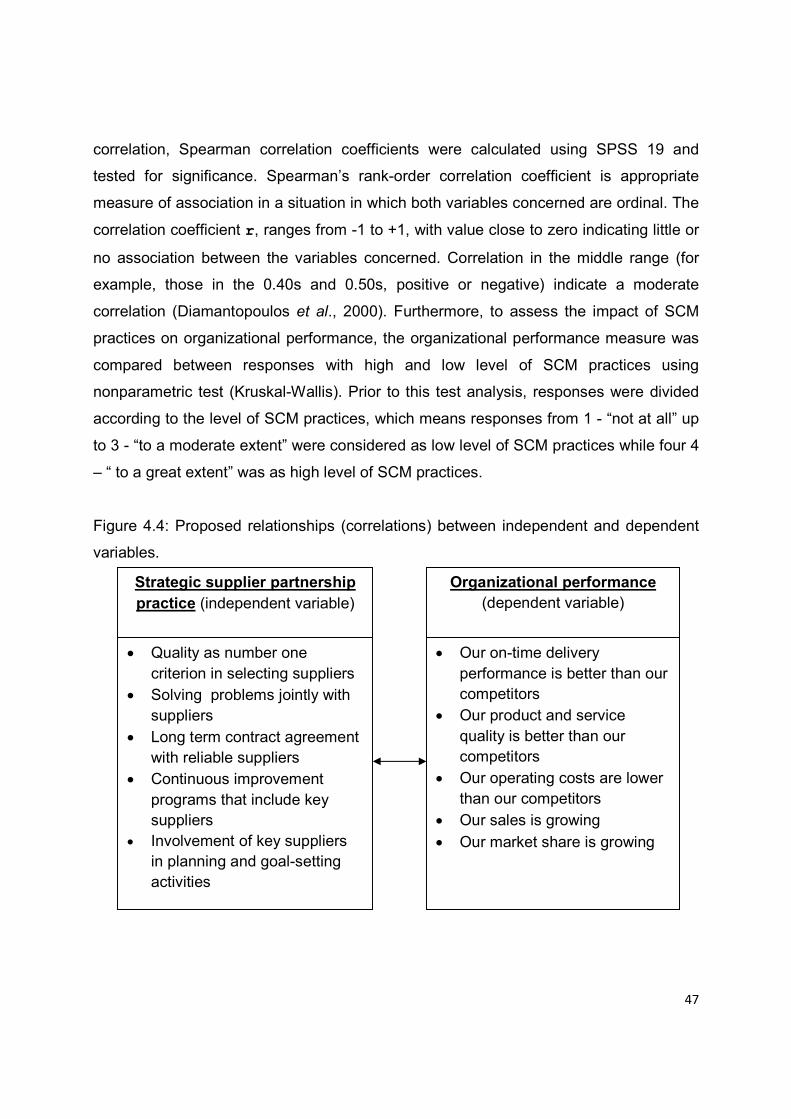
47
correlation, Spearman correlation coefficients were calculated using SPSS 19 and
tested for significance. Spearman’s rank-order correlation coefficient is appropriate
measure of association in a situation in which both variables concerned are ordinal. The
correlation coefficient r, ranges from -1 to +1, with value close to zero indicating little or
no association between the variables concerned. Correlation in the middle range (for
example, those in the 0.40s and 0.50s, positive or negative) indicate a moderate
correlation (Diamantopoulos et al., 2000). Furthermore, to assess the impact of SCM
practices on organizational performance, the organizational performance measure was
compared between responses with high and low level of SCM practices using
nonparametric test (Kruskal-Wallis). Prior to this test analysis, responses were divided
according to the level of SCM practices, which means responses from 1 - “not at all” up
to 3 - “to a moderate extent” were considered as low level of SCM practices while four 4
– “ to a great extent” was as high level of SCM practices.
Figure 4.4: Proposed relationships (correlations) between independent and dependent
variables.
• Quality as number one
criterion in selecting suppliers
• Solving problems jointly with
suppliers
• Long term contract agreement
with reliable suppliers
• Continuous improvement
programs that include key
suppliers
• Involvement of key suppliers
in planning and goal-setting
activities
• Our on-time delivery
performance is better than our
competitors
• Our product and service
quality is better than our
competitors
• Our operating costs are lower
than our competitors
• Our sales is growing
• Our market share is growing
Strategic supplier partnership
practice (independent variable)
Organizational performance
(dependent variable)

48
Figure 4.4 exhibits the group of strategic supplier partnership practices that may have
had relationships with the organizational performance of BMEIs. The questionnaire
(appendix B) was designed using this model. The test results are presented in Table
4.13.
Table 4.13: Correlations between strategic supplier partnership and organizational
performance
Strategic supplier
partnership
Organizational performance
Spearman's rho
Strategic supplier partnership
Correlation Coefficient 1.000 .167
Sig. (2-tailed) . .228 N 54 54 Organizational
performance Correlation Coefficient
.167 1.000
Sig. (2-tailed) .228 . N 54 54
As indicated in Table 4.13 the statistical result which equals 0.228 is well above the
significance value of 0.05. Therefore, there is no evidence to reject the null hypothesis
“there is no relationship between the strategic supplier partnership and organizational
performance in Ethiopian BMEIs” in favor of the alternative hypothesis “there is
relationship between the strategic supplier partnership and organizational performance
in Ethiopian BMEIs”.
Accordingly, it is evident that there is no statistically significant relationship between the
independent variable (strategic supplier partnership) and the dependent variable
(organizational performance). The calculated correlation coefficient 0.167 shows that
there was a very weak positive relationship between the strategic supplier partnership
and organizational performance in Ethiopian BMEIs, as correlation coefficients between
.00 and .40 are considered weak (Diamantopoulos et al., 2000).
This finding was also tested with nonparametric test (Kruskal-Wallis) to determine
whether the strategic supplier partnership has an effect on organizational performance.
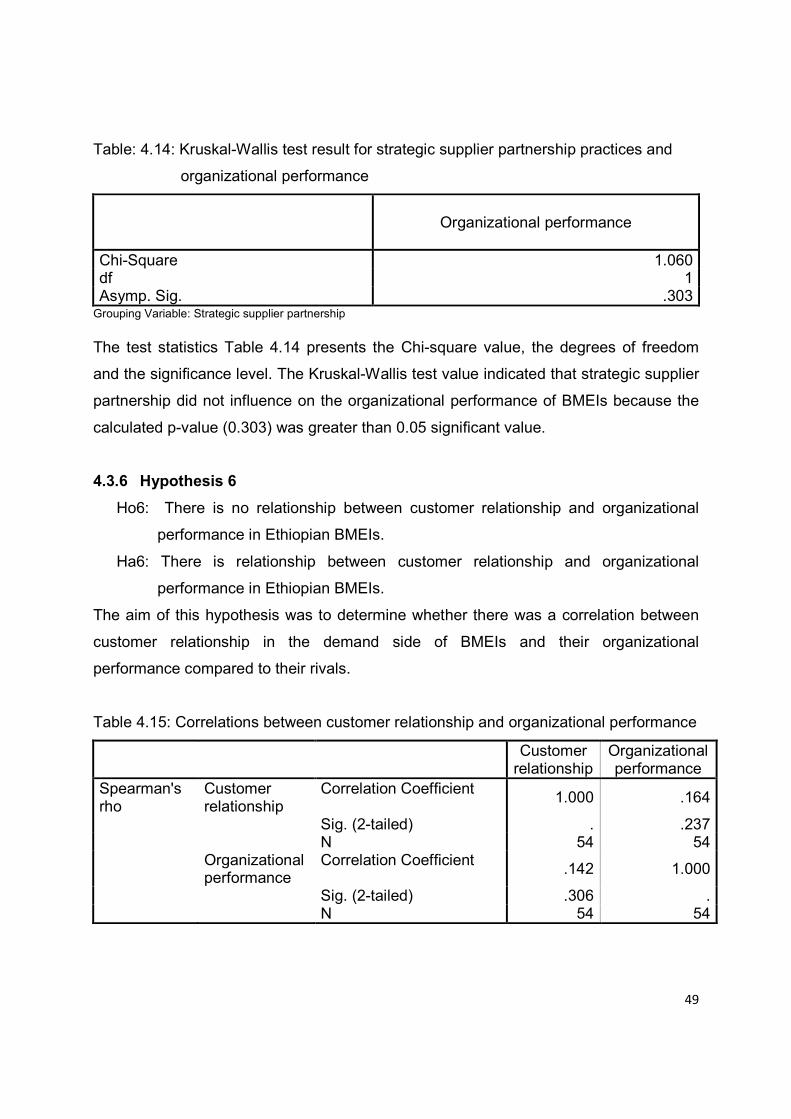
49
Table: 4.14: Kruskal-Wallis test result for strategic supplier partnership practices and
organizational performance
Organizational performance
Chi-Square 1.060 df 1 Asymp. Sig. .303
Grouping Variable: Strategic supplier partnership
The test statistics Table 4.14 presents the Chi-square value, the degrees of freedom
and the significance level. The Kruskal-Wallis test value indicated that strategic supplier
partnership did not influence on the organizational performance of BMEIs because the
calculated p-value (0.303) was greater than 0.05 significant value.
4.3.6 Hypothesis 6
Ho6: There is no relationship between customer relationship and organizational
performance in Ethiopian BMEIs.
Ha6: There is relationship between customer relationship and organizational
performance in Ethiopian BMEIs.
The aim of this hypothesis was to determine whether there was a correlation between
customer relationship in the demand side of BMEIs and their organizational
performance compared to their rivals.
Table 4.15: Correlations between customer relationship and organizational performance
Customer
relationship Organizational performance
Spearman's rho
Customer relationship
Correlation Coefficient 1.000 .164
Sig. (2-tailed) . .237 N 54 54 Organizational
performance Correlation Coefficient
.142 1.000
Sig. (2-tailed) .306 . N 54 54

50
As indicated in Table 4.15 calculated significance value 0.237 was well above the
critical value of 5% significance; as a result, the null hypothesis “there is no relationship
between customer relationship practices and organizational performance in Ethiopian
BMEIs” was not rejected. This implies that there was no relationship between
independent variable (customer relationship) and the dependent variable (organizational
performance). The calculated correlation coefficient 0.164 shows that there was a very
weak, which is almost zero, relationship between the two variables. This finding was
also tested with Kruskal-Wallis test.
Table: 4.16: Kruskal-Wallis test result for customer relationship practices and organizational performance
Organizational performance
Chi-Square 2.038 df 1 Asymp. Sig. .153
Grouping Variable: customer relationship
As can be observed from Table 4.16 the Kruskal-Wallis test value indicated that
customer relationship did not influence the organizational performance of BMEIs since
the calculated p-value (0.153) was greater than 0.05 significant value.
4.3.7 Hypothesis 7
Ho7: There is no relationship between information sharing and organizational
performance in Ethiopian BMEIs.
Ha7: There is relationship between information sharing and organizational
performance in Ethiopian BMEIs.
The purpose of this hypothesis was to determine whether there was a correlation
between information sharing with supply chain partners of BMEIs and their
organizational performance as compared to their competitors.

51
Table 4.17: Correlations between information sharing and organizational performance
Information
sharing Organizational performance
Spearman's rho
Information sharing
Correlation Coefficient 1.000 -.047
Sig. (2-tailed) . .736 N 54 54 Organizational
performance Correlation Coefficient
-.047 1.000
Sig. (2-tailed) .736 . N 54 54
As indicated in Table 4.17 calculated significance value 0.736 was well above the
critical value of 5% significance; as a result, the null hypothesis “there is no relationship
between information sharing and organizational performance in Ethiopian BMEIs” was
not rejected. This implies that there was no relationship between independent variable
(information sharing) and the dependent variable (organizational performance). The
calculated correlation coefficient -0.047 shows that there was a very weak relationship
between the two variables. This finding was also tested with Kruskal-Wallis test.
Table: 4.18: Kruskal-Wallis test result for information sharing practices and
organizational performance
Organizational performance
Chi-Square 1.000 df 1 Asymp. Sig. .317
Grouping Variable: information sharing
As can be observed from table 4.18, information sharing did not influence on the
organizational performance of BMEIs since the calculated p-value (0.317) was greater
than the significant value of 0.05.

52
4.3.8 Hypothesis 8
Ho8: There is no relationship between internal lean practice and organizational
performance in Ethiopian BMEIs.
Ha8: There is relationship between internal lean practice and organizational
performance in Ethiopian BMEIs.
The aim of this hypothesis was to determine whether there was a correlation between
internal lean practices of BMEIs and their organizational performance as compared to
their competitors.
Table 4.19: Correlations between internal lean practice and organizational performance
Internal lean
practice
Organizational performance
Spearman's rho
Internal lean practice
Correlation Coefficient 1.000 .339(*)
Sig. (2-tailed) . .012 N 54 54 Organizational
performance Correlation Coefficient
.339(*) 1.000
Sig. (2-tailed) .012 . N 54 54
* Correlation is significant at the 0.05 level (2-tailed).
From Table 4.19 it can be seen that the calculated significance value 0.012 was less
than the critical value of 5% significance; as a result, the null hypothesis “there is no
relationship between internal lean practice and organizational performance in Ethiopian
BMEIs” was rejected. This implies that there was a positive relationship between
internal lean practice and organizational performance. The calculated correlation
coefficient 0.339 shows that there was a weak positive relationship between the two
variables, because correlation coefficients between .00 and .40 are considered weak
(Diamantopoulos et al., 2000). This finding was also tested with Kruskal-Wallis test.

53
Table: 4.20: Kruskal-Wallis test result for internal lean practices and organizational performance
Organizational performance
Chi-Square 7.894 df 1 Asymp. Sig. .005
Grouping Variable: internal lean practice
As can be observed from Table 4.20, the calculated p-value (0.005) was far below the
critical significant value of 0.05. One could therefore conclude that internal lean
practices of Ethiopian BMEIs had an impact on their organizational performance.

54
CHAPTER 5: DISCUSSION, CONCLUSIONS AND RECOMMENDATIONS 5.1 Introduction In this chapter, the outcome of this research study is discussed with cross-references to
other relevant studies as covered in the literature review. This chapter considers each of
the propositions discussed and the results obtained in the previous chapter. Finally,
conclusions and possible recommendations are given.
5.2 Discussion on research results This study was expected to answer the following two main research questions:
a. To what extent do the Ethiopian BMEIs implement supply chain management
practices?
b. Is there any relationship between supply chain management practices and
organizational performance of Ethiopian BMEIs?
To answer these questions four key dimensions of SCM practices (strategic supplier
partnership, customer relationship, quality and degree of information sharing and
internal lean practices) and one dependent variable (organizational performance) were
used.
5.2.1. Strategic supplier partnership practices
As was mentioned in the literature review, “strategic supplier partnership is designed to
leverage the strategic and operational capabilities of individual participating
organizations to help them achieve significant ongoing benefits” (Li et al., 2006).
Gyaneshwar et al., (2010) also suggested that strategic partnership emphasizes direct,
long-term association and encourages mutual planning and problem solving efforts.
Such strategic partnerships with suppliers enable organizations to work more effectively
with a few important suppliers who are willing to share responsibility for the success of
the products.
However, the result of the first null hypothesis testing mentioned in section 4 showed
that strategic supplier partnership practices in Ethiopian BMEIs is weak. The practices

55
are weak in terms of selecting suppliers on the basis of quality performance, regularly
solving problems jointly with suppliers, establishing long term contract agreement with
reliable suppliers, participating key suppliers in continuous improvement programs and
planning activities.
Therefore, Ethiopian BMEIs have not properly understood and benefited from modern
strategic supplier partnership practices that could have brought significant success for
their respective organizations.
5.2.2. Customer relationship practices
Close customer relationship allows an organization to differentiate its product from
competitors, sustain customer loyalty, and dramatically extend the value it provides to
its customers. Applying good customer relationship practices is also used to build long-
term relationships with customers so that they keep buying the product or service and
recommending it to others.
In this regards, reference to the second null hypothesis test result mentioned in section
4 showed that Ethiopian BMEIs have serious problems in working frequently together
with customers to set reliability, responsiveness, and other standards; frequent measure
of customer satisfaction and determination of their future expectations as well as
facilitating customers’ ability to seek assistance. However, they are relatively strong in
building and maintaining long term contract agreement with reliable customers.
5.2.3. Degree and quality of information sharing practices
As was mentioned in the literature review, a key element of supply chain partnering is
the sharing of various types of information between partners, including real-time
communication, planning and operational data, and even financial information.
Information sharing is one of the key success factors in the functioning of strategic
alliances and enables supply chains to be flexible in responding to competitive
challenges.
Integrating effective supply chain practices with effective information sharing is critical
for improving supply chain performance. Information exchange is also very important for

56
coordinating actions of supply chain members. Increased information flows can reduce
uncertainty and bullwhip effect in the supply chain.
Like the previous two null hypothesis the third one which states “Information sharing
practice is not weak in Ethiopian BMEIs” is also rejected. This shows that Ethiopian
BMEIs are not leveraging proper information sharing practices as a means of improving
their organizational performance.
5.2.4. Internal lean practices
Internal lean practices are used to reduce unnecessary and unproductive tasks as well
as activities in the work environment. Thus, elimination of wastes (cost, time, etc.) in a
manufacturing system, characterized by reduced set-up times, small lot sizes, and pull-
production would help the company and its personnel focus on the requirements and
demands of the customer. Ultimately, internal lean practices not only reduce operational
costs but also aim to boost, restore and significantly raise organizational performance.
It is evident from the forth null hypothesis test result mentioned in section 4 that
Ethiopian BMEIs have weaknesses in terms of reducing set-up time, having continuous
quality improvement program, using a ‘‘Pull’’ production system as well as simplifying
ordering, receiving and other paperwork from suppliers. However, they are relatively
strong in pushing suppliers for shorter lead-times.
5.2.5. Organizational performance
Based on the literature review, SCM practice can have a bottom-line influence on the
organizational performance. The implementation of SCM practices may directly improve
an organization’s financial and marketing performances in the long run. As compared to
their competitors, organizational performance of Ethiopian BMEIs was assessed in
terms of on-time delivery, product and service quality, operating costs as well as the
extent to which the industries’ sales and market share were growing. From the result of
this assessment it was observed that most of the respondents had rated their
organizational performance from “moderate to small extent” as compared to their
competitors. Based on the above four hypothesis test result and related discussions it
could be considered that higher organizational performance was not attained due to the

57
weak supply chain management practices experienced in Ethiopian BMEIs. This is also
one of the reasons why Ethiopian BMEIs are still not able to perform well in the area of
import substitution of metal and engineering products that could have helped the
country to save a significant amount of scarce foreign currency expenditures.
5.2.6. Relationship between supply chain management practices and
organizational performance in Ethiopian BMEIs
The last four consecutive null hypotheses (Ho5 up to Ho8) were established to test
whether there is a relationship between supply chain management practices and
organizational performance in Ethiopian BMEIs. Thus, as it was observed in the
previous chapter, with the exception of internal lean practices, the other SCM practices
have no relationship with organizational performance. Therefore, it is obvious that, even
though it is weak, internal lean practices have positive relationship with organizational
performance of BMEIs. Notably, strategic supplier partnership, customer relationship,
quality and degree of information sharing practices had no impact on organizational
performance of Ethiopian BMEIs.
5.3 Conclusion
The central objective of the study was to assess the level of practical implementation of
SCM practices; and to analyze the relationship between SCM practices and
organizational performance in Ethiopian BMEIs. For this purpose, four key dimensions
of supply chain management practices as well as operational and market-oriented
performance indicators were used as research variables. The results of the survey show
that the implementation of modern SCM practices is weak in Ethiopian BMEIs with the
exception of some efforts that are limited to internal lean practices. Similarly, except that
of the internal lean practices, no positive relationship was observed between the other
SCM practices and organizational performance in this sector. It can, therefore be
concluded that the sector is doing business as usual and no attention was given to
modern SCM theories and practices in the sector yet. However, the existing literature

58
advocates that the implementation of SCM practices can considerably improve
organizational performance.
5.4 Recommendation
Based on the research findings, the following recommendations are made to assist
Ethiopian BMEIs in implementing modern supply chain management practices to
improve organizational as well as supply chain performance.
Basic metal and engineering industries are indispensable in the process of developing
all economic sectors of any country. In Ethiopia, however, it has become critical to rely
heavily on imports since these industries are not developed enough to meet emerging
demand from user industries both quantitatively and qualitatively. Such heavy reliance
on imports increase demands for scarce foreign currency which negatively affecting the
foreign trade balance of the country. Therefore, to develop the effectiveness and
competitiveness of this sector an integrated supply chain management effort that
encompasses importation and local sourcing of different kinds of inputs like metal scrap,
ferroalloys, chemicals and others; manufacturing of basic metals and engineering
products; as well as transportation and distribution of products up to the end users is
required.
• Accordingly, BMEIs should involve key suppliers and customers in joint planning
and problem solving activities as well as organizing continuous improvement
programs on different issues to reduce some challenges of the sector like inferior
product quality, extended delivery time and low competitive prices of the
products. Establishing long term contract agreement with dependable suppliers/
customers could also reduce time and cost for supply chain members.
• Sharing of accurate and proprietary information in the supply chain could benefit
Ethiopian BMEIs in minimizing the Bullwhip effect and reduce the existing
inventory costs, enhance meaningful coordination among supply chain partners
and improve the current low capacity utilization of the industries. Establishing
effective communication up and down the supply chain can help build processes
59
that enable the entire chain to make and deliver winning products and services,
and this could ultimately ensuring customer satisfaction. For this purpose, the
use of appropriate information communication technology is very essential. In
this regards, the Ethiopian government needs to play a key role in strengthening
the current infrastructure and education development programs in this area.
Moreover, great effort is required from the sector to determine exactly what type
of information is needed and then to get it to the right decision maker so that
better operational and strategic decision can be made and executed.
• Implementation of internal lean practices in terms of reducing set-up time, small
lot sizes, having a continuous quality improvement program, working together to
identify and eliminate waste wherever it exists, using a pull-production system is
also recommended not only to reduce operational costs but also to boost, restore
and significantly raise the competitiveness of the sector. This could also enable
the supply chain members to be more customer-focused, flexible and profitable.
• Finally, to develop efficient supply chain management it is important to deliver
both theoretical and practical SCM training for those managers and decision
makers in the sector. For this purpose, concerned governmental bodies, metal
industries and learning institutions have to work together.
5.5 Suggestions for future research The current study has limited number of observations however, when sufficient time and
other resources are available, future studies can include large number of samples from
the population that encompasses other regions of the country. Future research study
can also consider additional dimensions of SCM practice such as logistics integration
and cross-functional coordination.