Embed Size (px)
Citation preview

Strategic Development Plan for the Irish Dairy Processing Sector
14
Chapter 1 Ireland’s dairy processing industry today Page 1. Introduction 15 1.1 Study objectives and background and methodology
1.2 Policy environment of the dairy industry
2. Dairy Production 18
2.1 Introduction 2.2 Profile of the production sector 2.3 Issues that need to be addressed at production level
3. Dairy Processing structure and efficiency 25
3.1 Profile of the processing sector 3.2 Processing structure and efficiency issues 3.3 Product mix of the Irish dairy processing sector 3.4 Changes to Ireland’s product output mix over the last decade
4. The value-added by the processing sector 37
4.1 Dairy industry turnover 4.2 How does Ireland’s capital and R&D investment levels compare? 4.3 Economic value added (EVA) 4.4 Value-added issues
5. Marketing and distribution 45
5.1 How does Ireland’s export performance compare with its main competitors?
5.2 Inability to influence market prices of base products 5.3 Routes to market 5.4 EU intervention market support 5.5 Marketing and distribution issues
6. Summary of key messages from current industry status 51
assessment and international competitor comparisons

Strategic Development Plan for the Irish Dairy Processing Sector
15
1. Introduction 1.1 Study objectives, background and methodology The Department of Agriculture & Food and Enterprise Ireland, in conjunction with the Irish dairy processing industry, commissioned Prospectus and Promar International to carry out a strategic study of the industry. The purpose of the study is to set out options and recommendations to achieve the optimum structure necessary to enable the Irish dairy processing Industry face future challenges. The study will also contribute to the elaboration of national policy for the sector over the coming years, in the context of increased international competition and developments in comparable dairy producing and exporting countries.
The overall objectives of the strategic study are to:
• Examine the existing structure of the Irish dairy processing sector
• Identify market opportunities for dairy products
• Assess product options to exploit these opportunities
• Make recommendations on actions to improve the efficiency and long-term competitiveness of the industry
The scope of the strategic study covers the structure and international competitiveness of the milk assembly, processing, manufacturing, marketing and distribution operations of the dairy processing sector in the Republic of Ireland. The scope of the study does not include a detailed analysis of the structure and comparative competitiveness of the primary production end of the food supply chain, but assesses the current context and operating environment of the Irish primary production sector, its impact on dairy processing, and the requirements for change or adjustment in light of the identified market opportunities. (A brief history and background to the current dairy industry in Ireland2 is contained in Appendix 1.)
The main geographical areas covered are the Republic of Ireland (hereafter, referred to as Ireland, unless otherwise stated) and a detailed analysis of Ireland’s major competing dairy exporting countries – Denmark, the Netherlands and New Zealand. The rationale for benchmarking Ireland against these countries is as follows:
• Ireland is recognised as a significant exporter of base dairy products3 within Europe, exporting over 83% of its output, and if it wishes to continue to compete internationally, it will need to compete with the main exporting players of these products. Therefore, Ireland has been compared with New Zealand, arguably the leading base dairy product supplier globally.
• One of the key strategic options for the Irish industry is to increase its presence in Europe. Therefore, comparison is made with the industries in the Netherlands and Denmark, which are major traders in this market.
• Another strategic option available to the Irish industry is to develop more added value products. The Danish industry has pursued this strategy, and thus it is again relevant for comparison.
• Consideration was given to the benchmarking of other countries such as Germany and France. However it was felt that Denmark, the Netherlands and New Zealand best represent the competitive challenges to the Irish, and the opportunities that are available to the Irish industry in the future. (Appendix 2 contains overview profiles of the three benchmark countries – Denmark, Netherlands and New Zealand.) Comparisons with countries, which export only small quantities of their total output are of only limited value, and have therefore, been excluded.
The study examines the current position and potential future developments at EU and global level and assesses the implications for the Irish industry. It also examines the major current and potential markets for Irish produce. Details of the methodology and approach are included in Appendix 3. 2 Ireland throughout the report refers to the Republic of Ireland unless otherwise stated 3 Throughout the report we use the term base products to cover SMP, WMP, casein, whey powder, bulk cheese and butter unless otherwise stated

Strategic Development Plan for the Irish Dairy Processing Sector
16
1.2 Policy environment of the dairy industry The external environment facing the Irish dairy industry is subject to many influences, including dairy policies arising from the CAP and WTO, global demand for dairy products reflecting growth in the world economy and changing tastes and preferences, domestic economy factors, and developments among international competitors and buyers, including changing ownership and industry structure.
The main factors in the policy environment over the next decade are discussed in this section and include the WTO ‘Doha’ trade round, and further reform of the CAP regime following Agenda 2000 and EU enlargement.
1.2.1 WTO and dairy policy The inclusion of dairying (and all agri-food) under the GATT/WTO trade regulations represented a policy development of enormous long-term consequence. Prior to the GATT Uruguay round implementation in 1995, the EU had total discretion over trade policy with regard to both tariffs (import levies) and export refunds. However, the GATT Uruguay round fundamentally changed this, with export refunds being reduced by 21% and 36% in volume and value terms, import tariffs being reduced on average by 36%, and special low import tariffs for specified and growing import volumes (the in-quota tariffs). While a great deal of focus has been on export refunds, the gradual reduction of import tariffs is arguably of even greater long-term consequence. Ultimately, the whole CAP support system comes to be undermined if imports from the much lower priced world market can flow into the EU as a result of steadily reducing tariffs. A fundamental underlying reason for the already agreed 15% intervention price reduction 2005/6-2007/8, and an option of further reductions to 2015 as discussed later, is the apparent necessity to adjust the CAP price support system to fit in with GATT/WTO trade agreements. In this context, the WTO trade round negotiations, and in particular, the negotiations on tariffs are vital in determining the future shape of EU dairy policy in terms of both the level of internal price support achievable, and the price and volume of import access and status of export refunds. Already, informal opening positions on tariffs have been adopted by the leading players and the course of this debate will do much to shape future global dairy policy.
1.2.2 EU dairy policy Dairy policy for the years up to 2007/8 has been agreed under the Berlin agreement as follows: • Intervention prices unchanged to 2005, but reducing by 15% in three equal steps from 2005/6 to
2007/8 • Direct payments rising in three equal steps from 2005/6 to 2007/8 • Quota increases by 2.4% at EU level from commencement of Agenda 2000, with a flat rate increase
of 1.5% to come in 2005/6 to 2007/8. While Agenda 2000 is likely to hold firm, there has been recent proposals by the EU Commission in its Mid Term Review in relation to bringing the 2005/6-2007/8 changes forward. In July 2002, the European Commission document ‘Report on Milk Quotas’ provided a comprehensive review of dairy policy to date, and went on to outline a set of four policy options for the period beyond 2007/8, i.e. for the years 2008/9 to 2014/5. The results of a study of the consequences of implementing these options were outlined, including the estimated effect on milk product consumption, production, trade and prices, producer milk prices and the EU budget. The four policy options considered in the European Commission document for the period 2008/9 to 2014/5 are as follows: A: Status Quo: No policy change from final year of Agenda 2000, i.e. 2007/8 policy unchanged to
2014/2015. B: Repeat Agenda 2000: A further lowering of intervention prices by an average of 10% in three steps,
combined with a 3% rise in quotas and a further increase in direct payments. C: A two-tier quota regime (A and C quota): The A quota would equate to the level of unsubsidised
internal consumption, together with a more open unsubsidised C quota for exports, combined with the continuation of the Agenda 2000 direct payments at 2007/8 levels to 2014/15.
D: Abandonment of Quotas: Quota abandonment from 2007/8, with a doubling of Agenda 2000 direct payments (decoupled).
While this document launches an extended discussion on policy to 2015, one may already infer from it that Option B for the period 2009-2015 is close to Commission thinking currently, not least because it may
Strategic Development Plan for the Irish Dairy Processing Sector
17
fit well with the WTO trade round. However, there are some commentators who see this option as a step towards a longer-term move in the direction of Option D. This transition is predicted to be slow, and in response to increasing pressure from the WTO.
Recent developments Under the mid term review of Agenda 2000 the European Commission is seeking deeper cuts in EU support prices during the period of 2004-08. The Commission has brought forward agenda 2000 proposals by one year from 2005 to 2004. This involves a 28% cut in the target price over five years starting from 2004 compared with a 17% cut over three years commencing in 2005. An increase in milk quota of 1% in 2007 and 2008 is proposed as well as compensation on the same basis as agenda 2000, at less than 60% of the price cuts, with the quota system being extended for a further six years to 2014. It is also proposed to tilt the intervention cuts more towards butter with intervention price cuts for butter of 7% per annum between 2004 and 2008, compared with SMP price cuts of 3.5% per annum. At the same time it is proposed that the automatic butter intervention would be stopped once purchases exceed 30,000 during the March – August each year (there would be no intervention outside of the March – August period) and be replaced with a tendering system. This would operate in a similar way to the existing scheme for SMP, where the current annual buying limit is 109,000T.
The Commission has also published its proposals for WTO negotiations calling for improved market opening and reduction in trade distorting support commencing in 2006 for 6 years. The key elements of the proposals include:
• Opening markets for farm imports by cutting tariffs by an average of 36%
• Scaling back all forms of export subsidies by 45%
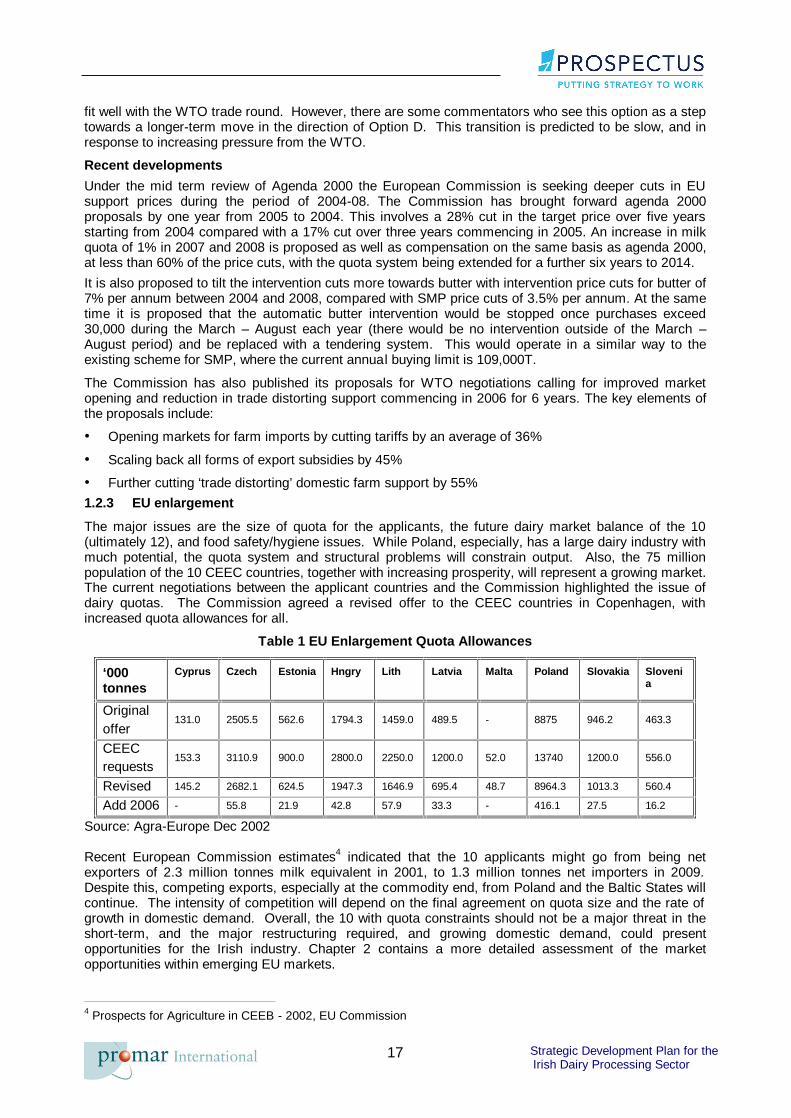
• Further cutting ‘trade distorting’ domestic farm support by 55% 1.2.3 EU enlargement The major issues are the size of quota for the applicants, the future dairy market balance of the 10 (ultimately 12), and food safety/hygiene issues. While Poland, especially, has a large dairy industry with much potential, the quota system and structural problems will constrain output. Also, the 75 million population of the 10 CEEC countries, together with increasing prosperity, will represent a growing market. The current negotiations between the applicant countries and the Commission highlighted the issue of dairy quotas. The Commission agreed a revised offer to the CEEC countries in Copenhagen, with increased quota allowances for all.
Table 1 EU Enlargement Quota Allowances
‘000 tonnes
Cyprus Czech Estonia Hngry Lith Latvia Malta Poland Slovakia Slovenia
Original offer
131.0 2505.5 562.6 1794.3 1459.0 489.5 - 8875 946.2 463.3
CEEC requests
153.3 3110.9 900.0 2800.0 2250.0 1200.0 52.0 13740 1200.0 556.0
Revised 145.2 2682.1 624.5 1947.3 1646.9 695.4 48.7 8964.3 1013.3 560.4
Add 2006 - 55.8 21.9 42.8 57.9 33.3 - 416.1 27.5 16.2
Source: Agra-Europe Dec 2002 Recent European Commission estimates4 indicated that the 10 applicants might go from being net exporters of 2.3 million tonnes milk equivalent in 2001, to 1.3 million tonnes net importers in 2009. Despite this, competing exports, especially at the commodity end, from Poland and the Baltic States will continue. The intensity of competition will depend on the final agreement on quota size and the rate of growth in domestic demand. Overall, the 10 with quota constraints should not be a major threat in the short-term, and the major restructuring required, and growing domestic demand, could present opportunities for the Irish industry. Chapter 2 contains a more detailed assessment of the market opportunities within emerging EU markets. 4 Prospects for Agriculture in CEEB - 2002, EU Commission

Strategic Development Plan for the Irish Dairy Processing Sector
18
2. Dairy production 2.1 Introduction The importance of the Irish dairy sector has long been recognised by successive Governments, who have been supportive in facilitating the development and expansion of the industry. State agencies such as the Department of Agriculture, Teagasc, Enterprise Ireland and Bord Bia work closely with the industry. In addition to the state agencies, the university sector, particularly UCC and UCD, have been important in advancing education and research in the dairy sector at both production and processing levels, and have been instrumental in developing a cadre of technically proficient talent to the industry.
Irish dairy farmers are considered to be both technically competent and commercially focused, with major changes having taken place in the structure of the industry at production level Significantly, over the last five years, the percentage of farmers producing over 275,000 litres has risen from 10% to 15% of the total number of producers. This scale has facilitated increased investment at farm level, and the adoption of a more commercial focus.
Ireland has enjoyed a comparative advantage in the production of milk within the EU This competitive advantage is due to the grass-based feeding system for its dairy herd. This is facilitated by the country’s moderate climate, which makes it very suitable for grass production. The grass-based feeding system has been more cost efficient than the mainly grain-fed systems used in continental EU countries. The pasture-based feeding system also has the advantage of being able to be portrayed as a more natural production for dairy cows and milk production. Ireland has been able to build on this comparative advantage to develop an industry in which over 80% of its processed output is exported.
However, dairy farmers are facing some significant challenges and issues at a structural level There is widespread concern about the future viability of dairy farming in a sector facing increasing costs, static or falling prices for their milk, and major restrictions on their ability to improve efficiencies by increasing scale and maximising production from their farm units. This is highlighted by the difficulties that are being encountered in attracting sufficient numbers of young farmers into the sector, and the constraints on the more progressive and efficient farmers to increase scale. This has been a result of a number of factors, including the restrictive nature of the quota system, an increase of 40% in industrial wages over the last decade widening the gap between industrial and agricultural incomes, and Ireland’s cultural attachment to land ownership, resulting in uneconomic land prices that increases the costs of production and also acts as an expansion constraint for farmers. With the cost of hiring labour or farm relief also rising, it is likely that retaining and attracting dairy farmers will remain a challenge.
There is a strong focus within Irish dairy farming on the price that is paid for milk, with considerable attention being paid to the annual milk price audit and monthly league tables. While the importance of the milk price is understandable, given the pressures on farm incomes, it can however inhibit longer term strategic planning for the industry as a whole. The dairy industry is critically dependent on its ability to produce products that are in demand and that are competitive on international markets. This requires continuous and significant investment aimed at improving the quality, attractiveness and value-added content of its products. It also requires an unrelenting focus on improving efficiency and productivity at every level of the production chain, from pasture to the product purchaser. An over concentration on the issue of current milk prices may detract from the need for medium to longer term strategic planning and investment. The Irish dairy processing sector faces international competitors who have adopted strategies of dramatically increasing their scale, and their levels of investment in R&D and in plant. Irish dairy farmers need the processing sector to be internationally competitive, and to increase the levels of returns it achieves for Irish dairy products.
Going forward, it may be necessary to review and change the way in which milk production is organised in Ireland This would involve addressing issues such as changes in the scale of production, management of the location of the milk pool, and providing appropriate encouragement to the next generation of farmers. These changes are discussed in chapter 3.

Strategic Development Plan for the Irish Dairy Processing Sector
19
2.2 Profile of the production sector The number of milk producers has continued to fall since 1984 There has been a continual reduction in the number of producers involved in milk production in Ireland since the introduction of the quota regime in 1984, when there were 68,000 dairy farmers. Over the last decade, the numbers have fallen by 50%, from 57,000 to, around just 28,000 in 2001. According to the Department of Agriculture projections, a similar rate of reduction during the next decade will result in a dairy industry containing 14,000 producers in 2010.
The quota regime has also meant that the level of total milk deliveries has remained relatively constant over the last decade, reaching 5,338,000 tonnes in 2001. The level of milk deliveries in Ireland’s main EU competitors Denmark and the Netherlands has also remained static due to the cap on production at 4,418,000 tonnes and 10,683,000 tonnes respectively, in 2001. In contrast, New Zealand, which does not have a cap on production restriction, increased the volume of milk deliveries from 1991 to 2001 by 74%, reaching 12,322,000 tonnes in 2001.
As the number of producers has fallen, producer size has risen Since 1996, the percentage of total quota held by farmers with a quota under 180,000 litres has fallen from 51% to 34%, with a consequential rise from 49% to 66% in the percentage with a quota over 180,000 litres. The absolute number of farmers has also followed this trend, with the percentage of total producers with under 180,000 litres falling from 79% to 59%. While the number of producers has decreased significantly, the average quantity of milk deliveries by producers has consequently increased The average delivery by milk producers has risen from 76,000 litres in 1984 to 180,000 litres in 2001. The average number of cows per farm has increased by 89% over the last decade, from 24.2 in 1991 to 45.7 in 2001. Over the same time period, average milk yield has risen by only 14%, to 4,375 kg per annum in 2001.
Figure 1 Distribution of dairy farmers by quota size
79%
12% 10%
59%
26%
15%
Under 180,000 litres 180,000 litres to 275,000 litres Over 275,000 litres
1996 2001
Source: Department of Agriculture and Food, 2002 However, while the scale of Irish producers has increased, the rate of this change is significantly slower than its EU competitors Ireland still has a relatively large number of small producers, and the average quota size for the country is 189 tonnes (40,000 gallons), compared to an average quota of 362 tonnes (77,000 gallons) in Northern Ireland.

Strategic Development Plan for the Irish Dairy Processing Sector
20
In Denmark, a country with a milk production level of 4,418,000 tonnes in 2001, the number of dairy farmers has fallen from 20,000 in 1991 to 8,911 in 2001, while the average quota per farm has increased from 234 tonnes (50,000 gallons) in 1991 to around 500 tonnes (107,000 gallons) in 2001, an increase of 114%.
Likewise, in the Netherlands, dairy farmer numbers have declined from around 47,000 in 1991 to about 28,000 in 2001, and the average quota size has increased from 234 tonnes (50,000 gallons) in 1991 to 394 tonnes (84,000 gallons) in 2001.
The approaches and attitudes to quota policy and how quota is managed differ between countries. However, the practical effect of these policies and approaches has meant that in Northern Ireland, Denmark and the Netherlands, farmers have been able to substantially increase their quota size, while it remains quite difficult for Irish farmers to significantly increase their milk quota under the current management arrangements of the quota system.
Figure 2 Number of dairy farmers 1991-2001
57,000
46,977
35,383
20,000
8,911
13,892
28,17429,07131,65032,850
35,027
38,557 37,122
27,92629,467
9,76710,56811,37112,282
14,685
14,741 14,673 14,362 13,861
1991 1997 1998 1999 2000 2001
Ireland Netherlands Denmark New Zealand Source: Eurostat, 2002
Concern has been expressed about the future viability of the smaller dairy farming enterprises, which are facing a price-cost squeeze Research by Boyle (2002) on the competitiveness of Irish agriculture, found that in relation to dairy farming, Ireland lacks the necessary scale to adequately remunerate owner labour and assets. Likewise, research by Teagasc (Hennessy 2001), suggests that dairy farmers are facing a price-cost squeeze. High rates of inflation will increase production costs, with fixed costs projected to rise by 15 to 20% impacting negatively on farm net margin. Thus, the Teagasc research indicates that farmers will have to respond by increasing efficiency, enlarging operations, or a combination of both. The same research goes on to analyse the impact of milk quota elimination on farms and estimate the level of production required to maintain living standards. It concludes that substantial expansion of production is required if farmers wish to maintain real incomes. For example, the typical farm supplying just under 80 tonnes in 1999 would need to increase production by 85% to 140% (by 68 tonnes to 112 tonnes) to maintain real income. Even at 200 tonnes, this is only at 40% of the average size of Danish dairy farmers. The seasonality of milk supply is a major feature of production in Ireland With the exception of liquid milk producers, Irish dairy farmers have continually adjusted the date of calving, so that through compact calving the total herd calves around the time of lowest milk production cost. While this maximises production cost efficiency from a grass-based production perspective, it also results in increasing supply levels in the peak months of March to June. The table below illustrates how seasonality has actually gradually disimproved over the decade. In 2001, the peak month production

Strategic Development Plan for the Irish Dairy Processing Sector
21
(May), as measured by milk deliveries, was six times the lowest month’s production (January). This ratio has gradually disimproved over the last decade, having gone as low as 4.7 in 1993.
Table 2 Seasonality of milk supply (‘000 tonnes)
1991 1997 1998 1999 2000 2001
Peak month milk deliveries 740 748 700 710 717 731
Low month milk deliveries 137 131 124 119 122 122
Peak to trough ratio 5.4 5.7 5.6 6.0 5.9 6.0
Source: Department of Agriculture and Food (2002)
Figure 3 Monthly deliveries of milk
0
100
200
300
400
500
600
700
800
Jan Feb Mar Apr May Jun Jul Aug Sep Oct Nov Dec
19932001
‘000
tonn
es
Source: Department of Agriculture and Food (2002) and CSO (2002)
Ireland’s main EU competitors do not have a seasonality problem Ireland’s main EU competitors, Denmark and the Netherlands, have both managed to improve their peak to trough ratios, while Ireland’s has gone in the other direction. It is also worth noting that milk supply in Northern Ireland is considerably less seasonal, indeed its peak to trough ratio has fallen from 1.7 in 1996 to 1.6 in 2001.
Table 3 Peak to trough ratios
1991 1997 1998 1999 2000 2001
Ireland 5.40 5.71 5.65 5.97 5.89 5.99
Denmark 1.22 1.24 1.21 1.20 1.16 1.21
Netherlands 1.23 1.17 1.37 1.19 1.14 1.15
New Zealand n/a 97.73 116.91 77.42 82.88 n/a
Source: IDB, Eurostat, Dexel, (2002)
This seasonality leads to poor capacity utilisation in the Irish processing sector, adding to the operating costs of processors Ireland’s capacity utilisation (measured by 12 times peak month production as a percentage of current total production) has only registered a slight increase from 57.9% in 1986 to 60.8% in 2001. This compares to capacity utilisation levels of 92.3% for Denmark and 92.9% for the Netherlands, facilitated by their low peak trough ratios of 1.21 and 1.15.

Strategic Development Plan for the Irish Dairy Processing Sector
22
Seasonality also causes a mismatch between market need, which for many products is for fairly constant all year round supply Crucially, Ireland’s seasonality also restricts the types of products that can be produced, and continues to act as a significant constraint on the Irish industry. If seasonality remains it will continue to constrict the ability to produce certain products that require year round milk supply. The opportunity and viability of altering the product mix to higher value products and, consequently, the ability to pay an additional premium to compensate somewhat for the increased production costs associated with off-peak milk, is discussed in chapter 3.
The fat and protein levels of Irish milk is below that of its main competitors Both the fat and protein content of Irish milk has improved over the last decade. The average fat content of Irish milk has risen from 3.55% to 3.80%, while the average protein content has risen from 3.20% to 3.28%. However, as the table below illustrates, the constituent fat and protein levels in Irish milk are below not only the EU average, but also well below its competitors such as Denmark, Holland and New Zealand5.
Table 4 Protein and Fat Levels (2001)
2001 Ireland Denmark Netherlands New Zealand
EU Average
% Protein 3.28 3.41 3.46 3.64 3.30
% Fat 3.80 4.33 4.44 4.84 4.12
Source: Eurostat, ZMP National Statistics (2002)
Lower fat and protein levels add to the costs of Irish processors, who have to process greater volumes of milk to obtain value ingredients Keane and Fingleton have developed a measure of competitiveness using cost per kg milk solids (% fat and % protein combined). Their research, set out in the table below, found that over the last decade, Ireland has become less competitive relative to its main EU competitors. For example, Ireland’s production costs using this measure were 52% lower than Denmark in 1989, but this had fallen to only 34% lower by 1999.
Table 5 Production cash costs (€ per kg milk solids6)
Ireland Denmark Netherlands New Zealand
1989 2.22 3.38 2.45 0.85
1994 2.35 3.60 2.79 1.34
1999 2.59 3.48 2.82 2.08
Source: Keane 2002 (Derived from Boyle 2002)
The dramatic rise in New Zealand production costs can be explained, in part, by exchange rate changes over the period.
There is an inconsistency and variability of milk produced from grass-based production The predominance of grass-based production, and the seasonality of that production in Ireland, results in inconsistency and variability in the milk produced. This inhibits the processors as they attempt to meet the demands of their customers, and the market, for standard products all year round. The table below
5 The breed of cow used for milk production has an influence on the fat level. In the case of New Zealand they have predominantly gone for a Jersey breed or a cross breed of Jersey & Friesian) which produces a higher fat content level but at lower milk yield per cow than that obtained by Irish dairy farmers. The NZ industry works on milk solids payment system, where value is got from the % of protein and % of fat, but there is a discount applied for volume. This explains why the industry has moved towards a higher milk fat and lower volume cow. 6 Milk solids = % fat and % protein combined

Strategic Development Plan for the Irish Dairy Processing Sector
23
illustrates the variance that exists in both protein and fat levels by comparing the months with the lowest and highest levels for 1991 and 2001.
Table 6 Irish protein and fat levels (1991 vs 2001)
1991 % difference 2001 %
difference
Lowest monthly protein level 2.91 3.02
Highest monthly protein level 3.56 22.3%
3.61 19.5%
Lowest monthly fat level 3.39 3.52
Highest monthly fat level 4.03 18.9%
4.20 19.3%
Source: CSO (2002)
The table shows that over the last decade, Ireland has continued to have a difference of roughly 19% between peak and low months for both fat and protein. This compares with average variations of about 5% in Denmark and 8% in the Netherlands between peak and low months for fat and protein percentage. This difference would suggest that dairy processors in these two countries would have less variation in raw product than Ireland. This should in turn result in more uniform plant extraction rates, and lessens the need for seasonal adjustments to plants to optimise product yields.
There has been erosion of Ireland’s competitiveness in recent years The Irish climate, with its moderate winters, enables farmers to feed their cows on grassland pasture for an extended period, and to utilise silage from the peak grass-growing period as winter feed. This reduces the feed costs for Irish farmers in comparison to their main EU competitors. Teagasc estimates that over 80% of milk produced in Ireland, and almost all used in dairy products, is produced almost exclusively from grazed grass.
Research by Boyle et al7, on the competitiveness of Irish dairy farming, found that Ireland’s cost advantage over seven other EU countries (Germany, France, Italy, Belgium, the Netherlands, Denmark and the UK), has gradually fallen over the period from 1989 to 1999. This loss of competitiveness is due in part to the introduction of maize subsidies and reductions in world grain prices, both of which favour non-grass based production. However, Ireland’s high rate of inflation has also been a contributory factor.
The table below provides data on simple cash costs of Irish producers, but also provides data on economic costs and costs measured as a percentage of output. Economic costs take into account non-cash costs such as family labour, equity capital and owned land. Expressing costs as a percentage of output value takes into account the prices received for products sold, and thus factors in higher processing costs and poorer market returns (poorer product portfolio) due to seasonality and low and variable milk solids.
Table 7 Irish milk production costs
1989 1995 1999
Milk production cash costs (€ per 100 kgs milk) 15 (82) 16 (82) 18 (90)
Milk production cash costs (as a % of output value) 52 (89) 61 (95) 66 (100)
Milk production economic costs (€ per 100 kgs milk) 31 (96) 37 (103) 37 (105)
Milk production economic costs (as a % of output value) 111 (108) 139 (119) 140 (121) Source: Boyle et al. (2002), (Number in bracket is Ireland as a % of EU average) Ireland’s cash costs per 100kgs of product volume have increased from being 82% of the average in 1989, to 90% at the end of the 1990s Measuring total economic costs per kg, Boyle found that Ireland’s economic costs per 100kg milk have risen from 96% of the average in 1989 to 105% in 1999. Boyle suggests that measuring costs as a 7 The Competitiveness of Irish Agriculture Updated Edition 2002, Boyle, Brown & O’Regan

Strategic Development Plan for the Irish Dairy Processing Sector
24
percentage of output value is a more comprehensive overall measure of competitiveness. In an Irish dairying context, it reflects the idea that while milk production costs may be low relative to other EU countries, the seasonality and low milk solids content of milk results in high processing costs and poorer market returns. Using both cash costs and economic cost measures as a percentage of output value, Boyle again found that Ireland has become steadily less competitive relative to EU rivals over the 1990s, with cash costs rising from 89% of the EU average to 100%, and economic costs rising from 108% to 121% of the EU average.
By analysing Ireland’s costs relative to the other seven EU countries in Boyle’s research (as indicated by the figures in brackets), it is clear that all measures indicate that Ireland has become less competitive over the decade. Given that dairy producers are likely to face continued price pressure, these rising production costs are now placing producers in a difficult position – and one that must be addressed to ensure future viability.
2.3 Issues that need to be addressed at production level There is a need to ensure that there is a viable future for farmers who remain in dairying The average size of Irish dairy farms is considerably below that in competing countries. The price cost squeeze facing the production sector will accelerate the exodus from dairying, as the value of EU price supports are reduced in the coming years. While the processing sector needs to strive to improve the return it obtains for its output by increasing the value-added content of its products, the value of the increased returns achieved may not be sufficient for the future viability of many dairy farmers, given the strong competitive challenges in the international market place. To obtain a viable income from dairying in the future, farmers will have to respond by a combination of increasing efficiency and substantially enlarging their operations. This will be difficult to achieve in the absence of a radical change in policy on the management of the milk quotas, where currently only small increments in certain locations are available, and the relatively high cost of land.
The seasonality of milk supply needs to be addressed Seasonality is a major issue facing the industry, but it is also one that has existed for a long period. How the industry deals with the country’s seasonal milk production will determine, in large part, the type of products produced by the industry and the markets served. Addressing this issue will require co-operation between farmers and processors, and is likely to involve fundamental structural reform. If the industry does not address this issue, it must accept the consequences of the reduced number of opportunities available, and confine itself to products that are low in moisture and capable of storage.
Improving fat and protein levels and consistency Ireland’s low fat and protein levels, and the inconsistency of these levels throughout the year, act as significant disadvantages to the Irish dairy industry as a whole. While initiatives such as the campaign run by Teagasc, have resulted in an improvement over the last decade of 7% in fat content and 2.5% in protein content, Ireland remains well behind countries such as Denmark, Holland and New Zealand. The dairy industry needs to address this issue that many consider to be a fundamental weakness. While the low fat and protein levels add to processors’ costs, the inconsistency of these levels can cause problems when marketing and selling products. Fundamentally, when processors cannot produce a consistent product year round, they face major problems selling certain products where consistency of texture, flavour, functionality and year round supply are essential.
Maintaining Ireland’s competitiveness There are a number of factors that have reduced, and continue to reduce, Ireland’s competitive advantage. These factors include the rate of farmer rationalisation and the relatively small scale of dairy farms, both of which are in contrast to Ireland’s major competitors. The Irish industry is also facing severe price pressure due to poor market conditions, while also encountering rising costs of operations.

Strategic Development Plan for the Irish Dairy Processing Sector
25
3. Dairy processing structure and efficiency 3.1 Profile of the processing sector 3.1.1 Level of industry consolidation While the structure of the Irish dairy processing sector has changed considerably over the last decade, it remains fragmented in nature when compared to its major competitors At present, six companies process 80% of the milk pool of 5.338 million tonnes, with this number rising to eight processing 90% of the milk pool. Data for 2001 gathered from processors for this study8, indicate that the four largest processors account for 73% of sales, with the remaining nine processors accounting for just 27%.
The pace of overall rationalisation in the Irish industry has been much slower than that of its competitors Despite the reduction in the number of processing companies and plants that has already occurred, the Irish dairy processing industry remains fragmented, and individual processors are of a considerably smaller scale than processors in competing countries such as Denmark, Holland and New Zealand.
Evidence of the fragmented nature of the industry is illustrated by comparing the number of processors that account for 80% of the milk pool in these countries.
Table 8 Number of companies processing 80% of the milk pool
Year 2001 Ireland Denmark Netherlands New Zealand Number of companies processing 80% of the milk 6 1 2 1
Source: Promar and Prospectus research
In 2001, the four largest Irish processors handled 3.81 million tonnes of raw milk, compared to Arla’s 3.97 million tonnes in Denmark, Friesland Coberco’s 5.20 million tonnes, and Fonterra’s 13.5 million tonnes during the same period. The consolidation within the Danish, Dutch and New Zealand dairy industries has been achieved through the adoption of deliberate strategies to create large-scale international dairy operations. Due to capped production, the European operators have looked to gain economies of scale through the construction of larger plants to replace smaller, older, less efficient sites. The recent announcement that Denmark’s second largest co-operative, Hellevad Omegns, is to merge with Arla, will see Arla processing 91% of the country’s total milk pool. In conjunction with this expansion of operations, the company has earmarked 9 plants for closure within the next two years, while at the same time upgrading existing plants to increase throughput and constructing higher capacity new facilities.
Like the Danes, the Dutch have also consolidated their processing industry in recent years, resulting in the two major players, Friesland Coberco and Campina, accounting for 82% of all milk processed. These two players have presided over an industry that has seen the number of processing sites decline from 95 to 63 in the period between 1990 and 2001.
Meanwhile, the consolidation of the New Zealand dairy industry has, in the main, been at a company, rather than a plant level. (The formation of Fonterra actually came from a base of 15 separate dairy co-operatives as recently as 1992.) This is due to the fact that New Zealand does not have constrained production systems, and new processing plants are generally built to process additional volumes of milk produced. This had led to the development of super-sites that process up to 15m litres of milk per day, that operate together with older, smaller plants.
The relatively large number of processors in the Irish industry leads to duplication of effort, particularly of support services such as IT, human resources, finance and management, testing, product development and marketing, and inefficiencies in assembly and processing.
8 As part of this study, a detailed questionnaire was completed by 13 dairy processors representing the vast bulk of the milk processed in Ireland. The processors were Arrabawn, Carbery, Connacht Gold, Dairygold, Donegal, Glanbia, Kerry, Lakelands, Newmarket, North Cork, Town of Monaghan, Tipperary and Wexford

Strategic Development Plan for the Irish Dairy Processing Sector
26
3.1.2 Plant product output volumes Apart from butter, the number of processing plants in Ireland has not changed very much since 1991 There is limited data available in relation to processing plants, but the table below provides an overview of how the number of processing plants has changed over the last decade. This data is based on information from various sources, including ICOS and data provided by processors for this study, thus it includes smaller plants producing limited quantities of some products.
Table 9 Number of Irish processing plants, by product output
1991 1994 1997 1999 2002 Cheese 9 12 11 10 10 Butter 20 19 16 15 11 Powder 12 14 11 13 11 Casein n/a n/a n/a 7 7
Source: ICOS, ZMP, Promar and Prospectus Research (2002)
Average production in both cheese and butter plants has risen considerably over the last decade
The most noticeable change in the main product plants has been the reduction in the number of butter plants, falling from 20 plants in 1991 to 11 plants currently, with butter production falling by just 8.6% during the same period. It is also worth noting that while the number of cheese plants has only risen from 9 to 10 over the last decade, production of cheese has risen by 67% in this period.
While the number of companies processing the majority of the milk pool provides an indication of the level of concentration and the scale of individual companies that exists within an industry, it is also necessary to investigate other measures of scale. One such measure of scale is the average size of plants, as measured by the average annual production of each product by each plant. Changes in production are taken into account by determining the average plant output as measured by the average annual production for each plant.
Table 10 Average output of plants - Ireland (average annual production ’000 tonnes)
1991 1994 1997 1999 2001/2 Cheese 8.0 7.8 7.8 9.7 12.0 Butter 7.0 6.7 8.7 9.0 11.6 Powder9 (WMP & SMP) 17.2 11.8 13.0 10.0 9.9 Casein - - - 6.6 6.9
Source: ICOS, ZMP, Promar and Prospectus Research (2002)
A significant proportion of the increased average butter production per plant has occurred in the last three to four years, driven by the reduction in the number of plants from 15 to 11. Average cheese production has increased to 12,000 tonnes due to greater use of existing capacity. The figures for powder production are in stark contrast to cheese and butter, with average production falling from 17,200 tonnes in 1991 to just 9,900 tonnes in 2001. However, these powder production figures relate to SMP and WMP production only and do not take into account the use of these plants for the production of other products such as whey powder and fat filled milk powder (no official published production figures are available for these products). Using the data provided by processors for this study on the production of these other products it is clear that processors have switched to producing powders other than SMP and WMP. Indeed, when whey powder and fat filled milk powder production are included (using data from processors) the average output from powder plants is just under 19,000 tonnes per annum. The average production of casein has remained steady at just under 7,000 tonnes for the last number of years.
9 SMP and WMP only. As published industry data is not available for other products such as whey powder or fat filled milk powder, it is not possible to provide an accurate average output figure with these products included. As resul t the apparent drop in average powder output is deceptive, as it does not include whey or fat-filled powder from these plants.

Strategic Development Plan for the Irish Dairy Processing Sector
27
It is necessary to look beyond average plant output and take into account the impact of large or small plants It is important to look beyond simple industry average outputs of individual products. The data on plant size supplied by processors for this study, provides a more detailed picture of the current structure of the industry. The table below illustrates the average output of the two largest plants, based on the data supplied by processors.
Table 11 Largest Irish plants
Butter Cheese Powder4 (SMP & WMP)
Casein
Ireland - average output of the two largest plants (‘000 tonnes)
33 24 19.5 14.2
Promar and Prospectus Research (2002)
The respective plants accounted for 52% of the total butter production in 2001, 40% of the cheese, 36% of the total powder and 59% of total casein production. This suggests that there are already a number of plants within the country of comparable competitive scale.
However, there are also some plants producing very small amounts of product. There are also certain product types where scale of production is not the critical factor, but rather product innovation and specialisation, and the ability to produce product output levels that are appropriate to meet the demand for their specific product or market niche. This is particularly true for the production of specialist cheeses and other high value-added products. Denmark has seen strong growth in the number of small specialist operators in parallel with the process of major consolidation of the industry, with one player processing 90% of milk. In the area of the production of commodity type products such as powder, bulk cheese and butter, however, the trend is for larger scale plants to achieve economies of scale and greater efficiency.
In determining an appropriate future plant configuration for the industry in chapter 3, consideration is given to both the published data and the information provided by processors for this study, particularly in relation to the production of products such as whey powders and fat filled milk powders.
The average output of Irish cheese plants is less than half that in the Netherlands The tables below provide the average plant size for cheese, butter and powder plants in Ireland, Denmark, the Netherlands and New Zealand.
Table 12 Average plant size – Cheese
‘000 tonnes 1991 1994 1997 1999 2001
Ireland 8.0 7.8 7.8 9.7 12.0
Denmark10 5.1 5.6 6.9 6.9 8.9
Netherlands11 11.912 18.5 19.2 20.8 24.7
New Zealand n/a n/a n/a n/a 31.3
Source: ICOS, ZMP, IDB, Promar and Prospectus Research, (2002)
The figures for average cheese plant size illustrate that while production output in Ireland has increased by 50% over the last decade, both Denmark and the Netherlands have increased by roughly double this, at 94% and 106% respectively.
In absolute terms, Ireland, at an average of 12,000 tonnes per plant, is well behind the output levels of both the Netherlands (24,700 tonnes) and New Zealand (31,300 tonnes), although as indicated above, the largest Irish plants are similar in scale to these countries’ average plant output. While the figures
10 Excludes private dairy production 11 All data for the Netherlands for 1991 and 1994 actually refers to 1990 and 1995 respectively 12 1990

Strategic Development Plan for the Irish Dairy Processing Sector
28
appear to indicate a smaller scale exists in Denmark, a more detailed analysis suggests that this is not quite the case. Of the 62 Danish cheese plants that existed in 2001, The 14 largest plants accounted for 75% of cheese production, giving an average output of 17,000 tonnes for these plants, with the remaining 48 plants producing only 25% of the total cheese produced. An indication of the specialised nature of some of the smaller plants can be obtained from the fact that 18 Danish cheese plants produced less that 400 tonnes in 2001. While it is difficult to determine the scale of production for bulk cheeses in Ireland, the data suggests that Ireland currently has a smaller scale of bulk cheese production than its major competitors. In chapter 3, section 3.2, consideration is given to research by Teagasc on the efficiency of cheese production in Ireland along with other factors to consider in determining the most efficient scale for the Irish industry.
The output from Irish butter plants is also considerably below that of their main competitors Table 13 Average plant size – Butter
‘000 tonnes 1991 1994 1997 1999 2001
Ireland 7.0 6.7 8.7 9.0 11.6
Denmark13 3.1 3.4 4.1 4.2 5.7
Netherlands 9.9 16.5 19.2 17.5 21.7
New Zealand n/a n/a n/a n/a 35.2 Source: ICOS, ZMP, IDB, Promar and Prospectus Research (2002)
The average Irish butter plant output, at 11,600 tonnes per plant, is well behind both the Netherlands at 21,700 tonnes and New Zealand at 35,200 tonnes. The average production per plant for Denmark of 5,700 tonnes is again misleading, given that 3 of the 30 butter plants account for 84% of the total butter production, with an average size of 12,941 tonnes for these three plants, but the largest being quoted as having a capacity of 50,000 tonnes. The figures for average powder plant output demonstrate that a gap exists between the plant product output levels in Ireland, and the plant product output levels in all three countries that Ireland has been benchmarked against
Table 14 Average plant output – Powder14
‘000 tonnes 1991 1994 1997 1999 2001
Ireland 17.2 11.8 13.0 10.0 9.9
Denmark 12.5 13.4 18.1 18.9 18.3
Netherlands 7.715 14.116 12.6 18.4 16.0
New Zealand n/a n/a n/a n/a 69.6 Source: ICOS, ZMP, IDB, Promar and Prospectus Research (2002) The average powder (SMP and WMP only) production per plant in Ireland is just over half of Denmark and the Netherlands, and one seventh of New Zealand’s. Although published data isn’t available for whey powders in all countries, we have used the estimates available 17 to determine the average plant output including SMP, WMP and whey powders. In 2001, the average output of SMP, WMP and whey powder per plant in Ireland was 19,000 tonnes compared to 23,400 tonnes in Denmark, 35,900 tonnes in the Netherlands and 71,900 tonnes in New Zealand. The data above suggests that the current configuration
13 Excludes private dairy production 14 Average production of SMP and WMP only – it is not possible to directly compare average production of all powders using official data as only published data on SMP and WMP is available in all countries 15 1990 16 1995 17 Whey powder estimates: Irish data based on information provided by processors for this study and includes whey powder and fat filled milk powders, Danish data from FAOSTAT, Netherlands data from Productschap Zuivel, New Zealand data from Statistics New Zealand

Strategic Development Plan for the Irish Dairy Processing Sector
29
of Irish processing plants fails to gain the economies of scale, such as reduced capital and labour costs, that are being achieved by its competitors. This is of particular importance in the production of base products such as butter, powder and bulk cheeses, where cost competitiveness is essential.
3.1.3 Efficiency of processors The downward price pressure facing commodity products over the medium to long term, is driving processors of these products to focus on scale and efficiency To compete effectively in commodity markets, the Irish industry will have to be cost competitive, and will need to obtain the benefits that are available from economies of scale. Scale will also be a key factor in enabling processors to meet the requirements of the buyers of commodity products for their suppliers to be able to supply large volumes. To achieve this scale will require significant capital investment and co -ordination between processors at an industry level, to avoid unnecessary duplication of effort and investment. While a more pragmatic approach has been adopted within the Irish industry over the last decade, with greater co-operation taking place between processors regarding cost management (for example, in the area of milk assembly), its fragmented structure and lack of scale still poses major challenges for the industry in the future. A number of processors have achieved progress in operating at outputs levels, which bring them advantages from economies of scale. However, there are still a relatively high number of processors producing small quantities of base products and these operators will find it increasingly difficult to survive unless they switch their activities to more specialised and value-added products. Data provided by processors indicates that larger scale processors achieve higher margins While many factors influence the margins achieved by processors, the most important factors are the price paid for milk, the product mix of the processor, and the efficiency of the processor’s production operations. While some exceptions exist, the data provided by processors for this study identifies a strong correlation between scale of the operation and margin achieved, with larger scale processors achieving higher margins. This is in line with conventional wisdom that suggests that increasing the scale of production results in greater efficiencies up to a certain optimal level, after which benefits gained are less than the additional costs incurred. Research by Teagasc18, illustrated in the graph below, found that the greatest increases in efficiency for Irish processors came from moving from small to medium scale operations. The larger processors have the ability to produce larger quantities of product with improved efficiency that contributes to better margins.
Figure 4 Plant scale and fixed costs for powder production
100
120
140
160
180
200
2.5 5 7.5 10 12.5 15
Scale (tonnes/h)
Fixe
d co
sts
While some smaller processors are delivering higher margins, this is often linked to the production of higher margin products, rather than more efficient production. The link between scale and margins is made more difficult to determine due to the differing approaches and policies of co-ops and plcs. This difference is between providing returns through a higher milk price, or through increased profits that are either reinvested in the business or distributed to shareholders. A more detailed discussion of the need for scale in the context of the overall future direction of the Irish industry is included in Chapter 3.
18 O’Callaghan et al, A Cost Model Approach to Capital Re-Investment Choices for Competitive Milk Powder Manufacture in Ireland, 2000

Strategic Development Plan for the Irish Dairy Processing Sector
30
3.1.4 Plant capacity utilisation In order to compare the efficiency of Irish processors with other countries, a number of measures have been used. Capacity utilisation provides an indication of how efficiently plant and equipment is utilised, while raw milk processed per employee captures the efficiency of employee input. It should be noted, however, that measures that rely on reported employee numbers must be used cautiously, given the potential distortions caused by part time employees, and the differences in time of year the data is gathered.
Table 15 Capacity utilisation19 (%)
1991 1997 1998 1999 2000 2001
Ireland 58.7 58.6 60.6 60.2 60.0 60.8
Denmark 89.8 91.9 92.0 92.2 92.3 92.3
The Netherlands 90.4 92.2 88.8 91.2 93.6 92.9
New Zealand n/a 52.1 51.8 48.1 52.2 n/a Source: Derived from CSO data, Eurostat (2002)
The capacity utilisation figures demonstrate the negative impact that seasonal milk supply has on the processing sector in both New Zealand and Ireland While difficult to quantify accurately, it is clear that there is a cost associated with lower capacity utilisation that is borne by the processors. Put simply, those with higher capacity utilisation levels are able to make their investment in plant and equipment work harder for them, and produce greater quantities of product. While Ireland’s lower capacity utilisation enables processors to switch between products in response to short term market trends, it does put Ireland at a disadvantage relative to countries such as Denmark and the Netherlands, which continue to operate plants all year round at close to full capacity. To counter the advantage of those with higher capacity utilisation levels, those with lower levels need to have lower input costs and/or lower overhead processing costs (labour, energy, etc), and/or higher value yielding products, or a combination of all three. New Zealand has countered its lower utilisation levels by having significantly lower input costs, and going for plant scale to handle peak volumes and obtain economies of scale from larger plants. Ireland has also used lower input costs to help maintain competitiveness, but with increasing domestic cost pressures and a difficult trading environment, this approach will become harder to sustain going forward, and the processing sector will have to turn its attention to improving cost efficiencies, and improving the value-added content of its output. This will require some movement on addressing the low capacity utilisation levels.
3.1.5 Raw milk processed per employee Interpretation of the data on raw milk processed per employee, included in the table below, must take into account the potential discrepancies caused by the collection and make up of employee numbers in each country. However, given the increasing production and large scale of plants in New Zealand, it is not surprising that they consistently process larger volumes of milk per employee. The higher volumes of milk processed in the Netherlands is consistent with the fact that it has some of the largest plants in Europe. Thus, Ireland at 560 tonnes per employee in 2000, is only ahead of Denmark using this measure of efficiency. Given the level of consolidation that has occurred within the Danish industry in recent years, one would have expected a higher productivity but using official Danish figures for the number of employees in dairy processing the raw milk tonnage processed per employee is significantly below that of Irish employees.
19 The capacity utilisation measure used here is defined as (annual milk deliveries)/peak month production x 12

Strategic Development Plan for the Irish Dairy Processing Sector
31
Table 16 Raw milk processed per employee (tonnes)
Ireland Denmark20 Netherlands New Zealand
1991 547 436 60021 n/a 1992 521 489 n/a n/a 1993 522 458 614 N/a 1994 504 448 663 N/a 1995 505 436 770 N/a 1996 511 440 878 1,237 1997 528 433 894 1,202 1998 532 444 917 1,340 1999 555 439 929 1,434 2000 560 451 881 1,120
Source: CSO, Danmarks Statistik, Nederlandse Zuivel Organisatie (NZO), Statistics New Zealand, ZMP (2002)
3.1.6 Role for smaller niche processors While much attention and focus is given to the larger players that dominate the dairy sector in countries such as Denmark and New Zealand, the smaller niche processors also play an important role in the industries of those countries. Examples of two processors that have succeeded through innovation and specialisation are included below. Tatua Dairy Co-operative While arguably operating in the shadow of Fonterra, this small 135 supplier co-op is one of New Zealand’s dairy industry success stories. Established in 1914, in the past decade the company has paid a premium price to its shareholders for milk by processing it into high value dairy ingredients. Based in the Waikato, the historic home of the New Zealand dairy industry, the company has followed a technology-led approach to the manufacture of dairy ingredients from 100 million litres of shareholder’s milk annually, and selling these to customers world-wide. 90% of all its manufactured goods are exported. Total annual company turnover in 2001 was €54m. The company states that its success is based around a customer and technology-led approach to generate new product solutions. These solutions see the company re-invest in NPD and research above the New Zealand dairy industry standards. Most of the products are sold through direct trading relationships between the company and its clients. Interestingly, this was also the case prior to the formation of Fonterra, when the New Zealand Dairy Board controlled the export of all dairy products. Thise Mejeri, Jutland
Founded in 1988, this small niche player has created a market position through providing higher value branded consumer goods, including organic and Channel Island milk products. Based in the Northern part of Jutland, Thise Dairy markets a wide variety of dairy products through the large supermarket chains, including Irma in Copenhagen. The company is seen as an innovator, and has recently launched a number of new products using Channel Island (Jersey and Guernsey cow’s milk). In addition to the Danish market, the company also exports goods to Sweden, France and the UK, having recently gaining a listing with Sainsbury’s for its organic spreads under the supermarket’s own-label. The success of Thise can be attributed to its commitment to innovation, and filling a market void left for niche products caused through the consolidation of the Danish dairy industry, driven in the main by Arla (MD Foods).
3.1.7 Infant formula manufacturers Presence of international infant formula food manufacturers in the Irish market Over the last two decades, Ireland has become one of the world’s leading producers of infant nutritionals. The presence in Ireland of some of the world’s leading infant nutrition manufacturers – Wyeth, Abbott and Numico – provides an important outlet for milk powder. The recent investment of €88m by Abbott Ireland in its Cootehill facility, doubling its capacity, is a positive sign for the industry, and was achieved against
20 Full-time equivalents except 1991; excludes ice-cream plants 21 1990

Strategic Development Plan for the Irish Dairy Processing Sector
32
strong competition from other countries. Indeed, the success of the infant nutrition business in Ireland is an indication of the dairy processing sector’s ability to produce the highest quality dairy products that meet the needs of demanding multinational organisations. An indication of the importance of this sector is provided by estimated labour and raw material costs of €226m per annum, with 840 people employed.
Up to now, the infant formula manufacturers based in Ireland produced relatively basic products, a large proportion of which was exported outside the EU, with export refunds being important for their international competitiveness. However, in recent years and with increasing potential going forward, the enhancement and extension of these products provides excellent potential to increase the value of these products to the industry. There are also opportunities for processors to work in partnership with the infant formula manufacturers to provide enhanced ingredient solutions. For example, enriched or fortified ingredients to improve the nutrition, well-being and/or health of a wider range of consumers, from infants to the elderly. The spin-offs from these partnerships are not only increased value for the products they supply, but also open up opportunities for the processors to utilise the technologies and skills acquired, to identify other applications and demand niches for enriched ingredients. Recent announcements of significant major expansions in this sector augurs well for the continued expansion and increasing value-added content of its output.
3.2 Processing structure and efficiency issues Aging plant in need of replacement in the medium term There has been ongoing investment by processors in plant since the last round of significant capital investment, supported by FEOGA funding, in the 1980s. However, there are indications that another round of major capital investment may be required to replace existing plant in the medium term. Over 70% of the processors surveyed as part of this study indicated that part of their current technology was either in need of upgrade, or only adequate for current needs.
Some processors are already beginning to find it difficult to meet certain product specifications of their customers with existing equipment. Irish processors selling within EU markets will continue to face pressure from buyers for greater product customisation. Many processors are therefore, likely to need to invest in plant and equipment to hold onto their customers. A number of processors could well come under pressure to upgrade facilities and face difficulty securing and/or affording the funding necessary for the capital investment due to low profitability levels and cash reserves.
Increasing costs and compliance requirements placed on processors to meet environmental, food safety and quality demands Processors are likely to continue to face increasing pressure from numerous sources to improve their quality assurance systems so that they will be able to meet the increasing levels of environmental and food safety standards. There are concerns not just about water and energy consumption, but also about effluent discharge and by-product management, in particular. This pressure is not only coming at an EU level through enforcement of existing regulations, but is also being driven down the food chain by consumers and retailers, bringing issues such as traceability to the forefront of the debate. The changes required to meet these environmental, quality and safety requirements will impose major costs on both producers and processors. While some processors have invested in these improvements on an on-going basis, it is likely that some processors will need to make significant investments, imposing a significant cost that will be difficult to absorb.
In planning for the future, the Irish dairy industry must continue to be vigilant and to be more proactive in its approach to food safety, quality and environmental standards. There are great risks in this whole area and just one incident could cause significant damage to the entire food industry and the reputation of Ireland as a quality and safe supplier of food products.

Strategic Development Plan for the Irish Dairy Processing Sector
33
3.3 Product mix of the Irish dairy processing sector 3.3.1 Product sales values Fresh milk products, butter and cheese accounted for over 50% of total sales of the thirteen dairy processors in 2001 The table below is based on data supplied by processors, and shows the average sales turnover breakdown for the thirteen processors for the main product types in 2001.
Table 17 Percentage of total sales turnover (2001)
Product type % of total sales turnover Fresh milk products (liquid milk, cream, yoghurt) 17% Butter 19% Cheese 18% Casein 14% SMP 7% WMP 7% Whey powder 2% Whey protein 2% Other (e.g. unprocessed milk, whole & skim milk, choc crumb, functional foods, lactose, alcohol etc)
14%
Source: Promar / Prospectus research There were significant variances in the market prices obtained by different processors for their products in 2001 Based on data supplied by processors, the following average prices were obtained for the main product types (excluding fresh products).
Table 18 Prices obtained for main product types (2001)
Product type Average price per tonne (domestic and export sales combined)
Butter €3,030 Cheese €3,620 SMP €2,310 Casein €7,110 WMP €2,420 Whey powder €710 Whey protein €1,540
Source: Promar / Prospectus research
There are a number of factors, which can influence the variances in the price achieved by different processors for the same product type. These include the level of product branding, product differentiation (properties, packaging, portions, etc.), the level of value-added to the base product, the proportion of domestic sales to export sales, the distribution channels used, the impact of seasonality (particularly, the time of year products are sold on markets), and the nature of the relationship between the processor and buyer.
3.3.2 Profitability The table below outlines the relative profitability of the main products. This table is based on gross margin data provided by processors as part of this study. It provides a broad picture of the relative profitability within Ireland’s product mix.

Strategic Development Plan for the Irish Dairy Processing Sector
34
Table 19 Relative profitability of main products
Gross margin Product
Higher margin products Liquid milk Cream Yoghurt
Medium margin products Casein (ates) Cheese
Low margin products WMP SMP Butter
Source: Promar / Prospectus research
The data received from processors in relation to the relative profitability of Ireland’s product mix is in line with conventional wisdom. Fresh products such as liquid milk, cream and yoghurt achieve higher margins. Relatively high margins are also being achieved in the high technology end of dairy ingredients for protein fractions and isolates such as WPI and WPH. There is then a significant gap to the products in the medium category, namely, casein and cheese (however, it is important to note that bulk/commodity cheese is generally a low margin yielding product). The products achieving low margins include both WMP and SMP, with butter achieving the lowest margins.
The particular product mix largely influences the profitability of the different processors Those processors having a higher weighting in fresh milk products, protein fractions, cheese and/or casein, are achieving higher profitability levels than those processors with a high reliance on butter and SMP in their product mix. In 2001, based on information supplied by 13 processors, the average profitability22 for the processors was 2.7%. The better performers achieved a profit margin in excess of 6%. This compares with 3.2% for Arla, 0.9% for Campina, 3.8% for Friesland and -0.06% for Fonterra. However, those Irish processors who had a product weighting in butter and SMP, accounting for in excess of 50% of their total product sales, achieved profit margins of less than 1% in 2001. The higher the weighting the processors had in these products, the lower the profit margin achieved.
3.4 Changes to Ireland’s product output mix over the last decade23 Ireland’s current more diversified product mix is reflected in the changes in Ireland’s production figures for key products from 1991 to 2001, as illustrated in the table below.
Table 20 Ireland - annual production by broad product type (‘000 tonnes)
1991 1997 1998 1999 2000 2001 % 1991/2001
Liquid milk 509 549 559 546 545 556 9.2 Butter 140 139 131 135 137 128 -8.6 Cheese 72 86 92 97 96 120 66.7 Whole milk powder 23 34 31 36 35 34 47.8 Skim milk powder 183 109 100 94 88 75 -59.0 Casein (ates) 27 42 42 46 46 48 77.8 Chocolate crumb 77 84 75 77 75 75 -2.6 Butteroil 6 9 8 7 7 7 16.7 Cream 8 10 10 10 10 10 25.0
Source: Eurostat, IDB, Dept. of Agriculture, ZMP (2002)
An overview of Ireland’s product mix and that of its main competitors is included in appendix III.
22 Profitability measures are just indicators of performance and have to be used with caution, particularly, when
looking at cross-country comparisons as there can be many varying factors influencing the declared profit level achieved by a company, for example, levels of re-investment, depreciation policy, tax planning etc.
23 Appendix 4 contains an overview of the product mix of the Irish industry and that of its main competitors

Strategic Development Plan for the Irish Dairy Processing Sector
35
3.4.1 Comparison of changes in competitor product mix The Danes and the Dutch have reduced their butter production significantly over the last decade Irish butter production has fallen by only 8.6% over the last decade, compared to a decrease of 35% in Danish production24 and 20% in Dutch production during the same period. During the same time period, the Danes have also increased the production of other products within their dairy portfolio in response to changing market conditions; for example, the production of chocolate milk, buttermilk powder and SMP have increased by 34%, 112% and 138% respectively, while WMP has declined by 19%. Increasing volumes of the Irish SMP production is being absorbed on the home market by the infant formula manufacturers based in Ireland.
In relation to Ireland’s product mix focus, the dairy industries of Denmark and the Netherlands have shifted their production in different directions
The Danes have increased production of more consumer-orientated products. This is a result of the dominance of the Danish industry by Arla, and its strategy to become more involved in branded consumer foods. This explains some of the increase in the production of liquid milk products by 71%, crème fraiche by 21%, and yoghurts by 12%.
This is not to say that the company is winding down the production of its base or more commodity type dairy products. The growth in products such as SMP is increasingly being accounted for by domestic purchasers (exports decreased by 14%, while production has increased by 138%). The domestic markets for SMP are in the manufacture of added value dairy products for sale within Denmark or for further sale outside Denmark, rather than being exported as a basic product or sold into EU intervention.
This trend is mirrored in the Netherlands, where during the past five years, SMP production has increased by 29,000 tonnes (Source: ZMP), while exports have actually declined by 4,500 tonnes (Source: ZMP), suggesting a greater utilisation of the product by domestic food industries that are adding value through the production of consumer and/or added value dairy products. Over the past decade, the Danes have also increased their cheese production. However, within this overall increase, there have been distinct differences in growth between cheese types. Production of semi-soft, semi-hard, hard and fresh cheeses have increased by 87,000 tonnes, while production of soft and extra-hard cheeses declined by 56,000 tonnes. This, again, reflects changing consumer habits that have seen the consumption of semi-soft and fresh cheese types grow at a faster rate than the total cheese market in past years.
Meanwhile, New Zealand’s total dairy production has grown by 12.5% in the past four years, but in the past decade, the relative product mix make-up has differed little, with butter, SMP and WMP accounting for 66% in total output in 1991, and 65% in 2001 This reflects the dependence of New Zealand on products that can be exported to distance markets in Asia, the Americas and Europe, rather than domestic consumer dairy foods markets. This said, the New Zealand dairy industry has invested in consumer product companies in many of these markets, to manufacture consumer dairy food and liquid milk for sale using milk powders from New Zealand.
When reviewing the trends in dairy product usage over the past ten years, the largest growth area has been the consumption of cheese
During the period, per capita usage has grown by 22%, while butter consumption has remained static, and liquid milk consumption declined by 4.3%. In particular, there has been significant growth in the usage of fresh and softer varieties of cheese, not a traditional strength of the Irish dairy industry. In addition, the growth in value-added consumer foods has driven the demand for SMP with this demand being matched by companies focused on the supply of branded dairy products, for example Arla and Friesland. In contrast, the production of SMP has declined in Ireland in response to declining world (and intervention) market prices and through switching to production of products such as casein. In chapter 2 we will assess future market demand for the different product types.
The impact of the product mix changes of the various products is reflected in the margin achieved per tonne of milk set out in the table below. 24 The reduction in Danish butter production may be due to increased production of Kaergaarden a mixed fat product with approximately 75% of its fat content coming from butterfat

Strategic Development Plan for the Irish Dairy Processing Sector
36
Table 21 Gross value-added from processing per tonne milk (2001)
Country
Output value per tonne
(Sales value / milk tonnage
processed)
Gross margin per tonne
(Value per tonne – cost of milk per
tonne)
Variance from output value achieved by
Irish industry
% Variance from output value
achieved by Irish industry
Ireland €470 per tonne €177 per tonne - - Denmark €656 per tonne €331 per tonne + €154 per tonne + 87% The Netherlands €531 per tonne €208 per tonne + €31 per tonne + 17% New Zealand €281 per tonne €76 per tonne - €102 per tonne -57%
Source: Promar / Prospectus research
The shift away from butter and towards higher value products has enabled these countries to achieve higher margins per tonne of milk. When reviewing the industry margins achieved by the various dairy industries benchmarked within this study, there is a inverse correlation between percentage of output of base dairy products and the value creation of the industry as measured by EVA. This is discussed in more detail in chapter 3.
3.4.2 Product mix issues 3.4.2.1 Impact of seasonal milk supply on product mix The seasonality of milk supply in Ireland has been discussed as a production issue, but from the processors’ perspective, seasonality has an extremely negative impact. The inability to store short shelf life products from summer to winter, limits the options available in terms of overall product mix, effectively locking processors into making storable products such as butter, hard cheese, milk powders and casein.
3.4.2.2 Raw product quality The poorer quality and consistency of off-peak supply creates inconsistencies in terms of product quality, and also reduces the competitiveness of processors through poor capacity utilisation and increased storage costs for year round products. All of these factors combine to create tensions and difficulties for processors, when dealing with buyers who are attempting to meet market demands for consistent year round products.
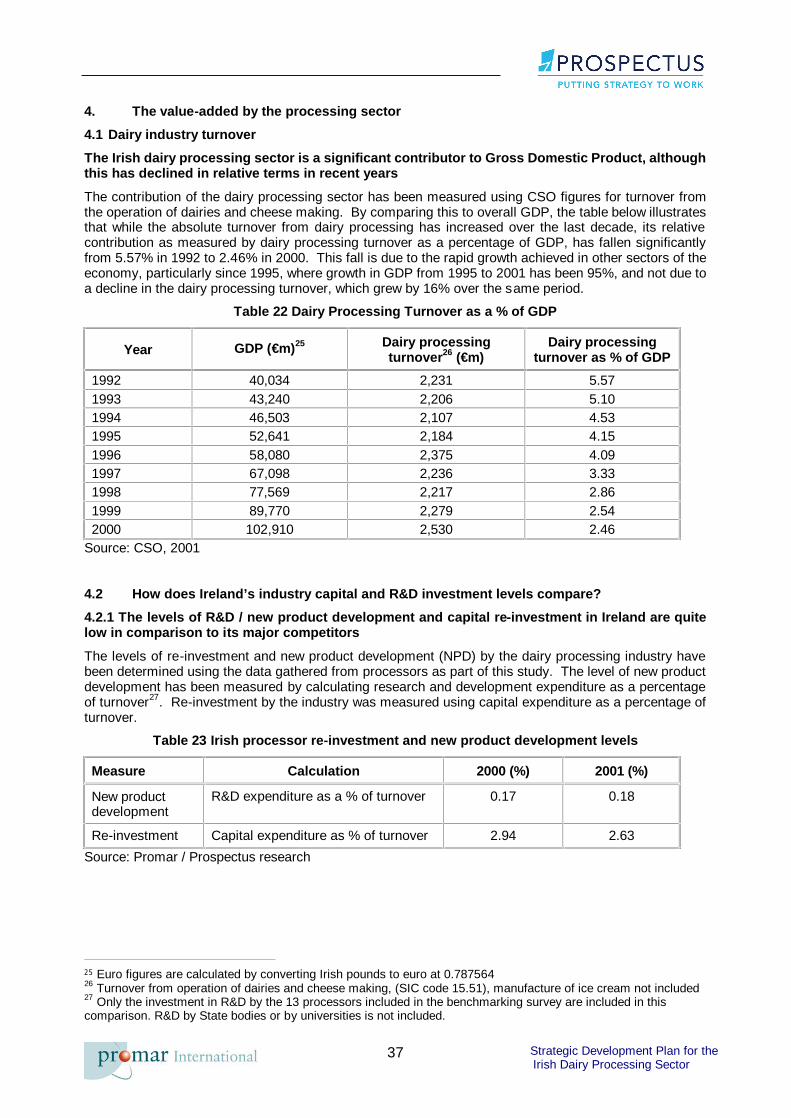
Strategic Development Plan for the Irish Dairy Processing Sector
37
4. The value-added by the processing sector 4.1 Dairy industry turnover The Irish dairy processing sector is a significant contributor to Gross Domestic Product, although this has declined in relative terms in recent years The contribution of the dairy processing sector has been measured using CSO figures for turnover from the operation of dairies and cheese making. By comparing this to overall GDP, the table below illustrates that while the absolute turnover from dairy processing has increased over the last decade, its relative contribution as measured by dairy processing turnover as a percentage of GDP, has fallen significantly from 5.57% in 1992 to 2.46% in 2000. This fall is due to the rapid growth achieved in other sectors of the economy, particularly since 1995, where growth in GDP from 1995 to 2001 has been 95%, and not due to a decline in the dairy processing turnover, which grew by 16% over the same period.
Table 22 Dairy Processing Turnover as a % of GDP
Year GDP (€m)25 Dairy processing turnover26 (€m)
Dairy processing turnover as % of GDP
1992 40,034 2,231 5.57 1993 43,240 2,206 5.10 1994 46,503 2,107 4.53 1995 52,641 2,184 4.15 1996 58,080 2,375 4.09 1997 67,098 2,236 3.33 1998 77,569 2,217 2.86 1999 89,770 2,279 2.54 2000 102,910 2,530 2.46
Source: CSO, 2001 4.2 How does Ireland’s industry capital and R&D investment levels compare?
4.2.1 The levels of R&D / new product development and capital re-investment in Ireland are quite low in comparison to its major competitors The levels of re-investment and new product development (NPD) by the dairy processing industry have been determined using the data gathered from processors as part of this study. The level of new product development has been measured by calculating research and development expenditure as a percentage of turnover27. Re-investment by the industry was measured using capital expenditure as a percentage of turnover.
Table 23 Irish processor re-investment and new product development levels
Measure Calculation 2000 (%) 2001 (%)
New product development
R&D expenditure as a % of turnover 0.17 0.18
Re-investment Capital expenditure as % of turnover 2.94 2.63 Source: Promar / Prospectus research
25 Euro figures are calculated by converting Irish pounds to euro at 0.787564 26 Turnover from operation of dairies and cheese making, (SIC code 15.51), manufacture of ice cream not included 27 Only the investment in R&D by the 13 processors included in the benchmarking survey are included in this comparison. R&D by State bodies or by universities is not included.

Strategic Development Plan for the Irish Dairy Processing Sector
38
Ireland’s R&D expenditure is substantially lower than its major competitors The table below compares both R&D expenditure and re-investment rates as a percentage of turnover. The comparison utilises industry data and information on leading companies within Denmark, the Netherlands and New Zealand, as well as benchmark data provided by Irish processors for this study.
Table 24 R&D/New product development (2001) compared with main competitors
Industry/company R&D expenditure (% of turnover)
Re-investment rate (% of turnover)
Ireland Industry 0.2 2.6 Denmark Arla Foods amba n/a 4.5
Industry28 n/a 2.8 FCDF 0.4 3.1 Netherlands Campina 0.6 2.2 Industry 0.4 4.829
New Zealand Fonterra 0.6 5.0
Source: Promar / Prospectus research
The comparison clearly illustrates, that Ireland is lagging behind its main competitors in terms of both R&D and capital expenditure. Ireland’s R&D expenditure, at just 0.2% of turnover, is well below the 0.4% and 0.6% of leading processors in the Netherlands and New Zealand. Ireland’s re-investment rate at 2.6% of turnover is also lower than the industry average of 2.8% in the Netherlands (but ahead of the Campina rate), 4.8% in New Zealand and 4.5% of the leading Danish processor, Arla. While there may be some distortion of these figures due to the different definition/classifications of R&D expenditure in each country, the overall picture strongly supports the views of many industry commentators that Ireland is behind its competitors in terms of R&D expenditure and investment.
Interviews conducted as part of this study identified criticism from some quarters of the nature of existing R&D expenditure and the overall level of innovation within the dairy sector. Some felt that the Irish industry had too often adopted a “me too” approach, simply replicating the innovations of others rather than taking the lead. Others criticised the industry for its production-led approach, suggesting that the industry needs to adopt a more market-led approach to innovation, where R&D expenditure is based on identified and validated market opportunities.
4.2.2 Using joint ventures and strategic alliances to boost product innovation
There was also evidence of a relative reluctance to work with buyers on product innovation, a finding that is supported by the relative lack of joint ventures involving dairy processors. Although there are a number of important and valuable exceptions to this, with a number of Irish processors engaged in joint venture or strategic partnership arrangements, compared to companies such as Arla, Fonterra and Campina, the scale and volume is still quite small. The best examples of market joint ventures by international competitors are provided by the recent movement by Fonterra, which has seen the formation of a number of companies to support the marketing of New Zealand dairy products, and sales of products that are produced locally by the various companies. These include:
Fonterra and Nestlé establish Dairy Partners Americas joint venture… In March 2002, Fonterra and Nestlé signed an alliance deal that created a joint venture company to operate in North, Central and South America. The alliance will initially employ 10,000 staff and have an annual turnover of €1.4 billion. Nestlé will provide technologies in the branded food market and product development, while Fonter ra will use its expertise in on-farm production and dairy processing. The alliance will initially market products into Brazil, Argentina, Paraguay, Uruguay and Venezuela. The venture will include the co-operative processing and distribution of shelf-stable dairy products such as UHT milk, refrigerated milk-based products such as yoghurts and dairy desserts, liquid milk and ingredient milk powders. The deal does not include the marketing of cheeses or butter.
Joint venture with Arla in UK butter market… Fonterra has formed a joint venture with Arla that sees the European giant responsible for the packaging and marketing of the Anchor brand of butter. The JV
28 2000 29 1999

Strategic Development Plan for the Irish Dairy Processing Sector
39
will be 75% owned by Arla, and combines the Anchor and Lurpak brands in the UK market, using up to 76,000 tonnes of butter that is allowed under current quota restrictions. It is also intended that the Anchor range of products could be expanded to include other consumer goods, for example cheeses, liquid milks and yoghurts.
Fonterra and Britannia Foods in India… NZ Milk, Fonterra’s consumer products division, and Britannia Foods of India have set up a joint venture to enter the world’s largest dairy market. The new company is based in Bangalore, and will market a wide range of dairy products using Britannia’s extensive distribution network. It has been estimated that the Indian dairy sector is growing at a rate of 9% per annum, and Fonterra sees this joint venture as one of the best ways of establishing a position within this important market.
Fonterra and Dairy Farmers of America… The companies have agreed to extend their existing DairiConcepts joint venture. This 50/50 joint venture was established to develop the market for dairy products in Mexico. The extension to this deal will see the expansion of the company’s facility to enable the first large-scale production of milk protein concentrate (MPC) in the US, and the manufacture of other dairy ingredients. Fonterra has stated that the establishment of a US source of MPC is an essential step in meeting the needs of its customers in the NAFTA region.
Export deal with Dairy America… As production of SMP has declined somewhat in favour of WMP, Fonterra has formed an alliance with Dairy America (a marketing company representing US Dairy Co-ops) to supply SMP for marketing by Fonterra in this region. Fonterra will receive a margin on all sales, avoiding the duplication of resources that has occurred in the past.
Meanwhile, Arla has formed a joint venture with the National Food Product Company in the UAE, in addition to its long-established Danya Foods subsidiary in Saudi Arabia. The Middle East market is the largest for the company outside of the EU. This new company will be responsible for the marketing of some of Arla’s more westernised products on a consumer base that is willing to experiment with new foods.
Within its home markets, Arla Food Ingredients has formed a joint venture with Nordzucker (German sugar company) for the production of the sweetener Gaio tagatose. This facility is expected to be operational from early 2003. This new German investment also demonstrates the company’s commitment to invest in new profitable uses for what, traditionally, have been lower value (and in some cases, waste) products from its dairy processing plants.
The dominance of both Fonterra and Arla within their home markets has seen them both internalise a large part of the industry R&D capability. This enables the companies to have first option on the development of new technologies, or products from these teams to enhance their own operations, and in some cases, lead to the launch of new products into the marketplace. This level of R&D, new technology application and product development commitment within the Danish industry results in Arla launching 160 new products annually, and dedicated R&D resources of 200 staff.
4.3 Economic value added (EVA)30
The economic value added of the Irish dairy industry has changed very little over the last decade although it has improved over the last five years The economic value added (EVA) ratio used in this study is used as an indicator of the value-added to raw dairy products through the processing and marketing activities of the industry. In other words, the value-added by the industry to each €1 worth of raw milk delivered for processing. For example, the 30 For the purposes of this study we are using a variation of the standard EVA measure, which is calculated using the following formula Net Operating Profit after tax (NOPAT) – (Cost of Capital x Capital). This measure is applicable only to individual companies. To develop an industry level type measure we have looked at the value added by the dairy industry to the raw milk it receives. The EVA measure used in this study is calculated by using the following formula: (Total sales revenue/ (average milk price times the volume of raw milk deliveries)). This provides us with cross -country industry comparator utilising official industry data. The measure as we have used it, is confined to the value added by activities performed within the particular country. For example, it does not include the value added by Irish owned overseas operations. To include these type of activities would cause major common definition difficulties as to what should and should not be included, it would make it almost impossible to do meaningful cross country industry comparisons and accurate and reliable data is not available to do this.

Strategic Development Plan for the Irish Dairy Processing Sector
40
calculated EVA ratio for the Irish dairy industry in 2000 was 1.72. So for every €1 worth of raw milk processed by the industry an additional 72 cent was added in economic added value, which is determined by the sales revenue generated by the industry for its milk inputs. Enhanced values as reflected in a higher EVA ratio, suggests that the industry is able to extract greater value from milk through the particular types of products manufactured and/or the markets serviced. However, it is important to note that the EVA ratio is a basic measure to provide an indication of the level of value-added to raw milk and needs to be used with caution. It is recognised that EVA does not take into account higher manufacturing costs as it only looks at input and output values, but given the major influence of raw milk prices on total costs, a higher EVA suggests higher margins are being achieved. It also recognised that the EVA can be impacted by a lowering of raw milk prices and by price movements for dairy products.
Table 25 Economic value added by Irish dairy processing sector
Year EVA 1992 1.66 1993 1.53 1994 1.46 1995 1.41 1996 1.53 1997 1.58 1998 1.54 1999 1.61 2000 1.72
Sources: Promar / Prospectus research derived from CSO and Department of Agriculture data
The EVA by the Irish dairy processing sector has been calculated using the sales turnover for the operation of dairies and cheese making, along with industry milk production and milk prices, using data all sourced from the CSO. These figures include the value-added from enterprises related to dairy processing, such as infant nutrition and chocolate crumb manufacturers, but exclude the activities and contribution of ice cream manufacturers.
The EVA of the dairy processors is lower than the industry EVA To determine more accurately the value-added purely by the dairy processing sector, EVA was also calculated using benchmark data provided by the 13 dairy processors who participated in this study. This resulted in an EVA of 1.48 in 2000 and 1.45 in 2001. Comparing the 2000 figure of 1.48 from the data provided by the dairy processors against the industry figure of 1.72, suggests that in 2000, the amount of value-added by the other dairy processors not included in study, such as infant nutrition and chocolate crumb manufacturers, was significantly greater than that added by dairy processors. However, some of the difference may also be due to inaccuracies and inconsistencies between the data gathered by the CSO, and data provided by processors for this study.
4.3.1 Irish EVA compared to that being achieved by its main competitors Ireland’s industry EVA is significantly lower than Denmark, and since 1996 has not kept pace with the Netherlands The table below benchmarks Ireland’s EVA against its competitors, using industry data.31 It is worth noting that the industry EVA figures for each country included below relate to the value-added in each country and do not include the value-added in subsidiary operations outside of each country. Clearly, significant value is added to the dairy output of each country by subsidiary and non-domestic operations but it is not possible to obtain a meaningful comparison of value-added including these operations.
31 The data used for other EU countries relates to the same prodcom / sic code as that used for Ireland (15.51 Operation of dairies and cheese making). A similar code from the Statistics New Zealand has been used for data from New Zealand.

Strategic Development Plan for the Irish Dairy Processing Sector
41
Table 26 Comparison of Economic Value Added (Total sales revenue/(average milk price x raw milk deliveries))
Ireland Denmark The Netherlands New Zealand 1992 1.66 2.14 n/a 2.22 1993 1.53 2.25 1.55 1.96 1994 1.46 2.04 1.46 1.89 1995 1.41 2.14 1.44 1.89 1996 1.53 1.98 1.60 1.96 1997 1.58 2.03 1.78 1.79 1998 1.54 2.37 1.75 1.87 1999 1.61 2.39 1.94 2.04 2000 1.72 2.10 1.80 1.23 2001 n/a n/a 1.83 1.53
Source: Promar and Prospectus Research (using CSO, Danmarks Statistik, Productschap Zuivel, Statistics New Zealand)
The data clearly illustrates that the Danish industry has had consistently high levels of value-added, only falling below 2.0 in 1996. These figures are even more impressive when one considers that the Danish processors have consistently paid a higher price for their milk (11% higher in 2001 – ZMP). The figures for New Zealand in the last two years, reflect the changes in commodity prices, upon which they are highly dependent.
The output of the Dutch dairy industry has long been regarded as similar to Ireland in being heavily weighted towards base/commodity type products, and this was reflected in similar EVA levels from both industries. However, since the mid 1990s, the value-added by the Netherlands has shown strong improvement (but has levelled off somewhat in the last two years). The Irish processing sector has gradually increased its value-added over the last decade, but remained below both Denmark and the Netherlands in 2000. The strategies and product portfolios being adopted by the Danes and Dutch that are influencing this EVA performance are discussed later in section 5.2 below.
The New Zealand EVA, by definition, is influenced by the lower milk price paid by Fonterra for raw milk. However, this said, when comparing Fonterra (New Zealand) with other processors on factors such as return on investment and turnover per employee, they are in fact less efficient than their European counterparts. This is due primarily to their seasonal supply curve that sees plants only operating at peak to trough ratios of 80.5 compared to Ireland at 5.99, Denmark at 1.16 and the Netherlands at 1.14. While the EVA is impacted through the lower milk price, it could be suggested that the profitability of Fonterra has not been overly enhanced through this, as it is at best on a par with that of the other companies investigated.
The advantage gained by the low milk price paid in New Zealand is exhibited by the table below, which includes the EVA for New Zealand using the average EU milk price paid. The table would suggest that given its current product and market mix (dominated by base products), the New Zealand dairy industry would be unable to add value to its dairy products if it were required to pay average European prices for its milk. Ireland’s EVA performance is significantly higher than that of New Zealand if New Zealand’s EVA was calculated at average EU milk prices and not at the significantly lower prices that prevail in that country. This lower EVA for New Zealand is a reflection of their even greater dependence than Ireland on commodity products and demonstrates the need for European players, including to Ireland to look for product alternatives to base type products to extract greater value and returns from the raw milk processed, particularly, in given that they are operating in higher cost environment and are in a policy environment where market supports and protections are being reduced.
Table 27 Estimated EVA for NZ using average EU milk price
1998 1999 2000 2001
0.85 0.96 0.70 0.89

Strategic Development Plan for the Irish Dairy Processing Sector
42
Higher EVA is linked to the level of base product percentage of total production EVA is higher in Denmark and Netherlands as a result of the different product mixes. In particular, when looking at the percentage of butter, SMP and WMP products, it is significantly lower for these two producers (See table below). Also, there is a greater percentage of milk used in liquid milk products and fresh dairy products in both of these cases, suggesting that higher margins are achieved through these dairy product sales.
Table 28 Butter, SMP and WMP products32 as percentage of total milk processed33
Ireland Denmark Netherlands New Zealand
1997 55.01 23.88 11.38 62.66 1998 53.56 23.68 13.46 60.86 1999 52.78 23.52 13.44 61.40 2000 52.65 23.19 12.20 60.54 2001 47.71 21.80 12.90 -
Source: ZMP, IDB, Prospectus/Promar Research The graph below illustrates the relationship between EVA and percentage of butter, SMP and WMP products produced by each of the industries included in the benchmarking exercise.
Figure 5 Relationship between EVA and % of Butter, SMP & WMP products
1
1.2
1.4
1.6
1.8
2
2.2
2.4
0 10 20 30 40 50 60 70 Butter, SMP & WMP product %
EVA New Zealand
Ireland
Denmark
Netherlands
The EVA as calculated, attempts to provide a guide as to the effectiveness of the dairy processing industry to add value to raw milk through its manufacturing and marketing efforts. In essence, this measure is influenced by two factors – the cost of the raw milk to the processors, and the value of the sales output. Therefore, it is expected that industries that are able to sell greater volumes of products into 32 In order to compare the impact that the proportion of base products within the total product portfolio has on the EVA ratios of the different benchmark countries, it is important to compare similar type products produce by the different countries. Butter SMP and WMP is produced in all of the countries and the product is broadly similar. However, it is not possible to compare cheese produces, as are major variances within the cheese product category and it is not possible to make plausible cross-country comparisons. For example, the Dutch industry produces large quantities of edam and gouda cheese, which are mainly commodity type products and are not produced to any extent in the other countries. As a result, the only base products we compare to assess their impact on EVA are butter, SMP and WMP. 33 This percentage is calculated using milk equivalence ratios (as determined by the IDF) to estimate the volumes of total milk that are used in the production of butter, SMP and WMP by each industry.

Strategic Development Plan for the Irish Dairy Processing Sector
43
higher value markets, should have greater EVAs. A more detailed discussion of EVA is included in chapter 3.
When comparing the product make-up of the various industries, the reliance of Ireland and New Zealand on butter, WMP and SMP dairy products becomes evident. For example, the production of butter, WMP and SMP34 accounts for around 40% of all dairy products output from Ireland and just over 60% in New Zealand. However, these same products account for only about 22% and 30% of the output of the Netherlands and Denmark respectively. This product make-up goes some way to explaining the lower EVA level for Ireland, especially, as it is competing head to head with lower cost producing countries such as New Zealand in base product markets. New Zealand, due to its lower cost (and unsubsidised) production system, pays less for milk (€18.40 per 100kg vs. €29.22 – ZMP 2002), and can pass some of these lower costs on to buyers by means of reduced market prices. Despite New Zealand’s apparent reliance on butter, WMP and SMP dairy products, its strong EVA is strongly influenced by its lower raw milk costs.
Given that butter, WMP and SMP as a percentage of the total production in the Netherlands is much lower than that of Denmark, one might expect a higher EVA for the Netherlands compared to that of Denmark. However, the Danish EVA is significantly higher and this is due to the very high proportion of base type cheese products in the Dutch product mix, which results in a lower EVA than Denmark. 4.4 Value-added issues 4.4.1 Comparable margins and levels of profit In 2001, the operating margins achieved by Irish processors from their dairy processing business ranged from minus 0.3% to 6.7%, with an average of just 2.7%35. These margins are lower than those of Arla and Friesland, which returned results of 3.2% and 3.8% respectively in 2001, but are significantly higher than the results of Campina and Fonterra36. The large variation across the Irish industry suggests that some companies have successfully changed their product mix or manufacturing technologies. However, when analysing profitability it is not possible to isolate a single factor as a range of factors including milk price, investment in R&D and capital expenditure will affect overall profitability.
Those Irish processors with low levels of profitability will find increasingly difficult to obtain/afford investment funding. The scale of the investment required, and the individual financial performance of processors will be major influences on their ability to fund future capital investment and as a result, it is likely that some processors will struggle to raise sufficient investment capital in the future.
4.4.2 Increasing cost of doing business in Ireland While the Irish economy has outstripped other EU countries in terms of growth over the last number of years, it has also had a higher rate of inflation, which has driven up costs and impacted negatively on competitiveness. Irish inflation peaked at 5.6% in 2000. It was 4.9% in 2001, and forecast to be 4.5% for 2002. This puts Ireland at the top of the league table in terms of EU inflation. The reality is that many of the costs faced by the dairy processors have risen in line with the general level of cost increases in the overall economy, and this is starting to impact significantly on their competitiveness.
There was recent confirmation of the challenges facing the Irish economy in terms of competitiveness, in the annual policy statement of the National Competitiveness Council, published in November 2002. Ireland is now ranked second highest out of the 16 countries surveyed in terms of wage growth per employee in 2002, with other indicators also pointing to a sharp rise in unit labour costs. Ireland is also second highest for projected growth in unit labour costs in 2002 and 2003. The Council found that, if current trends continue, the EU Commission estimates place Ireland’s average nominal compensation per employee 13 per cent higher than the EMU average, implying a severe and rapid competitive loss across the labour market.
34 Estimates based on IDF milk equivalent factors and volumes of milk processed by each industry. 35 Profitability measures are just indicators of performance and have to be used with caution, particularly, when looking at cross-country comparisons as there can be many varying factors influencing the declared profit level achieved by a company, for example, levels of re-investment, depreciation policy, etc. Also it should be noted, that 2001 was a particularly strong year in terms of profitability in the Irish Dairy industry. 36 Fonterra returned an operating loss of €4.2 million in its first year of operation.
Strategic Development Plan for the Irish Dairy Processing Sector
44
Examples of cost pressures faced by the dairy processing industry include insurance, labour and environmental compliance. FAPRI-Ireland predicts that costs such as labour, energy and services will increase by 25% over the next ten years. ICOS recently highlighted the extent of this problem by revealing that some co-ops experienced increases of 125% for the cost of insurance in 2002. They also indicated that for every €100 paid in insurance by an Irish company, the UK equivalent charge would be €34, and only €13 in Holland. Information received from IBEC regarding their members’ experience would also point to significant insurance premiums increases in recent years. IBEC is greatly concerned that insurance costs are impacting on competitiveness.
The evidence clearly indicates that Ireland is gradually becoming a more expensive country in which to do business, and this is impacting on the overall competitiveness of dairy processors. Given rising labour, insurance and energy costs, the challenge for the industry is to determine the means by which it can reduce other processing costs to ensure it remains competitive.
4.4.3 Increasing R&D and product innovation Given the higher prices that can be achieved in EU markets through effective market segmentation and customisation, product differentiation, branding, etc, to compete effectively the Irish industry will require a greater market and customer focus. A key element in building this market focus is the requirement for continuous re-investment through research and development and product innovation. Benchmarking the Irish industry against its major competitors indicates that, at present, Ireland is well behind in the level of R&D re-investment. The issue for the industry is not simply to increase the overall level of R&D spend, but to identify the type and nature of investment required. The focus of R&D expenditure should fit within the overall strategy and vision of the dairy processing sector, and is likely to involve co-ordination and interaction with retail, food service and industrial purchasers of dairy products.

Strategic Development Plan for the Irish Dairy Processing Sector
45
5. Marketing and distribution37 5.1 How does Ireland’s export performance compare with its main competitors?
Table 29 Volumes exported to each market in 2001 (‘000 tonnes)
Ireland Denmark Netherlands New Zealand Butter - UK 21.9 13.5 1.2 37.6 - France 18.5 1.6 25.8 0 - Germany 32.9 4.3 36.0 -0.3 Cheese - UK 90.5 20.8 16.4 14.8 - France 4.3 7.5 49.2 0.5 - Germany 3.8 84.1 189.3 2.5 WMP - UK 2.5 <1 0.9 0 - France 0.5 <1 0.4 0 - Germany 1.5 1.0 7.7 0 SMP - UK 9.1 1.3 1.6 0 - France 2.1 0.5 9.8 0 - Germany 4.4 1.5 8.7 0
Source: ZMP, IDB, Statistics New Zealand, Danmarks Statistik, Eurostat, Productschap Zuivel
Within its three major European markets, the Irish dairy industry is well represented in the butter market relative to the industries of Denmark, the Netherlands and New Zealand. The new marketing initiative between Arla and Fonterra within the UK branded butter market, will need to be watched with interest. The two-pronged approach of using Lurpak as a premium brand and Anchor as an everyday offering, could well crowd the market, especially given the proposed marketing support of €40 million for its products in the UK market. When comparing the volumes of cheese traded, the Irish performance can only be considered to be in a strong position in the UK market, with a large percentage of this product actually sold as own label in UK retailers. This is a price sensitive market that is likely to continue to be under pressure from other players. However, as long as the UK market is dominated by cheddar cheese, Ireland should remain well placed to provide significant volumes to this market.
5.2 Inability to influence market prices of base products Relative to the Dutch and the Danes, Ireland offers significantly greater volumes of butter, SMP and WMP type dairy products to market. Irish butter, SMP and WMP accounts for around half of all production, while these products account for only about 15% of Dutch production (however, the Dutch produce large volumes of base type cheese products) and 23% of that of Denmark. Base or commodity product markets are influenced significantly by world prices and could be even more so in future, if the level of intervention purchasing and export refunds declines, and the production levels of other countries such as New Zealand. Even large-scale producers are unable to influence the market price. For example a study by Finlayson et al (1998)38 suggested that even if a large player like New Zealand, was to reduce exports by 10%, this would only increase world prices by less than 0.5%. As a result, while good products to produce, the prices received will continue to be volatile in the future.
In an attempt to insulate their industry from the impact of declining world prices for base type products, the Dutch and the Danes have set about a strategy of developing and expanding branded dairy products for both their local and near-by export markets
37 A profile of Ireland’s product sales and exports is contained in Appendix 5 38 Bob Finlayson, Ralph Lattimore and Bert Ward (1998) New Zealand’s Price Elasticity of Export Demand Revisited. N.Z. Economic Papers 22, pp.25-34.

Strategic Development Plan for the Irish Dairy Processing Sector
46
Friesland Coberco has established a number of subsidiary companies to market products from its processing facilities. The company currently has ownership of 21 key brands, of which seven are aimed internationally, with another 14 concentrating on regional and local markets. These key brands account for 80% of the marketing investment by the company, and are designed to move the company closer to its end-consumers. One example of this attitude to developing a brand strategy is Frico Cheese, which operates across a number of European markets to develop and promote a range of branded cheese products. This up and coming branded player currently employs over 2,000, and is responsible for the marketing and promotion of Gouda, Edam, Friesian, Leiden and Maasdammer cheeses.
Arla’s market approach has been similar. The company has entered a number of branding strategies with both retail and ingredient products. It uses the Lurpak brand for butter across Europe, and supports the growth of this product with significant resources. Arla’s success has in the past been based around capturing significant amounts of the local liquid milk market, and supporting this with branded dairy foods, including cheeses, butters and added value dairy foods. This is the approach that it has used with mixed success in Denmark, the UK and Sweden.
The Irish Dairy Board has packaging, distribution and marketing subsidiaries in the UK, Belgium, Germany, France and the USA. A number of the Irish processors also have dairy subsidiaries abroad, particularly in the UK and the US. However to date, Ireland has few examples of branded dairy food products across a number of markets, with the best known being Kerrygold butter, which is particularly strong in the Irish, UK and German markets.
5.3 Routes to market There is limited data available on the routes to market or distribution channels employed by the Irish dairy processing sector. However, the Irish Dairy Board (IDB) in its 2001 annual report, has broken down sales of Irish product by product type, and the processors surveyed for this study have provided data for 2001 sales.
The figures from the IDB annual report, in the table below, indicate a significant movement away from commodity products towards consumer brands and food ingredients.
5.3.1 Sales of Irish product by market type
Table 30 Sales of Irish product by market type
% of sales 1990 1996 2001 Consumer brands 26 33 41 Food ingredients 20 24 32 Commodity 54 43 27
Source: IDB(2002) (from Teagasc study Strategic Directions for the Irish Dairy Industry in a Freer Market)
While there are always difficulties in agreeing common definitions of what is covered by these categories, and the classification of sales into these categories, the overall trend of IDB sales has been away from commodity type products. The consumer brands figure includes product sold under retailer own label.
5.3.2 Sales by distribution channel Retail is the most important distribution channel for butter The following table of distribution channels employed by the dairy processing sector is based on data gathered from processors and the Irish Dairy Board for 2001.

Strategic Development Plan for the Irish Dairy Processing Sector
47
Table 31 Sales of Irish product by distribution channel (2001)
% of sales Butter Cheese WMP SMP Retail 45 33 19 2 Industrial ingredients 29 27 15 59 Wholesale 13 14 4 35 Further processing 7 8 58 4 Foodservice 1 7 4 0 Other 5 11 0 0
Source: Promar / Prospectus research
These figures indicate that retail is the most significant channel for butter, with 45% of sales, followed by industrial ingredients representing 29%. Cheese sales to retail are also strong at 33% but are dispersed across all channels, including 7% in foodservice. WMP sales are predominantly for further processing, while 59% of SMP is sold as an industrial ingredient.
5.4 EU intervention market support Ireland is a major user of EU market intervention support for butter and SMP The figures in relation to the use of EU intervention as a market support mechanism, indicate that Ireland has relied heavily on this EU support as a means of selling both butter and skimmed milk powder.
Table 32 Intervention support for butter (‘000 tonnes)
1999 2000 2001 2002*
Tonnes % of EU total
Tonnes % of EU total
Tonnes % of EU total
Tonnes % of EU total
Ireland 14.6 27 15.5 35 13.7 35 44.3 29
Spain 12.6 23 13,0 29 4.0 10 31.1 21
Germany 8.1 15 0.4 0.8 0 0 13.3 9 UK 7.7 14 6.7 15 1.1 3 13.5 9 Netherlands 0.3 0.6 0 0 12.9 33 12.5 8 Total 54.4 44.1 38.9 151.5
Source: Department of Agriculture (* Figures to October 2002)
The table above illustrates that over the last four years, Ireland has accounted for between 27% and 35% of the EU intervention for butter, while during this period accounting for only roughly 8% of production.
Table 33 Intervention support for SMP (tonnes)
1998 1999 2002*
Tonnes % of EU total
Tonnes % of EU total
Tonnes % of EU total
Ireland 38.7 38 26.2 28 38.8 26
Germany 25.6 25 21.4 23 46.3 31 UK 32.5 32 17.6 19 21.0 15 Total 102.6 94.1 148.6
Source: Department of Agriculture (*Figures to June 2002)
The figures for SMP also indicate that in the last three years where there has been intervention for SMP (1998,1999 and 2002) Ireland has accounted for between 26% and 38% of the total. This is in comparison to Ireland’s production, which accounted for between 7% and 8% of total EU production during the same period.

Strategic Development Plan for the Irish Dairy Processing Sector
48
The data for butter and SMP intervention clearly demonstrate that Ireland has relied much more heavily on this support compared to all other EU countries. Indeed, with the exception of butter intervention in 2002, Ireland has accounted for the largest percentage of intervention in all the years analysed.
In the medium to long term, it is likely that intervention support will become less attractive (Agenda 2000 will result in cuts in the intervention prices by 5% each year from 2005/06 – 2007/08), or indeed be phased out altogether by the EU. Thus, there are concerns about Ireland’s heavy reliance on intervention, given this likely shift by the EU in the medium to long term away from this type of support mechanism. Effectively, this means that in the future, the Irish industry will need to look for new markets for these products, and prepare for the day when it will not be able to use intervention as an outlet for 30% of its butter production and 11% of its SMP production, as is currently the case.
The extensive use of intervention, while pragmatic in the short term, creates a dependency on this form of market support. This dependency reduces the need to seek out and develop products and markets that will provide a higher return than intervention, and the need to develop the customer focus of processors. The fact that there is a less stressful and demanding outlet for their product reduces the need or urgency of the processor to respond to or anticipate customer requirements. Extensive reliance on the intervention system also reduces to need to invest in developing competencies in market assessment, product development, market development and distribution systems. While some view the changes in CAP as a continuation of the current system at lower prices, the fact remains that this market will become increasingly less attractive.
Ireland’s export refunds have risen over the last decade Ireland’s export refunds for dairy products have risen from €88m in 1991 to €97m in 2000, an increase of 18%. However, differing market conditions have meant that refunds have been as high as €122m in 1992 and as low as €76m in 1998. During the same period, export refunds to Denmark have fallen from €421m to €177m, a decrease of 58%. The reduction in the export refunds to Denmark can be explained by greater sales within EU markets and the change in their product mix. In particular, the shift away from production of feta has helped to reduce Danish export refunds for cheese from €185m in 1991 to just €39m in 2000.
Table 34 Export refunds for dairy products (EAGGF / FEOGA)
€ million 1991 2000 1991/2000 %
Ireland 88 97 17 Denmark 421 177 -58
Source: Department of Agriculture, Directorate of Food, Fisheries and Agri Business
It is worth noting that Ireland still claims fewer export refunds than Denmark suggesting that Ireland is relatively less dependent on third country (non EU) markets.
While the use of intervention support and export refunds by the Irish have been profiled, there are other measures available to the European dairy industries. Support systems including pastry support (to encourage the use of butter in pastry production) and casein production assistance are used to differing degrees across Europe. The usage of these various schemes varies from country to country, however, the overall trend is away from these types of market supports. Thus European dairy industries will need to adapt outputs to be more closely aligned to world market prices for all base dairy products.
5.5 Marketing and distribution issues 5.5.1 Insufficient ‘customer service’ ethic The dairy processing sector has been criticised for not adopting a sufficiently customer focused approach or customer service ethic. As discussed above, the availability and willingness to make extensive use of both intervention and export refunds is also seen as having had a negative impact on the industry, by reducing the requirement for a greater customer focus and the development of more value-added products for EU markets. A number of major customers of the processing sector were critical of the responsiveness of the sector to their needs and requirements. For example, the failure of the industry to address the problems of seasonality is seen by many as a failure to respond to the needs of the market. Part of the challenge for the Irish industry in the future will be the necessity of adopting a greater market and customer focused approach and attitude. This will be of even greater importance to the industry if it

Strategic Development Plan for the Irish Dairy Processing Sector
49
wishes to focus on more value-added products, where buyers, whether retail, industrial or foodservice, expect their specific requirements to be met.
5.5.2 Threats to Ireland’s ‘green and clean’ image Ireland has a strong reputation internationally for being a ‘green and clean’ country, which creates a positive image for Irish dairy products, particularly when combined with the ‘natural’ grassland production. The processing sector has a long track record of producing quality dairy products for international markets. Given the increased focus on food safety, this image is a very powerful asset when selling Irish dairy products. This image is being underpinned by marketing initiatives by processors and organisations such as Teagasc, FSAI and Bord Bia. These initiatives have worked hard to develop the ‘green and clean’ image of Ireland, and emphasise the natural and pure attributes of its dairy produce. For example, the goal of Bord Bia’s Ireland The Food Island campaign is to position Ireland as a place where excellent food is produced with uniquely Irish values.
The value of the positive ‘green and clean’ image may not always have been properly utilised and leveraged in generating a competitive advantage for Irish dairy products, and its strategic importance is not always fully recognised and protected. While there has been success in developing brands, notably Kerrygold in Germany where the green and clean image has a particular appeal, the investment required to continue to develop and enhance existing brands, and create new brands, is substantial. Thus, the Irish industry continues to sell large volumes of basic products at relatively low prices, rather than develop and sell greater proportions of consumer products and other higher value products that leverage Ireland’s positive image and obtain a price premium.
There are also concerns that Ireland’s positive green image is at risk from recent developments and is being questioned by competitors. The continued presence of brucellosis in the national herd, the re-emergence of TB and the minor outbreak of foot and mouth in 2001 are all contributing to a dilution of this image. There are also some concerns about the ability of some companies to continue to be able to afford the cost of being in compliance with the ever increasing food safety and environmental standards at both production and processing level.
5.5.3 Sales / marketing / distribution structure The Irish Dairy Board (IDB), originally known as Bord Bainne, was founded in 1961 to market Irish dairy produce to export markets. The IDB has developed enormous expertise in the marketing and distribution of Ireland’s main dairy products. IDB has developed an extensive international packing and distribution infrastructure. It provides a vitally important marketing and distribution capacity to Irish processors, particularly, to the smaller to mid-sized processors who distribute the vast majority of their output through the IDB. Kerrygold, its main brand, has been developed over the last 40 years into a major international dairy brand, which is now sold in over 60 countries. Although butter remains the leading product, the Kerrygold portfolio now includes a range of cheeses, milk powders and other diversified products. Since its foundation, the IDB has played a key role in promoting a positive image of the industry internationally.
However, the export marketing of Irish dairy produce has evolved to a position at present where Ireland has a sales, marketing and distribution structure that involves significant duplication of effort between some of the larger processors and the IDB. The reality of the current position is that in many instances, Irish processors and the Dairy Board are directly competing in the same markets.
There are several reasons why this structure has negative implications for the Irish dairy processing sector. The duplication of effort creates inefficiencies, and puts Ireland at a disadvantage to its main competitors who have integrated marketing and distribution systems. In fact, the creation of Fonterra, joining New Zealand’s two largest dairy processors and the New Zealand Dairy Board, was justified to shareholders as it was expected to lead to significant savings through minimising the duplication of resources between the parties involved. There is also a danger that this structure can negatively impact communication between buyers/consumers and processors, and delay market signals back to processors. One damaging aspect of this structure is the negative impact of numerous Irish brands and similar product offerings competing against each other in export markets. This adds extra competition in markets where Irish products are already facing stiff competition from local producers and the other major exporters such as Denmark and New Zealand. It also can potentially dilute the image of Irish produce.
To give an indication of the levels of support that are required to maintain branded products, Arla has just announced that it spent €16 million to support the Lurpak brand in the UK alone. In the coming year, it expects to spend another €23 million to promote Lurpak Spreadable and Lurpak Lighter Spreadable products in the market. In addition to this amount, Arla is also planning on investing €7 million in Anchor

Strategic Development Plan for the Irish Dairy Processing Sector
50
branded butter in the UK. Some observers are of the opinion that the increasing costs of brand support in European markets was one of the major reasons that Fonterra signed the joint venture agreement with Arla for the use of the Anchor brand. This joint venture company is expected to increase the range of products that utilise the Anchor brand, and increase sales volumes. 5.5.4 Peripheral location For the dairy processing industry, Ireland’s peripheral location and island status puts it at a commercial and logistical disadvantage to its competitors based on mainland Europe. Irish processors face market access costs caused mainly by the additional transport costs involved in getting their product to market. It also has a restrictive impact on the product mix by limiting the number of accessible markets for high moisture or short shelf life products. While advances and innovation in both the transport of dairy products and the products themselves has reduced this disadvantage, it remains a key challenge for the industry.

Strategic Development Plan for the Irish Dairy Processing Sector
51
6. Summary of key messages from current industry status assessment and international competitor comparisons
Some of the key messages that have emerged from the analysis of the current status of the Irish industry and its comparison with international competitors are set out below. The picture that has emerged is that of an industry that is facing major challenges due to a combination of external and internal factors. Externally, there is the pressure of increased competition that is being encouraged by developments such as trade liberalisation and EU enlargement. Internally, the industry collectively needs to address its falling competitiveness, and the need for significant change in its output and structure.
Ireland has developed a strong dairy industry The industry has made effective and pragmatic use of EU supports develop a product mix, which makes best use of the highly seasonal milk supply. It has developed and expanded its product portfolio moving into higher value-added such as ingredients. It has invested and developed processing and distribution capacity internationally. It has developed a number major internationally successfully enterprises who diversified and expanded their product range.
Changes to the policy environment (agreed and predicted) will result in reduced market supports for dairy products, and consequently, lower prices paid to processors and milk producers The twin developments of CAP changes (Agenda 2000 and further planned revie ws) and WTO trade agreements (Doha) will result in intervention price cuts, and likely reductions in the value of export refunds and import tariffs. The effect of these reductions will be felt most strongly in the area of base/commodity type products. But changes in the market supports could provide a needed impetus for processors to change and re-invigorate product mix and change structures at production level. The CAP price support structures encouraged a risk averse to product diversification and development and resulted in the pragmatic large-scale utilisation of milk into butter and powder. The reduction of these supports will necessitate a greater market-led approach by processors to product selection.
The future viability of dairying for a majority of farmers is under threat due to the increasing price-cost squeeze, the restrictions on increasing productivity, and their relative efficiency Irish dairy farmers are smaller, less productive and more seasonal in their production than the dairy farmers in Ireland’s major EU competitor countries – Denmark and the Netherlands. The table below illustrates that Denmark and the Netherlands have both consistently paid a higher milk price than Ireland39. The gap between the Irish and competitor milk prices has narrowed over the period. In 1991, the producer milk price was 25% higher in Denmark than in Ireland and 16% higher in the Netherlands. By 2001, the milk price was only 11% higher in both Denmark and the Netherlands. However when analysing differences in milk prices it is important to also consider the impact of other factors such as levels of investment in R&D, capital expenditure and profitability. The milk price paid is just one element in a whole range of factors which need to be considered and should not be viewed in isolation.
Table 35 Producer milk prices (€/100kg)
1991 1997 1998 1999 2000 2001 Ireland 25.05 28.23 27.92 26.66 27.20 29.22 Denmark 31.42 30.87 30.80 30.26 30.86 32.47 Netherlands 29.17 29.17 30.59 26.77 29.98 32.38 New Zealand 9.0 18.0 13.89 13.65 16.64 18.40
Source: Eurostat, ZMP
39 The milk prices used are from officially published prices to enable cross-country comparison. The levels of subsidisation in the different countries, is not taken into account. However, when examining Irish milk prices against Danish and Dutch prices, there is a range of factors, which should be borne in mind, as milk price cannot be viewed in isolation. For example, The Danish and Dutch milk supply is broadly even throughout the year whereas, the Irish milk supply is highly seasonal. Also it would appear that the Irish processors pass back more of the value they receive for their output in terms of milk price. In 2001, the gross margin (sales turnover value less raw milk cost) was 51% in Denmark, 39% in the Netherlands and 38% in Ireland. The output value per of the Danish industry in 2001 was 41% higher than the Irish industry but the differential in milk price was only 11%.

Strategic Development Plan for the Irish Dairy Processing Sector
52
The future economic viability of Irish dairy farmers will largely depend on their ability to substantially increase productivity and improve cost efficiency. Farmers will have to maximise the output from their land and their cows, and bring them up to levels comparable to those being achieved in major competing countries. Irish dairy farmers also need to achieve the same scale of production levels as the Danish and Dutch farmers.
The number of Irish dairy farmers has declined from 68,000 in 1984 to 28,000 in 2001, and is forecast to decline to 14,000 by 2010. However, given the expected increased pressures on the viability of dairy farming, the rate of decline is likely to be greater.
There has been a reduction in Ireland’s competitiveness Ireland is falling behind its competitors in its competitiveness. This is threatening not only the future viability of farming, but also the future viability of many of the processors as well. Significant further change is required in the structure and nature of production to improve overall efficiency and competitiveness.
There are significant weaknesses in Ireland’s processing structure and efficiency Rationalisation of Irish processors has been at a slower rate than that of their competitors, and has resulted in a smaller scale of production for base products, and relatively few small innovative processors focusing on value-added products. A number of processors are producing relatively small volumes of base products, and are not in a position to enjoy the economies of scale being enjoyed by larger operators (both in Ireland and in competing countries), and at the same time, the cost of doing business in Ireland has risen and continues to rise.
When this is combined with the downward global trend in commodity product prices, processors find themselves in a very difficult trading environment. There is a need for a change in the industry configuration to create greater specialisation and scale in the production of base products, improve overall efficiency, replace aging plants, and meet the growing demands of environmental, food safety and quality standards.
While there has been a continual shift away from base type products further more radical adjustments are required in the product mix There has been a significant shift in Ireland’s product output, with a decline in butter and SMP and increased output of cheese and casein. Ireland however, is still heavily dependent on base products such as butter, WMP and SMP. Ireland needs to increase the speed at which it is shifting its product mix away from these low margin products.
Price competitiveness is the critical factor for success in the international markets for base products such as butter and powder, and the Irish industry is in danger of losing market share if it does not respond aggressively and quickly to the need to maintain and enhance its competitiveness Given the generic or commodity type characteristics of these products, the key focus of processors operating in this product segment has to be on process and cost efficiency. Therefore, everything that affects or that can improve the cost efficiency of processing is of vital importance to the industry. Costs need to be tightly managed, and constantly scrutinised to identify waste and efficiency improvements.
The major competitor countries (Denmark, Netherlands and New Zealand) have adopted a number of aggressive strategies in their ruthless pursuit of efficiency and cost competitiveness on international markets. The Irish industry needs to be equally driven in its focus on price competitiveness.
The Irish dairy processing industry is adding relatively less added value to its outputs compared to its competitors When compared to countries such as Denmark and the Netherlands, the Irish industry has a lower level of economic value-added. (However, it would have a higher EVA measure than New Zealand if the added value of its output was measured using average EU milk prices). This reflects Ireland’s higher weighting of base products and the low levels of capital reinvestment and spending on R&D and product innovation, that ultimately, results in lower margins and lower profits. Developing a strategy whereby Irish processors can increase the value-added to dairy products, is a fundamental requirement for the future success of the industry.
Strategic Development Plan for the Irish Dairy Processing Sector
53
The Irish dairy sector’s marketing and distribution structures will need to adapt as Ireland’s product mix continues to change Ireland is dependent on export markets for its dairy products, so the efficient and effective marketing and distribution of these exports is vital to the industry. The current marketing and distribution structure is sub optimal, and faces significant challenges. The structure has evolved to a position where there is significant duplication of effort between individual processors and the Irish Dairy Board. It can also be argued that the Irish industry’s reliance on supports such as intervention have somewhat reduced the customer service ethic. As the industry changes its product mix, the marketing and distribution structure must adjust so that the structures are appropriate to the needs of the different routes to market and the products being supplied.
In meeting the challenges summarised above, the Irish processing sector needs to develop its own unique strategy best suited to its requirements and industry strengths, rather than simply trying to follow similar strategies to those of either an Arla or Fonterra Both Fonterra and Arla represent companies that have set about dominating the raw milk supply of their respective countries. The rationale for doing this varies in the detail, but in essence, it is about maximising profitability through the collection and processing of large volumes of milk to capture plant economies of scale, and to be key (dominant) players in home markets to enable a degree of market power to be exerted.
Even though there is a degree of similarity between the approaches, their actual situations are quite different. Arla has to operate within a confined (quota controlled) supply system, forcing them to consolidate their operations around two prongs – one the creation of added value products, and the other the cost reduction of base product production. This has meant that Arla has quickly moved to close smaller base dairy product processing plants, demonstrated by its current planned plant closures in both Denmark and Sweden. At the same time, the company is investing in technologies for added value dairy products, from consumer to functional foods. They are developing scale operations in these areas as fast as they can, as the time from niche product to lower value mass produced food in the European dairy sector is very short.
Fonterra has two distinct advantages – low cost milk (€18.40/100Kg compared with €29.22/100Kg milk in Ireland – ZMP 2002) – an input price differential of over 37%, and a non-quota production environment. The combination of these two factors has seen the company encourage increased milk production within New Zealand, enabling both processors and producers to capture economies of scale. This has resulted in large increases in the average herd size within New Zealand, and, despite its distance to market, ensured an ability to compete on price in the base dairy products on the international market.
It is difficult for Ireland to follow the Fonterra example, as milk production quotas are currently fixed, and there is a degree of inflexibility in transferring and consolidating the production into areas that are geographically best suited for milk production. This restricts the ability of producers to capture economies of scale, and the benefits from more cost efficient production locations. It also lessens the ability of the processing industry to take advantage of lower collection costs from having a smaller number of farms in tight defined areas of the country. In addition, the market for base dairy products is becoming increasingly competitive, and the continued sale of these into intervention markets is unlikely to yield high returns.
Similarly, following Arla’s example would also have implications for the Irish dairy industry. The large markets of Europe are more easily accessed from Denmark. Arla’s home market expansion strategies in Europe have involved developing a presence in the liquid milk market. Irish dairy companies have already tried this strategy in the past, in the UK at least, without success. To follow the Arla lead would require heavy investments in consumer brands and a wider presence in the European liquid milk market – and given past experience in the liquid milk market, this could be difficult to achieve.
Ultimately, the Irish industry must learn from the experiences of its main competitors, rather than simply replicating any one of their strategies. Chapter 2 identifies the market opportunities available to the Irish industry, and chapter 3 outlines the strategies that are most appropriate to enable the industry to take advantage of these opportunities.