Embed Size (px)
Citation preview
1
CHAPTER 1
INTRODUCTION
1.1 Background
Franchising can be described as a contractually based business arrangement
between the franchisor who develops a product or service and the franchisee who buys
the right to use the franchisor’s trade name and sell that product or service (Khan, 1992).
Franchising emerged as a significant way of doing business in the second half of the
twentieth century, and continued to expand during the 1980s and 1990s, becoming a
major force in the United States’ economy. Franchising offers opportunities for
individuals and business firms who want to expand the number of their distribution
outlets carrying their products and services (Khan, 1992), and is becoming an important
strategy in both the U. S. and the world markets for business growth, creation of jobs, and
economic development (Hoffman and Preble, 1991).
Currently, franchising represents a major section of the distribution structure in
the United States. Over 3,000 companies are involved in franchising, spanning more than
65 industries, and with over 500,000 retail locations (Seid, 1993). Information from the
International Franchise Association Educational Foundation (IFAEF, 1992) reveals that
over one-third of all retail sales in the United States are by franchisees or outlets owned
by franchisers. Products and services sold by restaurant franchising firms were
estimated, as of 1990, to exceed $64 billion. In the year 1992 alone, franchising across
2
industries amounted to sales of $803 billion, and accounted for 8 million jobs
(International Franchise Association, 1996). In a study commissioned by the
International Franchise Association (IFA), it was predicted that by the year 2000, 50% of
all retail sales in the United States would be by franchises (Regulation of Franchising,
1994b). Presently, sales by franchises account for 40% of all retail sales.
Franchise systems can be described as systems of interdependent organizations
that are involved in the process of making a product or service available to the consumer
through negotiation and exchange (Khan, 1992). In a franchisor-franchisee relationship,
the franchisee is granted or sold the right to use the franchisor’s system of distribution
and/or trademark (Khan, 1992). The limits of a franchisor-franchisee relationship are
formalized by contract, which either extends from three to twenty years, or has no fixed
time limit, and can have a great deal of variety in its terms. The contractual agreements
are at the mid-point of a continuum between highly integrated systems and decentralized
entrepreneurial markets. In the franchisor-franchisee relationship, although the limits are
defined by the contract, the relationship between the two parties is near exclusive.
Franchising contracts represent the products to be sold, standards of quality, prices, and
hours of operation, and they also specify the start-up date, the duration of the contract
agreements, periods of renewal, and termination clauses.
Franchising is unique among most other types of entrepreneurial activity in that it
involves symbiotic and legally differentiated economic forms. In the franchisor-
franchisee relationship, the two entities remain distinctly separate, yet are closely linked
to one another, leading to the description of franchising as a partnership or strategic
alliance (McIntyre, Young, and Gilbert, 1994). Franchise systems are made up of
3
interdependent, symbiotic, individual members or organizations. Among the many types
of franchise systems, two general types can be identified, both of them relatively recent.
These are product trade-name franchising, where a contractual channel of distribution is
created by the franchisor, and business format franchising, where a franchisor grants
license to a franchisee to duplicate the franchisor’s business concept in another location.
Product trade-name franchising arose from modernization of technology that produced a
nation-wide market and significant increases in the volume of production. Product trade-
name franchising was the forerunner of business format franchising. These two types of
franchising are distinct forms from a legal and functional point of view. Business format
franchisors sell the opportunity for business ownership, while product trade-name
franchisors sell their goods through franchised outlets. At the basis of each form is the
fact that the franchisor’s decision to franchise arises from its desire to widen the
distribution of its products or trademarked services.
The partners in a franchise system are mutually dependent on one another’s
objectives and performance to achieve their goals. Justis and Judd (1989) identified three
types of interdependence in franchise systems. These include the business form, the legal
form, and the agreement form, which accommodate one another’s independence. There
are many advantages for joining a franchise system, among them, awards and public
recognition, decreased risk due to a proven business format in comparison to independent
business operation, the training offered by the franchisor, and others. However, being a
franchisee also brings responsibilities, including working within the restrictions of the
franchisor and sharing the financial rewards. A successful franchise benefits not only the
franchisees, but also the end-customers, and franchisees can be motivated to change

4
through a focus on the end-customer. Potential franchisees also can be seen as customers
of the franchising companies.
There is variation in the services franchisors provide in franchise contracts. A
mixture of services may be specified that maintain and build the franchise’s value.
Franchisors may assist franchisees begin their operations by helping with financing, site
selection, lease negotiation, training, and store openings. On a continuing basis,
franchisors may provide franchisees with central data processing, inventory control, retail
unit evaluation, newsletters, regional or national meetings, and telephone hotlines. These
services are utilized by franchisors to control, monitor, and support franchisees’
performance, and in these ways minimize problems in their relationships with
franchisees. It is customary for franchisors who offer extensive services to set higher base
fees and royalties to compensate for the higher costs associated with these mechanisms
for monitoring franchisees.
The franchisor-franchisee relationship can be conceptualized as having four
phases. The first is the introduction, where mutual interdependence and a shared
motivation for success and profits is fostered (Justis and Judd, 1989). The second phase
can be characterized by growth, beginning when the business is functioning. During this
phase, the franchisor is offering support to the new franchisee and the relationship is
growing and developing. Also during this phase, the relationship can become
problematic if the franchisor does not provide proper training or support. When each
participant is able to understand what is expected from the another, it can be said that the
maturity phase has been reached. At this point, the franchisee has an accurate impression
of the competence and expertise of the franchisor and may either value or question the
5
franchisor’s contributions to the relationship (Justis and Judd, 1989). The last stage in the
relationship is one of decline. In this phase, either one or two situations prevails. The
first is that the business is not doing well and the franchisee is motivated to end the
relationship, and the second possibility is that the business is thriving and the relationship
with the franchisor is solidified (Justis and Judd, 1989).
Empirical economic research has been conducted to explain why firms choose to
distribute their products or service offerings through franchise channels. In contrast, the
reasons why individuals join franchise systems and the characteristics that predict which
individuals are likely to be interested in becoming franchisees have received little
attention. (Peterson and Dant, 1990).
1.2 Statement of the Problem
The growth of franchising has been an important trend in the restaurant business,
since it was introduced into the restaurant sector by Howard Johnsons in the 1930s.
During the next decade, over 100 restaurants joined the Howard Johnson’s franchising
system. In recent years, quick service restaurants have faced significant external and
internal pressures, due to intense competition. These pressures can cause disputes and
abuses of the system that affect external suppliers, customers, and suppliers, as well as
franchisees within the franchise system. Potential abuses can include victimization by
unethical and even criminal operators (Kaufmann, 1990a, 1990b).
The ideal franchisor-franchisee relationship is one built on mutual trust,
consideration, and cooperation, and is vital for the success of both parties. The
6
relationship at its optimum should be mutually beneficial and involve shared effort,
should enhance profits, maximize market share, product sales, and growth for the
franchisor and franchisee (Justis and Judd, 1989). Because the franchisor is risking its
business reputation, contracts specifying franchisee obligations are often very explicit in
their details, but may provide only a general outline of the franchisor’s obligations. With
the significant popularity of franchising as a method of business expansion have come
problems, including allegations of franchisor misconduct or the failure of the franchisor
to deal in good faith.
There is much potential for conflict in a relationship where both parties are
mutually dependent, bound together by a contract, and must rely on inputs from both
parties, and many franchisees complain about franchisors (Purvin, 1994). By the end of
the 1980s, many prominent franchise companies had experienced problems. Units that
are not well-run and have declining sales may face cancellation of their franchises or non-
renewal of contracts. When contracts expire, franchisees must choose between making
more capital investment or non-renewal of their contracts. If the franchisee chooses not
to renew, then years of the relationship with the franchisor may be destroyed. The
termination of a franchisor-franchisee relationship may have many implications, among
them law suits and counter-suits.
It is clear that the implications of the franchisor-franchisee have yet to be fully
explored, and that a better understanding of the factors that produce a high-quality
relationship between franchisor and franchisee would be beneficial to both parties.
Therefore, the first research question guiding this study is as follows:
7
Research Question 1
What are the key factors that affect the quality of the relationship between the franchisor
and franchisee, and the franchisee’s job performance, the franchisee’s job satisfaction,
and the franchisee’s commitment.
Research Question 2
Is there a relationship between the franchisee’s commitment, the quality of the
relationship between the franchisor and franchisee, the franchisee’s job performance,
and the franchisee’s job satisfaction?
1.3 The Need for the Study
Although franchising is a growing business form with economic benefits to
participants, little empirical research has been done to evaluate the factors that contribute
to a successful franchise relationship, particularly from the viewpoint of franchisees.
Early research in the franchising field was primarily focused on economics. Over the past
thirty years, research has broadened to include both the behavioral and economic aspects
of franchising. Behavioral research has primarily focused on measuring the effectiveness
of a franchise system by investigating its conflict resolutions, inter-organizational
cooperation, the balance of power in the organization, and the satisfaction of participating
members. However, very little information is available about the factors that affect the
quality of the relationship between the franchisor and franchisee, and the reasons why a
franchisee decides to stay in the franchise or to leave it. Therefore, in the current study,
8
an attempt has been made to understand the impact of these factors on the franchisor-
franchisee relationship.
1.4 Objectives of the Study
The study will investigate franchising in the restaurant industry. This study will
develop and test a theoretical model of antecedents (predictors) to determine the effects
of key factors that determine the quality of the franchisor-franchisee relationship. Among
these factors are the franchisee’s commitment to remain in or leave the franchise
relationship, the franchisee’s satisfaction with purchasing and operating a franchise
outlet, the effects of the franchisor’s brand name on the quality of the relationship, the
franchisee’s perception of the franchisor’s support, the franchisee’s motivation to become
a franchisee, and the franchisee’s performance.
1.5 Theoretical Contributions
The proposed model will provide valuable information for establishing an
effective management strategy, which will improve the relationship between the
franchisor and franchisee and to prevent turnover. The study will include an analysis of
the predictors of a quality relationship between the franchisor and the franchisee. The
proposed theoretical model will increase an understanding of the relationships between
the predictors of a quality relationship, the franchisee’s performance, the franchisee’s
satisfaction, and the franchisee’s commitment predicting intention to terminate or remain
9
in the franchising relationship. Firm-level data have been collected through a survey of
American franchisees in the restaurant industry. The research hypotheses, developed
through a review of the literature, will be tested in comparison to the survey data
analyses. The study contributes to knowledge about a variety of factors that influence the
quality of the franchisor-franchisee relationship, including the development of more
appropriate and comprehensive research agendas for further study of the franchise
turnover process.
1.6 Practical Applications for Franchise Restaurants
The results and knowledge gathered from this study should provide both
theoretical and practical contributions for the improvement of franchising in the
restaurant industry. The predictors identified for this study will also provide a useful tool
for restaurant franchising companies who wish to examine franchisee’s satisfaction.
Once the franchisor understands the variables leading to franchisee satisfaction, changes
can be implemented to reduce conflict and improve the overall performance of the
franchisee. The proposed model can also be used to develop the franchisor’s
management strategy to improve the rate of success of both franchisor and franchisee.
Similarly, the model can assist both the franchisor and the prospective franchisee in
understanding their policies in strategic terms and in integrating their different activities
so as to provide the firm with the quality relationship required for competitive advantage.
10
1.7 Research Boundaries
The boundary of the research is the foodservice industry, because of the interest
of the researcher, and because business-format franchising involves more complicated
contracts that include not only sales, but also the entire business concept itself. Important
aspects of the business format franchise include the trademark, compensation package,
marketing strategy and planning, the management approach, operating manuals and
standards, quality control, and a continuing process of consultation with the franchisor.
The largest industry to use business-format franchising is the restaurant industry. About
half of the dollar value of food away from home is generated by franchises.
1.8 Organization of the Dissertation
This chapter contains a description of the research problem, and a discussion of
the factors underlying its importance and relevance to franchising research. Chapter 2
contains a review of the relevant literature, the extent of the findings with regard to the
research questions addressed in this dissertation, and an assessment of the gaps in the
literature. Chapter 3 contains a theoretical model of the franchisor-franchisee
relationship in the franchise system, with the key decision variables that affect the quality
of the relationship. The model is constructed as a set of causal relationships, which also
are discussed Chapter 3. Chapter 4 contains a description of the empirical research
methodology. In this study, a conceptualization of motivation, the franchisor’s support of
11
the franchisee, the brand name, franchisee performance, the nature of a quality
relationship, franchisee satisfaction, and the franchisee’s commitments regarding
remaining with the franchise are modified by a path model in order to develop the
structural equation model, and then are empirically tested. This modification will be
based on the knowledge of what generally occurs in a restaurant franchise. Chapter 5
contains the tests of the hypotheses derived from the solutions to the theoretical model.
In Chapter 6, the implications of the research are summarized, conclusions are drawn,
and suggestions are provided for future research.
1.9 Summary of the Chapter
This chapter presents an overview of the proposed research, beginning with the
background of the study. The chapter then discusses the problem statement, which
includes the two research questions that guide the study. The objectives of the study are
discussed, which include the design and testing of a model of antecedents (predictors) in
order to determine the factors that affect a franchisor’s commitment to stay with the
franchisor or to leave the franchising system. Also among the study’s objectives are to
identify the factors that impact the quality of the franchisor-franchisee relationship, and
the quality of that relationship as it relates to the performance of the franchisee,
franchisee satisfaction, and the franchisee’s commitments. The chapter also discusses the
practical and theoretical contributions of the study, including its applications to the
restaurant franchising industry.
12
1.10 Definitions of Terms
Motivation is the reason why people would like to be franchisees. In other word, why he
or she would seek a franchise rather than operating an independent business.
Evaluation is the franchisee’s perception of franchisor’s support.
Brand name is the perceived brand value of the franchisor’s brand name.
The quality of the relationship is the degree to which franchisees are interrelated with
franchisor. A high quality relationship can be expected to result in high productivity.
Performance is the franchisee’s perception about his or her financial performance or
success of the business.
Satisfaction is the franchisee’s affective (emotional) response to the relationship.
Commitment is defined as a franchisee’s predicting intention to leave the relationship
with overall assessment of worthiness or utility in a franchisor’s offering, based on what
is to be received and what is to be given.

13
CHAPTER 2
LITERATURE REVIEW
Most studies done in the area of the franchisee-franchisor relationship take the
approach that franchising is a form of organization aimed toward maximizing profit.
These studies may include related questions about the optimum proportion of franchised
units and the appropriate mixture of outlets in the franchise system. Fiol and Lyles (1985)
discovered that the ability of the franchising system to provide more opportunity for
learning than a unitary organization provides should be taken into account. The nature of
the formal and informal relationships in a franchise system influence their commercial
transactions, and these commercial transactions can potentially generate conflict (Spinelli
and Birley, 1996). The line of thought that addresses franchising choice as a form of
organization describes franchising as being driven by a long-term contract whereby the
owner, producer, or distributor of a service or trademarked product (franchisor) grants the
non-exclusive rights to a distributor for local distribution of the product or service
(franchisee). General, organizational efficiency theories that have relied upon industrial
organizational theories of alignment of incentives are becoming the most generally
accepted means of approaching research about franchising. Caves and Murphy (1976)
defined a franchise agreement as an agreement lasting for a specified or indefinite span of
time in which the owner of a protected trademark grants to another person or firm the

14
right to operate under his trademark for the purpose of producing or distributing a product
or service.
Research on franchising as a type of organization can be categorized into three
primary areas: capital theory, the resource-constraints view, and agency theory. A
number of different theoretical perspectives within the above categories are discussed in
this chapter.
2.1 A Review of Franchising from the Viewpoint of Organizational Structure
The body of research dealing with the choice of organizational form and outlet is
primarily descriptive and empirical. The reasons motivating firms to choose franchising
rather than expansion through company-owned units is a topic that inspires debate in the
literature. In this section, we assess the different theoretical explanations for the choice
of franchising as an organizational form, followed by an examination of the empirical
support available for each of the perspectives.
2.1.1 Capital Theory
The capital market imperfection argument is among the earliest explanations for
franchising (Oxenfeldt and Kelly, 1968; Oxenfeldt and Thompson, 1969; Hunt, 1973;
Caves and Murphy, 1976). According to this argument, the franchisor, when confronted
with capital constraints, is able to raise capital at lower cost than is the case with other
business situations and thus is able to expand without adding company-owned stores. In
other words, franchisees are viewed by the franchisor as a means to deal with the problem
15
of scarce capital. According to Caves and Murphy (1976), “For financing outlets the
capital supplied by franchisees has no ready substitute” (p. 581).
A life-cycle model of franchising was proposed by Oxenfeldt and Kelly (1968),
whereby at early stages in a company’s life-cycle, when it may lack sufficient capital for
expansion, it may utilize franchisee’s capital for the growth of the firm. When the
company reaches the stage where it has acquired sufficient capital, the franchisor is able
to regain the larger units from franchisees. Lillis, Narayana and Gilman (1976) also used
a life-cycle approach to investigate the evolution of franchises. The authors suggested
unique advantages of the franchising distribution system, according to the franchise’s
life-cycle stage. They identified the following four primary advantages: “(1) rapid
market access, (2) a reduction in capital costs, (3) sharing risks within the distribution
channel, (4) highly motivated owner-operators” (p. 77). In addition, several other
advantages were: (5) work-sharing among management, (6) anti-trust action protection,
(7) an ability to provide service in marginal locations, (8) reducing economic
concentration, and (9) the promotion of independently owned business.
Further, the authors correlated the importance of these advantages to stages in the
life-cycle of a franchise. Generally speaking, the motivation of the franchisee was
perceived by franchisors to be the most important advantage. Also of importance,
respectively, were rapid market penetration, risk-sharing, and entry capital. The authors
surveyed fast-food franchises, and discovered that franchising was encouraged by rapid
market penetration in the early life-stages of a firm, but in the more mature stages, fully
integrated direct distribution was more advantageous. The authors also investigated the
importance of commonly accepted competitive advantages at various of the franchise’s

16
life-stages. Significant differences were discovered in the perceptions of the importance
of these competitive advantages at the various stages; differences were not as significant
across stages. The authors suggested that capital and management talent were more
significant to start-up companies than they were to successful franchisors.
An empirical study by Hunt (1973) and Thompson (1994) provided early support
for the life-cycle approach to investigating franchises. An aggregate trend was found
toward company-owned units in the fast-food industry. Also discovered was the fact that
large and older units were more likely to revert back to company ownership, a trend that
was corroborated by Caves and Murphy (1976) concerning company ownership of hotels,
motels, and restaurants. A prevailing rationale for franchising suggests that franchising is
a means for the franchisor to raise capital (Oxenfeldt and Thompson, 1968; Caves and
Murphy, 1976).
Markland and Furst (1974) have proposed a franchise portfolio optimization
model that can be utilized by potential franchises to determine their optimum portfolio.
This model has two primary attributes. First, a probabilistic capital budgeting technique
is used to evaluate potential franchises, and second, integer programming determines the
optimum portfolio of discrete, alternative franchises given the rationing of capital and the
constraints of risks.
It was found (Tompson, 1992) that when units necessitate high capital investment,
company ownership is less likely to occur. The fact that new franchisers charge a higher
initial fee than more established franchisors is an indication that resources are important
in the early stages of a firm’s growth (Sen, 1993). Although it has been widely accepted
among researchers, the capital constraint explanation seems to be in disagreement with
17
the theory of finance (Rubin, 1978). Rubin (1978) uses the theory of portfolio
management to emphasize the typically greater risk aversion of franchisees, and suggests
that there is a higher cost of capital for franchisees. Franchisees’ investments are not as
diversified as franchisor’s investments, because the franchising company will have
revenue from its portfolio of royalties and input fees. Therefore, it would be
advantageous for franchisees who do not want to incur high risks to require a risk
premium from the franchisor, which results in lower returns for the franchisor.
Rubin further notes (1978) that despite gross capital market imperfections which
cause franchisors to rely exclusively on store managers for capital, franchisors may
reduce capital costs by issuing shares to a portfolio of all its units, rather than following a
scheme of limited ownership. The franchisor controls the franchisees contractually,
which negates making this substitution, and also negates the other types of asset-reducing
franchisor behavior (Norton, 1988). The incentives of franchising are responses to a
vertical chain of market power. However, the market power structure is lacking in
generality (Rubin, 1978). Market power is, however, difficult to measure empirically
(Norton, 1988).
Neither the agency perspective nor the capital-constraints perspective alone
provides a complete rationale for ownership patterns in franchising (Dant et al., 1996).
Another perspective is the transaction cost-analysis, presented by Dant et al. (1996),
which utilized a framework that incorporates elements from both theories. According to
transaction cost analysis (TCA), the most efficient ownership structure is one that
minimizes both transaction and production costs. When applying TCA to franchising, the
varying proportions of units owned by franchising companies and by franchisees in
18
different franchising systems reflect the most efficient proportion for each system.
Franchising systems encounter various proportions of transaction and production costs,
and adjust their proportions of company-owned and franchisee-owned units in order to
minimize these costs (Dant et al., 1996; Klein, 1980; Williamson, 1979, 1981, 1983).
Behavioral uncertainty, in the context of franchising, refers to difficulties that
franchisors may encounter in monitoring the behaviors of franchisees and evaluating their
performance as per their contracts. Often mentioned in the literature is the tendency for
franchisors to “free-ride,” a practice that is detrimental to franchisees, who have no
incentive to cut costs or quality, since any savings do not accrue to them (Carney and
Gedajlovic, 1991). The free-riding practice is detrimental to the franchise trademark, and
is a pervasive problem for franchisees (Brickley and Dark, 1987; Norton, 1988; Carney
and Gedajlovic, 1991). The transaction cost point of view holds that the majority of
variance in ownership structure, the franchisor’s experience in production, and the
franchisor’s ability to achieve economies of scale have a significant effect on the extent
of the importance of company-owned units (Klein and Kim, 1998).
2.1.2 Resource-Constraints View
Among resource-scarcity oriented theories about why firms choose to become
franchisors, a lack of entrepreneurial/managerial resources has been generally accepted as
a key factor, in that firms’ managers may lack the resources to establish a network of
company-owned stores. Recruiting and training unit-managers can account for a sizable
percentage of firms’ growth costs, whereas in a franchising system, franchisees furnish
19
both capital and labor. This hybrid quality of franchising allows firms to overcome both
the constraints of a lack of managerial resources and capital constraints.
Oxenfeldt and Kelley’s approach to research about franchising is to explain its
essential nature and prospects, and to identify factors that lead franchisors to buy out
franchisees. Attaining higher profits is a primary goal. The authors suggest that
franchising is an appealing choice because there is a need for a ready supply of
management labor and talent. The motivation for franchisors to own and operate their
units is suggested to be the fact that franchisors are in the best position to identify and
retain the most profitable new franchise outlets. A goal that is related to the desire for
profit is that of attaining a “critical size” rapidly.
Another motivation toward franchisor ownership is the availability of essential
resources. At the outset of operations, franchisors may require funds and may need to
rely on franchisees financially. The factor of control is also an important factor that leads
franchisors to become owners, in that operating a franchise system allows greater control
over quality and service standards. And finally, the authors suggest that acquiring
franchisees was a necessary, although often problematic and difficult to control, step in
expanding their franchise systems.
According to Woll (1968), a prospective franchisor faces choices about the mix of
sources of revenue that will best serve continued growth and the continued growth of
franchisees in the system. The author identified eight primary ways in which franchisors
acquire revenue. Among these are: the initial franchise fee; royalties, and the rental of
property; the sale or leasing of equipment; raw materials and supplies; the sale of
franchise products; and the sale of territory rights. Two or more of these are usually

20
found in combination, utilized by a franchisor to gain revenue from franchisees. He
suggested that over time, successful firms would continue to grow, would become more
institutionalized, and would be more difficult to manage as they grew more complex.
It was found by Oxenfeldt and Kelly (1968) that the most successful franchise
systems eventually become entirely company-owned, and that during the early life-cycle
stages franchising is most advantageous to the franchisor. Franchising becomes less and
less attractive as the company matures beyond the expansion phase, and as its goals,
opportunities, and resources evolve. This is a theory that is supported by several
empirical studies on the topic, including Hunt’s (1973) empirical study that found that
successful franchise systems eventually are destined to become wholly owned chains,
gradually displacing franchisee-owned units, but never becoming 100 percent company-
owned. He identified six main reasons why firms seek to buy back franchised units,
including lack of ready capital, problems with franchising ethics, the desire for rapid
expansion, isolated units, and insufficient franchise fees. The author also identified five
factors in favor of company-owned units. These include higher profits per unit, greater
control over units, legal problems, and new restrictive legislation.
In their research, Zeller, Archabal and Brown (1980) also found a tendency for
franchisors to buy out the more successful franchisees. They suggested that a “franchisor-
master” system might be preferable to a system having a franchisor and franchisee
structure, because it promotes harmony in the system and opportunities to buy back the
units. Martin (1988) and Padmanabhan (1988) had a more complicated interpretation of
the effects of a franchisor-owned or a franchisee-owned system, in that they utilized more
than one operation. The authors found that company-owned units were more successful

21
than franchised units. These findings support Oxenfeldt and Kelly’s suggestion that
franchisors will, over time, re-acquire franchisee-owned units, leaving only the units that
are less successful under the control of franchisees (Lilis, Narayana, and Gilman, 1976;
Brickley and Dark, 1987).
A different viewpoint was taken in the research of Caves and Murphy (1976).
They suggest that franchisors must balance the possible revenue from a change to
company ownership against the investment costs of buying back the franchise. Their
analysis implies that changes in ownership will grow to the extent that franchisors use
their control of contracts to lower the costs of acquisitions. Also, the advantages of
company-owned units increase when unit performance increases, because the franchisor
usually uses fixed royalty rates. The authors found that, in comparisons of the average
sales volume of franchisee and company-owned establishments, that “company
ownership had probably peeled off the more profitable outlets in each sector” (p. 583).
They took the viewpoint of franchising as an economic relationship between the parties
involved, and analyzed the franchisor’s market power and found it an exercise in
constrained maximization.
Caves and Murphy (1976) further identified that the central features of
franchising were the rental of an intangible property asset, and the operation of a
production or distribution process that is decentralized. They further identified that there
are benefits and disadvantages to a firm’s rapid expansion. Rapid geographical expansion
may allow a company to pre-empt competition and achieve first-mover advantage, but
rapid growth of a franchise system may intensify the problem of scarce resources that is

22
faced by franchisors, in that a firm requires accessible financial and managerial resources
to support its expansion.
Norton (1988) found that the central characteristic of franchise organizations is
that they are a combination of market-like qualities and firm-like qualities. A franchise is
market-like due to the trade that exists between the company and its franchisees. The
franchisee pays a set amount to acquire the right to market the franchisor’s products, and
also pays royalties that include a percentage of sales, and may purchase specific inputs
from the franchisor. The firm-like qualities are found in the way that the franchisor’s and
franchisee’s relationship resembles nearly full vertical integration, but with the franchisor
exercising significant control over the franchisee. Also, the relationship resembles a
contract between employer and employee in that the contract usually strictly specifies the
right of the franchisor to unilaterally terminate the relationship, and specifies
performance criteria (Rubin, 1978).
According to Lafontaine (1992), 79 percent of franchisors indicate that they are
operating at or above their perceived optimum proportion of the revenue of company-
owned units. Also, she noted that among the reasons given by franchisors for franchising
were perceived long-term operational benefits. Through the use of secondary data, she
investigated whether or not the proportion of franchisor-owned units would be greater in
the early stages of a firm’s evolution when the investment costs were greater. However,
Lafontaine’s conclusions are relatively unclear as to the theory about changes in franchise
ownership over time.
Rubin (1978) suggests that it is not lack of capital or lack of management
resources that explains fully why firms choose to franchise. He contends that a firm
23
could simply hire experienced managers, assuming that the firm had sufficient capital.
He concluded that because of the inefficiency of the risk-sharing structure of franchising,
that there must be other factors that contribute to the wide-spread usage of franchising.
Rubin, as well as other researchers, reject the argument that a lack of financial resources
is a motivation for franchising. However, it should be understood that franchising is a
source of capital, as a type of private equity, and is a hybrid form of capital (Norton,
1988).
Despite substantial research, including empirical studies, the reasons for shifts in
ownership in franchise systems is not clear. From a public policy viewpoint, it is
recognized by Congress and state legislatures considering regulations about franchise
termination that the issue of changes in ownership remains unclear.
2.1.3 Agency Theory
In contrast to the resource-constraint view of franchising as being primarily
attractive to small firms wishing to expand, there is an alternative view that identifies the
incentive aspects of franchising. However, the resource scarcity view does not explain
why franchising is used by many businesses who clearly have full access to capital
(Lafontaine and Kaufmann, 1994).
An “agency relationship” has been defined by Jensen and Meckling (1976) as a
contract under which one or more persons (the principal) engage one another (the agent)
to perform some service on their behalf, which involves delegating some authority for
decision-making to the agent. In this situation, both parties may have varying motivations
and the agent will not always act in the best interests of the principal. Agency theory
24
holds that the purpose of contracts with an agent is to allow for the necessary transactions
of the business to be conducted in an integrated way. Agency problems are likely to
occur in units that are company owned because the parent company has only an imperfect
capacity to observe the employed manager’s actions and information base.
The costs to the agency occur where there are conflicts of interest, in combination
with the exercise of self-interested actions under conditions where there are rational
expectations. These conflicts of interest can result in sub-optimal business decisions
(Jensen and Meckling, 1976). In many organizational arrangements, agency costs -- the
costs of aligning the incentives of principals and agents, including bonding and
monitoring and the related forgone output attributable to those activities -- are incurred
because the value of specialization between principals and agents exceeds these costs. In
this instance, the parent company incurs costs associated with monitoring the managers
of company units in order to ensure that the company units are doing business in a way
that is in the parent company’s best interest. Therefore, it can be assumed that units
owned by franchisees are likely to perform better than company-owned units, because the
franchisees do not have the same incentives as the company-owned units’ managers.
Franchisees receive residual profits generated by their units. Changes in the organization
occur when the costs are too high relative to the benefits that result from specialization.
Relative to the theory of efficient capital markets, many researchers take a
different viewpoint, based on organizational economics, and in particular, agency theory.
This viewpoint suggests that franchisors can reduce risks by investing in the entire
franchising system at lower capital costs than the costs of the franchisees. This makes
capital more accessible to the franchisor than to the franchisee (Rubin, 1978). According

25
to agency theory, franchising is usually seen as a way to reduce agency costs, and follows
the assumption that managers will usually not perform to capacity when they are paid a
fixed rate. Several problems have been identified that are associated with company-
owned units (Rubin, 1978; Mathewson and Winter, 1985). The costs of monitoring
manager effectiveness in company-owned units have been most usually the focus of
researchers (Mathewson and Winter, 1985; Brickley and Dark, 1987; Norton, 1988).
Another problem with company-owned units is that physical dispersion in a
company can make conventional firm organization prohibitive (Rubin, 1978), in that
given a certain stage of dispersion, the monitoring costs exceed their benefits. It is
difficult for owners to distinguish between managers who are not working efficiently and
a low demand for the company products or services. Franchising avoids these monitoring
costs, but loses the efficiency of specialization. Then, it could be assumed that
franchising should be the more common business form, particularly in rural and other
physically dispersed areas. The more dispersion there is of units, the less the gains from
ownership.
Although franchising may economize on monitoring costs, it is not entirely
efficient. The use of high-powered incentives gives rise to three other problems, which
include inefficient investment, free-riding, and quasi-rent appropriations. There is a
trade-off, therefore, for the franchisor between agency costs and the benefits of reduced
monitoring of franchisees (Brickley and Dark, 1987; Krueger, 1991). Concentrated risk
is a cause of inefficient investment. Franchisees must bear the full risk of undertaking a
marginal investment (Carney and Gedajlovic, 1991). According to Brickley and Dark
(1987), the owner of multiple units disperses the risks among the units. These authors
26
also found that franchising was preferable to company-owned units in terms of low initial
investment per unit, high frequency of repeat customers per unit, and high employee
monitoring costs. It would be expected that a rational franchisee would under-invest in
particular assets.
Another agency problem associated with franchising is the possibility of free-
riding. If the costs of shading product quality are externalized and the gains are
internalized, then the franchisee may have a motive for such activities (Carney and
Gedajlovic, 1991). Free-riding is the most detrimental to the parent company when there
are few repeat customers in terms of unit sales (Norton, 1988). An additional agency
problem is the possibility of quasi-rent appropriation. Quasi rent can be defined as an
asset over the salvage potential of the physical property. If the quasi-rent is high, the
franchisee may be appropriated by the franchisor (Carney and Gedajlovic, 1991). The
risk of this appropriation is highest when a high beginning investment is necessary to
establish a franchise. Conversely, it was found that restaurants owned by franchisees
outperformed company-owned units, despite the compensation of managers
commensurate with profits.
Rubin has studied the characteristics of the franchise contract. Franchising has
often been seen as a means for franchisors to raise capital, rather than taking the route of
expansion by company-owned subsidiaries. The author has shown that the capital-raising
theory for franchising is in disagreement with contemporary capital theory, in that selling
franchises is more costly than selling franchise shares. He also suggests that
entrepreneurial franchisees would outperform hired managers due to their greater
incentives for profits. The author disputes the resource-constraints explanation, and

27
concludes that franchisees are more responsive to daily resource usage, costs, and
specific market-conditions than are the less motivated franchise managers, and hence
franchisee performance is higher. As a consequence, the decision to franchise may be
motivated more by advantages gained by the superior service and performance of the
franchisee than by the desire to gain capital through expansion. Shelton (1967) confirms
this finding in his study of restaurants, in which he concludes that restaurants owned by
independent franchisees performed better than those that were supervised by company
managers, even when mangers received compensation for performance. However,
empirical studies do not always confirm Rubin’s position. Dant, (1995), and Lafontaine
(1992) documented resource-based explanations for franchising.
Thomas, O’Hara, and Musgrave (1990) support the agency theory, in their
findings that high unit sales are a factor in the decision to convert away from a
franchising to a company-owned system. They also did not find support for the life-cycle
theory of franchising. According to Thompson (1992), company ownership of units is
most likely in urban regions and regions where there tend to be large units. A study by
Combs and Castrogiovanni (1994) did not confirm the idea of resource scarcity, but did
discover significant support for the agency theory and the idea of risk-taking.
Forward and Fulop (1996) suggest that established firms that choose to become
franchisors do not fit into the categories of either resource-constraints or agency-
incentives, but have qualities of both theories. Because company-owned stores are
sometimes run by inefficient managers, it was recommended that companies should
monitor their store managers, thus incurring monitoring costs. Franchisees, who have
invested capital in their own stores and whose profits come from store earnings, would
28
have more incentive to work harder than store managers. Self-motivated managers, who
are likely to take the initiative for the success of their units, do not require the investment
in monitoring that company-owned mangers require, and thus franchising helps to reduce
monitoring costs to the company (Krueger, 1991). Shelton (1967) discovered that
franchised stores out-performed company-owned stores, even though company-owned
stores seem to offer higher salary increases over time than do franchised stores (Krueger,
1991). According to franchisors, the high level of motivation of franchisees compared to
pay employees is the most important advantage of participating in a franchising system
(Lillis, Narayana, and Gilman, 1976).
29
2.2 A Review of the Franchise Relationship
According to the literature, a conflict situation may arise when the costs of
remaining in a franchise relationship are greater than the perceived costs of leaving the
relationship (Kaufmann and Stern, 1988; Ping, 1990). Franchise relationships are
undertaken when the parties perceive that the efficiency produced in the relationship will
result in increased value. The viewpoint of Stephenson and House (1971) is that for
franchise relationships, the benefits are based on the potential for greater gains through
group membership than through operating independently. The characteristics of the
franchise relationship raises questions about how much latitude the parties have for
independent action, and about constraints on decision-making autonomy. The authors
reached the conclusion that there was no particular benefit in a high degree of franchisee
autonomy.
Kaufmann and Stern (1988) used, in their research, relational exchange theory,
which investigates the nature of transactions between entities. They cite franchising as a
prototype for relational exchange, and suggest that the conditions that are detrimental to
the exchange relationship are not easy to identify. According to Hunt and Nevin (1974),
franchisee cooperation might be obtained through the use of power to manipulate the
franchisee’s behavior, or by convincing the franchisee of the benefits to be gained in the
relationship. A study by Felstead (1994) concentrates on the tendency for power to be
centralized in the organization, and for the franchisor to use that power to achieve goals.
The stability of the relationship is important to any composite organization (Borys and
Jemison, 1989). Although the literature portrays the relationship as one where the
30
franchisee is the recipient of the franchisor’s expertise and knowledge, it is important to
recognize the franchisee as an intelligent participant who is capable of contributing to the
system. A study by Zeller, Archabal, and Brown (1980) discovered that the goals of
franchisors and franchisees are in conflict, in that the franchisor strives to maximize
profits for the entire system, and the franchisee would like to maximize profits in its
territory, and particularly unit profits.
Early research focused on the tendency of the franchise relationship to be conflict-
prone, and involving a great deal of dissatisfaction due to the imbalance of power
between the participants (Parsa, 1994; Gaski, 1984, 1986). The use of inter-
organizational power and the satisfaction of distributors were studied in the context of
heavy industrial machinery (Gaski and Nevin, 1985). In this context, and based on a
previous study by Hunt and Nevin (1974), the authors dichotomized measures of power
sources and exercised power as “coercive” and “reward.” They found that if franchisors
relied more on non-coercive power sources and less on coercive power sources,
franchisee satisfaction would be greater. The authors further stated that the membership
contract builds into the relationship the direction of power for decision-making. In a
study of franchised automobile dealers, Lusch (1976) investigated the relationship
between power sources and intra-channel conflict. He found that conflict in the
automobile distribution franchise system was increased by the use of non-coercive power.
Another approach to the study of franchising is the micro-economic theory, which
places franchising’s theme of intangible assets-sharing in a theoretical structure. In this
theory, the reduction of costs or the increase of revenue is seen to result from a division
of tasks between two independent firms (Williamson, 1975). The assumption underlying
31
this theory is that both the franchisor and the franchisee are seeking to maximize profits
(Hayek, 1989). The franchisor-franchisee relationships are affected by differences in the
perceived value of a franchise. In the initial contract negotiations, franchisors specify
uniform contract terms for all franchisees. It is assumed that the contract terms take into
account the value of the franchise and its brand name, should include estimations of the
retail outlets financial performance, and should specify the costs of providing services.
The contract terms are contained in disclosure documents, used by prospective
franchisees as a “menu” from which they can choose franchise opportunities.
Prospective franchisees are more likely to choose franchisers with a higher brand name
value, and with proven success formulas. Such franchisors find easier entry into new
markets. Since franchisor revenue is generated primarily through franchise fees,
royalties, and sales of goods and services to franchisees, successful franchisors are likely
to charge higher fees to franchisees, and be more strict in selecting potential franchisees.
Hunt (1977) found that franchising benefits society by offering more opportunities for
minorities and women, and because franchisees have higher success rates than
independently owned businesses.
Arrow (1969) used a cost-economics approach to study franchising relationships.
In this theory, the principal burden of analysis lies in the comparisons of the various costs
involved in running the economic system under investigation. It is assumed that the
parties in the relationship are acting out of economic self-interest and will enhance their
own positions by engaging in opportunistic behaviors (Bergen, Dutta, and Walker, 1992).
In transaction-cost economics, the basic unit of analysis is the transaction (Williamson,
1975). Analysis of transactions involves examining the basic dimensions on which they
32
differ, and the implications of those differences for the design of management systems.
Transaction-cost analysis (TCA) regards asset-specificity as a primary concept
(Williamson, 1985). TCA is utilized as a technique to safeguard transactions against
possible opportunism by either party (Simpson, 1990). In any franchising relationship,
the formal safeguard is the license agreement that specifies the terms of the common
ownership and the responsibilities of both parties with reference to their common asset.
Williamson (1991) has found that transaction-cost economics analysis extends farther
than marginal analyses, in that it investigates efficiency in resource allocation. His
conclusion is that franchising has more benefits than autonomy in transactions, in that it
is multilaterally dependent, a situation that reduces the costs and risks.
Conflict reduction and the maintenance of the relationship are linked with
franchisee satisfaction in the relationship exchange (Frazier, Gill, and Kale, 1989).
Among the researchers in the area of conflict in franchise channels of distribution are
Lusch (1976), and Brown and Day (1981). These authors have focused primarily on
identification of the reasons for conflict. Two major areas of conflict are deception in the
selling and granting of franchises, and unfair practices in operating franchise systems
(Nevin, Hunt, and Ruekert, 1980). The interrelated goals of the franchisor and franchisee
tend to generate high degrees of trust and solidarity in the relationship. Kaufmann and
Rangan (1990) have proposed a mathematical model to resolve the problem of conflict
between the franchisor and franchisee during the process of adding new franchised units.
This model includes an integration of store choice, site allocation, and a proactive system
of management that optimizes the dichotomous effects of competitiveness and system
attractiveness.

33
Sharing economic rent becomes an issue when a franchisor-franchisee
relationship is entered into. Franchisors have available as revenue sources the initial
franchise fees, royalties, property rentals, the sale or leasing of equipment, supplies and
raw materials, franchise products’ sales, and the sale of territorial rights (Woll, 1968). It
was found, by Bacus, Bacus, and Human (1993), that both the industry and franchisor
characteristics determined base fees and royalty rates. The applicable franchisor
characteristics included age of the company, market share, number of employees in the
system, the types of services offered to franchisees, and the value of the franchisor’s
trademark value.
The assumption arises, from an examination of the franchisor’s theoretical cost-
structure, that the franchisor’s cost is fixed. Therefore, the franchisor’s revenue curve is
linked to that of the system’s franchisees, and, as previously described, will slope
downward and to the right. However, this assumption must be modified to include the
tiered placement of overhead and the marginality of product and services sales to
franchisees. A proposal by Hayek (1989) suggests that the price-system is very efficient
as a means of communicating information and bringing about change. In this proposal,
the central objective of economic organizations is adaptation, with a marketplace focus.
These findings were congruent with those of Sen (1993), who reported that the total
investment per unit, the tie-in sales requirements, and the percentage of franchised units
set the initial fees required by franchisors. A positive relationship was found by Combs
and Castrogiovanni (1994) between the number of franchised units and the amount of
royalties charged by the franchisor.
34
In the economics literature, the choice of the franchisee to purchase a franchise is
seen as a rational response to an appealing investment opportunity. However, this
viewpoint does not take into account the personal characteristics of the franchisee.
Peterson and Dant (1990) describe the franchisee as being subject to a “large number of
situational, personality, and economic correlates are likely to influence perceptions” (p.
48) about franchising. It is important to understand the franchisee’s economic
motivations, but such an inquiry should be augmented by a consideration of the
franchisee’s personal characteristics, which may have both economic and social origins.
Schul, Little, and Pride (1985) discovered that franchisee satisfaction is related to
how the franchisee perceives the quality of the interactions with the franchisor, the
quality of the franchisor’s operational support, the appeal of the reward structure, and the
fairness and autonomy of the relationship. Similar results were found by Lewis and
Lambert (1991), that franchisees were satisfied if they felt that the success of their
franchise was due to the franchisor. Franchisee satisfaction or franchisee’s fulfillment of
its goals has been used as a performance measure in some studies (Elango and Fried,
1997). Another performance measure that has been used for franchising is system-wide
growth in sales or units. Carmen and Klein (1986) have suggested that these measures
may be flawed in that they fail to recognize the multi-layered features of franchising
performance. Most research has measured franchising only from the perspective of the
franchisor, and it should be understood that the performance impact on franchisees might
be different. An example of this difference is the fact that increasing the number of units
may be of benefit to the franchisor, whose revenues depend on royalties from units in the
system, while, on the other hand, such increases may be detrimental to the franchisee,

35
whose market may be decreased by the existence of new franchisees. Morrison (1996)
found that in the contractual relationship between franchisor and franchisee, each party
has a role to play in ensuring that financial satisfaction will result for both, and that the
franchisee will experience job satisfaction.
The legal problems involved in franchising have been studied by Hunt and Nevin
(1975). They suggest that legal problems currently facing franchising fall into three main
areas: “(1) misrepresentations by franchisors to potential franchisees about the operation
of the franchise (the disclosure problem), (2) restrictions by franchisors on the source of
supplies or services purchased by their franchisees (the tying agreement problem), and
(3) onerous termination provisions in the franchise agreement (the capricious termination
problem)” (p. 20). Tying agreements are justified by advocates of franchising on the basis
of mass purchase and quality control. They recommend that when tying agreements are
used by franchisors in order to achieve higher prices than the competitive market offers,
they may have negative effects on franchisee’s revenues and hence with his satisfaction
with the franchise relationship. In a study of franchisees by Porter and Renforth (1978),
it was found that the three most common legal problems encountered by franchisees were
cooperative advertising, franchisor inspection and evaluation, and minimum performance
requirements. Franchising tie-in contracts can be seen as reducing the monitoring costs
that could prevent franchisee free-riding on the franchisor’s trade name (Klein and Saft,
1985).
36
2.3 Summary
This chapter comprises a review of selected literature relating to franchising and
the franchisor-franchisee relationship. The chapter reviews franchising literature from
the viewpoint of organizational structure, which includes literature that is primarily a
mixture of descriptive and empirical studies. Also reviewed are research perspectives
from capital theory, resource constraints, agency theory, and literature concerning the
franchisor-franchisee relationship, including relational exchange theory.
Most usually, research attempting to explain the creation of franchise systems has
focused upon the franchisor’s motivation to open a franchise. These studies do not
attempt to explain why some people want to be franchisees. The motivation of
individuals who join franchise systems and the antecedents that predict which individuals
are likely to be interested in becoming franchisees have received little attention (Bradach
and Kaufmann, 1988). The majority of theoretical and empirical support has been found
in the organizational efficiency perspective, which views the optimal franchise contract
as one which extracts rents, and minimizes free-riding by either party.

37
CHAPTER 3
Conceptual Model of the Franchisee-Franchiser Relationship
This chapter proposes a model of the interrelated factors that impact the quality of
the franchisor-franchisee relationship (See Figure 1, p.196). The following chapter
describes the portion of the model that was tested. This model’s structure includes an
integration of concepts from the area of the motivation to be a franchisee, the evaluation
of franchisor support, the perception of brand name, franchisee’s job performance,
franchisee’s job satisfaction, and the franchisee’s commitment to remain in or leave the
franchise system. The model uses concepts from motivation theory, social exchange
theory, service quality theory, Leader-Member exchange theory (LMX), and satisfaction
theory. The model describes what factors are the most important to the franchisee, how a
high quality relationship differs from a low quality relationship, and how this relationship
affects outcomes.
The first section of this chapter presents the framework for the model and
describes how each of these concepts is used in its construction. Each of these concepts
is defined, and a rationale for its inclusion in the model is offered. It should be noted that
the concepts represented in the model are interrelated and mutually influential, and
therefore, the discussion in each section refers to these interrelationships. The exchange
relationship has, in particular, been the subject of franchising relationship research; the
first section reviews the findings of this research.
38
The second section defines what is meant by the quality of the franchisor-
franchisee relationship. This construct is exemplified by Castleberry and Tanner (1986)
in their utilization of the Vertical Dyad Linkage Model (Graen and Schiemann, 1978;
Dunchon et al., 1986; Vecchio et al., 1984) that has recently been termed Leader-Member
Exchange (LMX). LMX may offer an enhanced understanding of franchisees’
perceptions and attitudes toward the franchise system. In organizational behavior
research, the benefits of a high-quality leader-member exchange are low turnover, high
job satisfaction, and high performance. Despite the importance of a high quality
exchange relationship between a franchisor and a franchisee, very little is known about
these relationships in the franchise system.
The third section of this chapter describes the linkage between the quality of the
exchange relationship and the job-related outcomes of performance and overall
satisfaction. LMX may be particularly useful in franchise research to assist in the
explanation and understanding of the socialization process, in identifying the variables
which are influenced by the leader-member exchange process, including satisfaction,
performance, loyalty, turnover, motivation, and in developing an understanding of the
management process as it affects the franchisor-franchisee relationship. In this chapter
section, propositions are offered which differentiate a high quality relationship from a
low quality relationship, and the possible behaviors of franchisees are explored.
39
3.1 Theoretical Framework: Leader-Member Exchange Theory
Exchange theory views human behavior as being guided by considerations of
exchanges of costs and rewards between interacting parties. Exchanges between a
subordinate and his or her leader (supervisor) are referred to as leader-member
exchanges. Over twenty years ago, Dansereau, Graen, and Haga (1975) presented the
vertical dyad linkage (VDL) theory. Since then, this theory has evolved into a dyadic
approach to understanding the leader-subordinate relationship known as leader-member-
exchange (LMX) theory, with the dyad consisting of a leader and an organizational
member (Herold, 1977; Graen and Scandura, 1987; Graen and Uhi-Bien, 1995). In the
case of this study, the leader-member exchange refers to the exchange relationship
between the franchisor and the franchisee.
The theoretical basis of LMX is that a dyadic relationship and work roles are
developed or negotiated over time through a series of exchanges, or “interacts,” between
the leader and the member (Wayne and Ferris, 1990; Wayne et al., 1997; Deluga, 1998).
Through their behavior, each member of the dyad invests resources in the development of
the relationship. LMX theory defines leadership as a mutually influential process
characterized by trust and obligation between the leader and the subordinate.
LMX is a subset of social exchange theory, which is a general theory that explains
behavior in various types of dyadic relationships (Blau, 1967; Ekeh, 1974; Heath, 1976;
Gergen et al., 1980; Cook, 1987). LMX theory is more specific, and attempts to describe
the behaviors of the subordinate and superior in a vertical dyadic relationship. LMX
applies general social exchange principles to this vertical dyad. These principles include
40
the following: (1) interpersonal relationships can be characterized as exchange
relationships, (2) each dyad member is seeking rewards, and (3) each dyad member
makes contributions based on the rewards offered by the other dyad member. Social
exchange theory applied to the leadership setting calls attention to the way in which the
subordinate’s behaviors or contributions to the exchange relationship affect the leader.
Leader-member exchange (LMX) theory stresses the various relationships
between a leader and subordinates within a work unit (Dansereau, Graen, and Haga,
1975; Liden and Graen, 1980; Graen and Scandura, 1987). LMX theory holds that the
quality of the leader-subordinate exchange affects performance (Dunegan, Duchon, and
Uhi-Bien, 1992), worker productivity (Scandura and Graen, 1984; Schriesheim, Neider,
and Scandura, 1998), organizational climate (Kozlowski and Doherty, 1989; Scandura,
Graen, and Novak, 1986), demographic similarity (Liden et al., 1993), perceived
similarity (Liden et al., 1993; Turban and Jones, 1988), and attitudinal similarity (Turban,
Jones, and Rozelle, 1990). The widespread application of LMX theory suggests that it is
a useful tool in understanding the dynamics of dyadic functioning in organizational
settings.
It is important to understand the leader-member-exchange relationship for a
number of practical reasons. First, the quality of exchange relationships can influence
many of a subordinate’s job-related outcomes. Positive relationships between LMX and
objective performance have been observed in some studies (Duarte et al., 1994; Scandura
and Graen, 1984; Eden and Shani, 1982; Graen, Novak, and Sommerkamp, 1982).
Second, expectations on the part of either a leader or member can lead to self-fulfilling

41
prophecies (Eden, 1990a,1990b; Turban et al., 1990; Eden, 1992; Liden et al., 1993;
Elaine and Lord, 1997).
It has been suggested by previous research that the leader-member relationship
can influence many behavioral employee responses. The influence of a leader on the
perceptions of fairness in procedures can be understood best as one of several possible
outcomes of a negotiated process of role-making which involve leaders and their
subordinates during the early phases of their working relationship (Dansereau et al.,
1975; Wayne and Ferris, 1990; Wayne and Liden, 1995). At its optimum, this
relationship can develop into an effective partnership (a high LMX partnership) which is
characterized by mutual trust, respect, and obligation as well as mutual goals (Graen and
Uhi-Bien, 1995).
It has been demonstrated by research that the leader-member exchange can be
related to significant organizational results, including subordinate turnover (Graen, Liden,
and Hoel, 1982), subordinate satisfaction (Graen, Novak, and Sommerkamp, 1982;
Graen, Orris, and Johnson, 1973; Scandura and Graen, 1984), and member extra-role
performance (Wayne and Green, 1993; Graen and Cashman, 1975). Delegation has been
investigated as a component of a larger construct (Scandura et al., 1986), by looking at
the relationship of decision-influence afforded to subordinates with subordinates’
performance and the quality of the leader-member exchange. It was discovered that the
correlation between the exchange quality and the performance of subordinates can
indicate that either a higher quality LMX or good performance was associated with a
greater degree of decision-making influence on the part of subordinates (Bauer and
Green, 1996). In another study, it was found that in dyads identified as having high-
42
quality leader-member exchange, the decision-making of supervisors was
characteristically less autocratic and more delegate than that of supervisors engaged in
lower-quality dyads.
High-quality leader-member exchange relationships can be viewed as evidence of
successful trust-building over time, which corresponds with theories of trust grounded in
social-exchange theory, that assume that trust is a product of the repeated exchanges of
benefits between two individuals. Studies have found that the personality trait of trust is
a basic foundation for high levels of leader-member exchange (Scandura and Graen,
1984).
From the discipline of psychology comes the premise that trust is a well
established and important factor of psychological well-being (Erickson, 1950) and that
the stability or instability of human relationships can be seen to have a basic grounding in
the personality trait of trust (Kee and Knox, 1969). More specifically, trust within
members of groups has been documented as being important to the group’s performance.
To elaborate further, trust can be seen as the basis for effective delegation, two-level
communication, giving and receiving feedback, and a sense of team spirit. The
development of trust is a primary factor in establishing a high-quality leader-member
relationship (Dienesch and Liden, 1986).
More recently, research has focused on the role of mature partnerships in effective
leadership processes (Graen and Uhi-Bien, 1995), and has extensively investigated the
role of “liking” in dyadic relationships (Dienesch and Liden, 1986; Liden et al., 1993;
Turban et al., 1990; Wayne and Ferris, 1990). Dienesch and Liden (1986) have proposed
that “liking” is actually a component of LMX, which they describe as a multidimensional

43
construct. Accordingly, several researchers have examined liking as an antecedent of
LMX. Wayne and Ferris (1990) showed that liking was a strong determinant of LMX
quality in both a laboratory and a field setting. According to Liden et al. (1993), early
liking in dyadic relationships was even more influential to a leader’s view of an LMX
relationship than the leader’s perceptions of performance.
Relationship quality has been discussed as a bundle of intangible values which
augments products and results in an expected interchange between buyers and sellers
(Levitt, 1986). In an empirical study on relationship quality, Crosby, Evans, and Cowles
(1990) investigated services selling and viewed relationship quality as a higher-order
construct that is comprised of the increasing importance of the dimensions of satisfaction
and trust. The trust that develops allows expectations to sustain the relationship.
Relationship quality can be seen as particularly relevant to franchisee-franchisor
interactions.
The leader-member exchange (LMX) relationship is based upon the level of
emotional support and the exchange of valued resources. The most important contribution
of the LMX is the supposition that the quality of the subordinate’s relationship with the
leader is critical in determining his or her success or failure in the organization, and
further, that the quality of the leader-member relationship correlates with productivity,
satisfaction (Graen, Novak, and Sommerkamp, 1982), and subordinate turnover (Graen,
Liden, and Hoel, 1982).

44
3.2 Components of the Model
In the theoretical model (see Figure 1, p. 196), leader-member exchange (LMX)
theory is a core concept dealing with the quality of the relationship between franchisor
and franchisee. The model describes the effects of motivation, the evaluation of the
franchisor’s support, the perceived advantage of the brand name, the franchisee’s
performance, the franchisee’s satisfaction, and the commitments of the franchisee in
terms of staying with or leaving the relationship. This study will demonstrate that in a
given leader-follower relationship, the causal directions are reciprocal in their effects on
behavior, and further, the study investigates variables which may determine the degree of
influence which dyadic partners may have on one another’s behavior.
3.2.1 Motivation for Choosing a Franchise
Perhaps the most important question to ask of a franchisee is why he or she would
seek a franchise rather than operating an independent business. Researchers usually have
chosen to identify the most important perceived advantages of franchising. In one study,
British franchisees identified “national affiliation with a nationally known trademark”
(Stanworth, 1977) as the most important advantage, while in another study “franchisor
support” was identified as the most important (Hough, 1986). Baron and Schmidt (1991)
found that although franchisees might desire to operate their own businesses, they found
franchising attractive due to the availability of backup help, a proven concept and name,
and reduced risks of failure. A study by Knight (1986) found that among the most
important reasons for becoming a franchisee were the benefits of a known trade name,

45
higher independence, and job satisfaction. A subsequent study by Withane (1991) used
Knight’s list in his research of a sample of Canadian franchisees, and identified “proven
business format” as the most important feature.
Peterson and Dant (1990) studied U. S. franchises, and found that those
franchisee’s who had owned businesses in the past ranked “established name” and “lower
development cost” as most important, while franchisees who had not had a history of
self-employment ranked “greater independence” and “training” as the most important
benefits of being franchisees. In another study, Hunt and Nevin (1974) looked for a
correlation between a franchisee’s past self-employment experience and the success of
the franchise, with the franchisee’s income as the indicator of success. However, no
significant relationship was found between these factors.
The choice to become a franchisee has its origin in both economic and social
factors, and the personal characteristics of the franchisor that guide the decision can be
assumed to have both personal and economic components. According to literature from
the field of economics, deciding to purchase a franchise is seen as a rational response to
an appealing investment opportunity (Kaufmann and Stanworth, 1995). It is typical for
franchise units to be small in scale and family-run (Kaufmann and Stanworth, 1995).
However, this viewpoint does not take into account several personal factors, among them
the initiation of the decision process because of unfulfilled need (Engel, Kollat, and
Blackwell, 1973; Engel, Blackwell, and Miniard, 1990). It could be suggested that it is
the desire for entrepreneurial activity that leads franchisees to purchase a franchise outlet.
Again, personal factors, as well as the previous experience of the franchiser may guide
the decision to purchase an outlet (Williamson, 1975). It is suggested, also that personal
46
characteristics associated with small business entrepreneurs may motivate franchisees to
purchase franchises, in that franchising is a subset of small business management.
Peterson and Dant (1990) have described franchisees as being subject to a “large
number of situational, personality, and economic correlates . . . likely to influence their
perceptions” (p. 48) about franchising. Therefore, it is important to realize that the
individual, personal characteristics of franchisees should be taken into account, in
addition to other factors. For example, it was discovered (Knight, 1983; Stanworth et al.,
1989; Stanworth and Kaufmann, 1994, 1996) that a proactive scale of personality traits
has a potential for clarifying the reasons why an individual would decide to become an
entrepreneur. Entrepreneurial commitments may be defined as one’s judgments about the
likelihood of owning one’s own business.
In his research, Korman (1968) said that “all other things being equal, individuals
will choose, adjust their performance to, and find satisfying those behavioral roles that
maximize their sense of cognitive balance or consistency” (p. 485). He identified self-
esteem as a behavioral trait that influences the other relationships between organizational
variables. According to Korman (1968), differences in self-esteem cause people to
behave differently in different situations in order to bring their cognitive processes in
alignment with their views of reality. In particular, the potential for self-esteem to
moderate situations has been a frequent topic for studies about the relationship between
job performance and job satisfaction. Korman (1968) suggested that people with high
self-esteem would demonstrate a high correlation between job satisfaction and
performance.

47
Another personality trait that potentially influences the decision to become a
franchisee is the perception of independence. Peterson and Dant (1990) suggested that an
increasing perception of personal power and independence was a likely factor in a
hierarchy of motivations to purchase a franchise. However, the authors identified a
weakness in their study, in that they did not use potential franchisees in their research,
and instead relied solely on the hindsight of current franchisees. Peterson and Dant
(1990) did not identify meaningful findings about the motives that attract small business
entrepreneurs to purchasing franchises, but Williams (1994) found that there was less
probability of becoming a franchisee for people who had not had prior small-business
experience.
People who do have prior experience in self-employment most likely find the
competitive advantage provided by franchising to be appealing, in comparison to running
a similar business independently. Franchising provides a somewhat easier means toward
self-employment than does beginning a small business enterprise, and it provides
opportunities for individuals to create jobs and long-term wealth and stability for their
families (Leach, 1994). The independence of franchising compared to salaried
occupations may be attractive to people with these motivations.
It can be seen from the review of the literature that a decision to become a
franchiser reflects a change directed at particular social or economic goals. The most
important characteristics of a franchisee were seen as the desire to work hard and to
succeed. The most significant concerns an individual might have about his or her work
environment are reflected in the advantages an individual perceives in becoming a
franchiser. Individuals who are self-employed are expected to value the reduced risk
48
associated with a successful and proven franchise company. Therefore, the following
proposition is based on the proposed model and the results of the prior research.
Proposition 1:
The franchisee’s motivation to become a franchisee is related to the quality of the
relationship with the franchisor and the commitments of the franchisee.
3.2.2 Evaluation of Franchisor Support
In the literature dealing with satisfaction/dissatisfaction, customer’s expectations
can be correlated with the predictions customers make about the likely outcome of a
given exchange or transaction. Nearly all the models about the process of satisfaction
formation assert that satisfaction results from consumers’ comparison of their perceptions
of product performance to their expectations about the product. However, the
expectation construct has not been well defined or conceptualized in the literature.
Expectations can be viewed as desires or wants of customers, i.e., what they feel a service
provider should offer rather than what they do offer (Parasuraman, Zeithaml, and Berry,
1985; Zeithaml et al., 1988, 1990; Zeithaml, 1988). And further, expectation can be seen
as primary perceptions about the likelihood of some event (Bearden and Teel, 1993;
Westbrook, 1987; Westbrook and Reilly, 1983). Another viewpoint expands on this in
that expectation is the perception of the likelihood of an event, and additionally, includes
the perception of whether or not the event will be positive or negative (Churchill et al.,
1974; Churchill and Surprenant, 1982; Tse and Wilton, 1988; Oliver, 1993).

49
According to Oliver (1981), “it is generally agreed that expectations are
consumer-defined probabilities of the occurrence of positive and negative events if the
consumer engages in some behavior” (p. 33). Oliver (1977, 1989) characterized
expectations as having two components: the probability of occurrence and the
occurrence’s evaluation. Both of these components are necessary, in that it is ambiguous
as to which attributes are preferred by consumers. As applied to the franchisee, Oliver’s
broader definition of the expectations (1974, 1979, 1980, 1996) construct combines an
individual’s judgment of an event with his or her expectations of the likelihood of its
occurrence. Miller (1977) proposed a construct having to do with “ideal expectations”,
defined as the “wished for” level of performance. Swan and Trawick (1980) suggested a
standard that they termed “desired expectations,” which can be defined as the level at
which the customer would like a product or service to perform. Miller (1977) proposed a
related idea, the minimum tolerable expectation, which can be defined as the lowest level
of performance acceptable to the customers’ subjective evaluation of their own
investment. Although Zeithaml, Berry, and Parasuraman (1991) have indicated that
service expectations are similar to ideal standards, they have not clearly articulated a
specific interpretation of the idea standard to which they are referring. It will be
demonstrated that conceptualizing service expectations as ideal standards is a problem
under each of the interpretations examined.
The expectation construct has been seen as having a major role in evaluating
franchisor support. The emphasis in the literature about quality assurance seems to focus
on product reliability through procedures rather than on the “validity” of the product.
50
From the customer’s point of view, matching fitness with purpose appears to have the
principal influence on quality.
A three-dimensional approach to service quality was taken by Lehtinen and
Lehtinen (1982). Physical quality, the first dimension, concerns a service’s tangible
aspects. The second dimension is interactive quality, which involves the interactive
nature of services and refers to two-way flows between the customer and the service
provider. The third dimension of the construct is corporate quality, which refers to the
image the customer has of the service provider. And finally, the fourth dimension is
identified as corporate quality, which refers to the image attributed to the service provider
by its customer. The authors contend that corporate quality tends to be the more stable of
the dimensions over time. In his study, Gronroos (1983) proposed that there are two
basic dimensions for service quality. The first, technical quality, refers to what is
delivered, while the latter, functional quality, refers to how the service is delivered.
The evaluation of quality results in degrees of one of two outcomes, satisfaction
or dissatisfaction, which can be viewed as representing opposite ends of a continuum. In
general, satisfaction occurs when outcomes meet or exceed the customer’s expectations,
and similarly, dissatisfaction occurs when there are negative discrepancies between the
outcome anticipated by the customer and the actual outcome. Satisfaction is determined
as a result of a comparison between expectations and outcome (Oliver, 1974, 1977, 1979,
1996). Quelch and Ash (1981) have suggested that customers do not always take action
when dissatisfied with services because they feel helpless in a given situation. The cause
for customer helplessness can be identified in the professional characteristics of the
service provided. Customers may be reluctant to complain except in cases of extreme

51
dissatisfaction with professional services because of the costs that such complaints may
entail, such as the legal costs associated with malpractice litigation, for example.
According to Parasuraman et al. (1985, 1988), investigating both the customer and the
service provider in the transaction will yield insight into the perception of service quality.
This suggests that assessing the perceptions of both sides of the transaction should aid in
understanding quality.
The role of the franchisee when purchasing contracts for the franchise system is
that of the franchisor’s representative. In the role of buyer, the franchisee’s responsibility
is to meet the franchisor’s requirements, and the franchisee’s accountability is to the
franchisor. Studies have shown that firm factors such as accountability, loyalty,
commitment to a constituency, monitoring of constituents, and the representational role
may greatly influence individual behavior in negotiations (Clopton, 1984). Therefore, it
is clear that there are several standards of comparison, and an understanding of the
impacts of expectations about the quality of a relationship on performance, and on
satisfaction must take these standards into account.
System growth is important to the establishment of a strong franchisor brand
name, and Shane and Spell (1997) suggest that the franchisee should seek a franchisor
that is expanding rapidly. To ensure quality, it is important to seek reliability through
effective procedures and efficiency, and also through attempting to influence attitudes,
behavior, and flexibility. Demonstration of trustworthiness and a high quality of
operating systems and other intangible assets can attract franchisees. Seen in this light,
perceived service quality derives from franchisees’ comparisons of the benefits they seek
from franchisors and the characteristics of actual service performance.
52
Proposition 2:
A franchisor’s support is related to the quality of the relationship, to the franchisee’s job
performance, and to the franchisee’s job satisfaction.
3.2.3 Perception of Franchisor’s Brand Name
The current study proposes that brand name may be a positive influence on the
franchisee’s behavior and reflect the quality of the relationship with the franchisor. A
good brand name would have a positive impact on perceived value and the willingness to
stay in the franchise system. A brand can be considered a conceptual construct that
stands for a product’s tangible and intangible assets, and is what sets the product apart
from other products in a competitive market. The customer’s perception of brand value
may derive from multiple sources, and the customer may have a perception of the
product’s image that is not related to the actual make-up of the product (Grewal et al.,
1998). This perception can have genuine value for the customer (Bojanic, 1996). Brand
name is frequently used as an “informational chunk” that represents a composite of
information about a product (Olson, 1976). A great advantage of a brand name is its
economies of scale in application (Caves and Murphy, 1976). According to Richardson,
Dick, and Jain (1994), ingredients associated with national brands have considerably
higher quality assessments than do ingredients that have private brand names. Often,
brand names are associated with superior quality, whether or not that assessment is
justified. A brand name gives customer confidence that there is an actual individual who

53
stands behind the recognizable corporate insignia and will back the product, and thus,
customers are willing to pay a higher price for brand name products.
Esteem can be defined as how highly consumers regard a particular brand, as
differentiated from knowledge, which is an understanding of what the brand stands for in
its growing market (Huddleston et al., 1990). The well-being of a brand can be seen as a
relationship between knowledge and esteem. A brand may be held in higher esteem than
knowledge; in other words, knowledge about a brand and the esteem with which it is
regarded are not necessarily the same. Brands which consumers hold in high esteem tend
to be newer brands, and in the case of franchises, they tend to be newer, expanding firms.
Conversely, brands about which consumers have higher knowledge than esteem tend to
have lower consumer perceptions of quality, and most likely have maintained sales
through discounting or low pricing (Agres and Dubitsky, 1996). Brand knowledge can be
subdivided into brand awareness (recall and recognition) and brand image (a combination
of the favorability, strength, and uniqueness of a brand).
There has been renewed interest in the role of consumers’ behavior as it relates to
the role and impact of brands, focusing on topics such as consumer evaluations of brand
extensions to brand equity (Aaker and Keller, 1990; Aaker, 1991; Loken and John, 1993).
A link has been found between consumers’ perceptions of the costs of advertising
campaigns and consumers’ expectations of brand quality (Kirmani and Wrigh, 1989).
Consumers’ memory of their brand evaluations and attitudes toward a brand can be
enhanced through advertising (Farquhar, 1989). If brand image is well created and
promoted, consumers can, through brand recognition, feel more confident about
uniformity of service quality, thus providing service companies with greater degrees of

54
latitude in pricing (Onkvisit and Shaw, 1989). Onkvisit and Shaw (1989) further assert
that, due to the abstract nature of services, a service company should attempt to create a
positive image through appropriate branding. A norm may derive from the expected
performance of a particular brand, and thus brand name can be viewed as a pledge to
consumers about a certain level of quality in products and services. This view is
paralleled by Cadotte, Woodruf, and Jenkins, (1987), who have stated that consumer
experience with a brand is a source of consumer expectations of a norm, particularly in
the case of focal brands.
Consumers and companies are willing to pay high prices for brand names because
of the perception that they add value. Brand image can be defined as the perceptions of
the brand that reflect consumer associations of the brand in memory (Keller, 1993, 1998).
The added value that a brand name gives a product is termed “brand equity” (Aaker,
1991). Brand equity can protect a company’s products from the risks of competition, can
facilitate the successful addition of new products. can ensure a consistent volume of
sales, and contributes to the image of the company or retail outlet. In a situation
involving collaboration, the brand image contributes to the overall impression the public
has of each partner (Varadarajan, 1986, Young and Greyser, 1983), where evaluations of
both brands occur when the brands are linked by collaboration of firms, in addition to the
perceptions that are attached to store-brand specific impressions (Broniarczyk and Alba,
1994).
The level of customer loyalty to certain brands is linked to the level of
commitment to a brand by customers. Brand equity exists in the perceptions, or mental
image, of the customer about the associations with a company or restaurant or service,
55
and the benefits of a given brand. Brand equity can take years to achieve, although it can
be lost in a very short time, or it can be strengthened, or expanded to other products and
services. Taken as an example, McDonalds is an institution with high brand equity.
Brand equity is a critical factor for the entrepreneur, whether self-employed, the operator
of a restaurant chain, or a single franchise.
It is difficult to manage “added value” without knowing the actual value that a
brand name adds to a product (Crimmins, 1992). The potential value of brands to an
acquiring firm is an indicator of brand equity (Kerin and Sethuraman, 1998; Muller,
1998). Within the area of marketing literature, brand equity usually falls into two
categories: those involving consumer perceptions (e.g. awareness, brand associations,
perceived quality) and those involving consumer behavior (e.g. brand loyalty) (Cobb-
Walgren, Ruble, and Donthu, 1995). Brand name is often the core indicator of brand
equity, and therefore brand equity and brand importance can be equated (Louviere and
Johnson, 1988; Sharkey, 1989). Keller (1993) offered the following perceptual
definition: Brand equity is “the differential effect of brand knowledge on consumer
response to the marketing of the brand.” Brand equity can be built by establishing service
delivery systems that consistently meet customer expectations in the level of products and
services. Also, to be retained in the customer’s memory, the brand must be reinforced by
consistent symbolic images that evoke significance and are graphic representations of the
firm’s level of product quality and service delivery.
Consumers choose restaurant brands because they stimulate excitement, or they
are comfortable, or they are reliable. Since consumers judge the acceptable level of
restaurant products and service quality as a combination of sacrifice and utility, which
56
restaurateurs commonly call value, market leaders in the restaurant industry can maintain
market share by offering a high quality product at a fair price, which can be seen as
corresponding to brand equity.
Franchise systems have expanded because there apparently has been an increase
in the efficiency of national brand names through television exposure and more efficient
national information technology, thus reducing the costs of establishing national brand
names. Also, an increase in travel has caused consumers to stop in unfamiliar
geographical areas where brand names would be perceived as a guarantee of a
consistency of quality. In this instance, the recognition of brand names through national
advertising would be indicators to consumers of quality. This in turn enhances the value
of the national brand name. Also, consumer preferences have changed as consumer
income has risen, and these changes have served to enhance the value of national brand
names. In other words, consumers are often inclined to purchase standardized products
from the nearest available source.
Base fees and royalties reflect the financial value of the franchise, and costs are
those expenditures associated with running a franchise operation. A franchisor’s value to
the franchisee is linked to consumer preferences for nationally known brands offering
standardized products or services. Franchisors specify uniform contract terms for their
affiliated franchisees, which serve to reflect the value of the franchise and its associated
brand name, including the estimated financial performance of the individual franchisees,
and the costs that come with the provision of contracted services. Differences in the
value of a franchise have implications for the franchisor-franchisee relationship. The

57
greater the value of the brand name, the easier the franchisor’s entry into new markets,
and the greater the demand from franchisees (Baucus, Baucus, and Human, 1993).
Proposition 3:
Brand name is associated with the quality of the relationship between the franchisor and
the franchisee, and is related to the franchisee’s job performance.
3.2.4 The Quality of the Relationship Between the Franchisor and the Franchisee
The proposed model of the franchisor-franchisee relationship builds on Leader-
Member Exchange Theory (LMX), which utilizes the concept of dyads. Dyads, a special
case of groups, are defined by two individuals who are interdependent on a one-to-one
basis. In utilizing LMX, it is assumed that franchisor-franchisee dyads are unique types
of dyad, and that the specific relationship under investigation determines the outcome
variables and performance processes. The model proposed in this study illuminate the
process of exchange between the franchisor and franchisee through the use of a dyad
perspective. The model attempts to provide a complete description of the franchisee-
franchisor relationship by identifying each of the contributions to the relationship, and
describing how these contributions are interrelated (or exchanged). Further, this model
attempts to capture the unique problems of a vertical dyad, which is located at the
boundary of the organization.
Social exchange theory provides general principles regarding dyadic
relationships; LMX explains what is involved in vertical dyads, and boundary role theory
holds some implications for vertical dyads, which are located at the perimeter of the

58
organization and include the franchisor and the franchisee. Using categorization
structures from the leadership literature, behaviors on the parts of the franchisor and the
franchisee can be ordered according to personal and positional factors impacting the
exchange relationship. When seen in the light of boundary role theory, these
contributions to the relationship are applicable to the franchise system. On the franchisee
side of the relationship, the advantages include a proven concept, the tools necessary for
success, technical and managerial help, standards and quality control, a minimal risk, less
capital necessary for operations, access to credit, and the advantages of advertising. On
the franchisor side of the relationship, franchisees make valuable contributions to the
system. It should be noted that some of the most productive concepts utilized by chains
have come from franchisees. An example would be the world’s single most recognizable
fast-food item, McDonald’s Big Mac, which was initiated by a franchisee. The Egg
McMuffin and Wendy’s taco salad have similar origins. The advantages for franchisors
include opportunities for expansion, increased buying capabilities, convenience of
operation, and the contributions of the franchisee.
A focus of current research is on dyads consisting of the franchisor and the
franchisee within groups, and independently of their formal groups. Dynamic exchanges
can occur between the franchisee and significant others, including the franchisor, which
is the key relationship in the franchisor-franchisee dyad. Whether or not the parties
involved can work smoothly with one another, whether or not they share compatible
goals; and whether they have an understanding of and place value on one another’s
strengths and weaknesses, are all important questions that impact performance. The
potential significance of leader-member exchange to the business success of companies

59
has been demonstrated to correlate highly with satisfaction and performance (Scandura
and Graen, 1984). A high quality relationship can be expected to result in high
productivity, and thus the quality of the relationship between franchisor and franchisee
potentially can determine revenues and profits.
Proposition 4:
The quality of the LMX is related to the level of performance, to the level of satisfaction,
and to the commitments of the franchisee.
3.2.5 Franchisees’ Job Performance
Many researchers who have attempted to find correlations between performance
and outcomes have recognized the need for a definition of the construct of performance.
A study by Schwab and Cummings (1970, 1976) found a relatively weak to moderate
relationship between job performance and job satisfaction, and suggested that the
variables that affect performance and job satisfaction differently could be potential
moderators of the performance-satisfaction relationship. Carrying this idea further,
Porter and Lawler (1968) noted that variations in job performance might be the reason for
variations in satisfaction. This idea was also supported by Schwab and Cummings (1970,
1976).
A higher correlation was found between comparatively satisfied franchisees and a
higher annual income and/or higher total sales than was the case with relatively
dissatisfied franchisees. Schul (1980) found that the degree of conflict was potentially of
influence in the franchisor-franchisee relationship, and in another study Morrison (1997)
60
found that conflict had impacted performance negatively in those organizations that were
found to have a higher mean level of conflict. Franchisees’ performance can be seen as a
cluster of related factors, including motivation, aptitude, role perception, and
environmental variables. In turn, successful performance brings rewards that lead to job
satisfaction. Studies have examined various components of these issues, as well as the
effects of the franchisee’s adaptability.
Recently, attempts have been made to provide an integrative framework
addressing the process by which the franchisee’s affect variable may be an antecedent of
sales performance. One such study was done by Tanner and Castleberry (1986) using
Vertical Exchange (VE) theory, and focusing on the interaction between the manager
(franchiser) and the salesperson (franchisee). The VE model illustrates the relationship
chains that are formed in a sales organization. The advantage of VE theory over other
theories is that VE takes into account the franchisee’s behaviors that affect the franchisor.
These behaviors have an effect on franchisor’s behaviors and impact role stress and other
factors that relate to performance, such as territory quality, training quality, and others
(Tanner and Castleberry, 1990). A relationship based on the exchange of work-support
forms between the manager (franchisor) and the subordinate (franchisee) through a
continuum of the give and take of rewards. The continuum consists of a high quality of
exchange (termed a cadre relationship), to a low quality of exchange (a hired-hand
relationship). Of the two types of relationship, the cadre relationship enjoys more
latitude, support, and attention from the manager (Graen and Schiemann, 1978).
61
Proposition 5:
A franchisee’s job performance is related to the level of the franchisee’s satisfaction, and
also is related to the franchisee’s commitments.
3.2.6 Franchisee’s Job Satisfaction
Job satisfaction is defined as the degree to which the characteristics of the job
itself and the work environment are judged by employees to be rewarding, fulfilling, and
satisfying (Churchill, Ford, and Walker, 1974, 1976, 1979; Churchill et al., 1985). A
further, commonly used definition is that job satisfaction is “a pleasurable or positive
emotional state resulting from the appraisal of one’s job or job experience” (Locke, 1976,
p. 1300). Empirical studies have been conducted to determine the effects on job
satisfaction of pivotal organizational outcomes such as the commitment to leave the
business relationship (Mobley, 1982), job performance (Iaffaldano and Muchinsky,
1985), and improving organizational interrelationships (Schul, 1980). In practice,
franchisor-franchisee relationships that mesh well are a primary determining factor
leading to the future attractiveness of franchising (Morrison, 1996).
Many empirical studies have investigated the franchisee’s work attitude in various
areas of the franchise work environment (Hunt, 1977; Goodman, 1980; Knight, 1986;
Morrison, 1996). Job satisfaction has been one of the most frequently studied work
attitudes, and it has been noted that franchisees’ attitudes toward their work tend to have
an important role to play in their decision-making and job satisfaction (Morrison, 1997).
Morrison postulated that there were three primary factors that influence franchisee job
satisfaction positively. These include: (1) franchisor support meets franchisee’s
62
expectations, (2) franchisee’s expectations are met regarding operational characteristics;
and (3) franchisees perceive fairness in the franchisor’s restrictions. Morrison (1996)
stated that both franchisor and franchisee have roles to play in ensuring that their
relationship would lead to franchisee job satisfaction and financial success for both.
A distinction can be made between the quality of a relationship and job
satisfaction. The perceived quality of a relationship is a global judgment or attitude,
whereas satisfaction is more local, and related to a particular transaction. Oliver (1980)
summarizes the current thinking on job satisfaction in the following definition:
Satisfaction is a summary psychological state resulting when the emotion disconfirmed
expectations is coupled with the consumer’s prior feelings about consumption
experience. Given these factors, the most likely and easily measured were favorable or
unfavorable word-of-mouth and whether franchisees would purchase their outlet again if
given the opportunity.
It is proposed that franchisees’ relative job satisfaction play an integral role in
maintaining the franchisor-franchisee relationship. In addition to helping improve the
franchisor-franchisee relationship, this investigation may provide useful information to
the franchisor in franchisee selection, and for marketing franchises.
Proposition 6:
Franchisee job satisfaction is related to the franchisee’s commitments.
63
3.2.7 Franchisee’s Commitment
Meyer and Allen’s (1991) referred to three forms of commitment as affective,
continuance, and normative commitment. They also identified three distinct themes in the
definition of commitment: (1) commitment as an affective attachment to the organization,
(2) commitment as a perceived cost associated with leaving the organization, and (3)
commitment as an obligation to remain in the organization. Common to the three
approaches is the view that “commitment is a psychological state that (a) characterizes
the employee’s relationship with the organization and (b) has implications for the
decision to continue or discontinue membership in the organization” (Meyer et al., 1993.
p. 539).
According to many studies, turnover is a behavior resulting from individual
choice, and is a psychological factor. In the commitment-turnover relationship,
commitment with one’s job is the most often investigated psychological variable studied
on the individual level (Mobley et al., 1979). Satisfaction and organizational commitment
have been invariably been found to correlate positively with one another (Bluedorn,
1978,1982; Clegg, 1983). Commitment to an organization is a vital factor, and includes
its effect on turnover and intentions to remain in or leave the relationship (Shore and
Martin, 1989), and the relationship of commitment to job performance (Mowday, Steers,
and Porter, 1979).
A lack of job satisfaction has been found the single most important reason why
franchisees leave the franchisee-franchisor relationship. According to Price and Mueller’s
empirical study (1986), job satisfaction has an indirect effect on turnover in that it affects
64
the formation of the intent to leave and a positive relationship has been found between
commitment and intention to quit the relationship. Job satisfaction is thought to be a
product of immediate affective attitudes to the work and the characteristics of the work,
while commitment to an organization is thought to develop slowly over time (Locke,
1976; Mowday, Porter, and Steers, 1982).
There are few definitive findings about which factors impact the level of
franchisees’ commitment to the franchise system of which they are a part. Early studies
indicate that franchisees who have a positive perception of their relationship with the
franchisor have more commitment to their franchise system (Mayo, Robicheaux, and
Ferrell, 1989). It should be remembered that this relationship may be reciprocal
(Morrison, 1997). A relatively significant negative relationship was identified between
worker-satisfaction and voluntary turnover. A study by Porter et al. (1974) contends that
the relationship between job satisfaction and job turnover is based on the extent to which
job expectations are met. The psychological reasons for this result, according to Mobley
(1982) are that dissatisfaction on the job leads to thoughts about leaving the job, the
commitment to search for another job, the evaluation of employment alternatives, the
intention to leave the job, and subsequent turnover.
Cotton and Tuttle (1986) found a negative relationship to turnover with overall
job satisfaction, satisfaction with the work itself, satisfaction with income, satisfaction
with supervision, and organizational commitment. Hing (1995, 1996) suggests that
franchisee satisfaction can be strongly correlated with positive post-purchase intentions.
And further, he found that if the re-contract is positively related to franchisee satisfaction,
franchisees have the commitment to recommend franchise investment to others, and to

65
invest in their franchise unit again. This finding suggests that franchisee satisfaction
positively influences the intention to remain in the franchise system. Another factor that
may positively influence organizational commitment is whether or not it is perceived that
the parent company has an investment in the franchisee’s success, and the quality of the
partnership between the franchisor and the franchisee.
3.3 Summary
This chapter discusses literature relevant to the constructs of the proposed model,
and to the propositions of the study. The design of the model presented in this chapter
was based on information gathered from an extensive review of the relevant literature.
The basic conceptualization of the proposed model is investigated, with the assumption
that the quality of the franchisor-franchisee relationship depends on various inputs by
both franchisors and franchisees. These inputs influence both the franchisee’s
performance, job satisfaction, and commitment.
The concepts presented in this chapter represent the initial steps in the research
agenda, in that they describe an antecedent stage in the proposed model. First, leader-
member exchange theory is discussed, as a subset of social exchange theory and as a core
concept about the quality of the franchisor-franchisee relationship. The relationships in
the model are then expressed as six propositions, which are the assumptions underlying
the model’s constructs. These propositions include the areas of motivation for choosing a
franchise, the quality of the relationship as related to job performance and franchisee job
satisfaction, the significance of the perceptions of brand name, the relationship of the
66
LMX quality to performance level, the level of satisfaction and to the commitments of
the franchisee, These propositions address significant factors in the franchisor-franchisee
relationship, including the perceived quality of the franchisor’s service, and the perceived
brand value. Further, the linkages between these factors are explored
67
CHAPTER 4
RESEARCH METHODOLOGY
This chapter introduces the research hypotheses, the measurements for all the
constructs, and the analytical procedures used to check instrument reliability and validity.
In the first section of this chapter, the research hypotheses are presented. The hypotheses
are based on the theoretical model of the franchisor-franchisee relationship that includes
the effects of the franchisee’s motivation for choosing the franchisor, the evaluation of
the franchisor’s support of the franchisee, and the franchisee’s perceptions of brand
value. And also, the model addresses the effects of the quality of the relationship on the
franchisee’s job performance, job satisfaction, and willingness to stay with the
franchising company. The second section of this chapter discusses the sample selection
and data collection, and the administration of the questionnaires. The measurement
methods used in the study are presented in the third section.
It is necessary to examine the quality of the data in terms of testing the non-
response bias and informant competency. Some of the assumptions underlying the
theoretical model are then tested. The analysis is based on the Covariance Analysis of
Linear Structural equations (used to test the model). This design allows the researcher
the opportunity to examine causal relationships in the field setting.
68
4.1 Research Hypotheses
A hypothesized model (see Figure 2) of the franchisor-franchisee relationship was
developed based on the proposed conceptual model (see Figure 1). Six research
hypotheses are tested, including hypotheses that deal with the examination of the effects
of motivation, evaluation, brand name, the quality of the relationship, performance,
satisfaction with the franchisor-franchisee relationship, and willingness to remain in the
franchise relationship. Hypothesized relationships among the variables in Figure 2 are
indicated by causal and effect signs.
The motivations of individuals who join a franchise system have received
relatively little attention (Peterson and Dant, 1990). The growth of franchising and its
lower failure rate in comparison to independent business is generally attributable to
greater market recognition based on an established trade-name, proven products and
systems, the provision of training by the franchisor, and continuing support of a
franchisor’s professional staff.
The selection of a franchisor is a critical element in the success of an individual or
group of individuals entering business through becoming a franchisee. Weinrauch (1986)
maintains that effective franchisees should be dedicated entrepreneurs, good team-players
and able to work within the system.
Hypothesis 1.a:
A higher level of franchisee motivation leads to a higher quality relationship
between the franchisor and the franchisee.

69
Hypothesis 1.b:
Franchisee motivation is negatively related to the franchisee’s commitment.
Hypothesis 1.c:
Franchisee motivation for choosing a franchise is positively correlated to the
perceived quality of the franchisor’s support
Hypothesis 1.d:
Franchisee motivation for choosing a franchise is positively correlated to the
perceived brand value of the franchisor.
The concept of perceived value or subject value evolved from early research.
Rational choice theory holds that people weigh the possible benefits of their actions
against the cost incurred. A franchisee’s perceived value can be seen as a trade-off
between two basic components: what is received (the benefits) and what is given (the
cost), while the other two concepts are more related to the benefit components (Flint,
Woodruff, and Garial, 1997).
Franchisees pick and choose among competing contracts, looking for an
opportunity that provides good value and a fairly high probability of success. The
perception of contract fulfillment is contingent not only upon the ranked importance of a
service from the franchisor, but also the adequacy with which that service is delivered.
Thus, the transaction boundaries of the relationship can be clearly established from the
70
perspective of the franchisee. Both transaction-cost analysis and relational exchange
theory rely on a spectrum of transactional involvement between parties.
Hypothesis 2.a:
The quality of the franchisor’s support is positively related to the franchisee’s job
satisfaction.
Hypothesis 2.b:
A perceived higher level in the quality of the franchisor’s support leads to a
higher quality relationship between the franchisor and the franchisee.
Hypothesis 2.c:
The quality of the franchisor’s support is positively related to the franchisee’s job
performance.
Early studies suggest that consumers rely heavily upon brand names, at least
when brand cues are either unassociated or positively associated with product quality
levels (Hite, Hite, and Minor, 1991). Researchers empirically tested the effects of brand
names on perceived quality. Their findings suggest that brand information significantly
influence perceptions of quality.
A service firm’s trademark and brand image is crucial to the success of its retail
outlets. Companies typically develop their brand image and trademark through extensive
advertising and promotion. However, a company will benefit from mass-media
71
advertising only if customers who see its ads have access to a number of its stores. To
achieve the benefits of its national or regional advertising efforts, a company needs to
attain an efficient scale, in terms of the number of stores, as quickly as possible. Because
franchising entails less monitoring and provides quicker access to capital and managerial
resources, a firm can expand more quickly through franchising than through company-
owned stores.
Goodwill (referred to as “trademark value” and “brand name”) is central to the
decisions faced by a franchisor. Considerable evidence has been found that indicates a
negative relationship between the level of goodwill and the ownership proportion in a
chain (Norton, 1988; Banerji and Simon, 1992). This association is driven by the
implications that the level of goodwill has for free-riding and the franchisee’s quasi-rent
stream, which suggests linkages between the stock of goodwill and an optimal contract
structure.
Hypothesis 3.a:
Brand value is positively related to the quality of the relationship between the
franchisor and the franchisee.
Hypothesis 3.b:
Brand value is positively related to the franchisee’s job performance.
Through a synthesis of the diverse literature on exchange relationships, this study
conceptualizes relationship quality as consisting of three dimensions: mutual trust,
72
mutual commitment, and interdependence. Trust, commitment, and interdependence
have received a considerable amount of attention by marketing researchers (Brown,
Lusch, and Nicholson, 1995).
Research shows that LMX theory is related to important organizational outcomes
such as subordinate turnover (Graen, Liden, and Hoel, 1982), subordinate satisfaction
(Graen, Novak, and Sommerkamp, 1982; Scandura and Graen, 1984), and member
performance (Wane and Graen, 1993).
Hypothesis 4.a:
A higher level of quality in the franchisor-franchisee relationship leads to a
higher level of franchise job performance.
Hypothesis 4.b:
A higher level of quality in the franchisor-franchisee relationship leads to a
higher level of franchisee job satisfaction.
Hypothesis 4.c:
The quality in the franchisor-franchisee relationship is negatively related to the
franchisee’s commitment.
The relationship between LMX and performance has been repeatedly
demonstrated in studies where performance has been measured using subjective ratings
by supervisors (Dansereau et al., 1975; Duarte, Goodson, and Klich, 1994). Positive

73
relationships between LMX and objective performance have been observed in some
studies (Graen, Novak, and Sommerkamp, 1982; Scandura and Graen, 1984; Duarte et.
al., 1994). Morrison (1997) have hypothesized that the level of service and support in
advertising and training is highly correlated with the franchisee’s ultimate success.
Hypothesis 5.a:
Franchisee’s job performance is positively related to the franchisee’s job
satisfaction.
Hypothesis 5.b:
Franchisee job performance is negatively related to the franchisee’s commitment.
Robinson (1979) has characterized aspects of the satisfaction of the franchisee
with the franchise relationship as “post-purchase and complimenting,” and “post-
purchase and complaining.” Valencia differentiated between post-purchase satisfaction
and favorable or unfavorable word-of-mouth, and appeals to a third party. For
franchisees, favorable/unfavorable word-of-mouth and whether or not franchisees would
purchase their outlet again if given a second chance were considered to be the most likely
and most readily measured indicators of satisfaction.
Hypothesis 6:
Franchisee’s overall job satisfaction is negatively related to the franchisee’s
commitment.
74
4.2 Sample
The sampling frame for this study consists of franchisees in business-format
franchising. The reasoning for the decision to concentrate on this type of franchise
arrangement is that business-format franchising involves a complete business context
rather than a single product or trademark (Khan, 1992). The primary means of data
collection in this study involves a mailed questionnaire survey of selected members of the
International Franchising Association (IFA), with a concentration on franchises in the
foodservice industry. Assuming a conservative response rate of 10% that allows for
some screening-rate attrition, the study draws a random sample of 3,000 franchisees from
around the United States. The most important criterion in selecting a sample is to
increase the validity of the collected data (Carmines and Zeller, 1979, 1988). In the case
of the present study, the data selection criterion was designed to increase validity, rather
than to ensure that the sample was representative of a given population. Therefore, the
study uses a purposive sample, which is most desirable when certain important segments
of the target population are intentionally represented in the sample.
4.3 Data Gathering
A franchisee questionnaire was constructed following an extensive review of the
literature. Previously established scales were utilized to measure the study constructs
whenever possible. The initial draft of the questionnaire was reviewed by a number of

75
faculty and five franchisees at the study site to ensure the face reliability and validity of
the scale items. Based on feedback offered by those who examined the questionnaire,
there were no significant changes made to the scale items.
Next, the finalized questionnaire was pretested by the 7 franchisees who operate
restaurants in Blacksburg and Christiansburg, Virginia and several Ph.D. students who
are studying restaurant franchising. The pretest served a number of purposes. First, it was
determined that the average time spent in completing the questionnaire was less than 20
minutes. Second, additional support for the face validity of the survey instrument was
established. Third, it was determined that the readability of the questionnaire was
acceptable across various educational levels. The survey instrument is included in
Appendix C (p. 217).
A total of two thousand seven hundred ninety seven questionnaires were distributed
to the franchisees. Included with each questionnaire was a cover letter explaining the
importance of the research and written instructions for completion of the survey. In total,
210, usable questionnaire were returned, comprising a response rate of 7.8 percent.
4.4 Measures
The questionnaire used in this study is divided into eight parts, as follows. Part 1
is designed to measure the motivation for choosing a franchise; Part 2 involves measuring
the franchisee’s evaluation of franchisor support; Part 3 is designed to measure the
perceived brand value; Part 4 is designed to obtain information about the quality of the
relationship between the franchisor and the franchisee; Part 5 measures the franchisee’s

76
job performance when the subject is impacted by the quality of the relationship with the
franchisor; Part 6 is designed to measure the franchisee’s overall satisfaction when the
subject is impacted by the quality of the relationship; Part 7 measures the franchisee’s
willingness to quit or remain in the franchise system when the subject is impacted by the
quality of the relationship with the franchisor, by job performance, and by overall
satisfaction; and finally, Part 8 is designed to gather demographic information about the
subjects. The respondents are asked to respond to the questions using a seven point
Likert-type scale.
4.4.1 Measurement of the Motivation for Choosing a Franchise
In a study of U. S. franchisees, Peterson and Dant (1990) found that previous
business owners ranked “established name” and “lower development costs” as the most
important advantages of being a franchisee, while franchisees with no self-employment
history ranked “greater independence” and “training” as the most important advantages.
Stanworth and Kaufmann (1996) presented a list of nine main reasons why people might
be motivated to buy a franchise. The list included the motives of “independence,”
“proven business system,” “a known trade-name,” and “reduced risk.” Edens, Self, and
Grider (1976) found the most important factors in the selection process to be general
management knowledge and previous work experience. Other important factors were
industriousness, motivation and perseverance, family commitment, and health.
The following questions were designed to measure the motivation for choosing a
franchise (see Table 4.1).

77
1. Franchising is in an industry that I believed had a good growth potential.
2. The franchisor provides tools for success.
3. Franchising offers a high yield on my investment at a low risk.
4. I do not feel highly constrained by the agreement.
5. The franchisor offers a superior training program to their franchisees.
6. I have the experience required for operating a franchise restaurant.
7. The franchisor offers complete systems, services, and technical expertise to
its franchisees.
________________________________________________________________
Source: Adapted from Peterson & Dant
Motivation to be a franchisee was measured on a 7-point Likert-type scale ranging from
(1) = Strongly Disagree to (7) = Strongly Agree
Table 4.1 Motivation to be Franchisee Scale
78
4.4.2 Measurement of Evaluation of the Franchisor’s Support
Among the services considered to be important to the success of a franchise are
site selection, building plans, training programs, and operating manuals and field
supervision (Hunt, 1977). A successful franchise operation requires a broad-based
support system for franchisees, including training, sales promotion, and strong brand
names (Shane and Spell, 1998). Contracted services include direct financial assistance
such as loans and leases, help with site selection, lease negotiations, and store openings.
Franchisors may also provide central data processing, central purchasing, field training,
inventory control, telephone hotlines, and cooperative advertising (Khan, 1992).
Contracted supports vary more across industries than within industries, which makes
them less useful as predictors of base fees and royalties (Baucus, Baucus, and Human,
1993). The following questions were designed to measure the franchisee’s evaluation of
the franchisor’s support (see Table 4.2).

79
1. The initial training was very useful.
2. The amount of franchise fees/royalties was not high.
3. The promotional and advertising assistance was very good.
4. The on-going service provided by the franchisor is very good.
5. There are few franchisor restrictions.
6. The marketing fees and advertising fees were not too much.
7. My franchisor provides products superior to those available from other
sources.
Source: Adapted from Morrison (1996)
Evaluation of the franchisor’s support was measured on a 7-point Likert-type scale
ranging from (1) = Strongly Disagree to (7) = Strongly Agree
Table 4.2 Evaluation of the Franchisor’s Support Scale
80
4.4.3 Measurement of Brand Name
Rubin (1978) and Lal (1990) have proposed a positive relationship between the
level of goodwill, which, as discussed in an earlier section, is equated with brand name,
and the royalty rate, assuming the creation and maintenance of goodwill to be the sole
responsibility of the franchisor. This is not necessarily the case, since franchisees can
enhance or diminish the stock of goodwill as well (Dant, Kaufmann, and Paswan, 1992).
However, there is considerable theoretical and empirical support for treating goodwill as
an exogenous variable in models of vertical exchange relations in both the industrial
organization (Fershtman and Muller, 1984), and marketing science (Chintagunta and
Jain, 1992) literature. Clearly, the analysis of the relationship between franchisor and
franchisee would benefit from the treatment of goodwill as an exogenous factor.
Therefore, this research could be accomplished by modeling the brand name as an
exogenous variable (impacting the franchisor-franchisee relationship) and examining its
impact on the quality of the relationship between the franchisor and franchisee.
Brand equity arose from customer brand-name awareness, brand loyalty,
perceived brand quality, and favorable brand symbolism and associations that provide
competitive advantage and future earnings streams (Aaker, 1991).
The following questions were designed to measure the franchisee’s perceptions of
brand value (see Table 4.3).
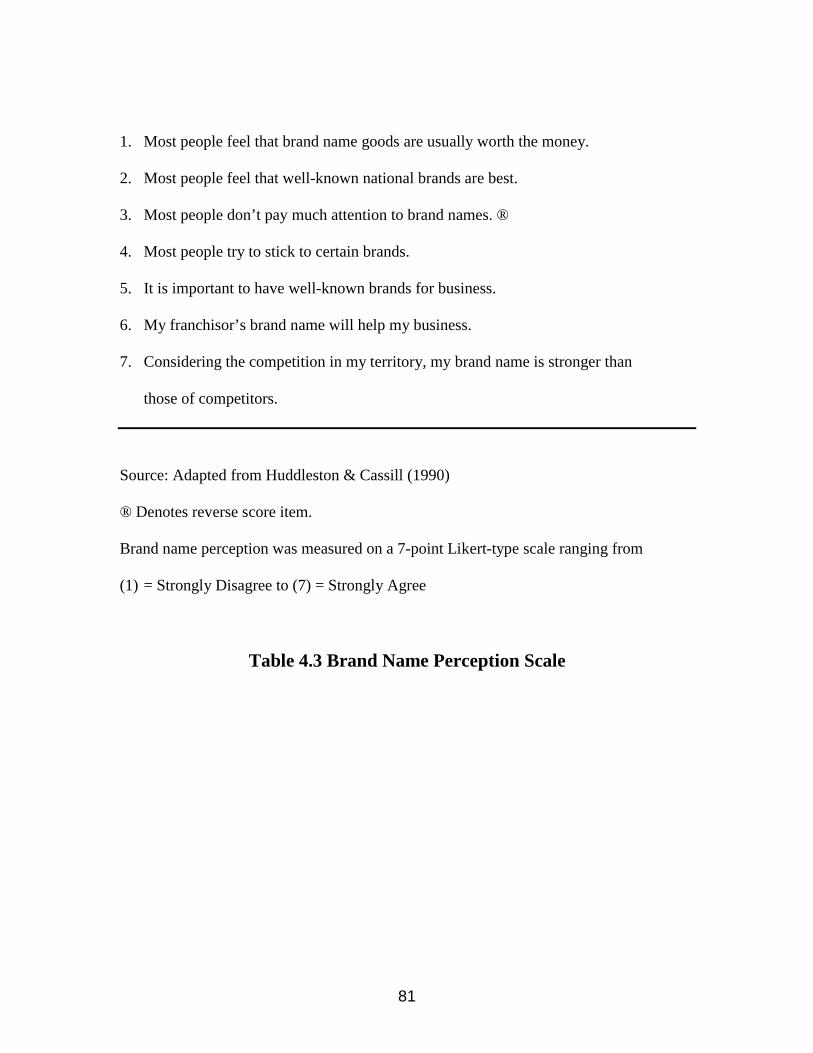
81
1. Most people feel that brand name goods are usually worth the money.
2. Most people feel that well-known national brands are best.
3. Most people don’t pay much attention to brand names. ®
4. Most people try to stick to certain brands.
5. It is important to have well-known brands for business.
6. My franchisor’s brand name will help my business.
7. Considering the competition in my territory, my brand name is stronger than
those of competitors.
Source: Adapted from Huddleston & Cassill (1990)
® Denotes reverse score item.
Brand name perception was measured on a 7-point Likert-type scale ranging from
(1) = Strongly Disagree to (7) = Strongly Agree
Table 4.3 Brand Name Perception Scale

82
4.4.4 Measurement of the Quality of the Relationship
The operationalization of LMX has been developed over several studies. In
Dansereau et al. (1975), two items were used to assess LMX. The measure was extended
to four items (Graen and Schieman, 1978), and then additional items were added (Graen,
Novak, and Sommerkamp, 1982). The questionnaire scale-items used for this study have
been adapted from the most widely used LMX version since 1982 (see Table 4.4).
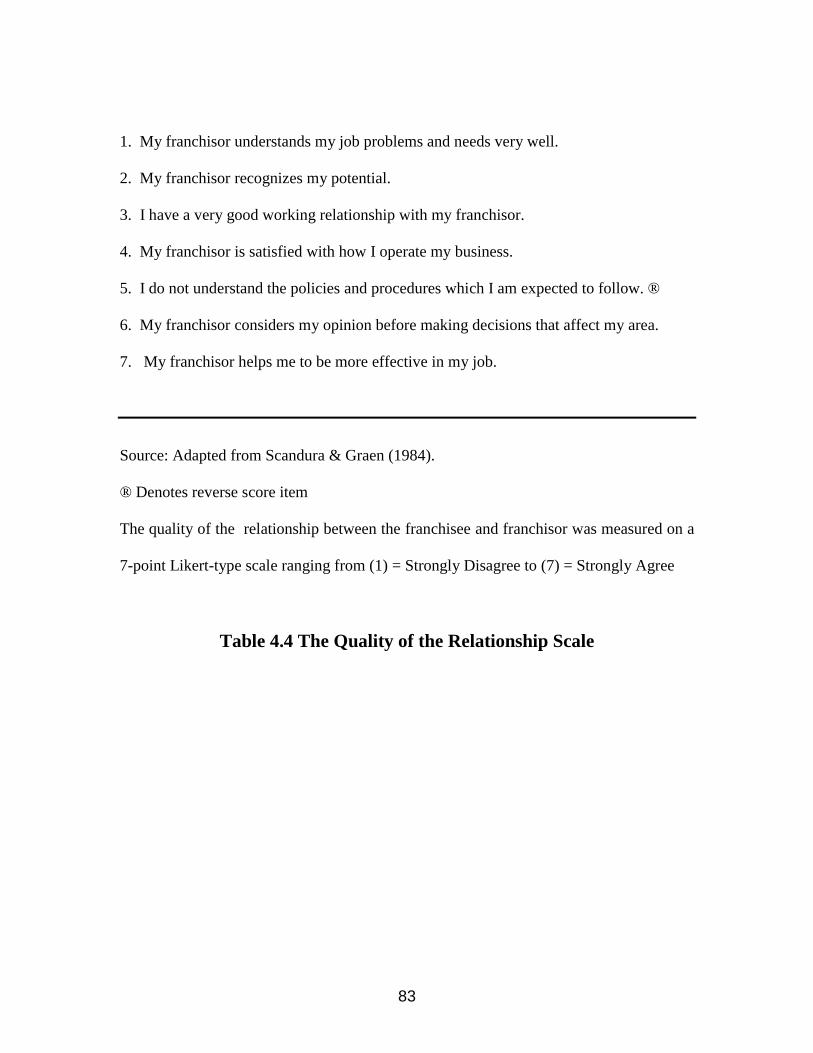
83
1. My franchisor understands my job problems and needs very well.
2. My franchisor recognizes my potential.
3. I have a very good working relationship with my franchisor.
4. My franchisor is satisfied with how I operate my business.
5. I do not understand the policies and procedures which I am expected to follow. ®
6. My franchisor considers my opinion before making decisions that affect my area.
7. My franchisor helps me to be more effective in my job.
Source: Adapted from Scandura & Graen (1984).
® Denotes reverse score item
The quality of the relationship between the franchisee and franchisor was measured on a
7-point Likert-type scale ranging from (1) = Strongly Disagree to (7) = Strongly Agree
Table 4.4 The Quality of the Relationship Scale

84
4.4.5 Measurement of Job Performance
The relationship between LMX and performance has been repeatedly
demonstrated in studies where performance has been measured using supervisors’
subjective ratings (Dansereau et al., 1975; Duarte, Goodson, and Klich, 1994). Positive
relationships between LMX and objective performance have been observed in some
studies (Graen, Novak, and Sommerkamp, 1982; Scandura and Graen, 1984; Duarte et
al., 1994). Morrison (1997) hypothesized that the level of service and support is likely to
be highly correlated with franchisees’ success.
An overall measure of job performance is obtained through self-ratings of
performance, using a 7-point Likert-type scale (see Table 4.5).

85
1. I have been very successful in exceeding my year-to-date sales quota so far.
2. I think that my sales performance so far this year ranks in the top half of all
the restaurant franchisees.
3. My perception is that my sales performance this year to date is below
average relative to other franchisees in my company. ®
4. I am behind in reaching my sales quota thus far this year.
5. The amount of income I actually received from working as a franchisee is at
least what I expected it to be.
6. My franchisor would rate the quality of my performance as very good.
7. I think the quality of my own performance in my job is very good.
® Denotes reverse score item
Franchisee’s performance was measured on a 7-point Likert-type scale ranging from
(1) = Strongly Disagree to (7) = Strongly Agree
Table 4.5 Franchisee’s Performance Scale

86
4.4.6 Measurement of Job Satisfaction
Job satisfaction is measured by the commonly used 20-item short form of the
Minnesota Job Satisfaction Questionnaire (MSQ) described by Weiss et al. (1967). Some
statements were modified to reflect the franchise environment (see Table 4.6).
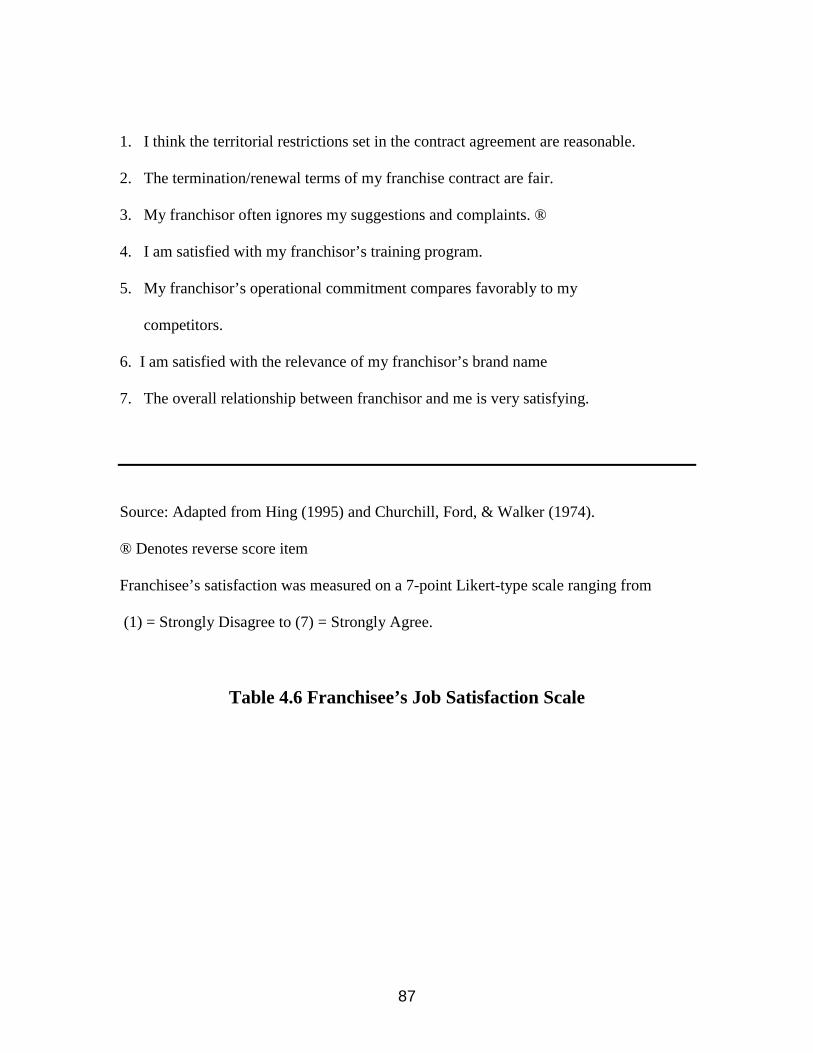
87
1. I think the territorial restrictions set in the contract agreement are reasonable.
2. The termination/renewal terms of my franchise contract are fair.
3. My franchisor often ignores my suggestions and complaints. ®
4. I am satisfied with my franchisor’s training program.
5. My franchisor’s operational commitment compares favorably to my
competitors.
6. I am satisfied with the relevance of my franchisor’s brand name
7. The overall relationship between franchisor and me is very satisfying.
Source: Adapted from Hing (1995) and Churchill, Ford, & Walker (1974).
® Denotes reverse score item
Franchisee’s satisfaction was measured on a 7-point Likert-type scale ranging from
(1) = Strongly Disagree to (7) = Strongly Agree.
Table 4.6 Franchisee’s Job Satisfaction Scale

88
4.4.7 Measurement of Commitment
Commitment, the dependent variable, is defined as a franchisee’s predicting
intention to leave the relationship with overall assessment of worthiness or utility in a
franchisor’s offering, based on what is to be received and what is to be given out.
The relationship between satisfaction and commitment has been consistently
found in many relationship studies. It is apparent that the model of the franchisee’s
commitment process must move beyond satisfaction as the primary explanatory variable.
Organizational commitment was measured by using the 15-item version of the
Organizational Commitment Questionnaire (OCQ) developed by Porter et al., (1974) to
measure the extent to which the individual identifies with organizational goals, is willing
to exert effort on behalf of the organization, and intends to remain or to leave a member
of the organization (Mowday et al., 1982). Statements were modified to reflect the
franchise environment. (See Table 4.7).

89
1. I feel very little loyalty to my franchisor.
2. I would comply with almost any type of request from my franchisor in order to keep
my contract.
3. I am proud to tell others that I am part of this franchise system. ®
4. There is not too much to be gained by sticking with my franchisor indefinitely.
5. Often, I find it difficult to agree with my franchisor’s polices on important matters
relating to its franchisees.
6. I really care about the fate of my franchisor. ®
7. I am willing to put in a great deal of effort beyond that normally expected in order to
help this organization be successful. ®
Source: Adapted from Mowday, Steers, & Porter (1979)
® Denotes reverse score item
Commitment was measured on a 7-point Likert-type scale ranging from
(1) = Strongly Disagree to (7) = Strongly Agree
Table 4.7 Franchisee’s Commitment Scale

90
4.5 Statistical Analysis
Structural equation modeling (SEM) evaluates how well a conceptual model that
includes observed variables and hypothetical constructs fits the obtained data (Hoyle and
Smith, 1994; Hoyle, 1995; Bollen, 1989). A hypothetical construct accounts for the
intercorrelations of the observed variables that define that construct (Bollen and Lennox,
1991).
CALIS generated an estimated matrix, using a hypothesized factor structure
specified by the investigator as a guide. If only small differences were found to exist
between the actual and estimated matrices, then the hypothesized factor structure was
viewed as a plausible one. Unfortunately, there was a lack of consensus regarding how
best to determine when a difference is small. Ideally, this determination should be made
statistically with a chi-square test. However, with large sample sizes it is not very useful
because it has the power to detect nonsubstantive differences between the matrices.
Accordingly, as recommended by Bollen (1989, p. 281), because of distortion in the chi-
square statistic associated with sample sizes (Hayduk, 1987; Jorescog and Sorbom, 1989,
1993a, 1993b, 1996), the fit of the structural equation models was assessed with several
indices, including the goodness-of-fit index (GFI) (Joreskog and Sorbom, 1996), and the
Type 1 and Type 2 normed-fit indices (Muliak, James, Van Alstine, Bennett, Lind and
Stilwell, 1989). The GFI is produced by CALIS as an estimate of the overall fit of a
model. It most closely approximates a coefficient of determination with a value of 1.00
indicating a perfect fit (Muliak et al., 1989). Like chi-square, it is sensitive to sample size
and to the number of model parameters estimated, and it should be interpreted with this in

91
mind. The normed-fit index (NFI) can be interpreted as “the proportion in reduction in
lack of fit between the null and saturated models achieved by the intermediate model’s
fixing fewer and estimating more parameters” (Muliak et al., 1989, p. 433). The NFI is
also sensitive to variations in sample size (Marsh, Balla and McDonald, 1988). Type 2,
or adjusted normed-fit indices have been developed to correct for these sample size based
distortions. Type 2 NFI is interpreted in the same way as the Type 1 NFI with value of
.90 or greater indicating that the fit cannot be improved meaningfully by increasing the
number of parameters estimated in the model (Bentler and Bonet, 1980). Several fit
measures are reported on in this study: the normed fit index (NFI), the nonnormed fit
index (NNFI), the comparative fit index (CFI; Bentler, 1989), the goodness-of-fit index
(GFI), the adjust goodness-of-fit index (AGFI), and the root-mean-square residual
(RMSR; Joreskog and Sorbom, 1989).
The hypotheses were tested using CALIS (Covariance Analysis of Linear
Structural equation). The model designed for this study, shown in Figure 2 on page 195,
is a causal model. Cause-effect relations have been proposed based on prior empirical
research and theory. However, the set of variables were collected at one point in time. In
order to test the causal assumptions, the equations implied by the arrows were solved,
thereby yielding estimates of the magnitudes of the linkages shown. The exogenous
variables are motivation, evaluation, and brand name. The endogenous variables are the
quality of the relationship, performance, job satisfaction, and commitment. As shown in
Figure 1 on page 196, gamma (γ ) is used to indicate a structural coefficient of a causal
relationship between an exogenous variable and an endogenous variable. Beta (β) is used
to indicate a structural coefficient of a causal relationship between two endogenous

92
variables. The amount of shared variances contributions is estimated by the Phi (φ)
parameters.
The hypotheses tested using CALIS are as follows:
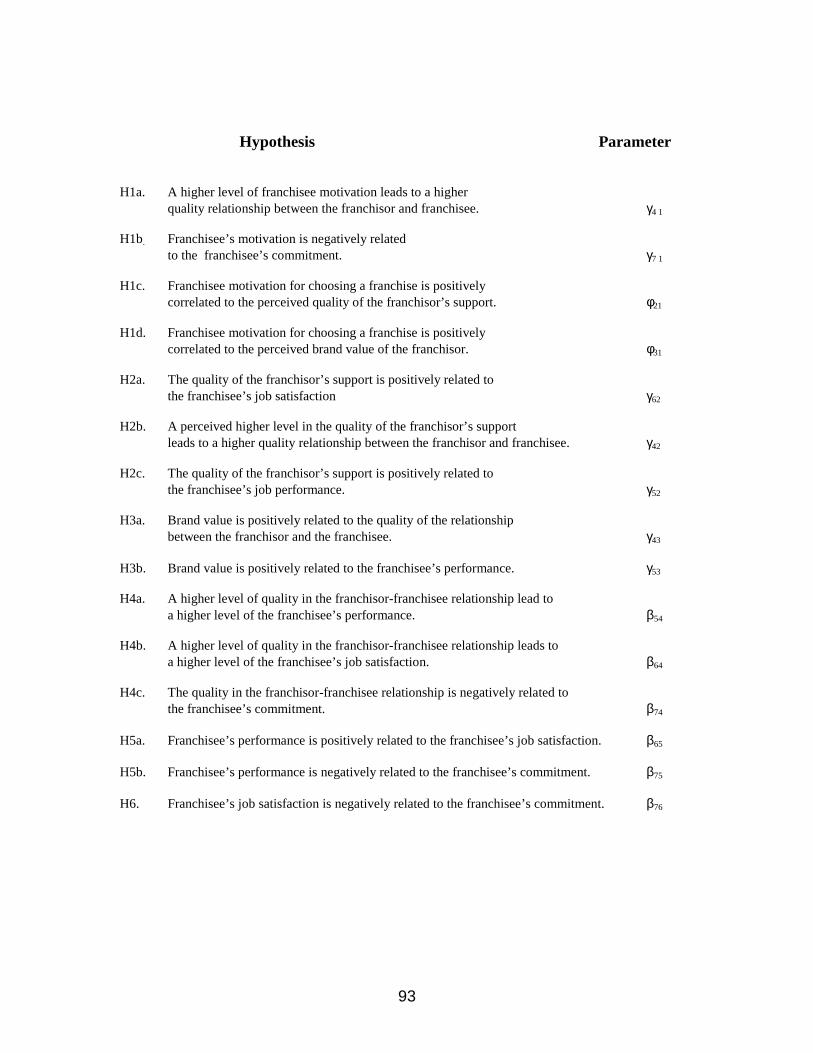
93
Hypothesis Parameter
H1a. A higher level of franchisee motivation leads to a higherquality relationship between the franchisor and franchisee. γ4 1
H1b. Franchisee’s motivation is negatively relatedto the franchisee’s commitment. γ7 1
H1c. Franchisee motivation for choosing a franchise is positivelycorrelated to the perceived quality of the franchisor’s support. φ21
H1d. Franchisee motivation for choosing a franchise is positivelycorrelated to the perceived brand value of the franchisor. φ31
H2a. The quality of the franchisor’s support is positively related tothe franchisee’s job satisfaction γ62
H2b. A perceived higher level in the quality of the franchisor’s supportleads to a higher quality relationship between the franchisor and franchisee. γ42
H2c. The quality of the franchisor’s support is positively related tothe franchisee’s job performance. γ52
H3a. Brand value is positively related to the quality of the relationshipbetween the franchisor and the franchisee. γ43
H3b. Brand value is positively related to the franchisee’s performance. γ53
H4a. A higher level of quality in the franchisor-franchisee relationship lead toa higher level of the franchisee’s performance. β54
H4b. A higher level of quality in the franchisor-franchisee relationship leads toa higher level of the franchisee’s job satisfaction. β64
H4c. The quality in the franchisor-franchisee relationship is negatively related tothe franchisee’s commitment. β74
H5a. Franchisee’s performance is positively related to the franchisee’s job satisfaction. β65
H5b. Franchisee’s performance is negatively related to the franchisee’s commitment. β75
H6. Franchisee’s job satisfaction is negatively related to the franchisee’s commitment.β76

94
4.6 Summary
This chapter first introduces the research hypotheses that guide the study. The
second section presents the methodology used to gather samples and the data collection
procedures. The third section presents measurement methods used in the study. Finally,
the statistical analysis technique is illustrated, with a primary focus on the structural
equation modeling used to test the theoretical model. The results of the hypothesis testing
are presented in the next chapter.
95
CHAPTER 5
RESULTS
The purpose of this chapter is to present a description of the respondents and the
results of the analyses (scale development as well as model testing). Profiles of the
franchisees participating in this survey are reported in the first section of this chapter.
Next, the empirical portion of the scale developed for the measures of each variable is
presented. This is followed by a discussion of the reliability and validity of the measures
used in this research. Finally, the results of the structural model with the hypotheses and
the theoretical model are examined and the final model is provided with the analysis of
the direct and total effects using CALIS procedure (SAS Institute Inc, 1989).
5.1 Profile of the Sample
Because the primary focus of the study is an investigation of factors affecting the
quality of the relationship between franchisees and franchisors, the objective was to
collect data in the sector of the restaurant industry where there was a franchisee-
franchisor relationship. Participants were sampled from franchisees operating franchise
restaurants. The data for this study were collected through a mail survey of 2,797
franchisees. The list of franchisees was randomly generated by the membership list of the
International Franchise Association. Participants were sent a research packet with a cover

96
letter explaining that the nature of the study was to examine the franchisee-franchisor
relationship. There were 217 research packets returned, yielding a participation rate for
the study of 7.8 percent (Table 5.1). The sample for this study included 210 usable
questionnaires returned to the university in a postage-paid envelope, and that had
complete data on all questions. The respondents consisted of 164 men (78.1%) and 46
women (21.9 %). Their average franchisee experience was 11.04 years. Approximately
5.7 % of the respondents were of the ages 20 to 30; 25.5 % were of the ages 31 to 40;
32.9 % were of the ages 41 to 50; 25.2 % were of the ages 51 to 60; and 11.0 % were
over 60. The sample was primarily white (84.3%) and male (78.1%). Approximately 95%
of the participants were experienced in the restaurant industry before joining the
franchise system. Seven questionnaires were returned blank or otherwise unusable and
were not included in any analyses.

97
Table 5.1
The Sample Characteristics
State Percentage of SampleCA 13.3 % (28)VA 8.0 % (17)KY 5.7 % (12)MI 5.2 % (11)GA 4.8 % (10)TN 4.8 % (10)DC 3.8 % (8)PA 3.8 % (8)IN 3.3 % (7)NY 3.3 % (7)WA 3.3 % (7)OR 2.9 % (6)TX 2.9 % (6)FL 2.4 % (5)LA 2.4 % (5)NC 2.4 % (5)NJ 2.4 % (5)OH 2.4 % (5)SC 2.4 % (5)AZ 1.9 % (4)CO 1.9 % (4)MA 1.9 % (4)AL 1.4 % (3)IA 1.4 % (3)Others 11.9 % (25)
Age20 –30 5.7 %31 – 40 25.5 %41 – 50 32.9 %51 – 60 25.2 %60 Over 11.0 %
GenderMale 78.1 %Female 21.9 %
EthnicCaucasian 84.3 %African American 1.9 %Hispanic 1.9 %Asian 10.5 %Pacific Islander 0.0 %Others 1.4 %
Average Relationship Length with this Franchisor 11.04 Years
98
5.2 Descriptive Statistics
Covariance was computed for all observed variables (see Appendix B, p. 203).
Furthermore, the values of skewness and kurtosis were computed for all measured
variables, as the assumption of multivariate normality is a prerequisite to a robust SEM
(Bollen and Long, 1994). Cronbach (1951) alpha was computed to examine the internal
consistency of the items comprising the theory of reasoned action. Descriptive analysis,
internal consistency analyses, and further analyses for evaluating the construct validity of
the theory of reasoned action were conducted with structural equation modeling using
CALIS (SAS Institute Inc, 1989). An examination of the distribution properties of all
items was conducted in order to ascertain possible deviations from multivariate normality
(see Table 5.2). Analysis indicated that the values of kurtosis and skewness were
minimal, thus allowing for the use of Maximum Likelihood procedures. The values of the
mean scaled univariate kurtosis was –.0259 . Skewness values ranged between -1.19 and
1.26. The internal consistency of the items which comprised the theory of reasoned action
produced an alpha range from .737 to .888 (see Table 5.4 – 5.10), indicating strong
relationships among the variables. Internal consistency is the extent to which the
individual items that constitute a test correlate with one another or with the test total
(Hatcher, 1994). In the social sciences, one of the most widely used indices of internal
consistency reliability is coefficient alpha (Cronbach, 1951). A widely used rule of thumb
of .70 has been suggested by Nunnally (1978). However, Hatcher (1994) argued that this
is only a rule of thumb, and the social science literature does sometimes report studies

99
employing variables with coefficient alpha reliabilities under .70, and sometimes even
under .60.
Table 5.3 shows the mean scores of the all items on each of the seven franchisor-
franchisee relationship scales with standard deviations. The univariate analysis revealed
that the magnitude of the franchisee’s attitude about the franchise system he/she is
currently involved. For example, Q1, “Franchising is in an industry that I believed had a
good growth potential”, has the mean value of 5.70 with a standard deviation of 1.42,
indicating that many franchisees strongly believe in the growth of the franchising and
high levels of agreement among the sample respondents. The rest of the table can be
interpreted the same way.
Non-Response Bias
According to Armstrong and Overton (1977), possible non-response biases were
addressed by comparing the responses of the early respondents to those of the late
respondents. Such comparisons are often similar and are commonly used for testing.
Early responses (N=40) were received on February 24 and March 3, 1999. Late responses
(N=40) were received between April 1 and April 10, 1999. Appendix B (p. 205) shows
comparisons between the early responses and late responses on selected demographic and
behavior variables. T-tests done on twelve-selected behavior variables for the twelve
groups showed the groups were not significantly different. The chi-square tests
performed on the two groups showed no significant difference for age and gender
variable. Chi-square and t tests performed revealed that the two groups were not
significantly different, thereby addressing the non-response bias.

100
Table 5.2
&RYDU&RYDULLDQFH 6WUXDQFH 6WUXFFWXUH $QDWXUH $QDOO\VLV\VLV�� 0D0D[[LPXP /LNHLPXP /LNHOOLKRLKRRRG (VG (VWWLPDLPDWWLRQLRQ
''LLVWULEVWULEXXWLRQ RIWLRQ RI $$VV\PSW\PSWRRWLFDWLFDOOO\ 6O\ 6WWDQGDUDQGDUGGL]HG 5HVLL]HG 5HVLGGXDOVXDOV
�(DF�(DFKK U UHHSUHVSUHVHHQWV �QWV � UHVLUHVLGGXDOV�XDOV�
�������� � �������� � ����� _
�������� � �������� � ����� _
�������� � �������� � ����� _
�������� � �������� � ����� _
�������� � �������� � ����� _
�������� � �������� � ����� _
�������� � �������� � ����� _
�������� � �������� � ����� _
�������� � �������� � ����� _
�������� � �������� � ����� _
�������� � �������� � ����� _
�������� � �������� � ����� _
�������� � �������� � ����� _
�������� � �������� � ����� _
�������� � �������� �� ����� _
�������� � �������� � ����� _
�������� � �������� �� ����� _
�������� � �������� �� ����� _
�������� � � �� ����� _
� � ������� �� ������ _
������� � ������� �� ����� _
������� � ������� �� ����� _
������� � ������� �� ����� _
������� � ������� � ����� _
������� � ������� � ����� _
������� � ������� � ����� _
������� � ������� � ����� _
������� � ������� � ����� _
������� � ������� � ����� _
������� � ������� � ����� _
������� � ������� � ����� _
������� � ������� � ����� _
������� � ������� � ����� _
������� � ������� � ����� _
������� � ������� � ����� _
������� � ������� � ����� _
������� � ������� � ����� _
������� � ������� � ����� _
������� � ������� � ����� _
������� � ������� � ����� _
������� � ������� � ����� _
������� � ������� � ����� _

101
Table 5.3 Mean and Standard Deviation of Items
9DULDEOH 1 0HDQ 6WG 'HY 0LQLPXP 0D[LPXP
���������������������������������������������������������������������
4� ��� ��������� ��������� ��������� ���������
4� ��� ��������� ��������� ��������� ���������
4� ��� ��������� ��������� ��������� ���������
4� ��� ��������� ��������� ��������� ���������
4� ��� ��������� ��������� ��������� ���������
4� ��� ��������� ��������� ��������� ���������
4� ��� ��������� ��������� ��������� ���������
4� ��� ��������� ��������� ��������� ���������
4� ��� ��������� ��������� ��������� ���������
4�� ��� ��������� ��������� ��������� ���������
4�� ��� ��������� ��������� ��������� ���������
4�� ��� ��������� ��������� ��������� ���������
4�� ��� ��������� ��������� ��������� ���������
4�� ��� ��������� ��������� ��������� ���������
4�� ��� ��������� ��������� ��������� ���������
4�� ��� ��������� ��������� ��������� ���������
4�� ��� ��������� ��������� ��������� ���������
4�� ��� ��������� ��������� ��������� ���������
4�� ��� ��������� ��������� ��������� ���������
4�� ��� ��������� ��������� ��������� ���������
4�� ��� ��������� ��������� ��������� ���������
4�� ��� ��������� ��������� ��������� ���������
4�� ��� ��������� ��������� ��������� ���������
4�� ��� ��������� ��������� ��������� ���������
4�� ��� ��������� ��������� ��������� ���������
4�� ��� ��������� ��������� ��������� ���������
4�� ��� ��������� ��������� ��������� ���������
4�� ��� ��������� ��������� ��������� ���������
4�� ��� ��������� ��������� ��������� ���������
4�� ��� ��������� ��������� ��������� ���������
4�� ��� ��������� ��������� ��������� ���������
4�� ��� ��������� ��������� ��������� ���������
4�� ��� ��������� ��������� ��������� ���������
4�� ��� ��������� ��������� ��������� ���������
4�� ��� ��������� ��������� ��������� ���������
4�� ��� ��������� ��������� ��������� ���������
4�� ��� ��������� ��������� ��������� ���������
4�� ��� ��������� ��������� ��������� ���������
4�� ��� ��������� ��������� ��������� ���������
4�� ��� ��������� ��������� ��������� ���������
4�� ��� ��������� ��������� ��������� ���������
4�� ��� ��������� ��������� ��������� ���������
4�� ��� ��������� ��������� ��������� ���������
4�� ��� ��������� ��������� ��������� ���������
4�� ��� ��������� ��������� ��������� ���������
4�� ��� ��������� ��������� ��������� ���������
4�� ��� ��������� ��������� ��������� ���������
4�� ��� ��������� ��������� ��������� ���������
4�� ��� ��������� ��������� ��������� ���������
/(1*7+ ��� ���������� ��������� ��������� ����������
���������������������������������������������������������������������
102
5.3 Measurement Model
The measurement model describes the relationships between the latent factors and
their indicator variables. Confirmatory Factor Analysis (CFA) was used to test the
adequacy of the current study’s measurement model before conducting tests of the
structural models. Anderson and Gerbing (1988) argued that confirmatory measurement
models should be estimated and, if necessary, respecified before the simultaneous
examination of measurement and structure models.
The analysis followed a two-step procedure based in part on an approach
recommended by Anderson and Gerbing (1988). In the first step, confirmatory factor
analysis was used to develop a measurement model that demonstrated an acceptable fit to
the data. In step two, the measurement model was modified so that it came to represent
the theoretical (causal) model of interest. This theoretical model was then tested and
revised until a theoretically meaningful and statistically acceptable model was found.
In designing a study, great care should be used in deciding the indicator variables
that will measure each latent variable. In many studies, indicator variables are the
composite scores of standardized tests using carefully developed scales that assess
attitudes or beliefs (Hatcher, 1994), such as the Job Descriptive Index, a measure of job
satisfaction (Smith, Kendall, and Hulin, 1969).
The CALIS program was used in the present study to estimate the parameters of
the measurement model; The CALIS program was also used for the later simultaneous
estimation of measurement and structural models. The full CFA measurement model
consisted of 7 latent variables or constructs and 21 manifest or observed variables

103
(composite scores). Covariance matrices were analyzed, and maximum likelihood (ML)
was the estimation method. The adequacy of the model fit was determined by using the
chi-square test, the χ2/df ratio, the NFI, the GFI, and the CFI. Fit statistics are the central
means through which alternative factor structures are compared. There are numerous
statistics that can be used to describe a model’s fit to the data. The most widely used
measure of fit is χ2. Significant χ2 statistics suggest that the model does not adequately fit
the data. However, it is widely recognized that χ2 depends on the sample size, and
therefore even excellently fitting models will produce a significant χ2 when the sample
size is large (Harvey et al., 1985; Hu and Bentler, 1995).
Typically, researchers seek a nonsignificant chi-square to indicate no significant
difference between the hypothesized model and the observed data. However, the chi-
square statistic is affected by sample size, and some of the underlying assumptions
regarding the statistic may be invalid (Bentler, 1990; Bentler and Chou, 1987). Although
strict guidelines for minimum sample sizes do not exist, Bentler (1985, 1992) suggested
that a sample size to parameter ratio of 5 or more is sufficient to achieve reliable
estimates in maximum likelihood estimation.
Therefore, other indexes of fit should be examined. The GFI indicates the amount
of variance and covariance explained by the model, with values closer to one indicating a
better fit. The χ2/df ratio adjusts the chi-square test to control for the sample size, and
values exceeding two suggest poorer fitting models (Byrne, 1989). The CFI yields an
index of model fit that mathematically compares the theoretical model with a null, poorly
fitting model. The CFI can range from zero to one, with values closer to one again
indicating better fitting models. A problem with GFI is that it, like χ2, may depend on the

104
sample size. Accordingly, researchers have suggested alternative fit statistics that depend
less on model fit (Marsh, Balla, and McDonald, 1988), Four of these fit statistics were
used in this study. These are the normed fit index and non-normed fit index (NFI and
NNFI; Bentler and Bonnett, 1980), the comparative fit index (CFI; Bentler, 1990), and
the goodness-of-fit index (GFI; Joreskog and Sorbom, 1993a). As with the GFI, levels
above .90 for these statistics imply adequate fit. The fit statistics reported include the four
basic types of statistics recently reviewed by Hu and Bentler (1995).
Confirmatory factor analysis involves the specification and estimation of one or
more putative models of factor structure, each of which process a set of latent variables
(factors) to account for covariance among a set of observed variables. CALIS (SAS
Institute Inc., 1989) is used to describe alternative models and to test the fit of each
hypothesized model against the sample data.

105
5.3.1 Partial Confirmatory Factor Analysis
To refine the initial measures and test for the internal consistency of the scale, a
combination of exploratory factor analysis, confirmatory factor analysis (each construct
individually) and item-to-total correlations were used. Based on the results of these
analyses, those items that had low item-to-total correlations were dropped, as well as the
items that had low factor loadings or loadings on multiple factors. With exploratory
factor analysis, for the each of the constructs (motivation, evaluation, brand name, the
quality of the relationship, performance, job satisfaction, and commitment), First-order
confirmatory factor models were tested, where every item was restricted to load its a
priori specified factors. The confirmatory factor analysis was estimated by the maximum
likelihood (ML) procedure. In all these models, the cogeneric items loaded significantly
on their prespecified factors; none of the measurement errors were correlated, and
goodness-of-fit measures indicated the adequacy of the model fit. This provided evidence
of construct unidimensionality. The initial analyses suggested 7 items with low factor
loading (below .50) that were dropped from further analyses (see Table 5.4 – 5.10). Most
loadings exceeded .5, and each indicator t-value exceeded 6.0 (p < .001). Coefficient α
exceeded .70 for each scale.
Confirmatory Factor Analysis for Motivation
The exploratory factor analysis for the motivation construct led to one factor
model. The measurement model is a single factor model comprised of seven indicators.
Table 5.4 presents the results of the confirmatory factor analysis for the motivation
construct, including factor loading, t value, and fit statistics. Although the chi-square test

106
was significant, other fit indices indicated an acceptable fit with the data (GFI = .906;
CFI = .851; NFI = .834). Standardized loading estimates ranged from .509 to .746, with
all t values significant at p < .001. Summated scores of the multi-item scales were used to
address the reach questions. The Cronbach’s alpha coefficient was .797.
Confirmatory Factor Analysis for Evaluation
The one-factor initial measurement was confirmed by exploratory factor analysis.
The chi-square test was also significant, but the remaining fit statistics indicated an
acceptable fit (GFI = .930; CFI = .888; NFI = .868). Standardized loading estimates
ranged from .498 to .855, with all t values significant at p < .001. The Cronbach’s alpha
coefficient was .788.

107
Table 5.4 Factor Loading for Motivation
Item Standardized Indicator
Loading Reliabilities t Valuea
Q1 .509 .259 7.15Q2 .746 .557 11.41Q3 .538 .289 7.62Q4 .575 .331 8.24Q5 .706 .498 10.63Q6 dropQ7 .708 .501 10.68
Note: aAll t tests were significant at p < .001. Coefficient α = .797
Table 5.5 Factor Loading for Evaluation
Item Standardized Indicator
Loading Reliabilities t Valuea
Q8 .465 .216 6.58Q9 .490 .240 6.96Q10 .748 .560 11.64Q11 .855 .731 13.85Q12 .552 .305 7.99Q13 .604 .365 8.91Q14 drop
Note: aAll t tests were significant at p < .001. Coefficient α = .789

108
Confirmatory Factor Analysis for Brand Name
The one-factor initial measurement was confirmed by exploratory factor analysis.
The goodness of fit index (GFI) was .952; the comparative fit index (CFI) was .954; the
normed fit index was .936 (see Table 5.6). Standardized loading estimates ranged from
.587 to .781, with all t value being significant at p < .001. The Cronbach’s alpha
coefficient was .843.
Confirmatory Factor Analysis for the Quality of the Relationship
Exploratory factor analysis of the brand name items was conducted to verify the
one-factor model. The measurement model is a single factor model comprised of six
indicators. Table 5.7 presents the results of the confirmatory factor analysis for the
quality of the relationship construct, including factor loading, t value, and fit statistics.
Although the chi-square test was significant, other fit indices indicated a good fit with the
data (GFI = .916 CFI = .936, NFI = .925). Standardized loading estimates ranged from
.577 to .853, with all t values significant at p < .001. The Cronbach’s alpha coefficient
was .887.
Confirmatory Factor Analysis for Performance
The one-factor initial measurement was confirmed by exploratory factor analysis.
The chi-square test was significant, but the remaining fit statistics indicated a good fit
(GFI = .943; CFI = .909; NFI = .899). Standardized loading estimates ranged from .521
to .777, with all t values significant at p < .001. The Cronbach’s alpha coefficient was
.826.

109
Table 5.6 Factor Loading for Brand Name
Item Standardized Indicator
Loading Reliabilities t Valuea
Q15 .780 .608 12.56Q16 .712 .507 11.08Q17 .587 .345 8.67Q18 .613 .325 9.14Q19 .751 .376 11.92Q20 .682 .465 10.74Q21 drop
Note: aAll t tests were significant at p < .001. Coefficient α = .842
Table 5.7 Factor Loading for the Quality of the Relationship
Item Standardized Indicator
Loading Reliabilities t Valuea
Q22 .853 .728 14.91Q23 .814 .663 13.89Q24 .839 .704 14.56Q25 .577 .333 8.77Q26 dropQ27 .633 .401 9.83Q28 .804 .646 13.54
Note: aAll t tests were significant at p < .001. Coefficient α = .888
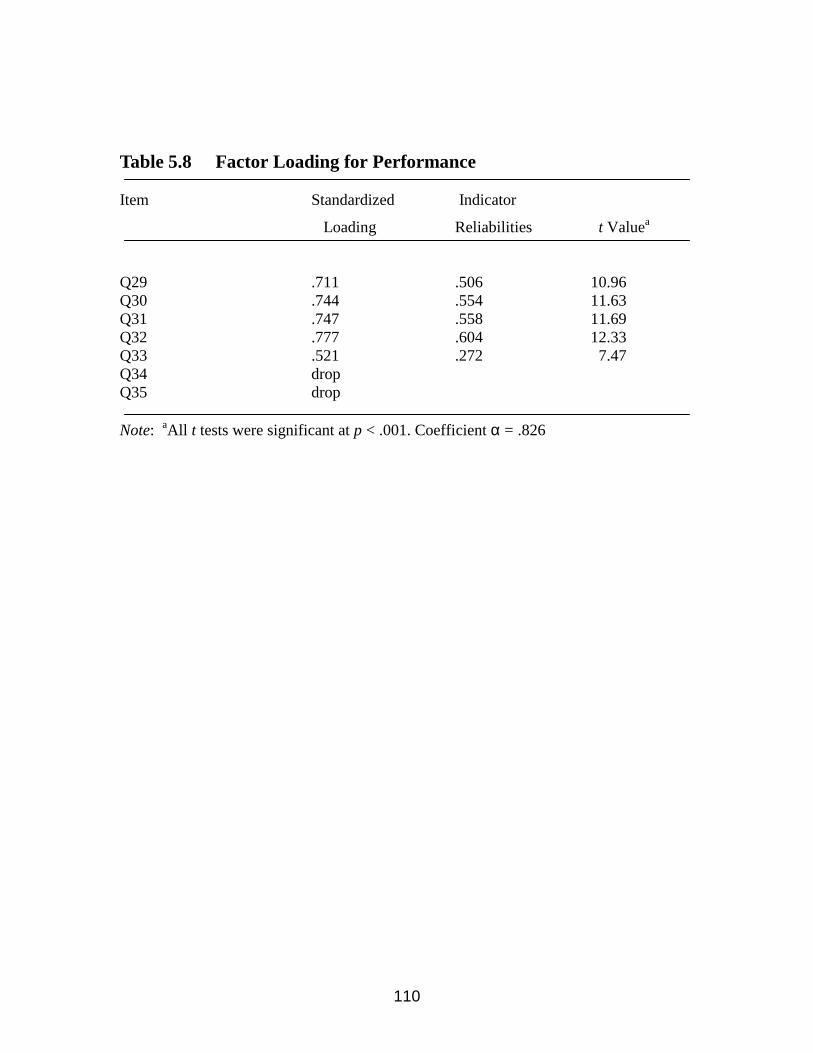
110
Table 5.8 Factor Loading for Performance
Item Standardized Indicator
Loading Reliabilities t Valuea
Q29 .711 .506 10.96Q30 .744 .554 11.63Q31 .747 .558 11.69Q32 .777 .604 12.33Q33 .521 .272 7.47Q34 dropQ35 drop
Note: aAll t tests were significant at p < .001. Coefficient α = .826

111
Confirmatory Factor Analysis for Satisfaction
The results of the exploratory factor analysis reported a one-factor model of the
satisfaction construct. Table 5.9 presents the results of confirmatory factor analysis for
job satisfaction. Again, the chi-square test was significant, but the remaining fit indices
indicated an acceptable fit with the data (GFI = .902; CFI = .834; NFI = .809).
Standardized loading estimates range from .492 to .781, with all t values being significant
at p < .001. The Cronbach’s alpha coefficient was .790.
Confirmatory Factor Analysis for Commitment
The results of the exploratory factor analysis reported a one-factor model of
commitment. The initial measurement did not fit the data well. After reviewing the
modification indices, three items were dropped from the measurement model. The overall
fit of the revised model was confirmed with a goodness-of-fit index of .961, a
comparative fit index of .925, and a normed fit index of .918. All these indices provided a
strong indication of good model fit (see Table 5.10). The Cronbach’s alpha coefficient
was .737.
.

112
Table 5.9 Factor Loading for Satisfaction
Item Standardized Indicator
Loading Reliabilities t Valuea
Q36 .515 .265 7.25Q37 .592 .351 8.53Q38 .564 .318 8.06Q39 .532 .283 7.53Q40 .687 .472 10.27Q41 .492 .242 6.87Q42 .781 .610 12.10
Note: aAll t tests were significant at p < .001. Coefficient α = .790
Table 5.10 Factor Loading for Commitment
Item Standardized Indicator
Loading Reliabilities t Valuea
Q43 dropQ44 dropQ45 .939 .882 13.22Q46 .495 .245 6.98Q47 .516 .266 7.28Q48 .620 .384 8.79Q49 drop
Note: aAll t tests were significant at p < .001. Coefficient α = .737
113
5.3.2 Confirmatory Factor Analysis
A confirmatory factor analysis (CFA) model is a structural measurement
formulation in which latent constructs are assumed to have generated the relations among
observed variables. The procedure is designed to test a priori hypotheses of specific
relations between the latent constructs and the observed variables.
In this study, a seven-factor model of franchisee-franchisor relationship was
specified a priori. The recommended procedure was followed, of forming subscales of
items that comprise factors when the number of factors is small relative to the number of
observed variables (Takahashi and Nasser, 1996; Russell, Kahn, Spoth, and Altmaier,
1998). Using this item-parceling procedure, items are summed to form a smaller set of
items that purportedly measure the same construct. An obvious advantage of item parcels
is that fewer parameters need to be estimated, and that the estimates will be more stable
in small samples (Marsh et al., 1988). The covariance matrices for the 21 aggregate
variables are presented in the Appendix B (see p. 203).
The measurement model describes the nature of the relationship between (a) a
number of latent variables, or factors, and (b) the manifest indicator variables that
measure those latent variables. The model investigated in this study consisted of seven
latent variables corresponding to the seven constructs of the franchisee-franchisor
relationship model: motivation, evaluation, brand name, the quality of the relationship,
performance, satisfaction, and commitment. Each of the seven latent variables was
measured by at least three manifest indicator variables.
This study follows Bentler’s (1989) convention of identifying latent variables
with the letter “F” (for Factor), and labelling manifest variables with the letter “V” (for
114
Variables). Figure 5.1 uses these conventions in identifying the seven constructs
investigated in this study, as well as the indicators that measure these constructs. The
figure shows that the motivation construct (F1) is measured by manifest variables V1
through V3; the evaluation construct (F2) is measured by manifest variables V4 through
V6, and so forth.
The measurement model assessed in the first stages of this analysis was not
identical to the model in Figure 5.1, because the model in that figure posits certain
unidirectional causal relationships between the latent constructs. The measurement
model, on the other hand, posits no unidirectional paths between latent variables. Instead,
in a measurement model, a covariance is estimated to connect each latent variable with
every other latent variable. In a figure, this would be indicated by a curved, two-headed
arrow connecting each F variable to every other F variables. In other words, a
measurement model is equivalent to a confirmatory factor analysis model in which each
latent construct is allowed to covary with every other latent construct.
The measurement model was estimated using the maximum likelihood method,
and the chi-square value for the model was significant, χ2 (168, N = 210) = 429.39, p <
.001. Technically, when the proper assumptions are met, these chi-square statistics may
be used to test the null hypothesis that the model fits the data. In practice, however, the
statistics are very sensitive to sample size and departures from multivariate normality,
and will very often result in the rejection of a well-fitting model. For this reason, it has
been recommended that the model chi-square statistics be used as a goodness of fit index,
with a smaller chi-square value (relative to the degree of freedom) indicative of a better
model fit (Joreskog and Sorbom, 1989).

115
Table 5.12 gives the standardized pattern coefficients, the t-values, the indicators’
reliabilities, and the construct reliabilities useful for assessing the quality of the
measurement model. Overall, measurement quality was assessed using confirmatory
factor analysis (Gerbing and Anderson, 1992). The overall fit supports the measurement
model. The χ2 fit statistic was 429.39 with 168 degree of freedom ( p < .001); the root
mean squared error of approximation (RMSEA) was .087; the comparative fit index (CFI
) was .886; the goodness-of-fit index (GFI) was .841, the normed fit index (NFI) was
.838, the non-normed fit index is .857, and the χ2/df ratio is 2.55. Although the chi-square
statistic is significant, the measurement model was deemed acceptable, given the other
supportive indices (Anderson and Gerbing, 1988). Many researcher interpret GFI or
AGFI scores in the .80 to .89 ranges as representing reasonable fit; scores of .90 or higher
are considered evidence of good fit (Doll et al., 1995).
Table 5.13 shows the overall fit indices for the various factor models using the
entire sample (N = 210). As one progresses from the most restricted model (one general
factor) to the least restricted model (seven oblique factors), all of the indices show
incremental improvements in overall fit. The gains are largest when moving from the one
general factor model to the seven-factor (covary) model representation. Increases in
certain indexes (e.g., GFI, CFI, NFI, and NNFI) are particularly notable because these do
not necessarily increase with a less restricted nested model.
Goodness of fit indices for the measurement model are presented in Table 5. 13.
This table shows that recommended alternatives to chi-square include the comparative fit
index (CFI; Bentler, 1990), the goodness of fit index (GFI; Joreskog and Sorbom, 1993),
and the root mean square error of approximation (RMSEA; Hair et al., 1995). The CFI
116
assess the comparative reduction in noncentrality proposed by the hypothesized model,
particularly in terms of the percentage of variance in the covariance matrix accounted for
by the measurement model. The CFI constraint observed values in the range (0, 1), with
higher values indicating better model fit (Bentler, 1992). The RMSEA is an average
difference per degree of freedom expected to occur in the population (Hair et al., 1995),
with lower values indicating a better model fit (Pedhazur and Schmelkin, 1991).
Although the GFI tends to favor more complex models (i.e., those with more
parameters to be estimated), the CFI does not penalize for the parsimoniousness of a
model, and the NFI is an index of the fit between a saturated model and a null model (i.e.,
a restricted model against which other less restricted models are compared in a nested
sequence of models) (Mulaik et al., 1989). The CFI has been found to be unaffected by
sample size (Bentler, 1990; Marsh et al., 1988). Given the differences in parsimony of the
a priori and respecified models, the CFI can ensure that conclusions were not biased in
favor of more saturated models, and the NFI represents the difference in lack of fit
between saturated and null models (Mulaik et al., 1989).
For the measurement model, Day et al. (1998) suggested that the adjusted indices
are PFI = .855, CFI = .855, RMSR = .16. A reasonably successful fit to the data was
found. . As fit indices, the chi-square statistic (and associated p value), the goodness-of-
fit index (GFI; Joreskog and Sorbom, 1989), the normed-fit index (NFI; Bentler and
Bonett, 1980), the non-normed fit index (NNFI; Bentler and Bonett, 1980), and the
comparative fit index (CFI; Bentler, 1990) were examined. However, the properties of
these indices varied along several dimensions, which is why several were examined.

117
The psychometric properties of the latent constructs were examined individually
through estimates of composite reliability and variance extracted. These estimates (Table
5.12) are based on the standardized parameter estimates from the measurement model.
The motivation, evaluation, brand name, quality of the relationship, performance,
satisfaction, and commitment constructs all have estimated composite reliabilities above
.70 and variance extracted estimates above .50, indicating both good internal consistency
and that the variance captured by each construct is larger than the variance due to
measurement error (Fornell and Larcker, 1981). The variance extracted estimates of the
evaluation, brand name, quality of the Relationship, performance, and job satisfaction
constructs demonstrated acceptable reliabilities (.530, .618, .586, .535, and .510,
respectively), but less satisfactory motivation and commitment estimates (.487 and .488,
respectively). Fornell and Larcker (1981) point out, however, that the variance-extracted
statistic is a more conservative estimate than is composite reliability. As such, an
argument could be made for the acceptable psychometric properties of each respective
latent construct, especially for research purposes.

118
Table 5.11Information Needed to Compute Composite Reliability and Variance Extracted Estimates
Constructs and Indicator Standard Loading Reliabilitya Error Varianceb
Motivation
Growth Potential .624 .389 .611Reduce risk .715 .511 .489Proven System .725 .525 .475
Evaluation
On-going Service .833 .694 .306Amount of Fees .585 .343 .657Effectiveness of Supports .801 .642 .358
Brand Name
Brand Equity .910 .829 .171Brand Loyalty .742 .551 .449Brand Effects .717 .514 .486
Quality of the Relationship
Recognize Franchisee .907 .822 .178Working Relationship .602 .363 .637Franchisor Satisfaction .780 .608 .392
Performance
Sales Performance 1 .757 .573 .427Sales Performance 2 .781 .610 .390Income .636 .404 .596
Satisfaction
Contract Fair .777 .604 .396Satisfied with Support Program .744 .553 .447Satisfied with Relationship .613 .376 .624
Commitment
Agree with Franchise Contract .795 .632 .368Operational Commitment .730 .533 .467Loyalty to Franchisor .509 .259 .741
Note. All standardized loading were significant at p < .001.a Calculated as the square of the standardized factor loading.b Calculated as 1 minus the indicator reliability.

119
Table 5. 12Measurement Properties for Study Constructs
Constructs and Indicator Standardized Variance Extracted Loading ta Reliabilityb Estimate
Motivation .730b .487Growth Potential .624 9.47 .451Reduce risk .715 11.22 .496Proven System .725 11.42 .514
Evaluation .789b .530On-going Service .833 14.03 .683Amount of Fees .585 8.76 .297 Effectiveness of Supports .801 13.26 .610
Brand Name .835b .618Brand Equity .910 14.81 .875Brand Loyalty .742 11.46 .587Brand Effects .717 10.99 .326
Quality of the Relationship .813b .586Recognize Franchisee .907 16.12 .829Working Relationship .602 9.14 .285Franchisor Satisfaction .780 12.89 .592
Performance .770b .535Sales Performance 1 .757 11.16 .601Sales Performance 2 .781 11.57 .657Income .636 9.08 .368
Satisfaction .756b .510Contract Fair .777 12.73 .575Satisfied with Support Program .744 12.01 .542Satisfied with Relationship .613 9.39 .412
Commitment .725b .488Agree with Franchise Contract .795 12.60 .655Operational Commitment .730 11.31 .515Loyalty to Franchisor .509 7.26 .330
Note. All standardized loading were significant at p < .001. aAll t tests were significant at p < .001 bDenotes composite reliabilities
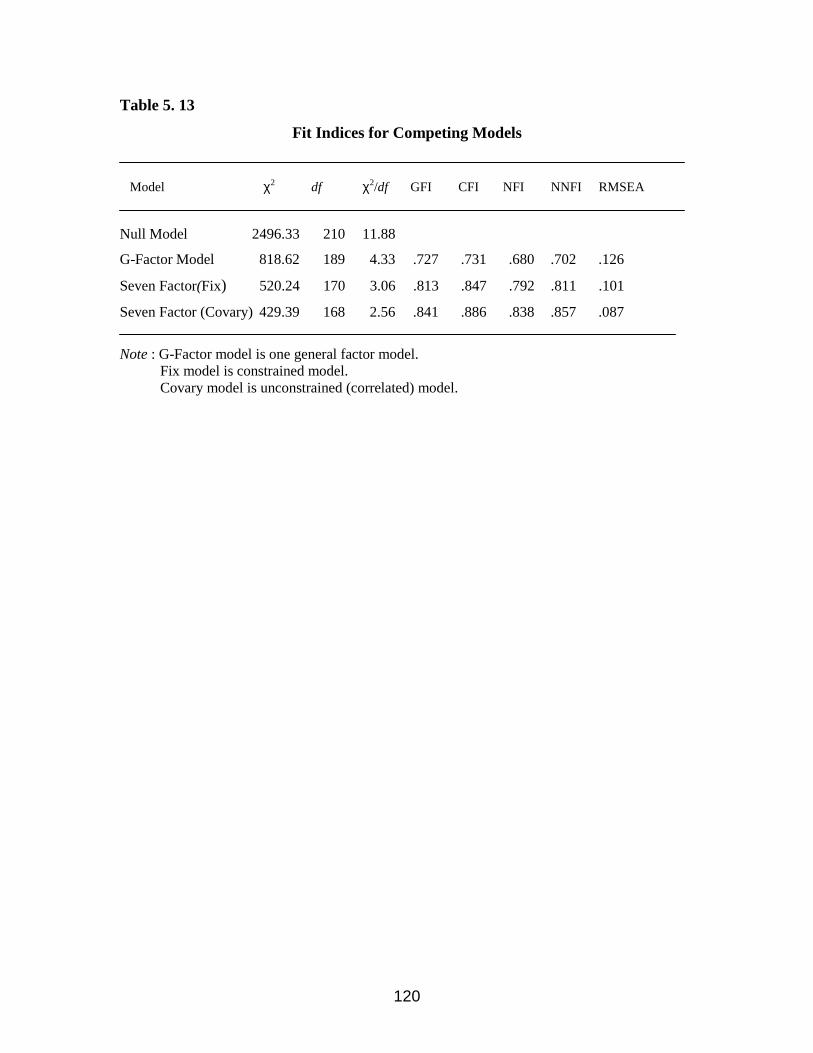
120
Table 5. 13
Fit Indices for Competing Models
Model χ2 df χ2/df GFI CFI NFI NNFI RMSEA
Null Model 2496.33 210 11.88
G-Factor Model 818.62 189 4.33 .727 .731 .680 .702 .126
Seven Factor(Fix) 520.24 170 3.06 .813 .847 .792 .811 .101
Seven Factor (Covary) 429.39 168 2.56 .841 .886 .838 .857 .087
Note : G-Factor model is one general factor model. Fix model is constrained model. Covary model is unconstrained (correlated) model.

121
F1: Motivation F2: Evaluation F3: Brand Name F4: Quality Relationship F5: PerformanceF6: Satisfaction F7: Commitment
Figure 5.1
A Theoretical Model of the Franchisee-Franchisor Relationship
A Theoretical Model of the Franchisee-Franchisor Relationship
F1
F2
F3
F4
F5
F6
F7
V1 V2 V3 V16 V17 V18
V4 V5 V6 V10 V11 V19 V20 V21
V13
V12
V14 V15V7 V8 V9
(-)(-)
(+)
(+)
(+)
(+)
(+)
(+)
(+)
(-)
(+)
(-)

122
5.4 Scale Development: Reliability and Validity Analyses
One of the most important advantages offered by latent variables analysis is the
opportunity that they provide to assess the reliability and validity of a study’s variables
(Hatcher, 1994). In the present study, confirmatory procedures were used to test the
measurement properties of all constructs prior to examining the hypothesized structural
models (Anderson and Gerbing, 1988). Broadly speaking, reliability refers to the
consistency of measurement. On the other hand, validity refers to the extent to which an
instrument measures what it is intended to measure. In this study, the result of a CFA
using CALIS (SAS Institute Ins., 1989) assessed items reliability, composite reliability,
variance extracted estimates, convergent validity, and discriminant validity.
The reliability of indicator variables are defined as the square of the correlation
between a latent factor and their indicator (Hatcher, 1994). This reliability indicates the
percent of variation of the indicator that is explained by the factor that it is supposed to
measure (Long, 1983). Items within each scale were summed to arrive at a respondent’s
scale score. The Cronbach’s alpha (Cronbach, 1951) was calculated to determine the
internal consistency of each scale. Reliability measures and information pertaining to the
scales, presented in Table 5.4 through Table 5.10, show the reliabilities ranged from .737
to .888, and thus are adequate for research purposes (Nunnally, 1978).
Composite reliability and variance extracted estimates were the primary statistics
used to assess the properties of the hypothesized constructs (Fornell and Larcker, 1981).
The composite reliabilities statistics estimate the internal consistency of a latent

123
construct, similarly to a coefficient alpha (Fornell and Larcker, 1981). Because the
hypothesized personality structure was based on a previous exploratory factor analysis
using correlations obtained among variables (Gough, 1987), a reliability estimate similar
to the coefficient alpha is considered appropriate (Bollen and Lennox, 1991).
Fornell and Larcker (1981) also stress the importance of examining composite
reliabilities and the variance extracted. Bagozzi and Yi (1988) suggest two criteria;
composite reliability should be greater than or equal to .60, and variance extracted should
be greater than or equal to .50. For this study, all seven composite reliabilities were
greater than .70 and five of the variance extracted were greater than or equal to .50 except
for two that were less satisfactory (see Table 5.12). Furthermore, the variance extracted in
each measure exceeded the respective correlation estimate between factors, which
provided evidence of discriminant validity (Fornell and Larcker, 1981).
The variance-extracted statistic estimates the proportion of variance explained by
a construct, compared to the variance due to random measurement error. As such, it
serves as an estimate of the convergent validity of a construct’s indicator variables. Table
5.12 provides the estimates for each construct, in addition to the standardized loadings
and the reliabilities of each construct indicator. All indicators were statistically significant
(t > 7, p < .001).
Convergent validity and discriminant validity are usually associated with the use
of the multitrait, multimethod (MTMM) approach to validation (Campbell and Fiske,
1959), in which multiple constructs are each assessed using more than one assessment
method. Convergent validity is demonstrated when different instruments are used to
measure the same construct, and the scores from these different instruments are strongly
124
correlated. A strong correlation suggests that both instruments are measuring what they
are intended to measure (Hatcher, 1994). In this study, convergent validity is assessed by
reviewing the t tests for the factor loadings. The standardized factor loadings from this
study and t tests for these loadings are presented Table 5.12. The results indicated that the
t values for these twenty-one indicators ranged from 7.26 to 16.12. These t values are all
significantly different from zero at p < .001 (because all indicators’ t values exceeded the
critical t of 3.29 for p = .001), which satisfies the criteria for convergent validity.
Discriminant validity is demonstrated when different instruments are used to
measure different constructs, and the correlations between the measures of these
constructs are relatively weak. The MTMM approach provides a relatively strong test of
discriminant validity (Hatcher, 1994). Unfortunately, these tests could not be repeated for
the present franchisee-franchisor relationship model, as multiple methods were not used
to assess the different constructs. Nonetheless, some evidence regarding discriminant
validity may be obtained from this analysis.
Discriminant validity was tested using the procedure suggested by Anderson and
Gerbing (1988). Taking one pair of factors at a time, the unconstrained confirmatory
factor analysis model (where all factors were allowed to covary freely) was compared
with a constrained model in which the covariance between one factor pair was
constrained to unity (implying that there was no discrimination between the two factors),
and the covariance between the remaining factor pairs was constrained to equality
(Hughes, Price, and Marrs, 1986). A significant chi-square difference between the
constrained and unconstrained factor models provided evidence of discriminant validity
125
between the pair of factors being tested (Anderson and Gerbing, 1988; Bagozzi, 1980,
p.142).
With the chi-square difference test, the discriminant validity of two constructs
was assessed by eliminating the standard measurement model in which all factors were
allowed to covary, creating a new measurement model identical to the previous one,
except that the correlation between two factors of interest was fixed at 1, and the chi-
square difference statistic was computed for the two models.
In this study, for correlations among the exogenous variables, F1 (motivation) and
F2 (evaluation) were selected. These two constructs were so strongly correlated that it
was reasonable to question whether or not two different constructs were being measured
at all. The summary table indicates the chi-square for the models (Table 5.13). The
difference in chi-square was 90.85. To determine whether this value is statistically
significant, since there were 2 df associated with the chi-square difference test, the critical
values of chi-square were 9.21 at p = .01, 13.82 at p = .001. The observed chi-square
difference value was 90.85, therefore the difference between the two models was clearly
significant at p < .001.
Fornell and Larcker (1981) suggest that discriminant validity can be assessed by
determining whether the variance extracted estimates for two constructs are greater than
the square of the parameter estimate between them (φ2). In this study, the correlation
between F2 and F5 was .542, and the square of this correlation was .293 (see Appendix B
p. 211). Variance extracted estimates were calculated earlier, and appear in Table 5.12.
The variance extracted estimates were .530 for F2 (Evaluation), and .535 for F5
(Performance). Because the variance extracted estimates for both F2 and F5 were larger

126
than the square of the interfactor correlation, this test supports the discriminant validity of
the two factors.
The discriminant validity of the scales were assessed using confirmatory factor
analysis procedures (Anderson and Gerbing, 1988). The results of each pair-wise
construct comparison suggested that the seven-factor solution was better than the single
factor solution (Table 5.13).
Overall, the fact that all t tests were significant showed that all indicators were
effectively measuring the same construct (Anderson and Gerbing, 1988). As evidence of
convergent validity, the measurement factor loadings were all significant (t values
between 7.26 to 14.03); the construct reliabilities were large (ranging from .725 to .835),
and the average variance extracted (AVE) (Fornell and Larcker, 1981) indicated that in
each case, the variance captured by the construct was greater than the variance due to
measurement error (AVEs ranging between .487 to .618) (Table 5. 12).
Each multiple-item indicator was considered simultaneously to provide for the
fullest test of convergent and discriminant validity. Therefore, the measures were
adequate for further analysis.
5.5 Structural Models
Because the sample size was modest, manifest structural model were evaluated,
rather than latent structure models using the CALIS procedure in SAS. The issue of
sample size remains an active debate in the structural equation modeling literature
(Brannick, 1995; Kelloway, 1995, Williams, 1995). With smaller samples ( N < 150)
there is a danger of obtaining nonconvergent solutions, even for more highly specified
127
models (Anderson and Gerbing, 1988). With large samples (N > 400), trivial
discrepancies can lead to rejection of a satisfactory model since absolute indices of fit are
prone to influence by sample size (Bollen, 1989; Loehlin, 1992).
The measurement model assessed whether all items in a given scale represented
the same latent factor. Then only those items were aggregated that reflected a common
construct in order to derive unidimensional composite scales for the structural model tests
(Anderson and Gerbing, 1988). To evaluate the structural model, Bollen’s (1990)
recommendation for interpreting multiple indices of model fit was followed. CALIS fit
statistics were reviewed, such as the chi-square test and root-mean-square residual
(RMSR). To supplement these indices, the normed fit index (NFI; Bentler and Bonett,
1980) was examined, because, unlike the chi-square test, it has been shown to be less
biased in small samples (Bentler, 1989). The goodness-of-fit index (GFI; Joreskog and
Sorbom, 1993) was also considered, as well as the comparative fit index (CFI; Bentler,
1990), both of which are relatively stable in samples smaller than 250 (Hu and Bentler,
1995).
Path analysis was performed to test the theoretical model presented Figure 1
(Appendix A, p. 196). All analyses were conducted using the SAS System’s CALIS
procedures. These analyses used the maximum likelihood method of parameter
estimation, and all analyses were performed on the variance-covariance matrix.
5.5.1 Initial Theoretical Model
The adequacy of a structural model is determined by a chi-square test. This test
evaluates how well the covariance matrix implied by the model fits the covariance matrix
128
of the observed data. However, because the chi-square test is heavily influenced by
sample size (Bollen and Long, 1994), several fit indices have been proposed as aids to
model fitting (Joreskog and Sorbom, 1989; Bentler, 1992).
Although estimation of this model revealed a significant model chi-square value,
χ2 (5, N =210) = 20.06, p = .0012, other fits statistical values exceeded .90, except for
AGFI, indicating the good fit of the model. Modifications were attempted that would
improve the model’s fit. The most appropriate fit index is the Comparative Fit Index
(CFI) because it has a small sampling variability, and it is unaffected by sample size
(Bentler, 1990). For validity purpose, fit indices with values of less than .90 have not
been considered acceptable (Bentler, 1990; Hays et al., 1994).
Figure 5.2 displays standardized path coefficients for the theoretical model.
Fitting the hypothesized model to the data resulted in acceptable goodness of fit indices.
First, the path coefficients were reviewed to see if any of the paths in the initial model
should be deleted.
The t values for all path coefficients proved to be statistically significant at p <
.05, except for from Brand Name to Quality of the Relationship, Brand Name to
Performance, Performance to Commitment, and Motivation to Commitment. All
standardized path coefficients exceeded .30 (except for from Quality Relationship to
Performance) in absolute magnitude, indicating that they were meaningful in size
(Billings and Wroten, 1978). However, a review of the model’s residuals revealed that
the distribution of normalized residuals was asymmetrical, and that one normalized
residual was relatively large (in excess of 2.0). The largest normalized residual was 2.27
for the Motivation – Satisfaction Relationship. This same relationship also demonstrated
129
a significant Lagrange Multiplier test (Bentler, 1989) (10.37, p < .001) indicating that the
model could be significantly improved by adding a path from Motivation to Satisfaction.
Model modifications can be assisted by the use of two tests, the Wald test, and the
Lagrange Multiplier test (Hatcher, 1994). Although these post-hoc modifications are
heavily influenced by chance (MacCallum, Roznowski and Necowitz, 1992), they could
provide insight to variations in the original model (Hays et at., 1994).
Therefore, the model was revised by adding paths from Motivation to Satisfaction
and from Brand Name to Commitment. Some of the existing paths were eliminated from
the initial model. The resulting model was termed “the revised model.” Adding such a
path would be consistent with the prediction form cognitive dissonance theory (Festinger,
1957), in that individuals often adjust their attitudes so that their attitudes will be
consistent with their behaviors.
Because its addition and deletion could be justified on theoretical grounds, paths
from Motivation to Satisfaction and from Brand Name to Commitment were added to the
initial model, and paths from Brand Name to Quality of the Relationship, Brand Name to
Performance, Performance to Commitment, and Motivation to Commitment, were
deleted from the initial model. The resulting model, called “the revised model,” was then
re-estimated.

130
Note: * p < .05, ** p < .01
Figure 5.2
A Path Diagram for the Initial Theoretical Model
A Path Diagram for the Initial Theoretical Model
F 1
F 2
F 3
F 5
F 4
F 6
F 7
F1: Motivation F4: Quality Relationship
F2: Evaluation F5: Motivation
F3: Brand Name F6: Satisfaction
F7: Commitment
.463 **
.368**
.314**
.300**
.043
.039.4
15**
.256**
-.299**
.161
*
-.088
-.313**
.718
**.3
76**
�7
�6
�5
�4
-.126
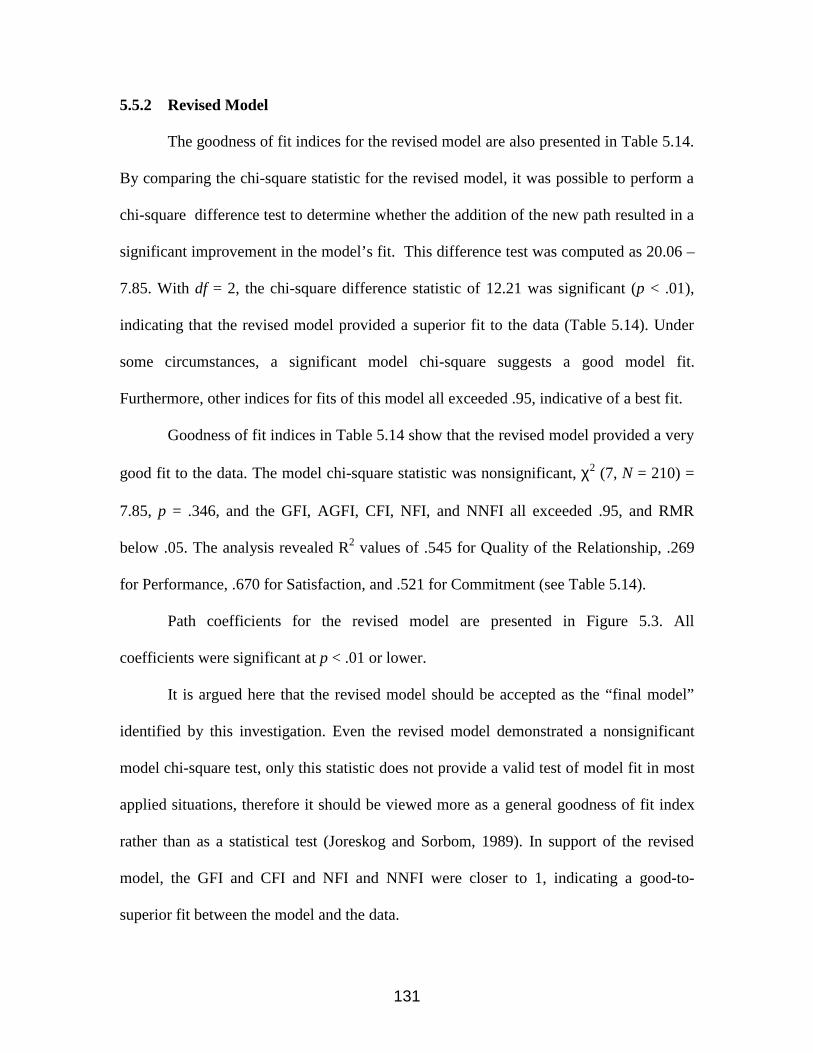
131
5.5.2 Revised Model
The goodness of fit indices for the revised model are also presented in Table 5.14.
By comparing the chi-square statistic for the revised model, it was possible to perform a
chi-square difference test to determine whether the addition of the new path resulted in a
significant improvement in the model’s fit. This difference test was computed as 20.06 –
7.85. With df = 2, the chi-square difference statistic of 12.21 was significant (p < .01),
indicating that the revised model provided a superior fit to the data (Table 5.14). Under
some circumstances, a significant model chi-square suggests a good model fit.
Furthermore, other indices for fits of this model all exceeded .95, indicative of a best fit.
Goodness of fit indices in Table 5.14 show that the revised model provided a very
good fit to the data. The model chi-square statistic was nonsignificant, χ2 (7, N = 210) =
7.85, p = .346, and the GFI, AGFI, CFI, NFI, and NNFI all exceeded .95, and RMR
below .05. The analysis revealed R2 values of .545 for Quality of the Relationship, .269
for Performance, .670 for Satisfaction, and .521 for Commitment (see Table 5.14).
Path coefficients for the revised model are presented in Figure 5.3. All
coefficients were significant at p < .01 or lower.
It is argued here that the revised model should be accepted as the “final model”
identified by this investigation. Even the revised model demonstrated a nonsignificant
model chi-square test, only this statistic does not provide a valid test of model fit in most
applied situations, therefore it should be viewed more as a general goodness of fit index
rather than as a statistical test (Joreskog and Sorbom, 1989). In support of the revised
model, the GFI and CFI and NFI and NNFI were closer to 1, indicating a good-to-
superior fit between the model and the data.

132
The results for the overall path model are presented in Figure 5.3. They indicate
that the model shows a good fit to the data.. Since the goodness-of-fit indices exceed .95,
and χ2 is nonsignificant at the .001 level, the overall structure of the path model is
supported, and the individual path coefficient can be meaningfully interpreted (Hair et al.,
1995).

133
Note: * p < .05, ** p < .01 ∇ The signs of this path were not as hypothesized.
Figure 5.3
A Path Diagram for the Revised Model
A Path Diagram for the Revised Model
F 1
F 2
F 3
F 5
F 4
F 6
F 7
F1: Motivation F4: Quality Relationship
F2: Evaluation F5: Motivation
F3: Brand Name F6: Satisfaction
F7: Commitment.478 **
.279**
.315**
.305**
.333
**
.264**
-.328**
-.386**.718
**
.376
**
�7
�6
�5
�4
.214** ∇
-.146**∇
.143
**

134
Table 5. 14
Goodness of Fit Indices for the Various Models
Model χ2 df p GFI AGFI CFI NFI NNFI
Null Model 809.07 21
Initial Model 20.06 5 .0012 .974 .855 .981 .975 .920
Revised Model a 7.85 7 .3464 .989 .956 .999 .990 .997
Note: N = 210. GFI = Goodness fit index; AGFI = Adjusted goodness fit index; CFI =
Comparative fit index; NFI = Normed fit index, NNFI = Non-normed fit index.
a Identical to the initial model, except that a path from the Brand Name to the Quality of
the Relationship, Brand Name to Performance, Motivation to Commitment, and
Performance to Commitment was deleted, and a path from Motivation to Satisfaction,
Brand Name to Commitment was added.
Squared Multiple Correlations
Variables Error Variance Total Variance R-squared a
F4 .798 1.754 .545 F5 1.625 2.224 .269 F6 .463 1.403 .670 F7 .929 1.941 .521
Note: a All values were significant at p < .01.
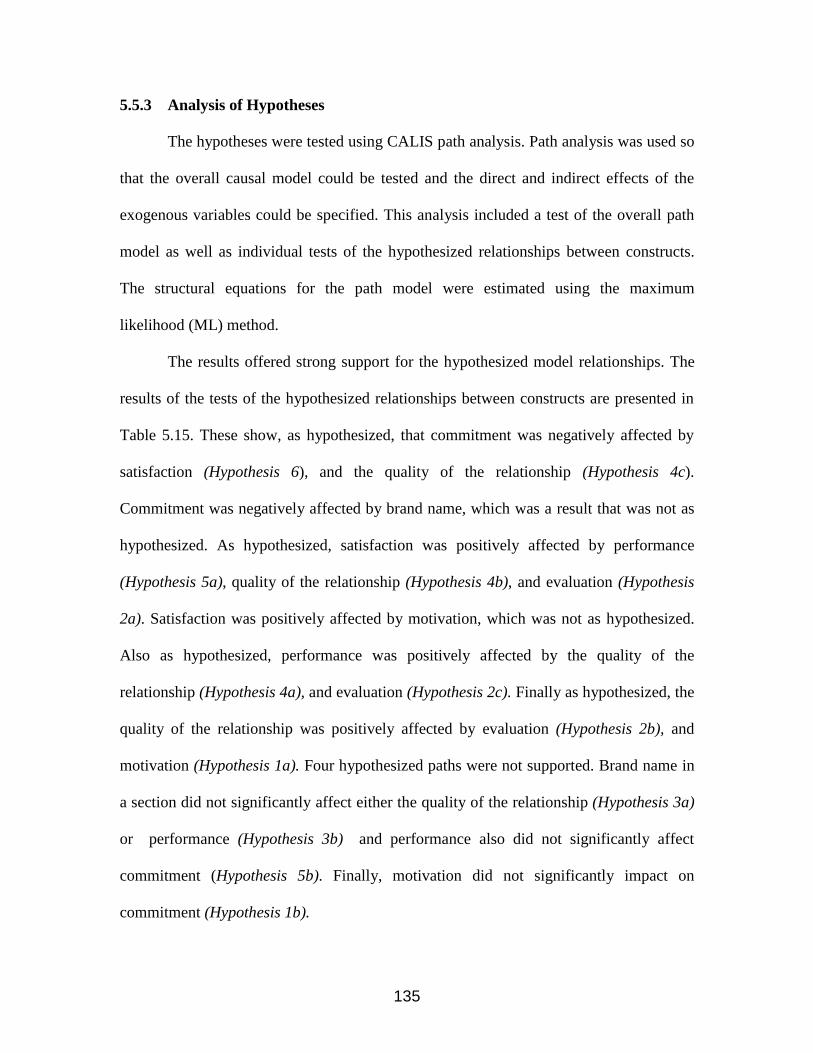
135
5.5.3 Analysis of Hypotheses
The hypotheses were tested using CALIS path analysis. Path analysis was used so
that the overall causal model could be tested and the direct and indirect effects of the
exogenous variables could be specified. This analysis included a test of the overall path
model as well as individual tests of the hypothesized relationships between constructs.
The structural equations for the path model were estimated using the maximum
likelihood (ML) method.
The results offered strong support for the hypothesized model relationships. The
results of the tests of the hypothesized relationships between constructs are presented in
Table 5.15. These show, as hypothesized, that commitment was negatively affected by
satisfaction (Hypothesis 6), and the quality of the relationship (Hypothesis 4c).
Commitment was negatively affected by brand name, which was a result that was not as
hypothesized. As hypothesized, satisfaction was positively affected by performance
(Hypothesis 5a), quality of the relationship (Hypothesis 4b), and evaluation (Hypothesis
2a). Satisfaction was positively affected by motivation, which was not as hypothesized.
Also as hypothesized, performance was positively affected by the quality of the
relationship (Hypothesis 4a), and evaluation (Hypothesis 2c). Finally as hypothesized, the
quality of the relationship was positively affected by evaluation (Hypothesis 2b), and
motivation (Hypothesis 1a). Four hypothesized paths were not supported. Brand name in
a section did not significantly affect either the quality of the relationship (Hypothesis 3a)
or performance (Hypothesis 3b) and performance also did not significantly affect
commitment (Hypothesis 5b). Finally, motivation did not significantly impact on
commitment (Hypothesis 1b).
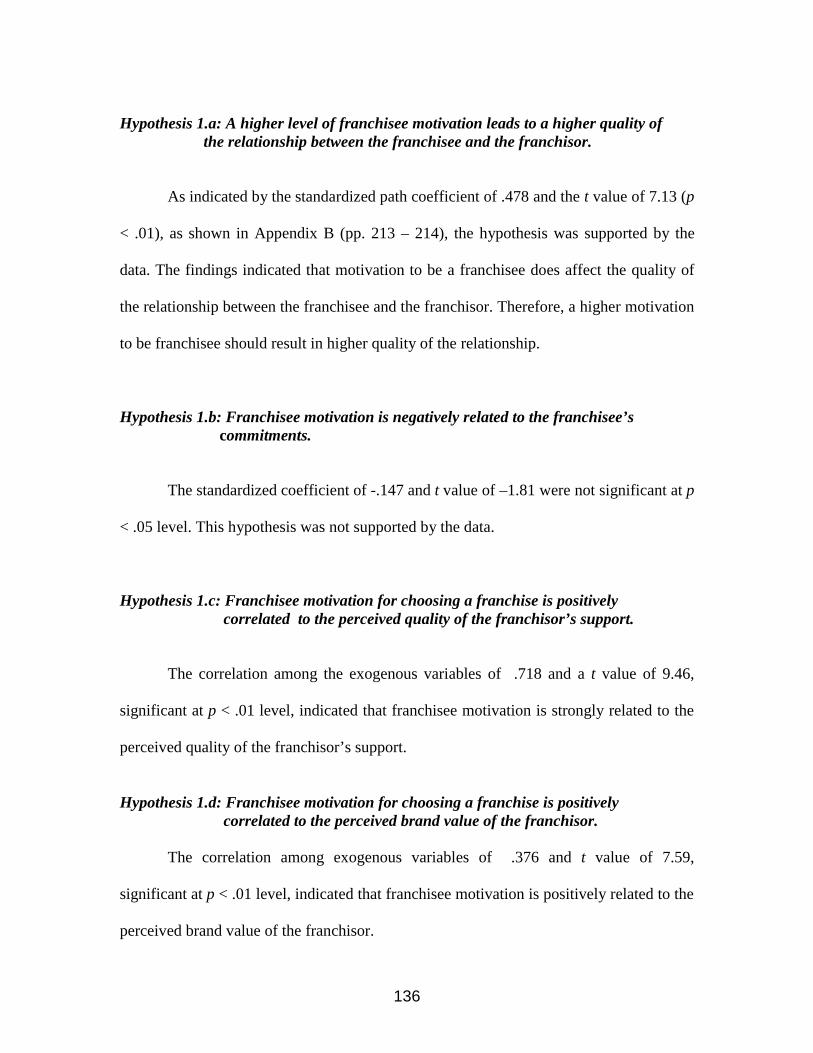
136
Hypothesis 1.a: A higher level of franchisee motivation leads to a higher quality of the relationship between the franchisee and the franchisor.
As indicated by the standardized path coefficient of .478 and the t value of 7.13 (p
< .01), as shown in Appendix B (pp. 213 – 214), the hypothesis was supported by the
data. The findings indicated that motivation to be a franchisee does affect the quality of
the relationship between the franchisee and the franchisor. Therefore, a higher motivation
to be franchisee should result in higher quality of the relationship.
Hypothesis 1.b: Franchisee motivation is negatively related to the franchisee’s commitments.
The standardized coefficient of -.147 and t value of –1.81 were not significant at p
< .05 level. This hypothesis was not supported by the data.
Hypothesis 1.c: Franchisee motivation for choosing a franchise is positively correlated to the perceived quality of the franchisor’s support.
The correlation among the exogenous variables of .718 and a t value of 9.46,
significant at p < .01 level, indicated that franchisee motivation is strongly related to the
perceived quality of the franchisor’s support.
Hypothesis 1.d: Franchisee motivation for choosing a franchise is positively correlated to the perceived brand value of the franchisor.
The correlation among exogenous variables of .376 and t value of 7.59,
significant at p < .01 level, indicated that franchisee motivation is positively related to the
perceived brand value of the franchisor.

137
Hypothesis 2.a: The quality of franchisor support is positively related to thefranchisee’s job satisfaction.
The standardized path coefficient for the relationship of H2a equals .279 and the t
value of 4.52, significant at p < .01 level, indicate that the perceived higher level in the
quality of franchisor support has a positive effect on job satisfaction. Thus, a higher
evaluation should result in higher job satisfaction for the franchisee.
Hypothesis 2.b: A perceived higher level in the quality of franchisor support leads to a higher quality of the relationship between he franchisee and the franchisor.
The path coefficient of .315 and the t value of 4.70 were significant at p < .01.,
indicating that this hypothesis was supported by the data. The findings indicate that the
perceived level in the quality of the franchisor’s support has an effect on a quality
relationship between the franchisee and franchisor.
Hypothesis 2.c: The quality of franchisor support is positively related to thefranchisee’s performance.
The standardized path coefficient of .305 and the t value of 3.88, significant at the
p < .01 level, indicate that the perceived level in the quality of the franchisor’s support
has a positive effect on a quality relationship between the franchisee and franchisor.
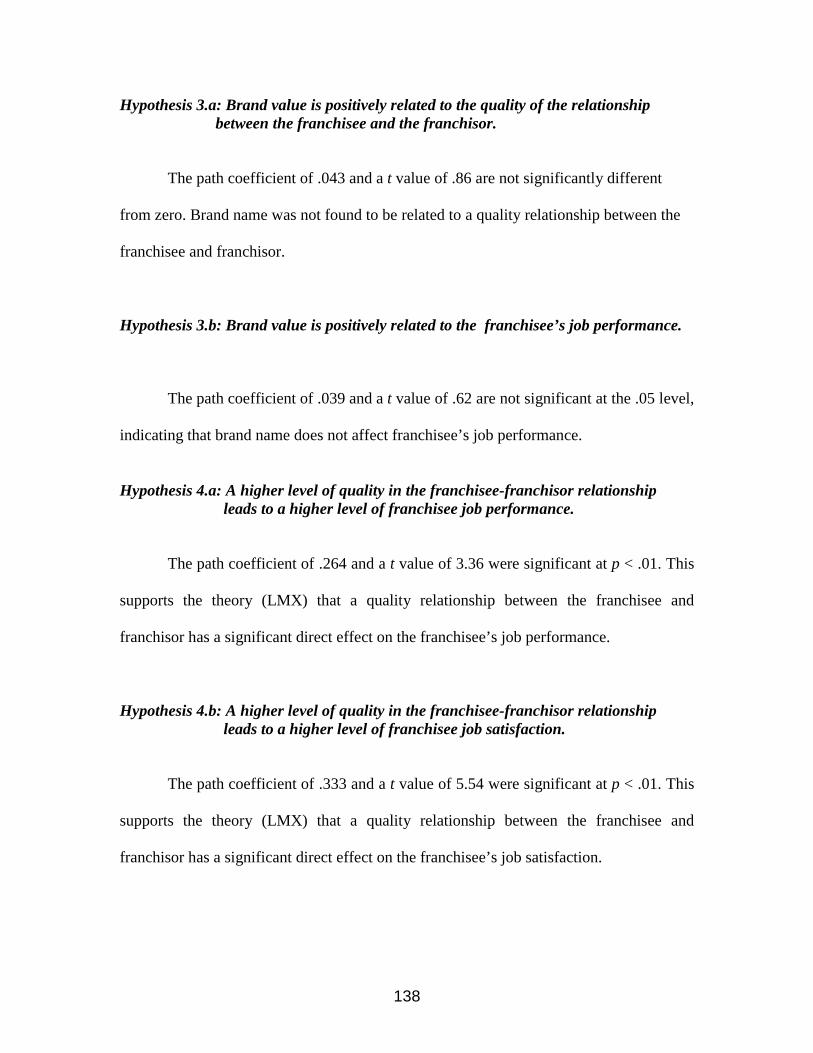
138
Hypothesis 3.a: Brand value is positively related to the quality of the relationshipbetween the franchisee and the franchisor.
The path coefficient of .043 and a t value of .86 are not significantly different
from zero. Brand name was not found to be related to a quality relationship between the
franchisee and franchisor.
Hypothesis 3.b: Brand value is positively related to the franchisee’s job performance.
The path coefficient of .039 and a t value of .62 are not significant at the .05 level,
indicating that brand name does not affect franchisee’s job performance.
Hypothesis 4.a: A higher level of quality in the franchisee-franchisor relationship leads to a higher level of franchisee job performance.
The path coefficient of .264 and a t value of 3.36 were significant at p < .01. This
supports the theory (LMX) that a quality relationship between the franchisee and
franchisor has a significant direct effect on the franchisee’s job performance.
Hypothesis 4.b: A higher level of quality in the franchisee-franchisor relationship leads to a higher level of franchisee job satisfaction.
The path coefficient of .333 and a t value of 5.54 were significant at p < .01. This
supports the theory (LMX) that a quality relationship between the franchisee and
franchisor has a significant direct effect on the franchisee’s job satisfaction.

139
Hypothesis 4.c: The quality in the franchisee-franchisor relationship is negativelyrelated to the franchisee’s commitment.
The path coefficient of -.328 and a t value of -4.63 were significant at p < .01.
This supports the theory (LMX) that a quality relationship between the franchisee and
franchisor has a significant direct effect on the franchisee’s commitment to quit.
Hypothesis 5.a: Franchisee’s job performance is positively related to the franchisee’sjob satisfaction
The path coefficient of .143 and a t value of 3.07 were significant at p < .01. The
findings concerning H5a suggest job performance positively affects the franchisee’s job
satisfaction.
Hypothesis 5.b: Franchisee’s job performance is negatively related to the franchisee’s commitment.
The path coefficient of -.088 and a t value of -1.53 are not significant at the .05
level, indicating that job performance does not affect the franchisee’s commitment to
quit.
Hypothesis 6: Franchisee’s job satisfaction is negatively related to the franchisee’scommitment.
The path coefficient of –.386 and a t value of –4.11 were significant at p < .01.
The findings concerning H6 suggest that job satisfaction negatively affects the
franchisee’s commitment. Thus, increased perceptions of job satisfaction decrease the
franchisee’s commitment to quit.
140
Other Results
SEM produced other significant results. First, the path from motivation to
satisfaction suggests a significant positive relationship (.213, p < .01). And, the path
from brand name to commitment suggests a significant negative relationship (-.146, p <
.01).
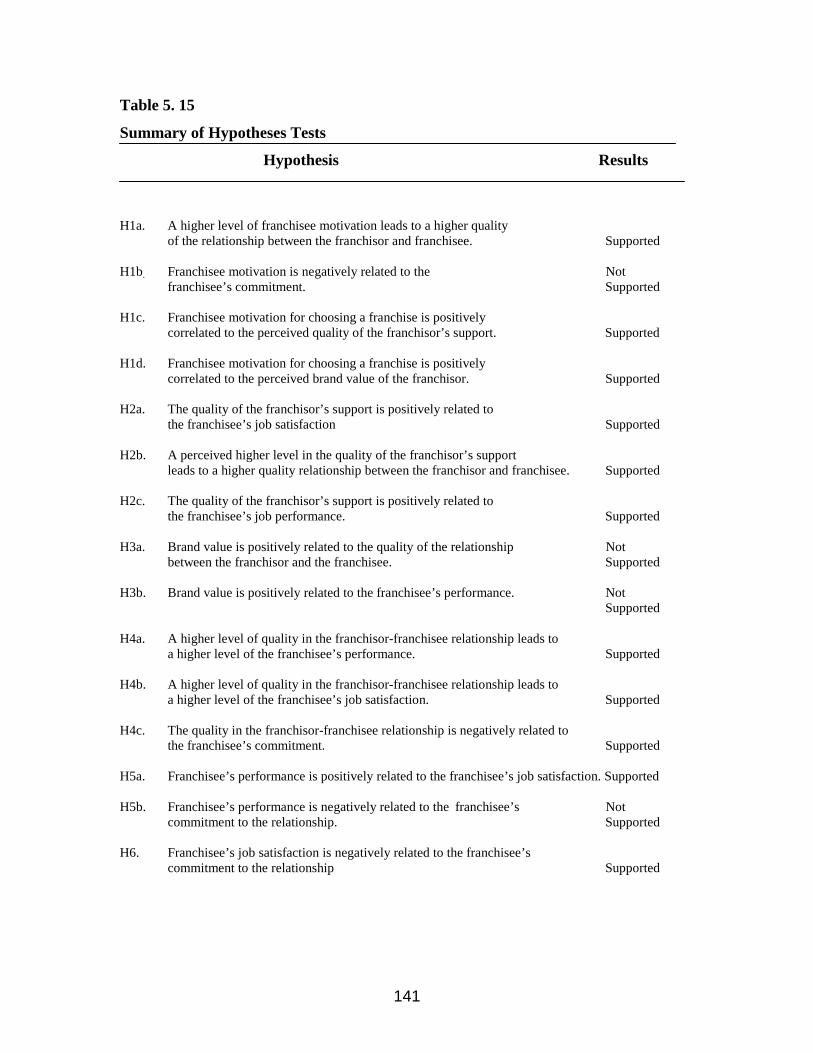
141
Table 5. 15
Summary of Hypotheses Tests
Hypothesis Results
H1a. A higher level of franchisee motivation leads to a higher qualityof the relationship between the franchisor and franchisee. Supported
H1b. Franchisee motivation is negatively related to the Notfranchisee’s commitment. Supported
H1c. Franchisee motivation for choosing a franchise is positivelycorrelated to the perceived quality of the franchisor’s support. Supported
H1d. Franchisee motivation for choosing a franchise is positivelycorrelated to the perceived brand value of the franchisor. Supported
H2a. The quality of the franchisor’s support is positively related tothe franchisee’s job satisfaction Supported
H2b. A perceived higher level in the quality of the franchisor’s supportleads to a higher quality relationship between the franchisor and franchisee. Supported
H2c. The quality of the franchisor’s support is positively related tothe franchisee’s job performance. Supported
H3a. Brand value is positively related to the quality of the relationship Notbetween the franchisor and the franchisee. Supported
H3b. Brand value is positively related to the franchisee’s performance. Not Supported
H4a. A higher level of quality in the franchisor-franchisee relationship leads toa higher level of the franchisee’s performance. Supported
H4b. A higher level of quality in the franchisor-franchisee relationship leads toa higher level of the franchisee’s job satisfaction. Supported
H4c. The quality in the franchisor-franchisee relationship is negatively related tothe franchisee’s commitment. Supported
H5a. Franchisee’s performance is positively related to the franchisee’s job satisfaction. Supported
H5b. Franchisee’s performance is negatively related to the franchisee’s Notcommitment to the relationship. Supported
H6. Franchisee’s job satisfaction is negatively related to the franchisee’scommitment to the relationship Supported

142
5.5.4 Direct and Total Effects
The structural model in SEM deals with the hypothesized relationships, direct or
indirect, between the measured variables and the constructs (Hoyle and Smith, 1994).
Empirical support for the links among constructs can be examined in two ways; as direct
effects, and as total effects. The first way involves tests of significance for simple links
with no intervening constructs. These tests of direct effects provide a more
straightforward means of assessing whether the data supports the proposed relationships
between pairs of constructs.
Table 5.16 shows that the results of both the hypothesized direct effects leading
to commitment is significant; thus, commitment reflects a negative direct influence from
satisfaction, the quality of the relationship, and not the hypothesized effects from brand
name. Shifting backward in the flow of influence, satisfaction reflects a positive direct
influence from motivation, evaluation, the quality of the relationship, and performance.
And also, performance receives a direct effect from the quality of the relationship and
evaluation, as proposed. The quality of the relationship has direct positive effects from
motivation and evaluation, but not, as proposed, from brand name.
The statistical support for the direct links in the model appears substantial, given
that each of the four endogenous constructs have significant influences from at least one
antecedent construct. In addition, all of the constructs preceding commitment
significantly affect at least subsequent the endogenous construct.
The second way to examine the empirical support for the proposed links employs
the more complex total effects furnished by CALIS. These total effects combine the
indirect effects with the direct effects presented Table 5.16. Indirect effects for a pair of

143
constructs occurs when additional, alternative paths of influence run through constructs
that intervene between this pair. The total effects therefore present a more comprehensive
indication of the influence of one construct on another than do the direct effects (Bollen,
1989).
In the present study, the indirect effects combine with the direct effects to form 15
significant total effects for the links that were hypothesized by the model. The revised
model contained additional direct paths from one exogenous construct to commitment.
The correlation between motivation and commitment resulted in significant relationships;
the results of the multivariate test of this path were clear-cut. While all three of the
exogenous variables were hypothesized to have an indirect effect on commitment, only
one (motivation) was hypothesized to have direct effects but brand name have direct
effects on commitment. Evaluation was not tested for direct effects because no
relationships could be given as to how they might affect commitments independent of
their impact on the quality of the relationship, performance, and satisfaction.
Although satisfaction has a strong influence on commitment, a large part of this
effect is indirect through motivation, evaluation, and the quality of the relationship. The
total influence (direct and indirect paths) of satisfaction on commitment was -.454, but
the indirect effect (through motivation and the quality of the relationship) was .360; thus,
these two constructs act as partial mediators of the effect of satisfaction on commitment.
Although motivation is significant in structural model, its influence on commitment is
minor when compared to satisfaction and the quality of the relationship. Finally, it is
interesting to note that the quality of the relationship and satisfaction have total effects
that rival those of commitment, and exceed that of motivation or evaluation. Collectively,

144
these antecedent variables exert a considerable influence (via their indirect effects, as
shown in Table 5.16) in explaining variations in commitment.
The proposed model makes a number of implicit mediation predictions, such as
satisfaction completely mediates the effects of the quality of the relationship,
performance, and evaluation on commitment.

145
Table 5.16
Total Effects of Exogenous on Endogenous Variables
F1 F2 F3 F6 F5 F4
F4 .531 .335 . . . .
F5 .158 .465 . . . .297
F6 .388 .417 . . .113 .332
F7 -.360 -.305 -.248 -.454 -.052 -.496
Indirect Effects of Exogenous on Endogenous Variables
F1 F2 F3 F6 F5 F4
F4 . . . . . .
F5 .158 .100 . . . .
F6 .176 .153 . . . .034
F7 -.360 -.305 . . -.052 -.151

146
Table 5. 17 Scales Means, Standard Deviations, and Covariance
Variable Mean Std Dev
F1 4.47 1.19F2 3.90 1.25F3 5.85 .82F4 4.18 1.32F5 4.36 1.49F6 4.40 1.19F7 3.06 1.40
Covariance of Structural Model
F1 F2 F3 F4 F5 F6 F7
F1 1.425
F2 1.069 1.554
F3 0.368 0.291 0.674
F4 1.115 1.088 0.333 1.754
F5 0.836 0.891 0.248 0.919 2.224
F6 1.012 1.063 0.265 1.151 0.939 1.408
F7 -0.999 -0.958 -0.403 -1.212 -0.938 -1.103 1.949

147
5.6 Summary
This chapter first examines the results of the statistical analyses performed on the
restaurant franchisee survey. Profiles of the franchisees are developed. Next the empirical
portion of the scale developed for the measures of each variable is presented and
confirmatory factor analysis is employed to test the measurement models. Reliability and
validity issues are examined. The process used in developing the final structural model is
explained. SEM is used to test the hypothesized relationships of the theoretical model
and the final model is presented with an analysis of direct and total effects. This analysis
revealed that eleven of the fifteen hypothesized relationships were statistically
significant. However, the path linking motivation to satisfaction and from brand name to
commitment, which was not hypothesized in the initial theoretical model, was found
significant. Thus, in addition to a direct effect of brand name on commitment, motivation
was found to have an indirect effect on commitment through its effect on job satisfaction.
The following chapter will discuss the major findings of these results, as well as their
implication and limitations. It also suggests the directions for the future research.
148
CHAPTER 6
DISCUSSION AND CONCLUSIONS
This study applied social exchange theory to the franchisee-franchisor
relationship setting, explored the factors affecting the quality of the relationship between
franchisee and franchisor, and its impact on franchisee’s performance, satisfaction, and
commitment. This chapter will discuss the major findings of the study, the implications
of those findings for franchising management applications, the implications for future
research and the limitations of the study. The major findings of this study include topics
relating to the measurement of concepts as well as the relationships among these
concepts.
6.1 Major Findings
Both the concepts of the quality of the relationship and the commitment to the
franchisor-franchisee relationship have gained prominence in franchising today. It is well
recognized that the quality of the relationship plays a central role in initiating and
managing the franchising relationship. However, remarkably little research has been done
on the predictive effects of the relationship of franchising constructs to franchisee’s
perceived value. Consequently, we still know little about the mechanism through which a

149
quality relationship or relationship promoting practices enhance franchisee perceived
value.
This study set out to develop a conceptual model that explains how relationship
quality can affect franchisee’s performance, job satisfaction, and commitment. The
results of this study strongly support the hypothesized model, revealing the positive
influence of franchisee motivation, and evaluation on the quality of the relationship
between the franchisee and franchisor and also on performance, satisfaction and the
negative influence of the quality of the relationship, performance, and satisfaction on the
commitment. This study found that these constructs were substantially interrelated and
were influenced by personality variables.
Of the 15 hypotheses put forward, only 4 were not fully supported, or were
partially supported. The results show, for the first time, that the LMX paradigm can be
applied to the franchise relationship situation. However, the relative effects of various
structural linkages varies from those found in previous studies of the motivation to be a
franchisee and franchisee satisfaction. Furthermore, the extended framework throws
considerable light on the drivers of the evaluation of franchisor’s support, the perception
of the franchisor’s brand name, and the quality of the relationship, as well as on the
strong linkage between the quality of the relationship and satisfaction, and the quality of
the relationship and commitments. Although some of the hypotheses were not supported
(e.g. brand name), the inclusion of the motivation to be a franchisee variable, the
evaluation of the franchisor’s support variable, and quality of the relationship between
the franchisee and the franchisor variable add a richness to our understanding of the
determinant of the franchisee’s performance, job satisfaction, and commitment.

150
The derived structural model confirms that franchisee’s job satisfaction has a
direct influence on the commitment, as hypothesized. The motivation to be a franchisee
and the evaluation of the franchisor’s support can be assessed with some confidence; the
direct effect of the quality of the relationship was secondary to commitments. Only when
the various indirect effects (via the quality of the relationship) are taken into account does
satisfaction have a dominant influence. Results also point to the important role played by
the level of the quality of the relationship between the franchisee and franchisor. In
addition, because franchisees are usually the owners and managers of their businesses,
the association between job satisfaction and performance may be an inherently strong
relationship.
The findings in this study concerning commitment to remain in the franchise
relationship are also noteworthy. They suggest positive rewards for the franchise
organization whose polices are aimed at developing effective interpersonal relations with
their franchisees and providing a business environment conducive to work satisfaction.
These actions may encourage a sense of belonging and identification with the values and
goals of the organization, as well as decreasing potentially costly turnover. Franchisors
are concerned with selecting and retaining franchisees who will not only perform well as
team players, but also who will remain with the franchise system. Franchisees may not
only remain with the franchise system, but also work toward its success. To this end,
franchisors should pay attention to providing work experiences associated with
confirming expectations, organizational support, dependability, and fair treatment. All of
these factors have been found to be helpful in fostering long-term affective commitment
(Mowday, Porter, and Steers, 1982).

151
This study’s findings suggest that there may be robust franchisee’s perception
factors associated with the way in which situational factors are interpreted. It is suggested
that this study’s findings make theory-driven methodological and substantive
contributions to understanding the franchisee-franchisor relationship.
6.2 Limitations
As with any study, the present study has its limitations, including the limitations
of time and financial considerations, and the nature of the research design.
First, perhaps the most potentially troubling limitation is that all constructs were
based on data from self-reported sources. Thus, common-method bias might have inflated
the parameter estimates among constructs. Typically, this may affect the measurement of
attitudes in self-reported surveys, which contain both dependent and independent
variables (Williams, Cote, and Buckley, 1989; Williams and Brown, 1994). Although not
entirely ruling out bias due to common method variance, the data does suggest that these
effects may not be significant in this study.
A second limitation in this study is that the validity of the data collected is a
consequence of the respondents’ understanding of the questions and willingness to
answer them honestly. Even though the questionnaire was pretested and the respondents
were promised anonymity, invalid data may be collected in any mail survey because the
questions were misunderstood.
152
Third , the survey sample was predominantly made up of Caucasian males; thus,
the generalizability of the results may be limited. However, time and financial constraints
precluded a broader-based examination of the topic.
Fourth, because a complete listing of all franchisees is not currently available,
tentative generalization about the population were based on a selected representative
sample, broader generalization of the results would require a truly random sample of a
defined population.
Fifth, the author collected data from only one side of the dyad. To what extent the
franchisor’s and franchisee’s perceptions of relationship quality would converge is
unknown. Therefore, it would be desirable to further investigate the bilateral value
perception process and how the franchisor’s value perceptions and the franchisee’s value
perceptions are related. In this study, only investigated the franchisees in the restaurant
industry were investigated. This restricts the applicability of the results to a single
industry. Both the relationship scale and the model need to be validated in other
industries before generalizations can be made about other industries.
Lastly, one must be cautious in interpreting these findings due to non-response
bias. The potential problem with non-response is the possibility that non-respondents will
differ from respondents with respect to the survey variables, in which case the survey
estimates will be biased.
153
6.3 Main Contribution of the Study and Suggestion for Further Research
The results of this study offer both theoretical and practical contributions to the
improvement of the restaurant franchising industry. First, the final model supplies a
franchisor with valuable information for establishing an effective management strategy to
improve the relationship between franchisor and franchisee and to prevent turnover. This
study provides an analysis of the predictors of a quality relationship between the
franchisor and the franchisee. The final model will increase an understanding of the
relationships between the predictors of a quality relationship, the franchisee’s
performance, the franchisee’s satisfaction, and the franchisee’s commitment to the
relationship. Second, the predictors identified for this study will provide a useful tool for
restaurant franchising companies to use in examining franchise satisfaction. Once the
franchisor understands the variables leading to franchisee’s satisfaction, changes can be
implemented to reduce conflict and improve the overall performance of the franchisee.
The strength of this study is that a deliberate attempt was made to utilize well-
regarded instruments that are extensively used in research. Past franchise-related studies
have been plagued with definitional and measurement problems, which gives limited
confidence in the results. For the scale that was developed, confirmatory factor analysis
was used for construct validation, and reliabilities of all multi-item indices were
examined to ensure the consistency of scores.
Apart from its methodological strengths and limitations, the present study makes a
number of important contributions. This study is the first to examine the
154
interrelationships among the motivation to be a franchisee, the evaluation of franchisor’s
support, the perception of franchisor’s brand name, the quality of the relationship, the
franchisee’s job performance, job satisfaction, and commitment to the relationship.
Moreover, the results extend individual findings of past research in the franchise
literature and provide initial support for a model of the consequences of franchisee
satisfaction.
Future research using a more comprehensive measure of quality of the
relationship would be useful and might include the measurement of franchisors in the
relationship between franchisee and franchisor. Given the fact that the results of this
study leave a significant amount of variance unexplained in the organizational outcomes,
more comprehensive research on each of these constructs independently may also be
beneficial. Lastly, research should also focus on the franchisor’s personality and attitudes
towards the franchisee, since it is the strategic partnership of these two parties which
ensures effective franchise operations.
Another issue that could be addressed in future research would be to include
actual turnover as the ultimate outcome of interest. This raises other questions regarding
the appropriate time-frame to consider, as well as using a dichotomous, single-indicator
variable in an otherwise completely latent model. It is also important to recognize that
recent estimates indicate that the relationship between turnover commitments and actual
turnover is only about .36, corrected for measurement error (Hom, Caranikas-Walker,
Prussia, and Griffeth, 1992). The study has also shown that intention to quit is the single
best predictor of actual turnover in organizations.

155
The present study contributes to a better understanding of the role of personality
in organizational settings by means of several key findings. The first of these findings
stems from the results of the measurement model test. The confirmatory factor analysis
results of the hypothesized measurement model indicate a generally good fitting solution.
The findings from the structural model test also provide interesting insights into
the role of perception of the franchise system in predicting work-related outcomes. The
results of the study clearly support the notion that the quality of the relationship between
the franchisee and franchisor play a pivotal role in enhancing relational outcomes. In a
business era where building a lasting franchisee-franchisor relationship is critical, the
knowledge that the motivation of the franchisee and the evaluation of the franchisor’s
support can affect these relationship is indeed useful to practitioners and academics. In
general, it could be said that the data were consistent with the hypothesized relationships.
6.4 Summary and Conclusions
This study is likely to make conceptual contributions to the literature. First, it
potentially adds to a better understanding of the formation of the franchisee’s perceived
value. As summarized, there are two general ways through which the quality of the
relationship affects the franchisees perceived value: (1) The quality of the relationship
directly increases job satisfaction and performance; and (2) The quality of the
relationship reduces the franchisee’s commitment to quit.
This study also attempted to offer a relatively complete definition of the quality of
the relationship including the three dimensions of motivation, evaluation, and brand
156
name. This conceptual definition clearly captures the mutuality aspect of a franchisor-
franchisee relationship. The measures for this construct performed acceptably on
reliability and validity tests. Further, the validity of this construct and its scale were
indicated by the fact that all paths emitting from this construct were supported. The
criterion construct of the franchisee’s commitment was explained by the franchisee’s
perception of the quality of the relationship, of the franchisee’s perception of the level of
performance, and perception of job satisfaction.
This study develops a model that describes what factors are the most important to
the franchisee, how a high quality relationship differs from a low quality relationship, and
how this relationship affects outcomes. This study is based on seven antecedent behavior
constructs drawn from the literature of the franchisee-franchisor relationship. The test of
the model provides strong empirical support for the pattern of influences it portrays. In
particular, these findings confirm the social exchange construct that is theorized by LMX,
which can also apply to the relationship between franchisor and franchisee.
157
REFERENCES
Aaker, D. A. (1991). Managing Brand Equity, New York: Free Press.
Aaker, D. A. and Keller, K. L. (1990). Consumer Evaluations of Brand Extensions. Journal of
Marketing, 54 (January), 27-41.
Agres, S. J. and Dubitsky, T. M. (1996). Changing needs for Brands. Journal of Advertising
Research, 36(1), 21- 31
Anderson, E. E. (1984). The Growth and Performance of Franchise Systems: Company vs.
Franchisee Ownership. Journal of Economics and Business, 36, 421-431.
Anderson, R. L., Condon, C. , and Dunkelberg, J. (1992). Are Franchisees Real Entrepreneurs?
Journal of Business & Entrepreneurship, 4(1), 97-105.
Anderson, J.C. and Gerbing, D.W. (1988). Structural equation modeling in practice: A review and
recommended two-step approach. Psychological Bulletin, 103, 411-423.
Arrow, K. J. (1969). The economics of agency. Reprinted in J. Pratt and R. Zeckhauser, eds.,
Principals and agents: The Structure of Business, Boston. MA: Harvard Business School
Press, 1985, pp. 37-51.
Ayling, D. (1988). Franchising in the U.K. Quarterly Review of Marketing, Summer,
19-24.
Bagozzi, R. P. (1980). Causal Models in Marketing. New York: John Wiley.
Bagozzi, R. P. and Phillips, L. W. (1982). Representing and Testing Organizational Theories: A
Holistic Construal. Administrative Science Quarterly, 27, 459-489.
158
Bagozzi, R. P. and Yi, Y. (1988). On the Evaluation of Structural Equation Models. Journal of
Academy of Marketing Science, 16 (Spring), 74-94.
Bagozzi, R. P. and Heatherton, T. F. (1994). A General Approach to Representing Multifaceted
Personality Constructs: Application to state Self-esteem. Structural Equation Modeling,
1, 35-67.
Banerji, S and Simon, C. J. (1992). Franchising versus Ownership. Working paper, University of
Chicago.
Baron, S. and Schmidt, R. (1991). Operational aspects of retail franchises. International Journal
of Retail and Distribution Management, 19 (2), 13-19.
Baucus D. A., Baucus M. S. , and Human S. E. (1993). Choosing a Franchise: How Base Fees
and Royalties relate to the Value of the Franchise. Journal of Small Business
Management, April, 91-104.
Bauer, T. N. and Green, S. G. (1996). Development of leader-member exchange: A longitudinal
test. Academy of Management Journal, 39 (6), 1538-1567.
Bates, T. (1995). Analysis of Survival Rates among Franchise and Independent Small Business.
Journal of Small Business Management, April, 26-36.
Bearden, W. O. and Teel, J. E. (1983). Selected Determinants of Consumer Satisfaction and
Dissatisfaction and Complaint Reports. Journal of Marketing Research, February, 21-28.
Bentler, P.M. (1980). Multivarite Analysis with Latent Variables: Causal Modeling. Annual
Review of Psychology, 31, 419-456.
Bentler, P.M. (1985). Theory and Implementation of EQS: A Structural Equation Program. Los
Angels: BMDP Statistical Software.
159
Bentler, P.M. (1989). EQS Structural Equations Program Manual. Los-Angels, CA: BMDP
Statistical Software.
Bentler, P.M. (1990). Comparative Fit Indexes in Structural Models. Psychological Bulletin, 107,
238-246.
Bentler, P.M. (1992). EQS Structural Equations Program Manual. Los-Angels, CA: BMDP
Statistical Software.
Bentler, P.M. and Bonett, D.G. (1980). Significance tests and goodness-of-fit in the analysis of
covariance structures. Psychological Bulletin, 88, 588-606.
Bentler, P.M. and Chou, C.P. (1987). Practical issues in structural modeling. Sociological
Methods and Research, 16, 78-117.
Bergen, M., Dutta, S. and Walker, O. C. (1992). Agency relationships in marketing: A review of
the implications and applications of agency and related theories. Journal of Marketing, 56
(July), 1-24.
Berry, L. L., Zeithaml, V. A., and Parasuraman, A. (1985). Quality Counts in Services, Too.
Business Horizons, 28 (May/June), 44-52.
Billings, R. S. and Wroten, S. P. (1978). Use of path analysis in industrial/organizational
psychology: Criticism and suggestions. Journal of Applied Psychology, 63, 677-688.
Blair, R. D. and Kaserman, D. L. (1982). Optimal Franchising. Southern Economic Journal,
October, 494-504.
Blau, P. M. (1967). Exchange and Power in Social Life. New York: Wiley.
Bluedorn, A. C. (1978). A Taxonomy of Turnover. Academy of Management Review, July, 647-
651.

160
Bluedorn, A. C. (1982). A Unified Model of Turnover from Organizations. Human Relations, 36,
135-153.
Bojanic, D. C. (1996). Consumer Perceptions of Price, Value and Satisfaction in the Hotel
Industry: An Exploratory Study. Journal of Hospitality & Leisure Marketing, 4 (1), 5-22.
Bollen, K. A. (1989). A New Incremental Fit Index for General Structural Equations Models.
Sociological Methods and Research, 17, 303-316.
Bollen, K. A. (1990). Overall fit in Covariance Structure Models: Two types of Sample Size
Effects. Psychology Bulletin, 107, 256-259.
Bollen, K. A. and Lennox, R. (1991). Conventional Wisdom on Measurement: A Structural
Equation Perspective. Psychology Bulletin, 110, 305-314.
Bollen, K. A. and Long, J. S. (1994). Testing-Structural Equation Models. Newbury Park, CA:
Sage
Borys, B. and Jemison, D. B. (1989). Hybrid Arrangement as Strategic Alliances: Theoretical
Issue. Academy of management, 14 (2), 234-250.
Bradach, J. L. (1992). The Organization of the Franchise Relationship: The Role of the Franchise
Consultant. In Proceedings Annual Meeting of the Society of Franchising edited by
Kaufmann.
Bradach, J. L. (1997). Using the plural form in the management of restaurant chains.
Administrative Science Quarterly, 42 (2), 276-303.
Bradach, J. L. and Eccles, R. G. (1989). Price, Authority and Trust: From Ideal Types to Plural
Forms. Annual Review of Sociology, 15, 97-118.
Bradach, J. L. and Kaufmann, P. (1988). Franchisee or Independent Business person: Some
Observations on the Decision Process. Research at the Marketing/Entrepreneurship

161
Interface, University of Illinois, Chicago, 38-48.
Brannick, M. T. (1995). Critical Comments on Applying Covariance Structure Modeling. Journal
of Organizational Behavior, 16, 201-213.
Brickley, J. A., and Dark, F. H. (1987). The Choice of Organization Form: The Case of
Franchising. Journal of Financial Economics, 18, 401-420
Brickley, J. A., Dark, F. H., and Weisbach, M. S. (1991). An agency perspective on franchising.
Financial Management, 20 (1), 27-35.
Broniarczyk, S. M. and Alba, J. W. (1994). The Importance of Brand in Brand Extension. Journal
of Marketing, 31 (May), 214-228.
Brown, J. R. (1981). A cross-channel comparison of supplier-retailer relations. Journal of
Retailing, 57 (Winter), 3-18.
Brown, J. R. and Day, R. L. (1981). Measures of Manifest Conflict in Distribution Channels.
Journal of Marketing Research, August, 263-274.
Brown, J. R., Lusch, R. F., and Nicholson, C. Y. (1995). Power and Relationship Commitment:
Their Impact on Marketing Channel Member Performance. Journal of Retailing, 71 (4),
363-392.
Burton, S., Lichtenstein, D. R., Netemeyer, R. G., and Garretson, J. A. (1998). A Scale for
Measuring Attitude toward Private Label Products and an Examination of Its
Psychological and Behavioral correlates. Journal of the Academy of Marketing Science,
26 (4), 293-306.
Byrne, B. M. (1986). Specification Searches in Covariance Structure Modeling. Psychological
Bulletin, 100, 107-120.
Byrne, B. M. (1989). A Primer of LISREL: Basic Applications and Programming for
Confirmatory Factor Analytic Models. New York: Springer-Verlag.
162
Byrne, B. M. (1994). Structural Equation Modeling with EQS and EQS/Windows: Basic
Concepts, Applications, and Programming. Thousand Oaks, CA:Sage
Byrne, B. M., Shavelson, R. J., and Muthen, B. (1989). Testing for the Equivalence of Factor
Covariance and Mean Structures: The Issue of Partial Measurement Invariance.
Psychological Bulletin, 105, 456-466.
Cadotte, E. R., Woodruff, R. L., and Jenkins, R. L. (1987). Expectations and Norms in Models of
Customer Satisfaction. Journal of Marketing Research, 24 (August), 305-314.
Campbell, D. T. and Fiske, D. W. (1959). Convergent and Discriminant Validation by the
Multitrait-multimethod Matrix. Psychological Bulletin, 56, 81-105.
Candilis, W. O. (1978). The Growth of Franchising. Business Economics, 15-19.
Carmines, E. G. and Zeller, R. A. (1979). Reliability and Validity Assessment. No. 7 in series:
Quantitative Applications in the Social Science, Sage Publication, Beverly Hills.
Carmines, E. G. and Zeller, R. A. (1988). Reliability and Validity Assessment. Beverly
Hills: Sage.
Carney, M., and Gedajlovic, E. (1991). Vertical Integration in Franchise System: Agency
Theory and Resource Explanations. Strategic Management Journal, 12, 607-629.
Carsten, J. M. and Spector, P. E. (1987). Unemployment, Job Satisfaction, and Employee
Turnover: A Meta-Analytic Test of the Muchinsky Model. Journal of Applied
Psychology, 72, 374-381.
Casciari, M. A., and Drizner, P. S. (1996). A Case Study: Who is the Employer. Franchising
World, May/June, 28-30.
Castleberry, S. B. and Tanner, J. F. (1986). The Manager-Salesperson Relationship: An
Exploratory Examination of the Vertical-Dyad Linkage Model. Journal of Marketing

163
Research, 30 (August), 63-77.
Castrogiovanni G. J., Bennett, N. , and Combs J. G. (1995). Franchisor Types: Reexamination
and Clarification. Journal of Small Business Management, January, 45-54.
Castrogiovanni G. J., Justis, R. T., and Julian S. D. (1993). Franchise Failure Rates: An
Assessment of Magnitude and Influencing Factors. Journal of Small Business
Management, April, 105-114.
Caves, R. E., and William, F., and Murphy, H. (1976). Franchising: Firms, Markets, and
Intangible assets. Southern Economic Association, 42, 572-586.
Chintagunta, P. K. and Jain, D. (1992). A Dynamic Model of Channel Member Strategies for
Marketing Expenditures. Marketing Science, 11 (2), 168-189.
Churchill, G. A. and Suprenant, C. (1982). An Investigation into the Departments of Consumer
Satisfaction. Journal of Marketing Research, November, 491-504.
Churchill, G. A., Ford, N. M. Jr., and Walker, O. C. Jr. (1974). Measuring the Job Satisfaction of
Industrial Salesmen. Journal of Marketing Research, 11 (August), 254-260.
Churchill, G. A., Ford, N. M. Jr., and Walker, O. C. Jr. (1976). Organizational Climate and Job
Satisfaction in the Salesforce. Journal of Marketing Research, 13 (November), 323-332.
Churchill, G. A., Ford, N. M. Jr., and Walker, O. C. Jr. (1979). Personal Characteristics of
Salespeople and Attractiveness of Alternative Rewards. Journal of Business Research, 7
(1), 25-50.
Churchill, G. A., Ford, N. M. Jr., Hartley, S., and Walker, O. C. Jr. (1985). Determinants of Sales
Performance: A Meta-Analysis. Journal of Marketing Research, 22 (May), 103-118.
Clegg, C. W. (1983). The Psychology of Employee Lateness, Absence, and Turnover. Journal of
Applied Psychology, 68, 88-101.

164
Clopton, S. W. (1984). Seller and Buying Firm Factors Affecting Industrial Buyers’ Negotiation
Behavior and Outcomes. Journal of Marketing Research, 21(February), 39-53.
Cobb-Walgren, C. J., Ruble, C. A., and Donthu, N. (1995). Brand equity, brand preference, and
purchase intent. Journal of Advertising, 24 (3), 25-41.
Combs, J. G., and Castrogiovanni, G. J. (1994). Franchisor Strategy: A Proposed Model and
empirical Test of Franchise vs. Company Ownership. Journal of Small Business
management, April , 37-48.
Cook, K. S. (1986). Social Exchange Theory. SAGE Publications.
Cotton, J. and Tuttle, J. (1986). Employee Turnover: A Meta-Analysis and Review with
Implications for Research. Academy of Management Review, 11(1), 55-70.
Crant , J. M. (1996). The Proactive Personality Scale as a Predictor of Entrepreneurial
Commitments. Journal of Small Business Management, July, 42-49.
Crimmins, J. C. (1992). Better Measurement and Management of Brand Value. Journal of
Advertising Research, 32 (July/August), 11-19.
Cronbach, L. J. (1951). Coefficient Alpha and the Internal Structure of Tests. Psychometrika, 16,
297-334.
Crosby, L. A., Evans, K. R., and Cowles, D. (1990). Relationship Quality in Services selling: An
Interpersonal Influence perspective, Journal of Marketing, 54(July), 68-81.
Curran, J. and Stanworth, J. (1983). Franchising in the modern economy towards a theoretical
understanding. International Small Business Journal, 1, 53-60.
Dansereau, F., Graen, G. B., and Haga, W. J. (1975) A vertical dyad linkage approach to
leadership within formal organizations: A longitudinal investigation of the role making
process. Organizational Behavior and Human Performance, 13, 46-78.

165
Dant, R. P. (1995). Motivation for Franchising: Rhetoric vs. Reality. International Small Business
Journal, 14 (Winter), 10-32.
Dant, R. P., Kaufmann, P. J., and Paswan, A. K. (1992). Ownership Redirection in Franchised
Channels. Journal of Public Policy & Marketing, 11(1), 33-44.
Dant, R. P., Paswan, A. K., and Kaufmann, P. J (1996). What We know about Ownership
Redirection in Franchising: A Meta-Analysis. Journal of Retailing, 72, 429-444.
Dant, S. P. (1996). Ownership Structure in Franchising: the Effects of Transaction Costs,
Production Costs and Strategic Considerations. The International Review of Retail,
Distribution and Consumer Research, 52-75.
Day, D. V., Bedeian, A. G., Conte, J. M (1998). Personality as Predictor of Work-Related
Outcomes: Test of a Mediated Latent Structural Model. Journal of Applied Social
Psychology, 28, 2068-2088.
Deluga, R. J. (1998). Leader-Member Exchange Quality and Effectiveness Ratings. Group &
Organization Management, 23 (2), 189-216.
DelVecchio, S. K. (1996). Predicting sales manager control: A comparison of control-system and
leadership approaches. Journal of Applied Business Research,12 (4), 100-114.
DelVecchio, S. K. (1998). The quality of salesperson-manager relationship: The effect of latitude,
loyalty and competence. The Journal of Personal Selling & Sales Management, 18 (1),
31-47.
Dev, C. and Brown, J.R. (1991). Franchising and Other Operating Arrangements in the Lodging
Industry: A Strategic Comparison. Hospitality Research Journal, 23-41.
Dienesch, R. M. and Liden, R. C. (1986). Leader-member exchange model of leadership: A
critique and further development. Academy of Management Review, 11, 618-634.
166
Doll, W. J., Raghunathan, T. S., Lim, J., and Gupta, Y. P. (1995). A Confirmatory Factor
Analysis of the User Information Satisfaction Instrument. Information System Research,
6 (2), 177-189.
Duarte, N. T., Goodson, J. R., and Klich, N. R. (1993). How do I like thee? Let me appraise the
ways. Journal of Organizational Behavior, 14, 239-249.
Duarte, N. T., Goodson, J. R., and Klich, N. R. (1994). Effects of Dyadic Quality and Duration on
Performance Appraisal. Academy of Management Journal, 37, 499-521.
Dubinsky, A. J. and Hartley, S. W. (1986). A Path-Analytic Study of a Model of Salesperson
Performance. Academy of Marketing Science, 14 (1), 36-46.
Dunchon, D., Green, S. G., and Taber, T. D. (1986). Vertical dyad linkage: A longitudinal
Assessment of Antecedents, Measures, and Consequences. Journal of Applied
Psychology, 71, 56-60.
Dunegan, K. J., Duchon, D., and Uhi-Bien, M. (1992). Examining the Link between Leader-
Member Exchange and Subordinate Performance: The Role of Task Analyzability and
Variety as Moderators. Journal of Management, 18, 59-76.
Eden, D. (1990a). Pygmalion without interpersonal contract effects: Whole groups gain from
raising manager expectation. Journal of Applied Psychology, 75, 394-398.
Eden, D. (1990b). Acute and Chronic Job Stress, Strain, and Vacation Relief. Organizational
Behavior and Human Decision Process, 45 (April), 175-193.
Eden, D. (1992). Leadership and Expectations: Pygmalion Effects and other self-fulfilling
Prophecies in Organizations. Leadership Quarterly, 3, 271-305.
Eden, D. and Shani, A. B. (1982). Pygmalion goes to boot camp: Expectancy, leadership, and
trainee performance. Journal of Applied Psychology, 67, 194-199.

167
Edens, F. N, Self, D. R., and Grider, D. T. (1976). Franchisors Describe Ideal Franchisee. Journal
of Small Business Management (July), 39-47.
Ekeh, P. P. (1974). Social Exchange Theory. Harvard University Press, Cambridge, MA.
Elaine, E. and Lord R. G. (1997). Implicit Theories, Self-schemas, and Leader-Member
Exchange. Academy of Management Journal, 40 (4), 988-1010.
Elango, B. and Fried, V. H. (1997). Franchising research: A literature review and synthesis.
Journal of Small Business Management, 35 (3), 68-81.
Ellen, W., Brodt, S. E., Korsgaard, A. and Werner, J. M. (1998). Managers as initiators of trust:
An exchange relationship framework for understanding managerial trustworthy behavior.
Academy of Management, 23 (3), 513-530.
Engel, J. F., Kollat, D. T., and Blackwell R. D. (1973). Consumer Behavior, Second Edition.
Chicago, Holt, Rinehart, and Winston.
Engel, J. F., Blackwell, R. D., and Miniard, P. W. (1990). Consumer Behavior, 6th Edition, The
Dryden Press, Chicago, IL.
Engle, E. M. and Lord, R. G. (1997). Implicit theories, self-schemas, and leader-member
exchange. Academy of Management Journal, 40 (4), 988-1010.
English, W., Josiam, B., Upchurch, R. S., and Willemw, J. (1996). Restaurant Attrition: A
Longitudinal Analysis of Restaurant Failures. International Journal of Contemporary
Hospitality Management, 17-20.
Erickson, E. H. (1950). Childhood and Society. New York: Norton.
Ewing, M. T., Fowlds, D. A., and Shepherd, Ian R. B. (1995). Renaissance: A case study in brand
revitalization and strategic realignment. The Journal of Product and Brand Management,
4 (3), 19-27.
168
Farquhar, P. H. (1989). Managing Brand Equity. Marketing Research, 1, 24-33
Felstead, A. (1994). Shifting the frontier of control: Small firm autonomy within a franchise.
International Journal of Small Business, 12 (2), 50-62,
Festinger, L. (1957). A Theory of Cognitive Dissonance. Stanford, CA:Stanford University Press.
Fiol, C. L. and Lyles, M. A. (1985). Organizational Learning. Academy of Management Review,
10 (40, 803-813.
Flint, D. J., Woodruff, R. B., and Gardial, S. F. (1997). Customer Value Change in Industrial
Marketing Relationships: A Call for New Strategies and Research. Industrial Marketing
Management, 26, 165-173.
Fornell, C. and Larcker, D. F. (1981). Evaluating Structural Equation Models with unobservable
Variables and Measurement Error. Journal of Marketing Research, 18, 39-50.
Forward, J. , and Fulop, C. (1993). Elements of a Franchise: The Experiences of Established
Firms. The Service Industry Journal, 13 (4), 159-178.
Forward, J., and Fulop, C. (1996). Large Established Firms’ Entry into Franchising: an
Exploratory Investigation of Strategic and Operational Issues. The International Review
of Retail, Distribution and Consumer Research, 34-51.
Frazier, G. L. (1983a), On the Measurement of Interfirm Power in Channels of Distribution.
Journal of Marketing Research, May, 158-166.
Frazier, G. L. (1983b), Interorganizational Exchange Behavior in Marketing Channels: A
Broadened perspective. Journal of Marketing, 47, 74-75.
Frazier, G. L., Gill, J. D., and Kale, S. H. (1989). Dealer Dependence Levels and Reciprocal
Actions in Channels. Journal of Marketing, 53 (1), 50-70.
169
Frick, J. G. (1996). Restrictions on the termination of franchise agreements: a foreigner’s view.
Commercial Law Journal, 101 (1), 81-99.
Fulop, C. and Forward, J. (1997). Insight into franchising: A review of empirical and theoretical
perspectives. The Service Industries Journal, 17 (4), 603-625.
Gaski, J. F. (1984). The Theory of Power and Conflict in Channels of Distribution. Journal of
Marketing, 48 (Summer), 9-29.
Gaski, J. F. (1986). Interrelationships Among a Channel Entity’s Power Sources: Impact of
Reward and Coercion on Expert, Referent, and Legitimate Power Sources. Journal of
Marketing Research, February, 62-77.
Gaski, J. F. and Nevin, J. (1985). The Differential Effects of Exercised and Unexercised Power
Sources in a Marketing Channel. Journal of Marketing Research, May, 130-142.
Gerbing, D. W. and Anderson, J. C. (1992). Monte Carlo Evaluations of Goodness of Fit Indices
for Structural Equations Models. Sociological Methods and Research, 21, 132-160.
Gergen, K. J., Greenberg, M. S., and Willis, R. H. (1980). Social Exchange: Advances in Theory
and Research. Plenum Press, New York.
Goodman, J. (1980). Franchisor-franchisee conflicts of interest as perceived by selected non-food
franchisees’. Ph. D. Dissertation Abstracts International, NY: New York University.
Gough, H. G. (1987). The California Psychological Inventory Administrator’s Guide. Palo Alto,
CA: Consulting Psychologist Press.
Graen, G. B., Orris, J. B., and Johnson, T. w. (1973). Role assimilation processes in a complex
organization. Journal of Vocational Behavior, 3, 395-420.
Graen, G. B. and Cashman, J. (1975). A role-making model of leadership in formal organizations:
A developmental approach. In J. G. Hunt & L. L. Larson (Eds.),

170
Leadership frontiers:143166. Kent State University Press.
Graen, G. B., and Schiemann W. (1978). Leader-Member Agreement: A Vertical Dyad Linkage
Approach. Journal of Applied Psychology, 63 (April), 206-212.
Graen, G. B., Liden, R. C., and Hoel, W. (1982). The Role of Leadership in Employee
Withdrawal Process. Journal of Applied Psychology, 67, 868-872.
Graen, G. B., Novak, M. A., and Sommerkamp, P. (1982). The Effects of Leader-Member
Exchange and Job Design on Productivity and satisfaction: Testing a Dual Attachment
Model. Organizational Behavior and Human Performance, 30 (August), 109-131.
Graen, G. B., Scandura, T. A., and Novak, M. A. (1986). When Manager Decide not to Decide
Autocratically: An Investigation of Leader-Member Exchange and Decision Influence.
Journal of Applied Psychology, 71 (4), 579-584.
Graen, G. B., and Scandura, T. A. (1987). Toward a psychology of dyadic organizing. Research
in Organizational Behavior, 9, 175-208.
Graen, G. B., and Uhi-Bien, M (1995). Relationship-based approach to leadership: Development
of leader-member exchange (LMX) theory of leadership over 25 years: Applying a multi-
level multi-domain perspective. Leadership Quarterly, 1, 1-23.
Graen, G. B., Wakabayashi, M., Graen, M. R., and Graen, M. G. (1990). International
Generalizability of American Hypotheses about Japanese Management Progress: A
Strong Inference Investigation. Leadership Quarterly, 1, 1-23.
Grewal, D., Monroe, K. B., and Krishnan, R. (1998). The effects of price-comparison advertising
on buyers’ perceptions of acquisition value, transaction value, and behavioral
commitments.
Journal of Marketing, 62 (2), 46-58.
Gronroos, C. (1983). Strategic Management and Marketing in the Service Sector. Boston:
Marketing Science Institute.

171
Guiltinan, J. P., Rejab, I. B., and Rodgers, W. C. (1980). Factors Influencing Coordination in a
Franchise Channel. Journal of Retailing, 56 (3), Fall, 41-58.
Hair, J. F., Anderson, R. E., Tatham, R. L., Black, W. C. (1995). Multivariate Data Analysis with
Readings. Englewood Cliffs, NJ: Prentice Hall.
Harvey, R. J., Billings, R., and Nilan, K. J. (1985). Confirmatory Factor Analysis of the Job
Diagnostic Survey: Good News and Bad News. Journal of Applied Psychology, 70 (3),
461-468.
Hatcher, L. (1994). A Step by Step Approach: To Using the SAS System for Factor Analysis and
Structural Equation Modeling. Cary, NC: SAS Institute Inc.
Hayduk, L. (1987). Structural Equation Modeling with LISREL. Baltimore, MD: John Hopkins
Press.
Hayek, F. A. (1989). The Collected Works of F. A. Hayek. Chicago, IL: University of Chicago
Press.
Hays, R. D., Marshall, G. N., Wang, E. Y., and Sherbourne, C. D. (1994). Four-year Cross-lagged
Associations between physical and Mental Health in the Medical Outcomes Study.
Journal of Consulting and Clinical Psychology, 62, 441-449.
Heath, A. (1976). Rational Choice & Social Exchange. Cambridge University Press, London.
Herold, D. M. (1977), Two-Way Influence Processes in Leader-Follower Dyads. Academy of
Management Journal, 20 (2), 224-237.
Hing N. (1995). Franchisee Satisfaction: Contributors and Consequences. Journal of Small
Business Management, April, 12-25.
Hing N. (1996). Maximizing Franchisee Satisfaction in the Restaurant Sector. International
Journal of Contemporary Hospitality, August, 24-31.

172
Hite, C. F., Hite, R. E., and Minor, T. (1991). Quality Uncertainty, Brand Relaance, and
Dissipative Advertising. Academy of marketing Science, 19 (2), 115-122.
Hoffman, R. C., and Preble, J. F. (1991). Franchising : Selecting a Strategy for Rapid Growth.
Long Range Planning, 24 (4), 74-85.
Hom, P. W., Caranikas-Walker, F., Prussia, G. E., and Griffeth, R. W. (1992). A Meta-Analytical
Structural Equation Analysis of Model of Employee Turnover. Journal of Applied
Psychology, 77, 890-909.
Hough, J. L. (1986). Power and Authority and their Consequences in Franchise Organizations: A
Study of the Relationship between Franchisors and Franchisees. London. Ph. D.
University of Westminster.
Hoyle, R. H. (1995). Structural Equation Modeling: Concepts, Issues, and Applications.
Thousand Oaks, CA: Sage.
Hoyle, R. H. and Smith, G. T. (1994). Formulating Clinical Research Hypotheses as Structural
Equation Models: A Conceptual Overview. Journal of Consulting
and Clinical Psychology, 62, 429-440.
Hu, L. and Bentler, P. M. (1995). Evaluating Model Fit. In R. H. Hoyle (Ed.), Structural
Equation Modeling: Concepts, Issues, and Applications. Thousand Oaks, CA: Sage.
Huddleston, P. and Cassill N. L. (1990). Female Consumers’ Brand Orientation: The Influence of
Quality and Demographics. Home Economic Research Journal, 18 (3), 255-262.
Hughes, M. A., Price, R. L., and Marrs, D. W. (1986). Linking Theory Construction and Theory
Testing: Models with Multiple Indicators of Latent Variables, Academy of Management,
11 (1), 128-145.
Hunt, S. D. (1972). The Socioeconomic Consequences of the Franchise System of
Distribution. Journal of Marketing, 36, 32-38.
173
Hunt, S. D. (1973). The Trends Toward Company-Operated Units in Franchise Chains. Journal
of Retailing, 49 (2), Summer, 3-12.
Hunt, S. D., and Nevin, J. R. (1974). Power in a Channel of Distribution: Sources and
Consequences. Journal of Marketing Research, XI (May), 186-193.
Hunt, S. D., and Nevin, J. R. (1975). Tying Agreements in Franchising. Journal of Marketing, 39
(July), 20-26.
Hunt, S. D., and Nevin, J. R. (1976). Full Disclosure laws in Franchising: An Empirical
Evaluation. Journal of Marketing, 40 (April), 61.
Hunt, S. D. (1977). Franchising: Promises, Problems, Prospects. Journal of Retailing, 53(3),
Fall, 71-84.
Iaffaldano, M. T. and Muchinsky, P. M. (1985). Job satisfaction and job performance: A Meta-
analysis. Psychological Bulletin, 97, 251-273.
International Franchise Association. (1995). Franchise Fact sheet. Washington D.C.:
International Franchise Association.
International Franchise Association. (1996). Franchise Opportunities Guide. Washington D.C.:
International Franchise Association.
International Franchise Association Educational Foundation (1992). Franchising in the Economy
1988-1990, Washington D. C.: IFAEF
International Note (1995). Franchising Systems Around the Globe: A Status Report. Journal of
Small Business Management, April, 80-88.
James, L. R., Mulaik, S. A., and Brett, L. M. (1982). Causal analysis: Assumptions, models, and
data. Beverly Hills, CA:Sage.

174
Jensen, M. C. and Meckling, W. H. (1976). Theory of the Firm: Managerial Behavior, Agency
Costs and Ownership Structure. Journal of Financial Economics, 3, 305-360.
Jesitus, J. (1998). Franchising survey finds soaring satisfaction levels. Hotel and Motel
Management, 213 (9), May 18, 48-50.
Joreskog, K. G. and Sorbom, D. (1989). LISREL 7: A Guide to the Program and Applications.
Chicago: SPSS Inc.
Joreskog, K. G. and Sorbom, D. (1993a). LISREL 8: Structural Equation Modeling withthe
SIMPLIS Command Language. Hillsdale, NJ. SSI Inc.
Joreskog, K. G. and Sorbom, D. (1993b). New Features in LISREL 8. Chicago: SSI Inc.
Joreskog, K. G. and Sorbom, D. (1996). LISREL 8: User’s Reference Guide. Chicago, IL SSI Inc.
Julian, S. D., Castrogiovanni, G. J. (1995). Franchisor Geographic Expansion. Journal of Small
Business Management, April, 1-11.
Justis, R. T. and Judd, R. (1986). Master franchising: a new look. Journal of Small Business
Management, 24 (3), 16-21.
Justis, R. T. and Judd, R. (1989). Franchising. South-western Publishing Co., Cincinnati, Ohio.
Justis, R. T. and Chan, P. S. (1991). Training for Franchise Management. Journal of Small
Business Management, July, 87-91.
Justis, R. T., Olsen, J. E., and Chan, P. S. (1993). Using marketing Research to Enhance
Franchisee/Franchisor Relationship. Journal of Small Business Management, 31, 121-
127.
Kamakura, W. and Russell, G. (1993). Measuring Brand value with Scanner Data. International
Journal of Research in Marketing, 10 (March), 9-22.

175
Kaufmann, D. (1990a). New York Franchise Act Celebrates 10th Anniversary. New York Law
Journal, September 5, 1.
Kaufmann, D. (1990b). Franchising is alive and well, so let’s kill it. New York Law Journal,
September 25, 2.
Kaufmann, P. J. and Stern, L. W. (1988). Relational exchange norms, perceptions of unfairness
and retained hostility in commercial litigation. Journal of Conflict Resolution, 32 (3),
534-552.
Kaufmann, P. J. and Leibenstein, H. (1988). International Business Format Franchising and Retail
Entrepreneurship: A Possible Source of Retail Know-How for Developing Countries.
Journal of Development Planning, 18, 165-182.
Kaufmann, P. J. and Rangan, V. K. (1990). A Model for Managing System Conflict During
Franchise Expansion. Journal of Retailing, 66 (2), 155-173.
Kaufmann, P. J., and Dant, R. P. (1996). Multi-Unit Franchising : Growth and Management
Issues. Journal of Business Venturing,11, 343-358.
Kaufmann, P. J., and Stanworth, J. (1995). The Decision to Purchase a Franchise: A Study of
Prospective Franchisees. Journal of Small Business Management, October, 22-31.
Kee, H. W. and Knox, R. E. (1969). Conceptual and Methodological Considerations in the Study
of Trust and Suspicion. Conflict Resolution, 14 (3), 357-366.
Keller, K. L. (1993). Conceptualizing, Measuring, and Managing Customer-based Brand Equity.
Journal of Marketing, 57 (January), 1-22.
Keller, K. L. (1998). Strategic Brand Management: Building, Measuring, and Managing Brand
Equity. Upper Saddle River, NJ: Prentice Hall
176
Kelloway, E. K. (1995). Structural Equation Modeling in Perspective. Journal of Organizational
Behavior, 16, 215-224.
Kerin, R. A. and Sethuraman, R. (1998). Exploring the brand value-shareholder value nexus for
consumer goods companies. Academy of Marketing Science, 26 (4), 260-273.
Khan, M. A. (1992). Restaurant Franchising, New York, NY, Van Nostrand Reinhold.
Kirmani, A. and Wright, P. (1989). Money Talks: Perceived Advertising Expense and Expected
product quality. Journal of Consumer Research, 16 (December), 344-353.
Klein, B. (1980). Transaction Cost Determinants of ‘Unfair’ Contractual Arrangements.
American Economic Review Papers and Proceedings, 70, 356-362.
Klein, B., and Saft, L. F. (1985). The Law and Economics of Franchise Tying Contracts. Journal
of Law & Economics, 28, May, 345-361.
Klein, H. J. and Kim J. (1998). A field study of the influence of situational constraints, leader-
member exchange, and goal commitment on performance. Academy of Management
Journal, 41 (1), 88-95.
Knight, R. M. (1983). A Comparison of Franchisees and Independent Entrepreneurs. Frontiers of
Entrepreneurial Research, 167-179.
Knight, R. M. (1984). The Independence of the Franchise Entrepreneur. Journal of Small
Business Management, 22 (2), 53-61.
Knight, R. M. (1986). Franchising from the Franchisor and Franchisee points of view. Journal of
Small Business Management, 24 (3), 8-15.
Korman, A. K. (1968). Task Success, Task Popularity, and Self-esteem as Influences on Task
Linking. Journal of Applied Psychology, 52, 484-490.

177
Korman, A. K. (1970) Toward an Hypothesis of Work Behavior. Journal of Applied Psychology,
54, 31-41.
Kozlowski, S. and Doherty, M. L. (1989). Integration of Climates and Leadership: Examination
of a Neglected Issue. Journal of Applied Psychology, 74, 546-
553.
Krueger, A. B. (1991). Ownership, Agency, and Wages: An Examination of Franchising in the
Fast Food Industry. The Quarterly Journal of Economics, February, 75-100.
Lafontaine F. (1992). Agency Theory and Franchising: Some Empirical Results. RAND Journal
of Economics, 23 (2), Summer, 263-283.
Lafontaine F, and Kaufmann P. J. (1994). The Evolution of Ownership Patterns in Franchise
Systems. Journal of Retailing, 70 (2), 97-113
Lagace, R. R. (1990). Leader-Member Exchange: Antecedents and Consequences of the Cadre
and Hired Hand. Journal of Personal Selling & Sales Management, 10 (February), 11-19.
Lal, R. (1990). Improving Channel Coordination through Franchising. Marketing Science, 9, 299-
318.
Leach, P. (1994). The Stoy Hayward Guide to Family Business, 2d ed. London, England: Stoy
Hayward / Horwath International.
Leblebici, H. , and Shalley, C. E. (1996). The Organization of Relational Contracts: The
Allocation of Rights in Franchising. Journal of Business Venturing, 11, 403-418.
Lehtinen, J. R. and Lehtinen, U. (1982). Service Quality: A Study of Quality Dimensions.
Unpublished working paper. Helsiki: Service Management Institude.
Levitt, T (1986). The Marketing Imagination, New York: The Free Press.

178
Lewis, M. C. and Lambert, D. M. (1991). A Model of Channel Member Performance,
Dependence and Satisfaction. Journal of Retailing, 67 (2), 205-222.
Liden, R. C. and Graen, G. (1980), Generalizability of the Vertical Dyad Linkage Model of
Leadership. Academy of Management Journal, 23 (3), 451-465.
Liden, R. C., Wayne, S. J., and Stilwell, D. (1993). A longitudinal study on the early development
of leader-member exchanges. Journal of Applied Psychology, 78, 662-674.
Lillis, C. M., Narayana C. L., and Gilman J. L. (1976). Competitive Advantage Variation over the
Life Cycle of a Franchise. Journal of Marketing, 77-80.
Locke, E. A. (1968). Toward a theory of task motivation and incentives. Organization Behavior
and Human Performance, 3, 157-189.
Locke, E. A. (1976). The Nature and Consequences of Job satisfaction, in Handbook of Industrial
and Organizational Psychology, M.D. Dunnette, ed., Chicago: Rand McNally Publishing
Company.
Loehlin, J. (1992). Latent Variables Models. Erlbaum, Hillside, NJ.
Loken, B. and John, D. R. (1993). Diluting Brand Beliefs: When Do Brand Extensions Have
Negative Impact? Journal of Marketing, 57 (3), 71-84.
Long, J. S. (1983). Confirmatory Factor Analysis: A Preface to LISREL. Beverly Hills, CA:
Sage.
Louviere, J. and Johnson, R. (1988). Measuring Brand Image with Conjoint Analysis and Choice
Models. Measuring and Managing Brand Equity: A Conference Summary, report No. 88-
104, Lance Leuthesser, ed., Cambridge, MA: Marketing Science Institute, 20-22.
Lusch, R. F. (1976). Sources of Power: Their impact on intrachannel conflict. Journal of
Marketing Research, 13, (November), 382-390.
179
Lusch, R. F. (1977). Franchisee Satisfaction : Causes and Consequences. International Journal
of Physical Distribution, 7 (3), 128-140.
Lusch, R. F. and Brown, J. R. (1996). Interdependency Contracting, and Relational Behavior in
Marketing Channels. Journal of Marketing, 60 (October), 19-38.
MacCallum, R. C. and Browne, M. W. (1993) The Use of Causal Indicators in Covariance
Structure Models: Some Practical Issues. Psychological Bulletin, 114, 533-541.
MacCallum, R. C., Roznowski, M., and Necowitz, L. B. (1992). Model Modifications in
Covariance Structure Analysis: The Problem of Capitalization on Chance. Psychological
Bulletin, 111, 490-504.
Mahajan, V., Rao, V., and Srivaetava, R. (1990). Development , Testing, and Validation of Brand
Equity Under Conditions of Acquisition and Divestment. Managing Brand Equity: A
Conference Summary, Report No. 91-110, Eliot Maltz, ed., Cambridge, MA: Marketing
Science Institute, 14-15.
Mancuso, J., and Boroian, D. (1993). How to Buy and Manage a Franchise. Simon & Schuster,
New York.
Markland, R. E., and Furst, R. W. (1974). A Conceptual Model for Analysing Discrete
Alternative Franchising Portfolios: Design and Validation. Operational Research
Quarterly,25, 267-281.
Marsh, H. W., Balla, J. R., and McDonald, R. P. (1988). Goodness-of-fit Indexes in Confirmatory
Factor Analysis: The Effect of Sample Size. Psychological Bulletin, 103, 391-410.
Martin, E. (1996). Franchise. Colorado Business, March, 32-39.
Martin, R. E. (1988). Agency Theory and Franchising: Some Empirical Results. RAND Journal
of Economics, 23 (2), Summer, 263-283.
180
Maslyn, J. M., Farmer, S. M., and Fedor, D. B. (1996). Failed upward influence attempts:
Predicting the nature of subordinate persistence in pursuit of organizational goals. Group
& Organization Management, 21 (4), 461-480.
Mathewson, G. F. , and Winter, R. A. (1985). The Economics of Franchise Contracts. Journal of
Law & Economics, 28, October, 503-526.
Mayo, D., Robicheaux, R., and Ferrell, E. (1989). Franchisee satisfaction: Its Relationship to the
Contractual Agreement, unpublished manuscript.
McIntyre, F., Gilbert, F. and Young, J. (1994). Franchising: A Strategic Perspective. 8th
Conference of the Society of franchising, Nevada.
Miller, J. A. (1977). Studying Satisfaction, Modifying Models, Eliciting Expectations, Posing
Problems, and Making Meaningful Measurements. Conceptualization and Measurement
of Consumer Satisfaction and Dissatisfaction, H. Keith Hunt, ed. Bloomington, IN:
School of Business, Indiana University, 72-91.
Minkler, A. P. (1990). An Empirical Analysis of a Firm’s Decision to Franchise. Economic
Letters, 34, 77-82.
Mishra, D. P., Heide, J. B., and Cort, S. G. (1998). Information asymmetry and levels of agency
relationships. Journal of Marketing Research, 35 (3), 277-295.
Mobley, W. H. (1982). Employee Turnover causes, Consequences and Control. Reading, Mass.:
Addison-Wesley.
Mobley, W. H., Griffith, R. W., Hand, H. H., and Meglino, B. M. (1979). Review and Conceptual
Analysis of the Employee Turnover Process. Psychological Bulletin, 86 (3), 493-521.
Moorman, R. H. (1993). The influence of cognitive and affective based job satisfaction measures
on the relationship between satisfaction and organizational citizenship behavior. Human
Relations, 46 (6), 759-777.
181
Morrison, K. A. (1995). Why Do Firms Franchise? A test of Two Theoretical perspectives.
Journal of Small Business and Entrepreneurship, 12 (1), 84100.
Morrison, K. A. (1996). An Empirical Test of a Model of Franchisee Job satisfaction. Journal of
Small Business Management, July, 27-41.
Morrison, K. A. (1997). How franchise job satisfaction and personality affects performance,
organizational commitment, franchisor relation, and commitment to remain. Journal of
Small Business Management, 35 (July), 39-67.
Mowday, R. T., Steers, R. M., and Porter, L. W. (1979). The Measurement of Organization
Commitment. Journal of Vocational Behavior, 14, 224-247.
Mowday, R. T., Porter, L. W, and Steers, R. M. (1982). Employee-Organizational Linkage: The
psychology of commitment, absenteeism, and turnover. New York: Academic Press.
Mubleman J. (1996). The Franchise Relationship Channel. Franchising World, January/Februry,
20-24.
Mulaik, S. A., James, L. R., Van Alstine, J. V., Bennett, N., Lind, S., and Stilwell, D. (1989).
Evaluation of Goodness-of-fit indices for Structural Equation Models. Psychological
Bulletin, 105, 430-445.
Muller, C. C. (1998). Endorsed Branding. Cornell Hotel and Restaurant Administration
Quarterly, 39 (3), 90-96.
Mueller, C. W. and Price, J. L. (1990). Economic, Psychological and Sociological determinants
of Voluntary Turnover. The Journal of Behavior Economics, 19 (3), 321-335.
Murray, M. (1986). Decisions: A comparative critique. DePaul University: Pitman Publishing.
Meyer, J. P. and Allen, N. J. (1991). A Three-Component Conceptualization of Organizational
Commitment. Human Resource Management Review, 1, 61-98.

182
Meyer, J. P., Allen, N. J., and Smith, C. A. (1993). Commitment to Organizations and
Occupations: Extension and Test of a Three-Component Conceptualization. Journal of
Applied Psychology, 78 (4), 538-551.
Nevin, J. R., Hunt, S. D., and Ruekert, R. W. (1980). The Impact of Fair Practice Laws on a
Franchise Channel of Distribution. MSU Business Topics, Summer, 27-37.
Norton, S. W. (1988). An Empirical Look at Franchising as an Organizational Form. Journal of
Business, 61 (2), 197-217.
Nunnally, J. (1978). Psychometric Theory, New York: McGraw-Hill.
Oliver, R. L. (1974). Expectancy Theory Predictions of salesmen’s Performance. Journal of
Marketing Research, 11 (August), 243-253.
Oliver, R. L. (1977). Effect of Expectation and Disconfirmation on Post-Exposure Product
Evaluation: An Alternative Interpretation. Journal of Applied Psychology, 62 (April),
480-486
Oliver, R. L. (1979). Product Dissatisfaction as a Function of Prior Expectation and Subsequent
Disconfirmation: New Evidence. New Dimensions of Consumer Satisfaction and
Complaining Behavior. Eds. Ralph L. Day and H. Keith Hunt. Bloomington: Indiana
University, 66-71.
Oliver, R. L. (1980). A Cognitive Model of Antecedents and Consequences of Satisfaction
Decisions. Journal of Marketing Research, 17, November, 460-469.
Oliver, R. L. (1981). Measurement and Evaluation of Satisfaction Processes in Retail Setting.
Journal of Retailing, 57 (Fall), 25-48.
Oliver, R. L. (1989). Processing of the Satisfaction Response in Consumption: A Suggested
Framework and Research Propositions. Journal of Consumer Satisfaction, Dissatisfaction
and Complaining Behavior, 2, 1-16.
183
Oliver, R. L. (1993). A Conceptual Model of Service Quality and Service Satisfaction:
Compatible Goals, Different Concepts. Advances in Service Marketing and Management:
Research and Practice, Vol. 2, Teresa A. Swartz, David E. Bowen, and Stephen W..
Brown, eds. Greenwich, CT.: JAI Press.
Oliver, R. L. (1996). Varieties of Value in the Consumption Satisfaction Response. Advances in
Consumer Research, 23, 143-147.
Olson, J. C. (1976). Price as an Informational Cue: Effects on Product Evaluations. Working
Series in Marketing Research, College of Business Administration. The Pennsylvania
State University, paper No.43 (May).
Onkvisit, S. and Shaw, J. (1989). Service Marketing: Image, Branding, and Competition.
Business Horizons, 32 (1), 13-19.
Oxenfeldt, A. R., and Kelly, A. O. (1968). Will Successful Franchise Systems Ultimately Become
Wholly-Owned Chains? Journal of Retailing, 44 (4), 69-83.
Oxenfeldt, A. R., and Thompson, D. N. (1968). Franchising in Perspective. Journal of Retailing,
44 (4), 69-83.
Ozanne, U. B. and Hunt, S. D. (1971). The economic Effects of Franchising. U. S. Senate, Select
Committee on Small Business, Committee Print, 92d Cong., 1st sess. Washington, D. C.:
U. S. Government Printing Office.
Parasuraman, A., Zeithaml, V., and Berry, L. (1985). A Conceptual Model of Service Quality and
Its Implications for Future Research. Journal of Marketing, 49 (Fall), 41-50.
Parasuraman, A., Zeithaml, V., and Berry, L. (1988). SERV-QUAL: A Multiple-Item Scale for
Measuring Consumer Perceptions of Service Quality. Journal of Retailing, 64 (Spring),
12-40.
184
Padmanabhan, K. H. (1988). Channel Control : Do Successful Franchise systems Ultimately
Become Wholly-Owned Chains? The Journal of Midwest Marketing, 3(2), Fall, 17-36.
Parsa, H. (1994). Exploratory Investigation of Organization Power, and its Impact on Strategy
Implementation and firm Performance: A Study of the Hospitality Franchise Systems.
Doctoral dissertation, Virginia Tech, VA
Paulus, P. B. (1983). Basic Group Process. Springer-Verlag. New York.
Pedhazur, E. J. and Schmelkin, L. P. (1991). Measurement, Design, and Analysis: An Integrated
Approach. Hillsdale, NJ: Lawrence Erlbaum.
Peterson, A. and Dant, R. (1990). Perceived Advantages of the Franchise Option from the
Franchisees Perceptive: Empirical Insights from a Service Franchise. Journal of Small
Business Management, 28 (July), 46-61.
Ping, R. A. (1990). Responses to dissatisfaction in buyer seller relationships: Exit, voice,
aggression, loyalty, and neglect. Doctoral dissertation, University of Cincinnati, Ohio.
Porter, L. W. and Steers, R. M. (1973). Organizational, Work, and Personal Factors in Employee
Turnover and Absenteeism. Journal of Applied Psychology, 80 (August), 151-176.
Porter, J. L. and Renforth, W. (1978). Franchising Agreements: Spotting the Important Legal
Issues. Journal of Small Business Management, 16 (October), 27-31.
Porter, L. W. and Lawler, E. E. (1968). Managerial attitudes and performance. Homewood, IL:
Irwin.
Porter, L. W. and Steers, R. M., Mowday, R. T., and Boulian, P. (1974). Organizational
Commitment, Job Satisfaction, and Turnover Among Psychiatric Technicians. Journal of
Applied Psychology, 59 (5), 603-609.

185
Price, J. L. and Muller, C. W. (1986). Handbook of organizational measurement. Marshfield,
Massachusetts: Pittman Publishing.
Purvin, R. (1994). The Franchise Fraud. New York: John Wiley & Sons, Inc.
Quelch, J. A. and Ash, S. B. (1981). Consumer Satisfaction with Professional Services.
Marketing of Services. Eds. James H. Donnelly and William R. George. Chicago:
American marketing association, 82-85.
Regulation of the Franchising Industry (1994a). Hearing before the Federal Trade Commission
House Energy/Transportation and Hazardous Materials, 104th
Cong., 2d Sess. (testimony of C. White).
Regulation of the Franchising Industry (1994b). Hearing before the North American Securities
Administrators Association House Energy/Transportation and Hazardous Materials
Federal trade commission, 104th Cong., 2d Sess. (testimony of Steve Maxey).
Richardson, P.S., Dick, A. S., and Jain, A. K. (1994). Extrinsic and Intrinsic Cue on Perceptions
of Store Brand Quality. Journal of Marketing, 58 (October), 28-36.
Rindfleisch, A. and Heide, J. B. (1997). Transaction cost analysis: Past, present, and future
applications. Journal of Marketing, 61 (4), 30-54.
Rizzo, J. R., House, R. J., Lirtzman, S. E. (1970). Role Conflict and Ambiguity in Complex
Organizations. Administrative Science Quarterly, 15, 150-163.
Robinson, L. M. (1979). Consumer Complaint Behavior: A Review with Implications for Further
Research, New Dimensions of Consumer Satisfaction and Complaining Behavior, ed.
Ralph L. Day and Hunt, H. K. Bloomington, Ind.: Indiana University.
Rosenberg, L. J., and Stern, L. W. (1970). Toward the Analysis of Conflict in Distribution
Channels: A Descriptive Model. Journal of Marketing, 34, 40-46.

186
Rosenloom, B. (1973). Conflict and Channel Efficiency: Some Conceptual Models for the
Decision maker. Journal of Marketing, 37, July, 26-30.
Rosse, J. G., and Kraut, A. I. (1983). Reconsidering the Vertical Dyad Linkage Model of
Leadership. Journal of Occupational psychology, 56, 63-71.
Rubin, P. H. (1978). The Theory of the Firm and the Structure of the Franchise Contract. The
Journal of Law and Economics, 21, 223-231.
Russell, D. W., Kahn, J. H., Spoth, R., and Altmaier, E. M. (1998). Analysing Data from
Experimental Studies: Illustration of a Latent Variable Structural Equation Modeling
Approach. Journal of Counseling Psychology, 45, 18-29.
Sanghavi, N. (1991). Retail franchising as a growth strategy for the 1990s’. International Journal
of Retailing and Distribution Management, 19 (2), 4-9.
SAS Institute Inc. (1989). SAS/STAT User Guide, Version 6, Fourth Edition, Volume 1. Cary,
NC: SAS Institute Inc.
Scandura, T. A., and Graen, G. B. (1984). Moderating Effects of Initial Leader-Member
Exchange Status on the Effects of Leadership Intervention. Journal of Applied
Psychology, 69 (3), 428-436.
Scandura, T. A., Graen, G. B., and Novak, M. A. (1986). When managers decide not to decide
autocratically: An investigation of leader-member exchange and decision influence.
Journal of Applied Psychology, 71, 579-584.
Schriesheim, C. A., Neider, L. L., and Scandura T. A. (1998). Delegation and Leader-member
Exchange: Main Effects, Moderators, and Measurement Issues. Academy of Management
Journal, 41 (3), 298-318.

187
Schul, P. L. (1980). An Empirical Investigation of the Conflict Behavior Process in Franchise
Channels of Distribution. Dissertation Abstracts International.
Schul, P. L., Little, T. E., and Pride, W. M. (1985). Channel Climate: Its Impact on Channel
Members’ Satisfaction. Journal of Retailing, 61 (Summer), 9-38.
Schuler, R. S. (1975). Role Perceptions, Satisfaction, and Performance: A Partial Reconciliation.
Journal of Applied Psychology, 60 (December), 683-687.
Schwab, D. L. and Cummings, L. L. (1970). Theories of performance and satisfaction. Industrial
Relations, 9, 408-430.
Schwab, D. L. and Cummings, L. L. (1976). A Theoretical Analysis of the Impact of Task Scope
on Employee Performance. Academy of Management Review, 1 (June), 23-35.
Scott S. G. (1998). Hearing it through the grapevine: The influence of source, leader-relations,
and legitimacy on survivors’ fairness perceptions. Personnel Psychology, 51(1), 25-54.
Seid, M. S. (1988). Letter published in The Info Franchise Newsletter, 12, Info Press Inc.
Seid, M. H. (1993). Franchising Thrives in the ‘90s. Stores, 68-79.
Sen, K. C. (1991). Payment Design in Franchising. Doctoral Dissertation, Washington University
in St. Louis. MO
Sen, K. C. (1993). The Use of Initial Fees and Royalties in Business-format Franchising.
Managerial and Decision Economic, 14, 175-190.
Shane, S. and Spell, C. (1997). Exchanging new franchisor survival: A model and empirical test.
In Winning Strategy for Franchising: Current Research and Future Directions,
Proceedings of the 11th Conference of the Society of Franchising. Orlando, Florida, 1-40.

188
Shane, S. and Spell, C. (1998). Factors for New Franchise Success. Sloan Management Review,
39 (3), 43-50.
Sharkey, B. (1989). The People’s Choice. Adweek’s Marketing Week, 30 (November 27), 6-10.
Sherman, A. J. (1991). Franchising and Licensing: Two Ways to Build Your Business
Amacom, American Management Association.
Shelton, J. P. (1967). Allocative Efficiency vs. X-efficiency: Comment. American Economic
Review, 57, December, 1252-58.
Shivell, K., and Banning, K. (1993). Running a Successful Franchise. McGraw Hill, Inc. NY.
Shore, L. M. and Martin, H. J. (1989). Job Satisfaction and Organizational Commitment in
Relation to Work Performance and Turnover Commitments. Human Relations, 42, 625-
638.
Simpson, J. T. (1990). An empirical investigation of the impact of governance of marketing
channels of distribution. Ph. D. thesis, University of Alabama, Tuscaloosa, AL.
Smith, P. C., Kendall, L. M., and Hulin, C. L. (1969). The Measurement of Satisfaction inWork
and Retirement: A Strategy for the Study of Attitudes. Chicago: Rand McNally.
Spinelli, S., and Birley, S. (1996). Toward a Theory of Conflict in the Franchise System.
Journal of Business Venturing, 11, 329-342.
Stanworth, J. (1977). A Study of Franchising in Britain. London, England: University of
Westminster.
Stanworth, J., Stanworth, C., Granger, B., and Blythe, S. (1989). Who Becomes an Entrepreneur?
International Small Business Journal, 8 (1), 11-22.

189
Stanworth, J., and Kaufmann, P. J. (1994). Towards a Dynamic Model of Franchisee Motivation,
in Understanding and Accepting Different Perspectives: Empowering Relationships in
1994 and Beyond, Skip Swerdlow, ed., Minneapolis, Minnesota: University of St.
Thomas, Institute for Franchise Management, Paper No. 10.
Stanworth, J., and Kaufmann, P. J. (1996). Similarities and Differences in UK and US Franchise
Research Data: Towards a Dynamic Model of Franchisee Motivation. International
Small Business Journal, 14 (3), 57-70.
Stephenson, P. R., and House, R. G. (1971). A Perspective on Franchising. Business Horizons,
14, 35-42.
Stern, P. and Stanworth, J. (1994). Improving small business survival rates via franchising: the
role of the banks in Europe. International Small Business Journal, 12 (2), 15-25.
Swan, J. E. and Trawick, I. F. (1980). Satisfaction Related to Predictive vs. Desired Expectations
and Experiences in Evaluating Professional Service Quality. Refining Concepts and
Measures of Consumer Satisfaction and Complaining Behavior. Bloomington, IN:
Indiana University, 7-12.
Takahashi, T. and Nasser, F. (1996). The Impact of Using Item Parcels on Hoc Goodness of Fit
Indices in Confirmatory Factor Analysis: An Empirical Example. Paper Presented at the
Annual Meetings of the American Educational Research Association, New York.
Tanaka, J. S. (1987). “How big is enough?”: Sample size and Goodness of fit in Structural
Equation Models with Latent Variables. Child Development, 58, 134-146.
Tanner, J. F., and Castleberry, S. B. (1986). The Manager-Salesperson Relationship: An
Exploratory Examination of the Vertical-Dyad Image Model. Journal of Personal Selling
& Sales Management, 6 (November), 29-37.

190
Tanner, J. F., and Castleberry, S. B. (1990). Vertical Exchange Quality and Performance:
Studying the Role of the Sales Manager. Journal of Personal Selling & Sales
Management, 10 (Spring), 17-27.
Thomas, W. L., O’Hara, MJ., and Musgrave, F. W. (1990). The Effects of Ownership and
Investment on the Performance of Franchise Systems. American Economist, 34 (1), 54-
61.
Thompson, R. S. (1992). Company Ownership vs. Franchising: Issues and Evidence. Journal of
Economic Studies, 19 (4), 31-42.
Thompson, R. S. (1994). The Franchise Life Cycle and the Penrose Effect. Journal of Economic
Behavior and Organization, 24 (2), 207-218.
Tikoo, S. (1996). Assessing the franchise option. Business Horizons, 39 (3), 78-83.
Tse, D. K. and Wilton, P. C. (1988). Models of Consumer Satisfaction Formation: An Extension.
Journal of Marketing Research, 15 (May), 204-212.
Turban, D. B. and Jones, A. P. (1988). Supervisor-subordinates similarity: Types, effects, and
mechanisms. Journal of Applied Psychology, 73, 228-234.
Turban, D. B., Jones, A. P., and Rozelle, R. M. (1990). Influences of supervisor liking of a
subordinate and the reward context on the treatment and evaluation of that subordinate.
Motivation and Emotion, 14, 215-233.
Varadajan, R. (1986). Horizontal cooperative sales Promotion: A Framework for Classification
and Additional Perspectives. Journal of Marketing, 50, 61-73.
Vecchio, R. P. and Gobdel, B. C. (1984). The vertical dyad linkage model of leadership:
Problems and prospects. Organizational Behavior and Human Performance, 34, 5-20.
191
Walker, B. J., and Etzel, M. J. (1973). The Internationalization of U.S. Franchise Systems:
Progress and Procedures. Journal of Marketing, 37, 38-46.
Wayne, S. J. and Ferris, G. R. (1990). Influence tactics, affect, and exchange quality in
supervisor-subordinate interactions: A laboratory experiment and field study. Journal of
Applied Psychology, 75, 487-499.
Wayne, S. J., Shore, L. M., and Linden, R. C. (1997). Perceived organizational support and
leader-member exchange: A social exchange perspective. Academy of Management
Journal, 40 (1), 82-111.
Walker, O. C., Churchill, G. A., and Ford, N. M. (1972). Reactions to Role Conflict: The Case of
the Industrial Salesman. Journal of Business Administration, 3 (Spring), 25-36.
Walker, O. C., Churchill, G. A., and Ford, N. M. (1977). Motivation and Performance
in Industrial Selling: Present Knowledge and Needed Research. Journal of
Marketing Research, 14 (May), 156-168.
Wayne, S. J. and Ferris, G. R. (1990). Influence tactics, affect, and exchange quality in
supervisor-subordinate interactions: A laboratory experiment and field study. Journal of
Applied Psychology, 75, 487-499.
Wayne, S. J. and Green, S. A. (1993). The effects of leader-member exchange on employee
citizenship and impression management behavior. Human Relations, 46, 1431-1440.
Wayne, S. J. and Liden, R. C. (1995). Effects of impression management on performance ratings:
A longitudinal study. Academy of Management Journal, 38, 232-260.
Weinrauch, J. D. (1986). Franchising an Established Business. Journal of Small Business
Management, 24 (3), 1-7.
192
Weiss, D. J., Dawis, R. V., England, G. W., and Lofquist, L. H. (1967). Manual for the Minnesota
Satisfaction Questionnaire (Minnesota Studies in Vocational Rehabilitation: XXII).
Minneapolis: University of Minnesota, Industrial Relational Center Work Adjustment
Project.
Westbrook, R. A. (1987). Product/Consumption-Based Affective Responses and Postpurchase
Processes. Journal of Marketing Research, 24 (August), 258-270.
Westbrook, R. A. and Reilly, M. D. (1983). Value-Percept Disparity: An Alternative to the
Disconfirmation of Expectations Theory of Consumer Satisfaction. Advances of
Consumer Research, 10, 256-261.
Williams, L. J. (1995). Covariance Structural Modeling in Organizational Research: Problems
with the Method verse Applications of the Method. Journal of Organizational Behavior,
16, 225-233
Williams, L. J. and Brown, B. K. (1994). Method Variance in Organizational Behavior and
Human Research: Effects on Correlations, Path Coefficients, and Hypothesis Testing.
Organizational Behavior and Human Decision Process, 57, 185-209.
Williams, L. J., Cote, J. A., and Buckley, M. R. (1989). Lack of Method Variance in Self-
Reported Affect and Perceptions at Work: Reality or Artifact? Journal of Applied
Psychology, 74, 462-468.
Williams, R. G. (1994). The Development of Franchising in Germany. International Journal of
Management, 11 (1), 609-619.
Williamson, O. E. (1975). Markets and Hierarchies: Analysis and Antitrust Implications. New
York: The Free Press.
Williamson, O. E. (1979). Transaction-Cost economics: The Governance of contractual relations.
Journal of Law and Economics, 22, 233-261.

193
Williamson, O. E. (1981). The economics of organization: the transaction cost approach.
American Journal of Sociology, 87, 548-577.
Williamson, O. E. (1983). Organization form, residual claimants, and corporate control. Journal
of Law and Economics, 26, 351-366.
Williamson, O. E. (1985). The Economic Institutions of Capitalism: Firms, Markets, and
Relational Contracting. New York: The Free Press.
Williamson, O. E. (1991). Comparative economic organization: the analysis of discrete structural
alternatives. Administrative Science Quarterly, 36, 269-296.
Wimmer, B. S. and Garen, J. E. (1997). Moral hazard, asset specificity, implicit bonding, and
compensation: The case of franchising. Economic Inquiry, 35 (3), 544-554.
Withane, S. (1991). Franchising and Franchisee Behavior : An Examination of Opinions,
Personal Characteristics and Motives of Canadian Franchisee Entrepreneurs. Journal
of Small Business Management, January, 22-29.
Woll, M. (1968). Sources of Revenue to the Franchisor and Their Strategic Implications.
Journal of Retailing, 44 (4), Winter, 14-20.
Yammarino, F. J. (1997). Models of leadership for sales management. The journal of Personal
Selling & Sales Management, 17 (2), 43-56.
Young, R. F. and Greyser, S. A. (1983). Managing Cooperative Advertising: A Strategic
approach. Lexington, MA: D.C. Heath.
Zeithaml, V. A. (1988). Consumer Perceptions of Price, Quality, and Value: A Means-End Model
and Synthesis of Evidence. Journal of Marketing, 52 (July), 2-22.
Zeithaml, V. A., Parasuraman, A., and Berry, L. L. (1985). Problems and Strategies in Service
Marketing. Journal of Marketing, 49 (Spring), 33-46.
194
Zeithaml, V. A., Berry, L. L., and Parasuraman, A. (1988). Communication and Control
Processes in the Delivery of Service Quality. Journal of Marketing, 52 , 35-48.
Zeithaml, V. A, Berry, L. L. and ., Parasuraman, A. (1990). Delivering Quality Service Balancing
Customer Perceptions and Expectations. New York: The Free Press
Zeithaml, V. A, Berry, L. L. and ., Parasuraman, A. (1991). The Nature and Determinants of
Customer Expectations of Service. Marketing Science Institute, working paper No. 91-
113, Marketing science Institute, Cambridge, MA.
Zeller, R. E., Achabal, D. D., and Brown, L. A. (1980). Market Penetration and Locational
Conflict in Franchise Systems. Decision Sciences, 11, 58-80.