Embed Size (px)
Citation preview

Evaluating e-governmentM P Gupta and Jaijit Bhattacharya
Department of Management Studies Indian Institute of Technology, Delhi
Ashok Agarwal Convener, Computer Society of India
Director, ACS Technologies Ltd
AbstrAct
Return on investment is not the primary objective when e-government projects are conceived. They are mostly driven to achieve operational efficiency and effectiveness in service delivery. Governments run with tight budgets, hence there is an increasing demand to re-examine their spending priorities. Further, e-government programmes are subjected to scrutiny to find out whether they are delivering the payoff as has been promised or not. This paper focuses on the various parameters for evaluating the success of e-governance projects. A flexible framework is suggested to choose an appropriate strategy to measure the tangible and intangible benefits of e-government. E-government being a new phenomenon, at most places, e-government projects are still found to be in a nascent stage; hence proper information flow for calculating ‘return on e-government’ considering tangible and intangible benefits cannot be fully ascertained. Moreover an assessment of the same is not completely possible. There are three kinds of situations that require evaluation in e-government. One is the e-environment; second is evaluating the performance of an e-gov-ernment programme or project; and third is the overall impact of e-govern-ment on general government functioning, economic development and citizen servicing. Accordingly, we need three kinds of approaches of evaluation such as:• E-readiness assessment of states or region • Hierarchy of measures taken by the e-government programme or project• Overall impact of e-government
E-readiness Assessment of States or Region
Current practices of assessments are found in three directions:
1. Assessing e-Business Readiness (The Economist Intelligence Unit (EIU)’s e-business readiness rankings): EIU’s rankings is a guide to the relative pre-paredness of the world’s main markets for the e-business era. For perhaps the first time since the technology bubble burst, the global economy is be-ginning to feel comfortable in a digital skin. Spending on information and communications technology (ICT) is growing again with some buoyancy in developed markets. In emerging markets, expansion of connectivity –
Chapter 1

� e-Governance: Case Studies
individuals’ and organisations’ access to voice and data communications – continues on a rapid ascent. Broadband internet access, meanwhile, is beginning to reach critical mass in several countries and is becoming a catalyst for other improvements in the digital economy. The 2005 edition of the Economist Intelligence Unit’s e-readiness rankings, produced in co-operation with IBM’s Institute for Business Value, reflects the increasing importance of broadband to a country’s digital development. As a result, the world’s most developed broadband markets have registered significant score increases over 2004, although only some have moved up in the rank-ings.. Of the 65 countries covered, Denmark tops the list. India (49th) and China (54th) remain on the lower rungs of the e-readiness ladder, but are making growing contributions to the global digital economy on the strength of a strong ICT skill’s base (India) and a prodigious ICT manufacturing sec-tor (China).
2. Assessing e-Government (assesses the internet, democracy, and service delivery by state and federal governments): This is a study by Professor Dar-rell M. West of Brown University. His team evaluated government web sites based on two dozen criteria, including disability access, existence of pub-lications and data bases, presence of privacy and security policies, contact information, and the number of online services. The 2006 study reviewed 1,782 government web sites in 198 countries. A variety of different sites were analysed, including executive, legislative and judicial offices as well as such departments and ministries of the government as health, educa-tion, foreign affairs, interior, finance, natural resources, foreign investment, transportation, military, tourism and telecommunication. By evaluating the aforementioned features as well as others including PDA access, user fees, and foreign language translation, researchers rated each country on a zero to 100 point scale. Researchers found that 94 per cent of web sites have on-line publications and 72 per cent have links to data bases. Only 26 per cent (up from 18 per cent in 2005) show privacy policies and 14 per cent present security policies (up from 10 per cent in 2005). While Korea, Taiwan, Sin-gapore, US and Canada are at the top 5, India and China are ranked 76 and 77 in the ranking.
3. Assessing e-readiness (the ability for a nation/ region to benefit from In-formation and Communications Technology (ICT) [taken from Comparison of E-Readiness Assessment Models, Final draft, v. 2.13, 14 March 2001 (http://www.bridges.org/ereadiness/report.html]): It is increasingly clear that for a country to put ICT to effective use, it must be ‘e-ready’ in terms of infra-structure, the accessibility of ICT to the population at large, and the effect of the legal and regulatory framework on ICT use. Developing country can use e-readiness assessment to help measure and plan for ICT integration. (http://www.bridges.org/ereadiness/index.html)
Ideally speaking, a comprehensive e-readiness assessment should en-compass the first two assessments into it. They become different because of the choice of a definition, coverage of variables, level of detail and

Evaluating e-Government �
scope in the assessment. Literature reports many tools (see below) that use widely varying definitions for e-readiness and different methods for measurement. They can be divided into two main categories: those that focus on the basic infrastructure or a nation’s readiness for business or economic growth (can be described as ‘e-economy’ assessment tools), and those that focus on the ability of the overall society to benefit from ICTs (‘e-society’ assessment tools). These two categories are not mutually exclusive. However, ‘e-society’ tools incorporate business growth and use of ICTs as part of their larger analysis, and consider business growth necessary for society’s e-readiness. E-economy focused tools also include some factors of interest to the larger society, such as privacy and universal access. These rough categorisations are as follows:
E-Economy
• WITSA e-Commerce Survey • APEC's e-Commerce Assessment • McConnell International's e-Readiness Report • Mosaic's Global Diffusion of the Internet Framework • Crenshaw & Robinson's Cross-National Analysis of Internet Develop-
ment
E-Society
• CID's e-Readiness Assessment Guide • CSPP's e-Readiness Assessment Guide • The various models for evaluating e-readiness from 'digital divide' re-
ports • CIDCM’s Negotiating the Net Model
These tools use four main methods to assess countries’ e-readiness: questionnaires, statistical methods, best practices, and historical analyses. The right tool depends on the goal of the assessment. It is important to understand that there are many states/central government ministries in the ‘early’ stages of e-readiness, which may have to undergo massive economic and political changes to become e-ready. Also, it may be faulty to use a single standard of measurement for all entities. There is no single social, political, or economic model that can be called the most successful at har-nessing information technology. A solution to both of these problems could be to base the primary assessment on states/ central government ministries within a particular region or social/economic/political group. The assess-ment tool could be adapted for the region, and recommendations could be made based on similar experiences elsewhere. Additional data points and recommendations on how to become e-ready could be drawn, with caution, from the best practices and other examples seen in developed countries.
Though India has not been ranked high on these scores, there are sev-eral policy initiatives by Government of India (GoI) that will promote and

� e-Governance: Case Studies
enhance the use of IT in governance. There is now a separate Department of Information Technology to promote IT in the country. The government has also approved the policy of allocating 2–3% of the budget for IT in each ministry. The World Bank has announced its support of India’s initiative through a loan of $500 million over the next four years. The loan is for a network project to inter-link all the states and union territories under the National e-Governance Action Plan (NEGAP) which itself was launched in 2006 with an estimated investment of Rs.25000 core in the coming few years. In the Tenth Five Year Plan (2002–07), the Government of India has given adequate importance to e-governance by suggesting an India Portal – a portal of all government web sites so as to provide one-stop non-stop delivery of public services and dissemination of services. However the real challenge is that nearly 70% per cent of the Indian population is rural and the want of the telecommunication infrastructure makes providing the ben-efits of e-governance an uphill task.
In ‘India: E-Readiness Assessment Report 2003 for States/Union territo-ries’ submitted by NCAER to the Department of Information Technology, Ministry of Communication and Information Technology, the Government of India in the year 2004 has classified the states into five categories: lead-ers, aspiring leaders, expectants, average achievers, under achievers and laggards (Table 1).
Table 1: Ranking of Indian state governments for e-readiness
CategoryStates
2004–2005 2003–2004
Leaders Karnataka, Maharashtra, Tamil Nadu, Andhra Pradesh, Chan-digarh
Karnataka, Maharashtra, Ta-mil Nadu, Andhra Pradesh
Aspiring Leaders
Kerala, Gujrat, Goa, Delhi, Punjab
Gujrat, Goa, Delhi, Chan-digarh
Expectants West Bengal, Pondicherry, Madhya Pradesh
West Bengal, Uttar Pradesh, Kerala
Average Achievers
Uttar Pradesh, Chattisgarh, Orissa, Sikkim, Himachal Pradesh
Madhya Pradesh, Punjab,, Punjab, Pondichery
Below Aver-age Achiev-ers
Mizoram, Jammu & Kash-mir, Assam, Uttaranchal, Jharkhand,
Haryana, Rajasthan, Himach-al Pradesh, Uttaranchal, Chattisgarh, Orissa, Mizoram, Tripura, Meghalaya, Anda-man & Nicobar Inlands

Evaluating e-Government �
Least Achievers
Lakshadweep, Manipur, Tripura, Arunachal Pradesh, Andaman & Nicobar Inlands, Bihar, Daman & Diu, Dadra and Nagar Haveli, Nagaland
Assam, Jharkhand, Lak-shadweep, Bihar, Jammu & Kashmir, Sikkim, Arunachal Pradesh, Nagaland, Daman & Diu, Manipur, Dadra and Nagar Haveli, Nagaland
Source: INDIA: E-Readiness Assessment Report, 2003 and 2004
This index plays an important role in benchmarking best practices by various Indian state governments and trying to replicate these best prac-tices in other states. In this year 2004–2005, Chandigarh and Punjab has improved comparatively more than their 2003–2004 rating. Chandigarh has become a leader and Punjab has moved from the average achiever to the aspiring leader category. Uttar Pradesh has moved down from the expectant to the average achiever category. Sikkim, Assam and Jharkhand have also shown improvement in 2004–2005.
The e-readiness index is developed based on six broad parameters – net-work access, network learning, network society, network economy, network policy and e-governance. Each of these parameters is represented by a set of indicators and these indicators are again represented by a number of sub-indicators.
Hierarchy of Measures for an e-Government Programme or Project
This section is based on one of the author’s paper titled ‘E-government eval-uation: A framework and case study’, Government Information Qtly, Sym-posium issue, Dec (2003).
Methodologies may be classified in terms of the degree of hardness or softness (i.e., based on the clarity and nature of the influential variables) of a problem situation. Clearly defined problems are structured problems while poorly articulated or unclear problem situations are categorised as ill structured problems. Identifying the methods that match the underly-ing characteristics of a problem situation represents an issue that needs to be considered, especially in a complex situation. Operations research (OR), management science (MS) and applied systems disciplines have been traditionally offering quantitatively based, hard techniques. However, dur-ing the 1970s and 1980s a variety of qualitative, soft and critical methods were developed. According to Mingers1 the typical assumptions made by a hard OR/MS method are: that there is a single decision maker (or at least a consensual group) with a clear objective – if there are multiple objectives these are usually reduced to a single metric; that the nature of the problem is agreed upon, even though a good solution may be difficult to find; that the most important factors can be quantified and reliable data collected;

� e-Governance: Case Studies
that a model, often mathematical or computer-based, can be used to gener-ate solutions, and that this does not need to be transparent to the client(s); that the role of the OR person is one of an expert analyst; and that future uncertainties can be modelled using probability theory. On the other hand, soft methods can be characterised by the fact that these assumptions can-not be generally made. Typically, there might be several decision makers or stakeholders involved, with different opinions and possibly conflicting objectives and definitions of the problematic nature of the situation; there may be difficulties in quantification of many important factors; transpar-ency and accessibility of the model will be very important, thus often rul-ing out mathematical models; the OR person’s role will often be one of a facilitator with a group of participants; and uncertainties cannot be simply reduced to probabilities.
One important implication of this distinction is that these two different types of methods require quite different skills and orientations in their prac-titioners. Hard methods would demand a good analytical mind with math-ematical and computing skills, while soft methods require people skills and the ability to facilitate often stressful and contentious workshops. Ac-cording to Wolstenholme2, no map or model is ever a complete analysis and there is always a need for further speculation beyond the insights reached by their use. Furthermore, in applying any problem solving method, there is a need to create a balance between the need to remain sufficiently quan-titative to be applicable and rigorous and sufficiently flexible to be relevant in terms of both audience and method. This allows the possibility of com-bining methods or techniques together in a particular intervention, a prac-tice known as multi-methodology. Thus after a period of concern about the choice of methodology, we are now moving towards a pluralistic approach of combining together several methods within an intervention/ multi-meth-odology3.
E-government projects may be characterised by hybrid systems. In fact, a large part of e-government projects are soft systems, which are often prone to perceptual inconsistencies among designers and users. This often leads to failure of an elegant system. The system also has to match the ongoing changing pattern of relations or interactions within government organisa-tions, businesses and citizens. Here a combination of hard and soft systems methods would be suitable in addressing problems of evaluating e-gov-ernment projects. In general, any approach to evaluation of e-government projects needs to have a few important characteristics including the ability for understanding and modelling complex problems, the ability to incorpo-rate multiple views of the problem, and the ability to learn from mistakes. The literature on e-government offers few approaches, which have been found useful in selective evaluation. These are arranged in a broad cat-egory of methods for ease of understanding and methodological choice for determining information and servicing values attributable to the several as-pects of e-government benefits. The sociological evaluation of the benefits of these projects has also been emphasised. We have selected a few of the

Evaluating e-Government �
methods that are well known and easy to apply. However the framework is open to include other methods (not mentioned here) in its range depend-ing upon finding a satisfactory application. A broad categorisation is as follows:
i. Hard MeasuresCost–benefit analysisBenchmarks in e-government
ii. Soft MeasuresScoring methodStages of e-governmentSociological angle
iii. Hierarchy of Measures (6 levels)
Hard Measures
Here information is viewed as valuable when a message changes a decision maker’s expectations about the events in a manner that facilitates decisions and improves the expected payoffs. The information is weighed against a backdrop of cost–benefit analysis. It seeks to find answers to questions like how much money is being spent to acquire the information and how much benefit in monetary terms is being obtained. This issue has been dealt with most thoroughly in information economics, which finds its base in statistical sampling concepts, Bayesian statistics and statistical decision theory based research papers that appear mainly in accounting journals.
The main drawback of this approach lies in its operationalisation. Infor-mation and related services in e-government being an intangible organisa-tional resource, it is sometimes impossible to quantify the cost and value associated with obtaining and using it. Some benefits related to e-govern-ment such as improvement in communication with the users, better ap-preciation of the role of the information system (IS) within the organisation and better integration with business planning are difficult to assess using objective measures. Since the utility of information and related services is not direct, it has value only in so far as ‘better’ decision are made or they lead to an increase in resources or a decrease in cost.
Most importantly, improved organisational performance such as in-crease in transactions, ROI etc., is produced by a multitude of activities that take place concurrently. Thus, it is very difficult to measure or split the proportion of outcome as value contributed by information systems of e-government. Information can also have a psychological value if the user does not necessarily make better decisions but has more confidence in the correctness of his decision. Though the role of information at the strategic level is very crucial, and measurement of its worth in monetary terms is an

� e-Governance: Case Studies
impractical proposition. The trend henceforth would be to investigate the diffusion of IT solutions in terms of its impact on organisational effective-ness in performing and servicing the user better.
The key measurement criteria for measuring tangible benefits under hard measures are:
Cost–Benefit Analysis
For any organisation, prudent investment and deriving benefit in monetary terms is a very critical decision4. Public finance has considered important differences between goods provided by the government and goods owned by individuals – governmentally provided goods are often public goods, each person may be able to consume them at a price less than the marginal social cost, and the level of provision is determined by collective decisions rather than by markets5. There have been attempts to examine information technology (IT) capital investments (including software) and capital stock to check whether these investments are justifiable, by calculating the mar-ginal benefits and costs of IT related investments6. There is strong evidence that IT investment is not meant to cut costs but to achieve better customer service and quality7.
IT infrastructure in e-government is a long-term investment decision and involves a current outlay followed by a series of benefits over the life of the project. The evaluation of cost–benefit can be done in the traditional way or by following the time adjusted/discounted basis method. The average rate of return (ARR), the conventional method of appraisal, is unsatisfac-tory to the extent that it is based on accounting profits and ignores the time value of money. The payback method, which shows the recovery period of the original outlays, is superior to the ARR method in that it is calculated using cash flows. Nevertheless, it also ignores the time value of money and disregards the total benefits associated with the projects. Still it is useful as a measure of the liquidity of investments. The discounted cash flow methods in the net present value (NPV) approach satisfies all the attributes of a good measure of appraisal in e-government projects as it considers the total benefits as well as the timings of the benefits. The NPV method has the merit of consistency in assumptions relating to re-investment of funds released by the projects.
In this method, one important aspect is to determine the cost of capital by which future incremental cash flows are to be discounted. The cost of capital means the weighted average cost of capital of all long-term sources of finance. The cost of capital can be explicit or implicit. The explicit cost of capital is associated with the raising of funds. When the funds are internal-ly used, the cost is known as implicit cost in terms of the opportunity cost of foregone alternatives. Investments in infrastructure, training, etc., are noted. Extra business transactions and savings due to man-hours caused by streamlining of operations are calculated and translated into incremental revenue. Based on incremental revenue, the payback period is calculated

Evaluating e-Government �
by dividing investments with incremental revenue generation each year. The break-even period is calculated by discounting the amount earned as incremental revenue at the rate of cost of capital, which would be the same for the organisation by which the organisation is earning. There may be four types of specific costs, namely cost of debt, cost of preference shares, if any, cost of equity capital, and cost of retained earnings. The measurement of the overall cost of capital involves the choice of appropriate weights to each of these elements.
In the domain of e-government, computation is easy for many govern-ment organisations (public sector enterprises), which are listed and which raise debt and equity capital from the market,. However there are several governmental organisations, which are not listed and which mostly depend on central or state government aid to run their business operations without any implicit or explicit obligation to pay back the aided amount. The com-putation of cost of capital for these organisations by the traditional means given above might prove irrelevant or inadequate. In organisations, which are not listed but which generate revenue streams adequately to fund their own investments, the cost of capital should be that of retained earnings only.
In the e-government scenario, capital investment is made mainly to im-prove the quality of service unlike manufacturing organisations where the investment is mainly on machines in order to produce goods. In that case the payback period or break-even period can be computed easily. But for any service organisation where productivity of employees or better service of the organisation is concerned, the traditional cost–benefit analysis might not give a true picture. The biggest drawback about this system is that the true monetary value of benefits such as increased quality, faster service, flexibility, better customer or citizen service or improved working condi-tions for employees cannot be ascertained.
Benchmarks in e-Government Projects
Evaluation of e-government efforts is sought by the management to pro-vide strategic guidance for government organisations. A brief review of the same is reported by Kaylor et al.8 citing some interesting research9. These efforts share a general concern of identifying objective measures by which we might assess the quality of e-government. Most of these studies have often focused on content analysis or measures of usage. Benchmarking is a superior option as it provides a method of evaluating performance against best practice while also providing strategic guidance. Kaylor et al.vviii sug-gested a rubric for benchmarking implementation among cities nationwide using a broad range of functional dimensions and assigning municipalities ‘e-scores’.
One form of benchmarking is through metric benchmarking10, which provides numeric measures of performance, like
• IT expenses as a per cent of total revenues

10 e-Governance: Case Studies
• Per cent of downtime (when computer is not available)• CPU usage (as per cent of total capacity)• Per cent of IS projects completed on time and within budget as part of
e-government projects
In the Indian context, this might not be possible as most of the projects are in the rudimentary stage and only a few are operational. Therefore com-paring these starting projects with similar organisations in India or abroad would be a challenge since this form of information might not be available or the obtaining information might be difficult. A practical approach would be to experiment with the idea of ‘Best Practices Benchmark’ as suggested by Kaylor et al.viii Here emphasis is on assessing performance rather than numeric measures of performance. It mainly deals with IT infrastructure and compares the best practices in servicing provided by similar type of organisations and work areas. Grading is done from the perspective of implementation rather than the perspective of ‘end-users’. Table 2 lists se-lect activities of the municipalities, which though exhaustive, are not in-clusive. They are assigned score on a four point scale (called e-score) as given below:
• Information about a given topic exists at the web site (1)• Links to relevant contacts (phone or email address) exists at the web
site (2)• Downloadable forms available online on a given topic (3)• Transaction or other interaction can take place completely online. (4)
Table 2: Functions and services of municipalities
S.No. Payments Permits Services Licenses
1.2.3.4.5.
UtilitiesTaxesFinesPermitsRegistration
BuildingParkingStreet vendorSidewalk dining
ComplaintsPayment detailsInformation request
BikeDogTaxiBusiness
Based on the scores various municipalities can be graded. Figure 1 describes the result of a study for the New Delhi Municipal Corporation (NDMC). It is worth noting that in such a short span of time, NDMC has scored better than the municipalities of Detroit and Cleveland. However, the population of the NDMC area far exceeds that of Detroit where a small-scale e-government is in operation with far fewer complexities for civic amenities. If we compare the NDMC data with similar big cities, at least in terms of population and complexities, like New York and Seattle, NDMC’s score is abysmally low (15) compared to them (86–89). This means that to be at par with these leading cities, NDMC has to perform exception-ally well. It is expected that after full implementation of the e-government project, when many transactions can be done online, NDMC’s score will rise substantially. A more prudent approach to benchmarking would have

Evaluating e-Government 11
been to compare NDMC with other municipalities of India in order to gen-erate a benchmark among Indian municipalities.
Fig. 1 Adapted from the ‘Gauging e-government: A report on implementing services among American cities by Kaylor et.al.8
Soft Measures
Researchers have realised that though the normative approaches are theo-retically elegant they nonetheless present formidable operational difficul-ties in real-life situations. Furthermore, the significance of qualitative ben-efits is often ignored when an evaluation of these systems is made from an economic point of view. This may result in the neglect or rejection of many potential new systems which offer high returns but from intangible benefits. Benefits such as improved decision making, customer or citizen satisfaction and employee productivity contribute significantly to higher performance. In view of this, an effort at finding a compromise solution to evaluate e-government is the need of the hour. Soft approaches employ multi-dimensional attribute measures of information value, which is rel-evant in the context of e-government. Simultaneous consideration of mul-tiple attributes facilitates the understanding of the extent and depth of the problem.
Scoring Method
Scoring methodologies are used in many evaluation situations. It focuses on key organisational objectives. To use the scoring methodology11, the analyst first identifies all the key performance issues and assigns a weight to each

1� e-Governance: Case Studies
of them. Finally the weighted average of all the attributes is calculated. The organisation with the highest score is judged the best service provider in comparison to similar organisations.
This approach can incorporate both tangible and intangible benefits. If there is a strong connection between a benefit accrued due to investment in IT infrastructure of e-government, it will influence the final score even if it does not have a monetary value. Thus the scoring model helps solve the problem of assessing intangible benefits by linking the evaluation of these benefits to the factors that are most important to organisational per-formance. The approach can also take risk into account, by using negative weights for factors that reduce the profitability, operability and user satis-faction.
Stages of e-Government
A literature survey of the area demonstrates that the experience of e-gov-ernment initiatives has been chaotic and unmanageable. The problems present a number of challenges for public administrators. To help public administrators take an organisational view of transforming a traditional ad-ministrative organisation to an e-government, Layne and Lee12 describe dif-ferent stages of the development of e-government with particular reference to the United States of America. The four stages of development outline the structural transformations of governments as they progress toward an electronically-enabled government and how the internet-based government models become amalgamated with traditional public administration imply-ing fundamental changes in the form of government. The underlying theory of this growth model will be applicable to other governments as well.
Based on technical, organisational and the managerial studies of several examples, e-government is found to be an evolutionary phenomenon and therefore e-government initiatives should be accordingly derived and im-plemented. In this regard, the four stages of a growth model for e-govern-ment are described as: (I) cataloguing, (II) transaction, (III) vertical integra-tion, and (IV) horizontal integration. These four stages are explained below in terms of the complexity and different levels of integration involved. The stages are also depicted in Fig. 2 with the stage at which NDMC is in right now mapped in.
Stage I: Cataloguing (online presence, catalogue presentation, download-able forms) In this stage, governments create a ‘state web site’. They do not have much internet expertise, and prefer to minimise risks by doing a small project. Parts of the government’s non-transactional information are put on the site. Usually at first, the index site is organised on the basis of functions or departments as opposed to service access points. Consequent-ly, if the citizen is unsure of which department he or she is searching for, a search for the necessary agency will be required before being able to obtain the information about the process.

Evaluating e-Government 1�
Stage II: Transaction (Services and forms are online, working data base supporting online transactions) This stage empowers citizens to deal with their governments online anytime, saving hours of paperwork, the incon-venience of travelling to a government office and time spent waiting in line. Registering vehicles or filing state taxes online is only the beginning of such transaction-based services. Consequently, instead of simply having the availability of downloading a form, and then having to take that form to a state facility, the form can be completed interactively online.
Stage III: Vertical Integration (local systems linked to higher level systems, within similar functionality) Information is made available through the citizen’s local portal. The citizen-user will be able to access the service at the state or centre level from the same entry in the local portal, because the local systems are connected to upper level systems, directly or indirectly.
Stage IV: Horizontal Integration (systems integrated across different func-tions, real one-stop shopping for citizens) The horizontal integration of government services across different functions of government will be driv-en by visions of efficiency and effectiveness in using information technol-ogy, but pulled by citizens’ demands for an ‘inside-out’ transformation of government functions to more service-oriented ones. Here e-government offers the best hope for improved efficiencies through administrative re-form because of both its vertical and horizontal integration. Such integra-tion will facilitate ‘one-stop shopping’ for the citizen. Each organisation may have to give up some power to move to this stage.
Sociological Angle
Whenever new technologies come into the picture, especially in govern-mental organizations, there is fear among the employees about job loss in terms of the Voluntary Retirement Scheme (VRS) although direct retrench-ment is still only a distant possibility in the public sector in countries like India. This might be true in many other countries as well. Increased trans-parency brought in by more automation might not be acceptable to a certain section of the employees who will always resent these initiatives. Moreo-ver, the apathy involved in the assimilation of new technologies must not be underestimated.
An opinion survey would be useful to gauge the responses of employees’ adaptability and responsiveness to the new systems. The area that could be looked into include the bureaucratic hurdles faced in moving toward an alternative delivery arrangement, the level of transparency and account-ability of the employees in new collaborative arrangements, and the likely road ahead for e-government (a resistance to change or regressive deploy-ment, status quo or incremental change, and radical adaptation for a digital world).
The responsibility of selling the benefits of e-government to the employ-ees lies with the top management. Accordingly, the HR department can be

1� e-Governance: Case Studies
sensitised (as e-government is foremost a top-down approach) to make em-ployees knowledgeable about the benefits of e-government as well as giving them the necessary training.
Fig. 2: Adapted from ‘Developing fully functional e-government: A four stage model’ by Layne & Lee 9
Hierarchy of Measures
A good method is required to determine the criteria for evaluation, to de-velop the means to measure the variables for which criteria are established and then test these with the help of the relevant data. We can consider three types of valuation. The first would address the value of an organisation-wide infrastructure. Factors such as a communication network, a standardised data management approach and an IS architecture impact and benefit to the entire organisation must be evaluated in this context. This is one of the more difficult things to evaluate because benefits stem not from a network but from the applications it supports. The second would consider the ap-plications implemented to support specific or multiple functions within an organisation. IT does not directly produce value. The value is in its impact

Evaluating e-Government 1�
upon the organisation. The third area of concentrated IT support is at the level of the individual user. It can be very diverse in terms of the amount of use and the ability of the user to take advantage of the type and amount of available computer-based support. This diversity makes assessing the value of IT use very complex. No single measurement tells the complete story. A combination of measuring tools is desirable, among them counting trans-actions, industrial engineering kind of evaluations and interviewing those who are actually involved, including both direct and indirect personnel and managers. These measurements may not be precise from an accounting standpoint, although they represent information that can be used to satisfy senior officers. Feltham13 defined numerous characteristics of information to which we may attach quantitative as well qualitative measures. This has been developed into a flexible framework for choosing an appropri-ate strategy in a continuum of quantitative to qualitative approaches for determining information value attributable to the several aspects of ‘return on information’14. Return on information focused on viewing the role of in-formation strategically. This refers to developing a functional view of the organisation, identifying specific functions at various levels of management to analyse how IS/IT is able to improve that function and develop meas-urements of performance for that. A similar approach can be devised for measuring the ‘return on e-government”.
This concept is useful in the context of corporations, such as SAP A.G., which used a logo statement to drive home the point that enterprise soft-ware like SAP R/3 should be viewed strategically. It is generally felt that the enormous success of this enterprise resource planning (ERP) package can be explained by such a positioning strategy. It is clear that we can generate a significant return on information, the value of which would be more than the investment by developing a strategic view of information. The telecom industry is a good example of this. One piece of information derived from several bits of data gave a new direction to the whole industry – it was found that the cost of billing constituted half the entire operating cost. This included the cost of metering, bill posting and money locked up for months when the process of collecting bills is underway. So, any scheme that could reduce the cost of billing would naturally lead to a great pull up on the bottom-line. This single piece of information led to many imaginative schemes such as calling cards, credit card calling and fixed rate billing. In fact, fixed rate billing as an option has now practically become the de-facto standard in the US. Inter-net-based business opportunities are also following the paths of the telecom industry and moving in this direction. This is also the case with the computer hardware industry, which has realised the need for promoting energy saving devices. The green PC movement led to the offshoot of the idea of ‘sleep mode’ for monitors, disc drives, etc., saving hundreds of megawatts of power.
It is tempting to use a more general approach in determining the value of e-government. A flexible framework or hierarchy of measure, offering a continuum of choices would help. The framework ‘return on e-government’ refers to developing a functional view of the government organisation,

1� e-Governance: Case Studies
identifying specific functions at various levels of administration to analyse how IT is able to improve those functions and develop a measurement of performance for them. After measuring the tangible and intangible ben-efits pertinent to e-government, an evaluation framework may be evolved to fit the evaluation criteria in a more generic approach to determining the value of an information system with regards to e-government. This can be fit into hierarchy measures as ‘return on e-government’, attributable to IT applications for governance, both tangible and intangible as shown in Table 3. While using the framework suggested in Table 3, it must be examined which level of measure is applicable in a specific context. The first prefer-ence is obviously for the measure of net return in dollar terms. The next best option is to explore identifying specific costs that are increased due to the installation of the new system. This may provide a conservative evalu-ation of the sub-division of benefits. If we fail to measure changes in costs and revenues, an attempt should be made to measure the improvements in the performance of administrative and managerial functions, i.e. improve-ment in the quality of planning and control. If the above schemes fail, we may consider measuring the quality of decisions that contribute to plan-ning and control. As we go up the management hierarchy, development of measurement of performance becomes difficult as it deals with complex functions, particularly at the strategic level where much information is qualitative and probabilistic.
Eventually, what comes to the fore is not how to quantify the contri-bution of e-government, but to consider how useful the information and services are in the context of its use. Information and services, which are useful, have value. Usefulness can be defined in terms of the performance of its attributes such as validity, accuracy, clarity, reliability, timeliness, relevancy, sufficiency, message content, freedom from bias, comparability, scope of multiple users, data base and cost. These contribute to the value of information and services. A conglomeration of these attributes represented by a composite quality index, define ‘e-government performance index’. An illustration is presented in Table 4 for NDMC.

Evaluating e-Government 1�Ta
ble
3 M
easu
rem
ent
hie
rarc
hy
attr
ibu
tabl
e to
‘Ret
urn
on
e-g
over
nm
ent’
Hie
rarc
hy
in t
he
per
form
ance
Ch
ange
th
at i
s m
easu
red
leve
l 1
Ret
urn
on
in
vest
men
tR
up
ees/
Dol
lars
Leve
l 2
Tota
l co
sts
and
rev
enu
esR
up
ees/
Dol
lars
Leve
l 3
Imp
rove
men
t in
qu
alit
y of
Tim
e re
quir
ed t
o w
ork
out
pla
ns,
pla
nn
ing
and
con
trol
Cos
t of
pla
nn
ing,
Man
ager
ial
tim
e re
quir
ed f
or c
ontr
ol, D
egre
e of
au
tom
atio
n,
Fore
war
nin
g, C
ost
of c
ontr
ol.
Leve
l 4
Qu
alit
y of
dec
isio
ns
Freq
uen
cy o
f fa
ilu
res/
reve
rsal
of
dec
isio
ns,
Nu
mbe
r of
alt
ern
ativ
es e
xam
ined
, T
ime
requ
ired
for
dec
isio
ns,
N
um
ber
of d
ecis
ion
s, A
vail
abil
ity
of d
ecis
ion
su
pp
ort
syst
ems,
Cos
t of
dec
i-si
on.
Leve
l 5
Val
ue
of i
nfo
rmat
ion
Use
fuln
ess
(i
n t
erm
s of
val
idit
y, a
ccu
racy
, cla
rity
, fre
quen
cy, s
uff
icie
ncy
, tim
elin
ess,
rel
i-ab
ilit
y, r
elev
ancy
, mes
sage
con
ten
t an
d c
ost)
.
Leve
l 6
Sys
tem
ch
arac
teri
stic
sN
um
ber
of p
eop
le r
equ
ired
, equ
ipm
ent
and
fac
ilit
ies,
res
pon
se t
ime,
fre
quen
cy
of b
reak
dow
ns,
in
pu
ts, o
utp
uts
, nu
mbe
r of
for
ms,
nu
mbe
r of
op
erat
ion
s,
nu
mbe
r of
sto
rage
s, s
izes
an
d q
ual
ity
of d
ata
ban
k, s
ize
and
qu
alit
y of
mod
el
ban
k, f
lexi
bili
ty, s
imp
lici
ty, d
egre
e of
au
tom
atio
n, s
cop
e of
bu
sin
ess
com
-p
onen
ts t
hat
are
rel
ated
by
the
MIS
, use
r sa
tisf
acti
on, e
rror
rat
es, p
ersi
sten
t p
robl
em a
reas
, eas
e of
mai
nte
nan
ce a
nd
mod
ific
atio
n, u
np
lan
ned
-for
im
pac
t on
com
pan
y p
erfo
rman
ce, s
avin
gs, c
ost,
etc
.

1� e-Governance: Case StudiesTa
ble
4 M
easu
rin
g pe
rfor
man
ce o
f e-g
over
nm
ent
Hie
rarc
hy
Perf
orm
ance
Leve
l 1
RO
IFu
nd
amen
tall
y, N
DM
C i
s a
serv
ice
orga
nis
atio
n a
nd
doe
s n
ot n
eed
IT
to
be c
omp
etit
ive.
A
lso,
IT
can
not
be
con
sid
ered
in
iso
lati
on, h
ence
RO
I ca
nn
ot b
e p
rop
erly
just
ifie
d.
Mor
eove
r al
l th
e be
nef
its
can
not
be
quan
tifi
ed i
n m
onet
ary
term
s. H
ence
th
ey c
ann
ot b
e ju
stif
ied
in
ter
ms
of t
he
init
ial
inve
stm
ent
mad
e.
Leve
l 2
Tota
l co
sts
and
re
ven
ues
Init
ial
inve
stm
ents
mad
e by
ND
MC
to
CM
C i
s R
s 2
cror
e p
ayab
le i
n i
nst
allm
ents
aft
er e
ach
m
odu
le i
s im
ple
men
ted
. Th
is c
ost
excl
ud
es t
he
har
dw
are
com
pon
ents
. Th
is a
mou
nt
is
fun
ded
en
tire
ly i
n-h
ouse
as
ND
MC
is
cash
ric
h. I
t is
est
imat
ed t
hat
du
e to
im
pro
ved
op
era-
tion
s, a
uto
mat
ion
an
d p
rop
er d
ocu
men
tati
on a
nd
tra
nsp
aren
cy, i
ncr
emen
tal
reve
nu
e w
ill
incr
ease
ove
r th
e ye
ars,
bu
t ex
act
figu
res
are
yet
to b
e es
tim
ated
. Du
e to
au
tom
atio
n, t
he
tim
e re
quir
emen
t fo
r a
cert
ain
job
is l
ess
lead
ing
to i
mp
rove
d e
mp
loye
e p
rod
uct
ivit
y. T
her
e w
ould
, th
eref
ore,
be
a sa
vin
gs i
n m
anp
ower
(if
th
is i
s es
tim
ated
on
a m
an-h
our
rate
, wh
ich
is
cal
cula
ted
by
div
idin
g to
tal
reve
nu
e ea
rned
, div
ided
by
the
nu
mbe
r of
em
plo
yees
). T
he
reve
nu
e st
ream
s h
ave
to b
e d
isco
un
ted
at
actu
al i
nte
rnal
rat
e of
ret
urn
for
ND
MC
by
wh
ich
th
ey m
ake
thei
r in
vest
men
ts.
Leve
l 3
Imp
rove
men
t in
qu
alit
y of
pla
n-
nin
g an
d c
ontr
ol
Man
ager
ial
dec
isio
n t
akin
g ti
me
has
im
pro
ved
sig
nif
ican
tly
so f
ar w
ith
th
e d
egre
e of
au
to-
mat
ion
alm
ost
85%
. Bu
t th
ere
is n
o ch
ange
in
hie
rarc
hic
al c
ontr
ol o
f d
ecis
ion
mak
ing.
As
info
rmat
ion
flo
w i
s co
mp
arat
ivel
y fa
st a
nd
acc
ura
te, p
lan
nin
g an
d c
ontr
ol h
ave
imp
rove
d.

Evaluating e-Government 1�
Leve
l 4
Qu
alit
y of
dec
i-si
ons
Tax
pro
cess
ing,
pro
cess
ing
and
iss
ue
of b
irth
an
d d
eath
cer
tifi
cate
s h
ave
imp
rove
d s
ign
ifi-
can
tly.
Tim
e re
quir
ed t
o ta
ke a
ny
dec
isio
n h
as r
edu
ced
to
one
quar
ter
of t
he
orig
inal
tim
e.
Freq
uen
cy o
f d
ecis
ion
mak
ing
has
als
o in
crea
sed
. Bu
t ex
act
calc
ula
tion
abo
ut
tim
e sa
vin
gs
cou
ld n
ot b
e d
one,
as
ther
e is
no
atte
mp
t to
mai
nta
in s
yste
mat
ised
tim
e sh
eets
. Cer
tain
dat
a ar
e co
mm
on a
nd
ava
ilab
le t
hro
ugh
out
all
dep
artm
ents
– t
his
cen
tral
ised
dat
a ba
se s
yste
m
allo
ws
fast
er d
ata
acce
ss t
her
eby
red
uci
ng
dec
isio
n m
akin
g ti
me.
Leve
l 5
Val
ue
of i
nfo
rma-
tion
Du
e to
au
tom
atio
n, i
nfo
rmat
ion
gen
erat
ed i
s m
ore
freq
uen
t an
d t
he
tim
e re
quir
ed l
ess.
How
-ev
er i
n t
erm
s of
val
idit
y, r
elia
bili
ty, r
elev
ancy
, an
d m
essa
ge c
onte
nt,
alt
hou
gh i
t is
ass
um
ed
to b
e be
tter
, th
e ex
act
valu
e of
in
form
atio
n i
n t
he
pre
scri
bed
ter
ms
can
not
be
asce
rtai
ned
so
far.
Leve
l 6
Sys
tem
ch
arac
-te
rist
ics
IS f
or e
-gov
ern
men
t h
as c
ontr
ibu
ted
gre
atly
in
th
e p
erfo
rman
ce o
f N
DM
C s
o fa
r w
ith
sel
ect
mod
ule
s:M
ore
and
bet
ter
use
r in
terf
ace
G
riev
ance
s n
ow d
irec
tly
reac
h th
e ap
pro
pri
ate
auth
orit
y w
ho
is s
up
pos
ed to
ad
dre
ss th
e is
sue
R
edu
ctio
n i
n t
ime
for
any
busi
nes
s op
erat
ion
M
ore
tran
spar
ency
P
roce
ss i
mp
rove
men
t w
her
eby
lag
tim
e is
red
uce
d t
o al
mos
t h
alf
B
ette
r co
llec
tion
of
reve
nu
es i
n t
erm
s of
tax
an
d a
pp
rova
lO
nli
ne
dow
nlo
adin
g of
for
ms
and
in
man
y ca
ses
onli
ne
fill
ing
of t
axes
too
A
ll r
elev
ant
info
rmat
ion
ava
ilab
le o
nli
ne

�0 e-Governance: Case Studies
A Multi-Criteria Approach
The Government of India (GoI), through the Department of Information Technology (DIT), is keen to create a rational framework for assessing e-governance projects on various dimensions. The need for such a framework arises because of the recently announced (18 June 2006) National Action Plan on e-governance with an ambitious outlay of over Rs.25,000 crores involving public and private investments over the next four years. A signifi-cant portion of the National Action Plan involves replication of successful projects across different geographical areas of the country. A reliable and practical approach of appraisal, hence, would go a long way in such efforts. A reliable appraisal would also instill confidence in various stakeholders including bankers and private sectors, ensure correct review and direction and widespread replication of successful projects.
An early attempt by DIT was made through the Indian Institute of Man-agement Ahemdabad and National Institute of Smart Governance (NISG) who came up with an E-governance Assessment Framework (EAF) in May 2004. It had postulated various project categories like Government to Citi-zen (urban and rural), Government to Business and Government to Gov-ernment respectively. Also categorisation was done on the basis of project size.
As part of the Computer Society of India (CSI) – Nihilant National E-governance Awards during 2005, our team at IIT Delhi evaluated over 100 entries for Best Project in the Government to Citizen Category. Based on the experience of that assessment span, we realised that a number of factors in the EAF Framework need to be re-modelled. This includes some of the following:
i. Re-grouping Though one may still argue that retaining the factors has an important implication – that of projecting the most important attribute in the right thrust and perspective – re-grouping was found to be needed. For eg., cost effectiveness, sustainability and commercial functionality had some factor mismatch. Another such parameter was the factor of extent to which the scalability, security, architecture, reli-ability etc could be tested by an external audit body. Once these fac-tors are grouped together under external audit-ability, it is much easier for the judges to give appropriate rankings. Before the evaluation, the framework is given to the judges for their opinion on the weightages to be attached to various factors. Right grouping would minimise any hu-man judgment error due to assumptions that certain indexes may have covered the assumed factor while in reality it may have not.
ii. Overlap Some factors that have been covered in one heading need not be taken in another group again. For eg. time saved per transaction for the user and indirect cost reduction are not entirely distinct. There are a few more instances that have been spruced in the new model.

Evaluating e-Government �1
iii. Difficult to measure Some factors at first sight seem easily compre-hensible but on interpretation, ambiguity might arise on how to meas-ure or capture that variable. Since the model has not given detailed instructions on scale or measurement capture, certain difficulties arose in measuring those variables.
iv. New Factors Some aspects of e-governance that have been extremely crucial in a global evaluation perspective, do not find place here. Few examples include extent of integration (across services, departments – vertical and horizontal). Some other aspects about technology include its maintainability. While there are multinationals specially designing computers and peripherals suited to the Indian dust and heat, the over-all aspect of maintainability of infrastructure was not touched upon.
It has become most important for e-governance initiatives to be accu-rately measured because of the amount of time, effort and resources the government is investing in them. After having cited the reasons the E-gov-ernance Assessment Framework needs updations and changes, we now go on to explain the elements of the alternate framework in greater detail. We also explain the implementation strategy in detail and illustrate it with an example. We then compare the result of having used a simple EAF frame-work and the modified framework suggested below.
A framework for evaluation may broadly contain the following five factors:
•Citizen-centricity (efficiency, user convenience, services provided and value addition)
•Technology (architecture, standards, security, scalability, reliability, external audit-ability, maintainability)
•Sustainability (internal/organisational, external, cost-effectiveness)•Replicability (functional, technical, commercial)•Integration (services, vertical, horizontal)
These factors are further explained in Tables 5–9. Further, the factors and sub-factors that come under each of the above parameters are also ex-plained.
Citizen-centricity gauges the extent to which the governance succeeds in treating the citizen as the focus of its actions. The author calls it citi-zen-centricity instead of service orientation as in EAF because the author believes that governance is not just here to serve the citizens, but to involve and transform them. A service measure would see the extent to which the service provided to the citizen through this project covers the entire gamut of the citizen needs in that area for eg., if a form available online has to be downloaded, printed, filled and then the payment made at some facilita-tion centre, then the service provided is not complete. It would have been complete if the payment also could have been done online. To calculate this score, the percentage of service provided is compared to what it ought to provide for the transaction to be complete. The percentage of fully execut-

�� e-Governance: Case Studies
able service is graded as 1 for 1–20%, 2 for 21–40%, 3 for 41–60%, 4 for 61–80% and 5 for 81–100%.
Technology parameter tests the technological soundness of the project. The Alternate Delivery Channel in case of Breakdowns determines the ex-tent to which users can depend on the system’s response in case of break-downs (power, connectivity, hardware, software).
Sustainability gauges the sustainability of the project manifested through internal or organisational stability, external sustainability and the financial sustainability of the project.

Evaluating e-Government ��Ta
ble
5 Fa
ctor
s ex
pla
inin
g ci
tize
n-c
entr
icit
y
Eff
icie
ncy
Use
r co
nve
nie
nce
Ser
vice
pro
vid
edVa
lue
add
itio
n
Perc
enta
ge c
omp
lian
ce t
o sp
ecif
ied
ser
vice
le
vels
T
his
sco
re m
easu
res
the
exte
nt
to w
hic
h t
he
syst
em c
omp
lies
wit
h t
he
stat
ed a
nd
dis
pla
yed
se
rvic
e le
vels
th
at i
t is
sues
, for
eg.
, for
an
iss
u-
ance
of
a B
irth
Cer
tifi
cate
, on
ce t
he
con
sum
er
app
lies
for
it,
th
e sy
stem
may
sta
te t
hat
th
e ac
tual
iss
ual
tim
e is
17
hou
rs t
hat
eve
nin
g. T
he
con
sum
er c
an t
hen
, in
stea
d o
f w
aiti
ng
ther
e en
dle
ssly
, con
tin
ue
wit
h h
is w
ork
and
com
e ba
ck a
t 17
:00
hou
rs. T
his
sco
re w
ill
mea
sure
th
e p
erce
nta
ge t
imes
th
e sy
stem
com
pli
es w
ith
th
e st
ated
del
iver
y p
aram
eter
s. T
he
% o
f co
mp
li-
ance
is
grad
ed 1
for
1–2
0%, 2
for
21–
40%
, 3 f
or
41–6
0%,
4 fo
r 61
–80%
an
d 5
for
81–
100%
Tota
l u
ser
tim
e sa
ved
T
his
sco
re w
ill
mea
sure
th
e to
tal
tim
e sa
ved
at
the
use
r en
d. T
ime
save
d a
t th
e go
vern
men
t en
d
is m
easu
red
in
by
the
sust
ain
abil
ity:
cos
t-ef
-fe
ctiv
enes
s p
aram
eter
. To
calc
ula
te t
his
sco
re,
the
tim
e sa
ved
for
th
e u
ser
by a
ll t
he
pro
ject
s is
com
par
ed a
mon
g th
emse
lves
an
d a
gain
st t
he
one
bein
g u
sed
as
a be
nch
mar
k. T
he
scor
e is
n
orm
alis
ed u
sin
g th
e fo
rmu
la:
Ava
ilab
ilit
y of
th
e sy
stem
24
× 7
Th
is m
easu
res
the
ex-
ten
t of
ava
ilab
ilit
y th
e sy
stem
has
. Fir
st t
he
des
ired
id
eal
avai
l-ab
ilit
y of
th
e sy
stem
fo
r th
e se
rvic
e it
pro
-vi
des
is
det
erm
ined
: fo
r e.
g., i
s it
24
× 7
or
is
it ju
st d
uri
ng
the
day
? T
hen
th
e ac
tual
av
aila
bili
ty i
ncl
ud
ing
dow
n t
imes
an
d b
reak
ti
mes
is
calc
ula
ted
as
a p
erce
nta
ge o
f re
quir
ed a
vail
abil
ity.
T
he
% a
vail
abil
ity
of
the
syst
em i
s gr
aded
1
for
1–20
%, 2
for
21–
40%
, 3 f
or 4
1–60
%, 4
fo
r 61
–80%
an
d 5
for
81
–100
%.
Ali
gnm
ent
of s
ervi
ces
pro
vid
ed
to u
ser
nee
ds
Obs
ervi
ng
the
serv
ices
an
d t
he
fin
er n
uan
ces
of t
he
serv
ice
and
th
e ex
ten
t to
wh
ich
th
ey a
re i
n
syn
c w
ith
th
e be
hav
iou
ral
pat
tern
of
th
e u
ser.
Ext
ent
of p
roce
ss r
e- e
ngi
nee
rin
g fo
r re
mov
al o
f n
on-v
alu
e ad
ded
ac
tion
sPe
rcen
tage
of
serv
ice
chai
n t
hat
ca
n b
e fu
lly
exec
ute
d a
t ce
ntr
e or
on
web
.
Dec
reas
e in
cor
rup
tion
Th
is s
core
has
to
be
cap
ture
d b
y in
terv
iew
or
su
rvey
. Sp
ecif
ic
area
s to
be
det
erm
ined
ar
e•
Inst
ance
s of
p
ay-
men
t of
br
ibes
in
th
e p
ast,
be
fore
im
ple
men
tati
on
of
pro
ject
an
d a
fter
im-
ple
men
tati
on.
• Is
th
e en
d
resu
lt
per
ceiv
ed t
o be
fai
r an
d
just
(i
ssu
e of
d
rivi
ng
lice
nse
fo
r in
stan
ce)?
• Is
th
e en
d
resu
lt
per
ceiv
ed t
o be
fai
r an
d
just
(i
ssu
e of
d
rivi
ng
lice
nse
fo
r in
stan
ce)?

�� e-Governance: Case Studies
Eff
icie
ncy
Use
r co
nve
nie
nce
Ser
vice
pro
vid
edVa
lue
add
itio
n
(Cu
rren
t p
roje
ct t
ime
save
d –
Min
imu
m o
f ti
me
save
d b
y p
roje
ct)
/ (M
axim
um
of
tim
e sa
ved
by
pro
ject
– M
ini-
mu
m o
f ti
me
save
d b
y p
roje
ct).
Th
en t
he
scor
e ob
tain
ed i
s m
app
ed f
rom
0 t
o 1
to 1
to
5 as
0–0
.2 a
nd
gra
ded
as
1 an
d s
o on
.
Tota
l u
ser
mon
ey s
aved
Th
is s
core
wil
l m
easu
re t
he
tota
l m
oney
sav
ed
at t
he
use
r en
d. M
oney
sav
ed a
t th
e go
vern
men
t en
d i
s m
easu
red
in
by
the
sust
ain
abil
ity:
cos
t-ef
fect
iven
ess
par
amet
er. T
o ca
lcu
late
th
is s
core
, th
e m
oney
sav
ed f
or t
he
use
r by
all
th
e p
roje
cts
is c
omp
ared
am
ong
them
selv
es a
nd
aga
inst
th
e on
e be
ing
use
d a
s a
ben
chm
ark.
Th
e sc
ore
is
nor
mal
ised
usi
ng
the
form
ula
:(C
urr
ent
pro
ject
mon
ey s
aved
– M
inim
um
of
mon
ey s
aved
by
pro
ject
) / (
Max
imu
m o
f m
oney
sav
ed b
y p
roje
ct –
Min
i-m
um
of
mon
ey s
aved
by
pro
ject
).T
hen
th
e sc
ore
obta
ined
is
map
ped
fro
m 0
to
1 to
1 t
o 5
as 0
–0.2
an
d g
rad
ed a
s 1
and
so
on.
Nu
mbe
r of
in
term
edia
ries
rem
oved
Th
is s
core
wil
l m
easu
re t
he
tota
l n
um
ber
of
inte
rmed
iary
age
nts
rem
oved
bet
wee
n t
he
use
r an
d t
he
gove
rnm
ent
brin
gin
g in
mor
e tr
ansp
ar-
ency
an
d s
pee
d t
o th
e sy
stem
. To
calc
ula
te t
his
sc
ore,
th
e n
um
ber
of i
nte
rmed
iary
age
nts
Use
of
loca
l la
ngu
age
inte
rfac
eE
xten
t of
tra
nsl
a-ti
on o
f in
form
atio
n
into
loc
al l
angu
age
is m
easu
red
in
th
is
scor
e. S
core
var
ies
from
0 t
o 5
dep
end
ing
on f
ines
se o
f tr
ans-
lati
on a
nd
eas
e of
u
nd
erst
and
abi
lity
.
Sim
pli
city
of
usa
geT
his
mea
sure
s th
e si
mp
lici
ty a
nd
eas
e of
nav
igat
ion
th
rou
gh
the
enti
re r
ange
of
opti
ons
avai
labl
e.
Inte
rfac
e m
ust
be
des
ign
ed s
uch
th
at
even
a f
irst
-tim
e u
ser
can
eas
ily
nav
igat
e th
rou
gh a
nd
get
his
w
ork
don
e.
Use
fuln
ess
of h
elp
m
enu
sT
he
doc
um
enta
tion
an
d l
ayou
t of
hel
p
• D
oes
the
citi
zen
w
ho
doe
s n
ot h
ave
a kn
own
per
son
at
any
poi
nt
in t
he
en-
tire
p
roje
ct
serv
ice
chai
n, f
eel
he
is a
t a
dis
adva
nta
ge i
n a
ny
way
?S
core
s 1–
5 ar
e gi
ven
ba
sed
on
th
e re
spon
ses
to t
he
ques
tion
abo
ve.
Incr
ease
in
tr
ansp
ar-
ency
Th
is
mea
sure
m
ust
al
so
be
cap
ture
d
thro
ugh
su
rvey
or
qu
esti
onn
aire
s gi
ven
to
cit
izen
s. S
amp
le a
r-ea
s th
at n
eed
to b
e ca
p-
ture
d a
re a
s u
nd
er:
•D
oes
the
citi
zen
h
ave
acce
ss
to
the
stat
us
of h
is r
ecor
ds
at e
very
giv
en s
tage
w
her
e th
ere
is
a w
aiti
ng?

Evaluating e-Government ��E
ffic
ien
cyU
ser
con
ven
ien
ceS
ervi
ce p
rovi
ded
Valu
e ad
dit
ion
rem
oved
by
each
of
the
pro
ject
s is
com
par
ed
amon
g th
emse
lves
an
d a
gain
st t
he
one
bein
g u
sed
as
a be
nch
mar
k. T
he
scor
e is
nor
mal
ised
u
sin
g th
e fo
rmu
la:
(Cu
rren
t p
roje
ct n
um
ber
of i
nte
rmed
iari
es r
e-m
oved
– M
inim
um
of
of i
nte
rmed
iari
es r
emov
ed
by p
roje
ct)
/ (M
axim
um
of
inte
rmed
iari
es r
emov
ed b
y p
roje
ct –
Min
imu
m o
f in
term
edia
ries
rem
oved
by
pro
ject
).T
hen
th
e sc
ore
obta
ined
is
map
ped
fro
m 0
to
1 to
1 t
o 5
as 0
–0.2
an
d g
rad
ed a
s 1
and
so
on.
Perc
enta
ge i
ncr
ease
in
usa
geT
his
mea
sure
is
use
d t
o ga
uge
th
e in
crea
se i
n
the
usa
ge o
f th
e sy
stem
du
e to
it
bein
g d
eliv
ered
in
a m
ore
con
ven
ien
t an
d u
ser-
cen
tric
man
ner
. T
his
is
calc
ula
ted
as
a p
erce
nta
ge o
f n
um
ber
of
tran
sact
ion
s d
one
per
day
aft
er a
nd
bef
ore
the
pro
ject
. Th
e %
in
crea
se i
n u
sage
is
grad
ed a
s 1
for
1–20
%, 2
for
21–
40%
, 3 f
or 4
1–60
%,
4 fo
r 61
–80%
an
d 5
for
81–
100%
Perc
enta
ge t
arge
t u
sers
rea
ched
Th
is m
easu
re i
s u
sed
to
cap
ture
th
e re
ach
abil
ity
and
pop
ula
rity
or
awar
enes
s am
ong
the
targ
et
use
rs. I
t is
cal
cula
ted
as
a p
erce
nta
ge o
f n
um
ber
of u
sers
rea
ched
am
ong
the
targ
et u
sers
. Th
e %
ta
rget
use
rs r
each
ed i
s gr
aded
1 f
or 1
–20%
, 2 f
or
21–4
0%, 3
for
41–
60%
, 4 f
or 6
1–80
% a
nd
5 f
or
81–1
00%
.
men
us
mu
st b
e lu
cid
an
d e
asy
to u
nd
er-
stan
d
•
Doe
s th
e ci
tize
n
know
all
th
e fa
ctor
s th
at a
ffec
t th
e en
d
resu
lt o
r an
y ac
tion
oc
curr
ing
in
the
serv
ice
chai
n?
•
Is t
he
citi
zen
mad
e aw
are
of h
is r
igh
t to
in
form
atio
n th
rou
gh
the
use
of
p
rom
i-n
ent
not
ice
boar
ds
or
clau
ses
stat
ed
clea
rly
on th
e si
te o
r fo
rm?
•
Wh
at
per
ce
nt
of
citi
zen
s ar
e aw
are
of
the
abov
e p
rivi
lege
s h
e en
joys
an
d w
hat
p
er c
ent
of t
hem
ac-
tual
ly e
xerc
ise
it?
Sco
res
1–5
are
give
n
base
d o
n th
e re
spon
ses
to t
he
ques
tion
s ab
ove.

�� e-Governance: Case StudiesE
ffic
ien
cyU
ser
con
ven
ien
ceS
ervi
ce p
rovi
ded
Valu
e ad
dit
ion
Incr
ease
in
go
vern
-m
ent
citi
zen
in
tera
c-ti
onO
ne
of t
he
fin
al o
bjec
-ti
ves
of e
- go
vern
ance
is
to
incr
ease
th
e in
-te
ract
ion
bet
wee
n t
he
gove
rnm
ent
and
th
e ci
tize
n a
nd
mak
e th
e ci
tize
ns
acti
ve p
arti
ci-
pan
ts
in
pol
icy
mak
-in
g d
ecis
ion
s. T
his
can
be
in
itia
ted
by
p
ost-
ing
rele
van
t in
form
a-ti
on
and
fa
cili
tati
ng
(dis
cuss
ion
fo
rum
s,
feed
back
fo
rms,
on
-li
ne
pop
-up
su
rvey
s,
emai
l co
nta
cts,
blo
gs)
inte
ract
ion
be
twee
n
the
gove
rnm
ent
and
th
e ci
tize
n.
Sco
res
1–5
are
give
n
dep
end
ing
on s
uch
in
itia
tive
s an
d
the
exte
nt
of t
hei
r u
se.
Ext
ent
of
pro
cess
re
-en
gin
eeri
ng
for
re-
mov
al
of
non
-val
ue
add
ed a
ctio
ns

Evaluating e-Government ��E
ffic
ien
cyU
ser
con
ven
ien
ceS
ervi
ce p
rovi
ded
Valu
e ad
dit
ion
Kn
owle
dge
of
serv
ice
pro
vid
er/s
taff
Th
is m
easu
re i
s u
sed
to
cap
ture
th
e ex
ten
t to
wh
ich
th
e st
aff
of
the
serv
ice
pro
vid
er
at t
he
serv
ice
del
iver
y st
atio
n i
s fa
mil
iar
wit
h t
he
serv
ices
p
acka
ged
for
dif
fere
nt
use
r gr
oup
s. A
su
rvey
or
a s
mal
l in
terv
iew
m
ay b
e u
sed
to
det
er-
min
e th
e ex
act
scor
e.
Con
ven
ien
ce o
f lo
ca-
tion
Th
is m
easu
re i
s al
so a
co
mp
arat
ive
mea
sure
of
th
e lo
cati
on c
on-
ven
ien
ce o
ffer
ed b
y th
e p
roje
ct. I
n c
ase
of
serv
ices
th
at a
re t
o be
re
nd
ered
to
the
urb
an
onli
ne,
th
is s
hal
l n
ot
be a
pp
lica
ble.
A
nu
mbe
r of
p
roce
-d
ure
s m
ay e
xist
in
th
e sy
stem
th
at
doe
s n
ot
by
them
selv
es
add
an
y va
lue
to t
he
pro
c-es
s ou
tpu
t.
Th
ey
are
pre
sen
t as
a
con
se-
quen
ce o
f so
me
oth
er
par
t of
th
e li
nk
not
p
erfo
rmin
g to
its
bes
t fo
r e.
g.,
in
a m
anu
al
syst
em o
f ad
mis
sion
s,
chec
kin
g an
d
then
ve
rify
ing
mar
ks l
ist
of
stu
den
t ap
pli
can
ts
is
a n
on-v
alu
e ad
d.
Th
is
can
be
co
mp
lete
ly
elim
inat
ed i
f th
e d
ata
base
con
sist
ing
of s
tu-
den
t p
erfo
rman
ce d
ata
can
tal
k to
th
e ad
mis
-si
on r
elat
ed d
ata
and
th
e m
arks
ver
ific
atio
n
can
be
don
e au
tom
ati-
call
y. T
his
sor
t of
re-
en
gin
eeri
ng
scop
e th
at
com
pu
teri
sati
on
and
au
tom
atio
n b
rin
g al
ong
wit
h t
hem
mu
st b
e

�� e-Governance: Case StudiesE
ffic
ien
cyU
ser
con
ven
ien
ceS
ervi
ce p
rovi
ded
Valu
e ad
dit
ion
com
ple
tely
lev
erag
ed.
Th
is
mea
sure
is
to
ca
ptu
re
the
exte
nt
of
busi
nes
s p
roce
ss
re-
engi
nee
rin
g sc
ope
that
th
e p
roje
ct h
as a
nd
to
wh
at e
xten
t it h
as b
een
le
vera
ged
in
th
is
in-
stan
ce. T
he
% o
f re
-en
-gi
nee
red
p
roce
sses
is
m
easu
red
ag
ain
st
the
pro
cess
es
that
co
uld
h
ave
been
an
d g
rad
ed
1 fo
r 1–
20%
, 2
for
21–
40%
, 3
for
41–6
0%,
4 fo
r 61
–80%
an
d 5
for
81
–100
%.

Evaluating e-Government ��Ta
ble
6 Fa
ctor
s ex
pla
inin
g te
chn
olog
ical
sou
nd
nes
s
Arc
hit
ectu
reS
tan
dar
ds
Sec
uri
tyS
cala
bili
tyR
elia
bili
tyE
xter
nal
Au
dit
A
bili
tyM
ain
tain
Abi
lity
Com
pre
hen
sive
-n
ess
of a
rch
itec
-tu
reT
his
mea
sure
is
to
cap
ture
if
the
arch
itec
-tu
re d
esig
ned
is
ad
equ
ate
for
han
dli
ng
all
the
serv
ices
. Th
e ar
chit
ectu
re i
s gr
aded
low
if
it i
s ov
er-d
esig
ned
or
un
der
-des
ign
ed
Con
form
ance
to
nat
ion
al/i
nte
rna-
tion
al a
rch
itec
-tu
reT
his
mea
sure
ca
ptu
res
the
exte
nt
to w
hic
h
the
arch
itec
ture
co
nfo
rms
to
nat
ion
al a
nd
Com
pli
ance
wit
h
open
Sta
nd
ard
sT
his
mea
sure
is
to d
eter
min
e th
e ex
ten
t of
use
of
open
sta
nd
ard
s li
ke t
hos
e ba
sed
on
TC
P/I
P, H
TT
P,
CO
RB
A, D
CO
M,
OD
BC
etc
. It
is
grad
ed h
igh
for
m
axim
um
usa
ge.
Des
ign
an
d
adop
tion
of
met
a-d
ata
stan
d-
ard
sT
his
mea
sure
is
use
d t
o ca
ptu
re
if t
he
syst
em i
s ba
sed
on
met
a-d
ata
stan
dar
ds
like
XM
L et
c. I
t is
gra
ded
hig
h
for
max
imu
m
usa
ge.
Ext
ent
of c
omp
li-
ance
wit
h s
ecu
-ri
ty a
rch
itec
ture
In t
his
mea
sure
, it
is
det
erm
ined
if
th
e sy
stem
se
curi
ty d
esig
n
con
form
s to
B
S 7
799.
If
yes
then
th
e d
esig
n
is g
rad
ed a
s 5,
ot
her
wis
e it
is
grad
ed a
sco
re
ran
gin
g fr
om 4
to
1 d
epen
din
g u
pon
th
e p
res-
ence
an
d e
xten
t of
th
e se
curi
ty
pol
icy
doc
um
ent
pu
blis
hed
by
the
pro
ject
tea
m
Dat
abas
e in
teg-
rity
an
d s
cal-
abil
ity
Th
ere
shou
ld b
e n
o re
pli
cabi
lity
or
red
un
dan
cy
of d
ata.
Als
o th
e d
ata
base
arc
hi-
tect
ure
sh
ould
be
such
th
at f
utu
re
inte
grat
ion
, bot
h
vert
ical
ly a
nd
h
oriz
onta
lly
acro
ss s
ervi
ces,
fu
nct
ion
s an
d
dep
artm
ents
ac
ross
sta
tes
shou
ld n
ot
be a
pro
blem
. T
he
syst
em i
s gr
aded
hig
h i
f an
y in
tegr
a-ti
on t
hat
can
be
don
e w
ith
oth
er
serv
ices
has
be
en i
nit
iate
d o
r co
mp
lete
d.
Acc
ura
cy o
f re
sult
sIn
th
is m
easu
re,
the
syst
em t
hat
p
rod
uce
s h
igh
ly
accu
rate
res
ult
s sh
ould
be
give
n
a sc
ore
of 5
. Ac-
cura
cy w
ill
be
base
d u
pon
th
ird
p
arty
au
dit
s an
d
erro
r lo
gs o
f th
e sy
stem
.
Con
sist
ency
of
resu
lts
Th
is m
easu
re
gau
ges
the
con
sist
ency
w
ith
wh
ich
th
e sy
stem
off
ers
rea-
son
able
res
pon
se
tim
es.
Sys
tem
for
ar
chit
ectu
re
com
pli
ance
an
d
aud
it
Th
is m
easu
re i
s to
det
erm
ine
if
ther
e is
th
ere
a sy
stem
in
pla
ce
for
con
du
ctin
g th
ird
par
ty a
ud
it
of t
he
syst
ems
to
elic
it c
onfo
rm-
ance
/con
tin
ued
co
nfo
rman
ce
to t
he
arch
itec
-tu
re o
rigi
nal
ly
des
ign
ed. (
Th
e sc
ore
is a
war
ded
as
fol
low
s:Ye
s –5
; N
o –
0)
Eas
e of
in
stal
la-
tion
Th
is m
easu
re e
n-
sure
s th
at i
n c
ase
of n
ew s
oftw
are
or r
e-in
stal
lati
on
of s
oftw
are,
th
e p
roce
du
re i
s as
si
mp
le a
s p
os-
sibl
e to
en
able
th
e se
rvic
e st
aff
at t
he
citi
zen
fa
cili
tati
on c
en-
tre
or t
he
dir
ect
use
r h
imse
lf t
o be
abl
e to
rec
tify
it
. Sco
rin
g m
ust
be
bas
ed o
n t
he
requ
irem
ents
of
the
soft
war
e an
d
the
imp
lem
enta
-ti
on d
one.

�0 e-Governance: Case StudiesA
rch
itec
ture
Sta
nd
ard
sS
ecu
rity
Sca
labi
lity
Rel
iabi
lity
Ext
ern
al A
ud
it
Abi
lity
Mai
nta
in A
bili
ty
inte
rnat
ion
al
stan
dar
ds.
Wil
l th
e ar
chit
ectu
re
be a
ble
to t
alk
wit
h o
ther
sys
-te
ms
and
wil
l it
be
eas
y to
op
er-
ate
and
dec
ode?
It i
s gr
aded
low
if
ther
e is
an
y m
is-
mat
ch t
hat
wil
l re
quir
e fu
rth
er
wor
k to
bri
ng
it
up
to
the
def
ined
st
and
ard
.
Ext
ent
of u
se
of o
pen
-sou
rce
syst
ems
Th
e sy
stem
is
grad
ed h
igh
if
it
use
s op
en-s
ourc
e sy
stem
s in
bac
k en
d a
nd
fro
nt
end
i.e
. for
op
-er
atin
g sy
stem
, D
BM
S o
r d
ata
base
Priv
acy
of u
ser
dat
a, p
rese
nt a
nd
k
now
n to
use
rsT
his
mea
sure
tr
ies
to e
nsu
re
that
use
r d
ata
is
com
ple
tely
se-
cure
. Esp
ecia
lly
in c
ases
wh
ere
the
com
ple
te
tran
sact
ion
hap
-p
ens
onli
ne
and
th
e u
ser
nee
ds
to g
ive
per
son
al
info
rmat
ion
an
d c
red
it c
ard
d
etai
ls, u
tmos
t se
curi
ty i
s re
-qu
ired
. Als
o th
e w
eb s
ite
mu
st
pro
min
entl
y d
isp
lay
the
mes
sage
abo
ut
pri
vacy
an
d
secu
rity
pol
icy
to
reas
sure
th
e u
ser
abou
t h
is d
ata
safe
ty.
Deg
ree
of s
cal-
abil
ity
of p
roje
ctS
cala
bili
ty o
f th
e p
roje
ct d
epen
ds
on t
he
AP
Is
avai
labl
e an
d
thei
r d
ocu
men
ta-
tion
. Th
e p
roje
ct
is g
rad
ed h
igh
if
it s
how
s ri
gou
r al
ong
this
t li
ne.
Sco
pe
for
en-
han
cem
ents
of
HW
in
terf
aces
Th
is m
easu
re
trie
s to
cap
ture
if
bot
h h
ard
war
e an
d s
oftw
are
des
ign
per
mit
s in
tegr
atio
n o
f n
ew d
evic
es. T
he
pro
ject
sco
res
hig
h i
f it
has
a
bett
er e
nh
ance
-m
ent
scop
e.
Th
is i
s to
be
as-
sess
ed f
rom
th
e sy
stem
log
s. P
er-
cen
tage
nu
mbe
r of
tim
es t
hat
th
e sy
stem
has
bee
n
con
sist
ent
is c
al-
cula
ted
an
d t
he
syst
em g
rad
ed 1
fo
r 1–
20%
, 2 f
or
21–4
0%, 3
for
41
–60%
, 4 f
or
61–8
0% a
nd
5
for
81–1
00%
.
Alt
ern
ate
del
iv-
ery
chan
nel
in
ca
se o
f br
eak
-d
own
sT
his
asp
ect
de-
term
ines
th
e ex
-te
nt
to w
hic
h t
he
use
rs c
an d
epen
d
on t
he
syst
em’s
re
spon
se i
n c
ase
of b
reak
dow
ns
[pow
er,
Op
en s
tan
dar
ds
com
pli
ance
en
forc
emen
t m
ech
anis
m
Th
is m
easu
re i
s to
det
erm
ine
if
ther
e is
th
ere
a sy
stem
in
pla
ce
for
con
du
ctin
g th
ird
par
ty a
ud
it
of t
he
syst
ems
to
elic
it c
onfo
rm-
ance
/con
tin
ued
co
nfo
rman
ce
to t
he
arch
itec
-tu
re o
rigi
nal
ly
des
ign
ed. (
Th
e sc
ore
is a
war
ded
as
fol
low
s:Ye
s –
5; N
o –
0)
Ext
ent
of p
aram
-et
eris
atio
n f
or
cust
omis
atio
nT
his
fac
tor
mea
sure
s an
d
scor
es d
epen
din
g on
th
e ex
ten
t to
w
hic
h t
he
use
r en
d s
yste
m i
s cu
stom
isab
le
thro
ugh
par
am-
eter
s on
ly (
not
th
rou
gh a
dd
i-ti
onal
pro
gram
-m
ing)
(0–
5).
Tech
nol
ogy
mad
e ac
cord
-in
g to
In
dia
n
wea
ther
an
d u
s-ag
e st
and
ard
sB
ecau
se o
f th
e u
se o
f th
e sy
stem
in
rem
ote
area
s w
her
e av
aila
bil-
ity
of q
ual
ifie
d
skil
ful
tech
ni-
cian
s m
ay b
e a

Evaluating e-Government �1A
rch
itec
ture
Sta
nd
ard
sS
ecu
rity
Sca
labi
lity
Rel
iabi
lity
Ext
ern
al A
ud
it
Abi
lity
Mai
nta
in A
bili
ty
man
agem
ent
sys-
tem
s, w
eb s
erve
r te
chn
olog
y et
c
It i
s gr
aded
1 t
o 5
dep
end
ing
on t
he
exte
nt
to w
hic
h
secu
rity
mea
sure
s h
ave
been
tak
en
– a
scor
e of
5 i
s gi
ven
if
cred
it c
ard
p
aym
ents
are
ac-
cep
ted
on
lin
e an
d
no
case
of
loss
has
be
en r
epor
ted
.
Ext
ent
of u
ser
and
fi
nan
cial
au
then
ti-
cati
on p
roce
du
re
If f
inan
cial
tra
nsa
c-ti
ons
are
bein
g ca
rrie
d o
ut
on
the
web
, th
en t
he
syst
em i
s gr
aded
5
else
if
non
e, t
hen
0.
In
term
edia
te
scor
es a
re g
iven
ac-
cord
ing
to t
he
ex-
ten
t of
tra
nsa
ctio
n
safe
ty i
nvo
lved
.
Sco
pe
to w
ork
wit
h
alte
rnat
e p
ower
an
d
con
nec
tivi
tyC
onsi
der
ing
the
clim
ate
and
usa
ge
con
dit
ion
s of
th
e In
dia
n s
ub-
con
tin
ent,
th
e ab
ilit
y of
th
e te
rmin
al t
o w
ith
stan
d
hig
h t
emp
erat
ure
an
d d
ust
is
sign
ifi-
can
t. W
ork
can
not
be
stop
ped
just
bec
ause
of
fre
quen
t p
ower
cu
ts t
hat
may
hap
pen
in
les
s d
evel
oped
re
gion
s. H
ence
th
e sc
ope
to w
ork
wit
h
alte
rnat
e p
ower
or
hav
ing
a p
ower
bac
k u
p a
nd
con
nec
tivi
ty
is e
ssen
tial
. Hig
her
th
e ab
ilit
y to
man
age
in t
hes
e co
nd
itio
ns,
be
tter
th
e sc
ore.
con
nec
tivi
ty,
har
dw
are,
sof
t-w
are)
.
Sec
uri
ty s
tan
d-
ard
s co
mp
lian
ce
mec
han
ism
T
his
mea
sure
is
to d
eter
min
e if
th
ere
is t
her
e a
syst
em i
n p
lace
fo
r co
nd
uct
ing
thir
d p
arty
au
dit
of
th
e sy
stem
s to
el
icit
con
form
-an
ce/c
onti
nu
ed
con
form
ance
to
th
e ar
chit
ec-
ture
ori
gin
ally
d
esig
ned
. (T
he
scor
e is
aw
ard
ed
as f
ollo
ws:
Yes
–5;
No
– 0)
litt
le d
iffi
cult
, re
mot
e lo
ggin
g an
d m
ain
ten
ance
m
ust
be
an e
na-
bled
fea
ture
th
at
can
be
easi
ly a
c-ti
vate
d t
hro
ugh
th
e u
se o
f se
cure
p
assw
ord
s. (
Th
e sc
ore
is a
war
ded
as
fol
low
s:Ye
s –5
; N
o –
0)

�� e-Governance: Case StudiesTa
ble
7 Fa
ctor
s ex
pla
inin
g p
roje
ct s
ust
ain
abil
ity
Inte
rnal
E
xter
nal
Cos
t-ef
fect
iven
ess
Org
anis
atio
nal
str
uct
ure
to
sup
-p
ort
the
pro
ject
Th
is s
core
is
give
n b
ased
on
wh
eth
er t
he
orga
nis
atio
n
stru
ctu
re a
nd
hie
rarc
hy
has
be
en c
reat
ed b
y re
form
ing
the
con
ven
tion
al s
tru
ctu
re a
nd
is
fun
ctio
nin
g ef
fect
ivel
y. E
ffec
-ti
ve f
un
ctio
nin
g w
ould
im
ply
p
re-d
ecid
ed d
ecis
ion
flo
w a
nd
in
form
atio
n f
low
cla
rity
. Sco
re
ran
ges
from
1 t
o 5.
Ext
ent
and
ad
equ
acy
of e
mp
loy-
ee t
rain
ing
Un
less
th
e em
plo
yees
acr
oss
the
orga
nis
atio
n a
re t
rain
ed e
ffec
-ti
vely
an
d e
ffic
ien
tly,
in
vest
ing
in t
ech
nol
ogy
and
in
fras
tru
ctu
re
wil
l p
rovi
de
no
retu
rns.
Th
is
also
in
volv
es o
verc
omin
g u
ser
resi
stan
ce t
o th
e n
ew s
yste
m a
nd
th
e ch
ange
th
at f
ollo
ws.
Ava
il-
abil
ity
of t
ime
and
res
ourc
es
spen
t on
tra
inin
g em
plo
yees
to
reac
h a
com
fort
lev
el i
s m
eas-
ure
d b
y th
is f
acto
r. A
sm
all
Peri
od o
f co
nti
nu
ous
fun
ctio
nin
gT
his
mea
sure
cap
ture
s th
e ex
ten
t of
con
tin
u-
ity
of t
he
pro
ject
an
d s
core
s it
acc
ord
ingl
y. I
f th
e p
roje
ct f
un
ctio
ns
for
3 ye
ars
or m
ore
afte
r it
s la
un
ch w
ith
gro
wth
, it
mu
st b
e as
sign
ed a
sc
ore
of 5
. If
the
pro
ject
has
sto
pp
ed f
un
ctio
n-
ing
wit
hin
3 y
ears
of
lau
nch
, it
is g
rad
ed –
10
and
–5
if t
he
nu
mbe
rs s
how
a d
ecli
ne.
Str
engt
h o
f P
PP
arr
ange
men
tT
his
mea
sure
det
erm
ines
th
e st
ren
gth
of
the
pri
vate
par
tner
an
d i
ts r
elat
ion
ship
wit
h t
he
gove
rnm
ent.
It
scor
es b
ased
on
th
e ef
fect
ive-
nes
s w
ith
wh
ich
th
e p
riva
te p
artn
er e
xecu
tes
the
pro
ject
(S
core
5 i
f ti
me,
cos
t an
d q
ual
ity
par
amet
ers
hav
e be
en m
et. E
lse
assi
gned
pro
-p
orti
onat
ely
less
er s
core
s).
Red
uct
ion
of
cost
to
gove
rnm
ent
Th
e co
st r
edu
ctio
n o
r m
oney
sav
ed b
y th
e u
ser
has
bee
n m
easu
red
in
th
e ci
tize
n-c
entr
icit
y ef
-fi
cien
cy s
ub-
fact
or. B
y th
is m
easu
re, t
he
exte
nt
to w
hic
h t
he
pro
ject
has
res
ult
ed i
n r
edu
ctio
n o
f co
st o
ver
tim
e to
th
e go
vern
men
t is
gau
ged
. To
calc
ula
te t
his
sco
re, t
he
mon
ey s
aved
by
gove
rn-
men
t in
eac
h o
f th
e p
roje
cts
bein
g co
mp
ared
is
calc
ula
ted
aga
inst
th
e on
e be
ing
use
d a
s a
ben
ch-
mar
k. T
he
scor
e is
nor
mal
ised
usi
ng
the
form
ula
:(C
urr
ent
pro
ject
cos
t re
du
ced
– M
inim
um
of
cost
re
du
ced
by
any
pro
ject
) / (
Max
imu
m o
f co
st r
edu
ced
by
a p
roje
ct –
Min
i-m
um
of
cost
red
uce
d b
y a
pro
ject
). T
hen
th
e sc
ore
obta
ined
is
map
ped
fro
m 0
to
1 to
1 t
o 5
as 0
–0.2
an
d g
rad
ed a
s 1
and
so
on.
Sys
tem
of
coll
ecti
on o
f u
ser
char
ges
For
this
mea
sure
, a s
yste
m i
s gr
aded
5, i
f th
e ch
arge
s p
rovi
de
a go
od s
trea
m o
f re
ven
ue
ad-
equ
ate
to e
nsu
re f
inan
cial
su
stai
nab
ilit
y (0
–5)
Ext
ent
of i
ncr
ease
in
Rev
enu
eIn
th
is m
easu
re, t
he
exte
nt
to w
hic
h t
he
pro
ject
h
as r
esu
lted
in
rev
enu
e in
crea
se o
ver
tim
e to
th
e go
vern
men
t is
gau
ged
. To
calc
ula
te t
his
sco
re t
he
reve
nu
e in
crea
se t
o go
vern
men
t in
eac
h o
f th
e

Evaluating e-Government ��In
tern
al
Ext
ern
alC
ost-
effe
ctiv
enes
s
inte
rvie
w o
r qu
esti
onn
aire
tes
t to
th
e u
sers
wou
ld h
elp
det
er-
min
e th
eir
com
fort
lev
el w
ith
th
e n
ew s
yste
m.
Rol
e cl
arit
y an
d e
mp
loye
e
buy-
inO
ne
mu
st a
lso
ensu
re t
hat
eac
h
per
son’
s ro
les
and
res
pon
sibi
li-
ties
are
cry
stal
cle
ar t
o h
im i
n
the
chan
ged
en
viro
nm
ent
to b
e ab
le t
o p
rod
uce
goo
d r
esu
lts.
A
surv
ey t
o d
eter
min
e th
e ex
ten
t of
rol
e cl
arit
y an
d e
mp
loye
e bu
y-in
wou
ld h
elp
sco
re i
n t
his
fa
ctor
.
Em
plo
yee
invo
lvem
ent
in d
e-si
gn a
nd
im
ple
men
tati
onT
his
mea
sure
tri
es t
o ca
ptu
re
the
deg
ree
of s
ense
of
own
ersh
ip
of t
he
pro
ject
by
gove
rnm
ent
emp
loye
es (
0–5)
Con
tin
uit
y of
top
ch
amp
ion
s of
th
e p
roje
cts
Con
tin
uit
y of
top
ch
amp
ion
s is
a h
uge
gro
wth
im
pet
us
and
kn
owle
dge
sou
rce.
Har
nes
sin
g
pro
ject
s be
ing
com
par
ed i
s ca
lcu
late
d a
gain
st
the
one
bein
g u
sed
as
a be
nch
mar
k. T
he
scor
e is
n
orm
alis
ed u
sin
g th
e fo
rmu
la(C
urr
ent
pro
ject
rev
enu
e in
crea
se –
Min
imu
m
of r
even
ue
incr
ease
by
any
pro
ject
)/(M
axim
um
of
rev
enu
e in
crea
se b
y a
pro
ject
– M
inim
um
of
reve
nu
e in
crea
se b
y a
pro
ject
). T
hen
th
e sc
ore
obta
ined
is
map
ped
fro
m 0
to
1 to
1 t
o 5
as 0
–0.2
an
d g
rad
ed a
s 1
and
so
on.
Mec
han
ism
to
reco
ver
cap
ital
cos
tIf
pro
visi
on i
s m
ade
for
com
ple
te r
ecov
ery,
th
e p
roje
ct s
core
5. E
lse
it i
s gr
aded
pro
por
tion
atel
y le
ss
If P
PP,
ext
ent
of c
omm
erci
al v
iabi
lity
to
pri
vate
p
artn
erT
his
mea
sure
in
dic
ates
th
at e
xten
t to
wh
ich
th
e p
riva
te p
artn
er f
ind
s th
e ve
ntu
re c
omm
erci
ally
vi
able
. Th
is i
s p
rop
orti
onal
to
the
cost
su
stai
n-
abil
ity
of t
he
pro
ject
. If
ther
e is
hig
h c
omm
erci
al
viab
ilit
y fo
r th
e p
riva
te p
artn
er, t
he
pro
ject
is
grad
ed 5

�� e-Governance: Case StudiesIn
tern
al
Ext
ern
alC
ost-
effe
ctiv
enes
s
this
bra
in p
ower
can
be
a si
gnif
i-ca
nt
reas
on f
or f
utu
re i
mp
etu
s to
th
e p
roje
ct a
nd
its
rep
lica
bili
ty
in o
ther
are
as. T
his
is
mea
sure
d
by a
ssig
nin
g a
scor
e 1
for
each
ye
ar o
f co
nti
nu
ity
and
for
les
s th
an o
ne
year
a s
core
of
0
Exi
sten
ce o
f u
ser
grou
ps
and
se
rvic
e re
view
sT
his
mea
sure
is
base
d o
n t
he
exis
ten
ce a
nd
eff
ecti
ven
ess
of a
sy
stem
for
rev
iew
ing
the
syst
em
oper
atio
ns
per
iod
ical
ly a
nd
in
-co
rpor
atin
g u
ser
feed
back
(0–
5)

Evaluating e-Government ��Ta
ble
8 Fa
ctor
s ex
pla
inin
g p
roje
ct r
epli
cabi
lity
Fun
ctio
nal
Tech
nic
alC
omm
erci
al
Deg
ree
of g
ener
ic p
roce
sses
in
trod
uce
dT
his
mea
sure
cap
ture
s th
e ex
ten
t to
w
hic
h t
he
pro
ject
ad
dre
sses
iss
ues
not
sp
ecif
ic t
o ge
ogra
ph
y (s
tate
/dis
tric
t et
c.);
w
het
her
it
can
be
imp
lem
ente
d a
nyw
her
e in
th
e co
un
try
(0–5
)
Ext
ent
to w
hic
h p
roje
ct r
esu
lts
in a
p
rod
uct
Th
is m
easu
re c
aptu
res
the
exte
nt
to
wh
ich
a p
rod
uct
has
bee
n a
nd
/or
can
be
dev
elop
ed o
ut
of t
he
pro
ject
for
eas
y re
p-
lica
bili
ty a
nd
com
mer
cial
via
bili
ty (
0–5)
Ext
ent
of o
ther
pro
ject
s th
at h
as b
een
re
pli
cate
d i
n t
his
pro
ject
(n
ot t
o be
sc
ored
)T
his
in
dic
ator
is
pu
rely
for
in
form
atio
n
sake
at
pre
sen
t –
to k
now
if
the
pro
ject
h
as e
ffec
tive
ly r
e-u
sed
an
y co
mp
onen
t of
an
oth
er p
roje
ct a
nd
how
su
cces
sfu
l it
w
as i
t.
Ext
ent
to w
hic
h p
roje
ct r
esu
lts
in a
pro
du
ctT
his
mea
sure
gau
ges
the
exte
nt
to w
hic
h a
p
rod
uct
th
at c
an b
e re
pli
cate
d a
s a
pac
kage
in
its
en
tire
ty i
s cr
eate
d o
ut
of t
he
pro
ject
.
Ext
ent
of o
ther
pro
ject
s th
at h
as b
een
rep
li-
cate
d i
n t
his
pro
ject
(n
ot t
o be
sco
red
)T
his
in
dic
ator
is
pu
rely
for
in
form
atio
n s
ake
at p
rese
nt
– to
kn
ow i
f th
e p
roje
ct h
as e
f-fe
ctiv
ely
re-u
sed
an
y co
mp
onen
t of
an
oth
er
pro
ject
an
d h
ow s
ucc
essf
ul
it w
as i
t.
Mu
ltip
le p
latf
orm
dep
loym
ent
feas
ibil
ity
Th
is m
easu
re c
aptu
res
the
exte
nt
of f
easi
bil-
ity
of t
he
app
lica
tion
sof
twar
e on
mu
ltip
le
pla
tfor
ms
and
sco
res
acco
rdin
gly
ran
ge f
rom
0
to 5
.
Qu
alit
y of
pro
ject
doc
um
enta
tion
Th
e sc
orin
g fo
r th
is m
easu
re i
s ba
sed
on
av
aila
bili
ty o
f sy
stem
doc
um
enta
tion
in
th
e st
and
ard
for
mat
Bet
ter
the
read
abil
ity,
mor
e th
e sc
ore
ran
gin
g fr
om 0
to
5.
Ava
ilab
ilit
y of
com
mer
cial
arr
ange
men
t fo
r re
pli
cati
onT
his
mea
sure
s w
het
her
th
e co
mm
erci
al
arra
nge
men
t w
ith
th
e d
evel
oper
/PP
P p
art-
ner
per
mit
s re
pli
cati
on. T
he
pro
ject
s ar
e gr
aded
5 f
or Y
es a
nd
0 f
or N
o.
Att
ract
iven
ess
of t
ran
sact
ion
cos
ts t
o in
du
ce r
epli
cati
onT
his
sco
re m
easu
res
wh
eth
er t
he
tran
sac-
tion
cos
ts a
nd
oth
er c
omm
erci
al t
erm
s ar
e at
trac
tive
en
ough
to
ind
uce
rep
lica
tion
. T
he
pro
ject
s ar
e gr
aded
5 f
or Y
es a
nd
0 f
or
No.
Mec
han
ism
for
mar
keti
ng
the
pro
ject
Is t
her
e a
mec
han
ism
in
pla
ce f
or m
arke
t-in
g’ t
he
pro
ject
an
d i
mp
lem
enti
ng
it i
n
oth
er g
eogr
aph
ies
on c
omm
erci
al b
asis
? T
he
pro
ject
s ar
e gr
aded
5 f
or Y
es a
nd
0 f
or
No.
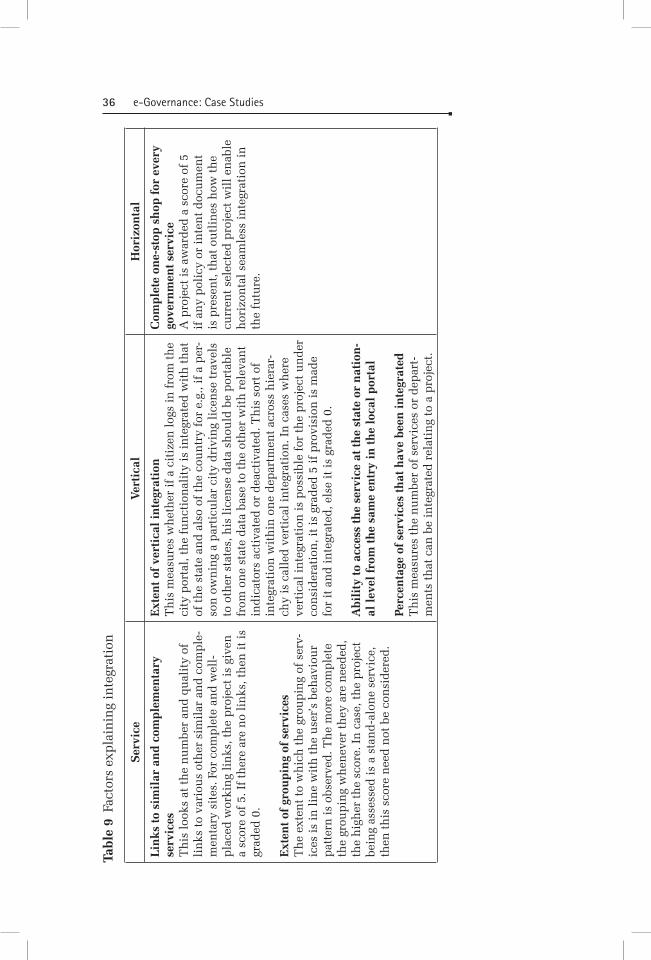
�� e-Governance: Case StudiesTa
ble
9 Fa
ctor
s ex
pla
inin
g in
tegr
atio
n
Ser
vice
Vert
ical
Hor
izon
tal
Lin
ks
to s
imil
ar a
nd
com
ple
men
tary
se
rvic
es
Th
is l
ooks
at
the
nu
mbe
r an
d q
ual
ity
of
lin
ks t
o va
riou
s ot
her
sim
ilar
an
d c
omp
le-
men
tary
sit
es. F
or c
omp
lete
an
d w
ell-
pla
ced
wor
kin
g li
nks
, th
e p
roje
ct i
s gi
ven
a
scor
e of
5. I
f th
ere
are
no
lin
ks, t
hen
it
is
grad
ed 0
.
Ext
ent
of g
rou
pin
g of
ser
vice
sT
he
exte
nt
to w
hic
h t
he
grou
pin
g of
ser
v-ic
es i
s in
lin
e w
ith
th
e u
ser’
s be
hav
iou
r p
atte
rn i
s ob
serv
ed. T
he
mor
e co
mp
lete
th
e gr
oup
ing
wh
enev
er t
hey
are
nee
ded
, th
e h
igh
er t
he
scor
e. I
n c
ase,
th
e p
roje
ct
bein
g as
sess
ed i
s a
stan
d-a
lon
e se
rvic
e,
then
th
is s
core
nee
d n
ot b
e co
nsi
der
ed.
Ext
ent
of v
erti
cal
inte
grat
ion
Th
is m
easu
res
wh
eth
er i
f a
citi
zen
log
s in
fro
m t
he
city
por
tal,
th
e fu
nct
ion
alit
y is
in
tegr
ated
wit
h t
hat
of
th
e st
ate
and
als
o of
th
e co
un
try
for
e.g.
, if
a p
er-
son
ow
nin
g a
par
ticu
lar
city
dri
vin
g li
cen
se t
rave
ls
to o
ther
sta
tes,
his
lic
ense
dat
a sh
ould
be
por
tabl
e fr
om o
ne
stat
e d
ata
base
to
the
oth
er w
ith
rel
evan
t in
dic
ator
s ac
tiva
ted
or
dea
ctiv
ated
. Th
is s
ort
of
inte
grat
ion
wit
hin
on
e d
epar
tmen
t ac
ross
hie
rar-
chy
is c
alle
d v
erti
cal
inte
grat
ion
. In
cas
es w
her
e ve
rtic
al i
nte
grat
ion
is
pos
sibl
e fo
r th
e p
roje
ct u
nd
er
con
sid
erat
ion
, it
is g
rad
ed 5
if
pro
visi
on i
s m
ade
for
it a
nd
in
tegr
ated
, els
e it
is
grad
ed 0
.
Abi
lity
to
acce
ss t
he
serv
ice
at t
he
stat
e or
nat
ion
-al
lev
el f
rom
th
e sa
me
entr
y in
th
e lo
cal
por
tal
Perc
enta
ge o
f se
rvic
es t
hat
hav
e be
en i
nte
grat
ed
Th
is m
easu
res
the
nu
mbe
r of
ser
vice
s or
dep
art-
men
ts t
hat
can
be
inte
grat
ed r
elat
ing
to a
pro
ject
.
Com
ple
te o
ne-
stop
sh
op f
or e
very
go
vern
men
t se
rvic
eA
pro
ject
is
awar
ded
a s
core
of
5 if
an
y p
olic
y or
in
ten
t d
ocu
men
t is
pre
sen
t, t
hat
ou
tlin
es h
ow t
he
curr
ent
sele
cted
pro
ject
wil
l en
able
h
oriz
onta
l se
amle
ss i
nte
grat
ion
in
th
e fu
ture
.

Evaluating e-Government ��
The variety, scope and size of e-governance projects are very large. It is not possible to create a framework that is applicable to all possible projects. It is therefore proposed to confine the current exercise to the projects falling in the following four categories:
•Government to Citizen in the Urban Environment (G2C-U)•Government to Citizen in the Rural Environment (G2C-R)•Government to Business (G2B)•Government to Government (G2G)
The projects can further be categorised on the basis of the investments made. Table 10 brings out the limits for categorisation in respect to pilot projects and rolled-out projects separately. The investments could be by the public or private sectors. In terms of priorities, it is desirable to focus the initial efforts on large projects.
Table 10 Categorisation of projects
Category of project Pilot project Rolled-out project
Small < Rs 3 Cr < Rs 10 Cr
Medium Rs 3 to 10 Cr Rs 10 to 50 Cr
Large >Rs 10 Cr > Rs 50 Cr
Implementation Strategy
What is now required is to develop a theoretically sound approach for de-termining the rankings of the different evaluation methods based on the pa-rameters or the importance of each factor as derived from expert judgment from a given set of options. A methodology using an analytic hierarchy process (AHP) is suggested as a means of formalising the process of deter-mining the suitability, ranking and contrasting of the system. The AHP is a powerful and flexible decision making process which helps people set priorities and make the best decision when both qualitative and quanti-tative aspects of a decision need to be considered. By reducing complex decisions to a series of one-on-one comparisons, and then synthesising the results, AHP not only helps decision makers arrive at the best decision, but also provides a clear rationale of why it is the best. Designed to reflect the way people actually think, AHP was developed in the 1970s by Dr. Tho-mas Saaty, while he was a professor at the Wharton School of Business. It continues to be the most highly regarded and widely used decision-making theory. The AHP process is useful for systematically evaluating qualitative criteria. It also attempts to resolve conflicts and analyse judgments through a proc-ess of determining the relative importance of a set of activities or criteria.
The AHP has been applied to a variety of business decisions and proc-esses requiring a high degree of subjective judgment. Although the AHP

�� e-Governance: Case Studies
process is a subjective weighting technique that relies upon the judgment of the decision maker, it does so in a manner that is more systematic and consistent than traditional subjective decision-making.
The AHP can be summarized in terms of three basic components. First, the principal problem is decomposed into a hierarchy. The top level of the hierarchy represents the overall objective of the process. For e.g., the top level can be the most suitable car in a given segment for a given set of potential customers. Once the top level of the hierarchy has been defined, then the overall objective of the process is broken down into components. These factors compose the second level of the hierarchy. Subsequently, each element in the second level spans a group of sub-elements in the third level. This process is repeated until the final level is reached. The final level represents the array of possible outcomes. In this case, the array of possible outcomes is the weightings of various assets held in a portfolio.
Within each level of hierarchy, the relative importance of all elements de-rived from a single element in the next higher level must be determined. For example, suppose element 1 in level 2 is decomposed in level 3 into three sub-elements, A, B, and G. The AHP determines the relative importance of these three sub-elements by constructing a complete set of pair-wise com-parisons among them. A nine-point scale is used for these comparisons. A score of 9 signifies the highest level of importance for an element relative to other elements, and a score of 1/9th signifies that the element is much less important. If a comparison of A to B is assigned 1, A and B are considered of equal importance. The comparison of B to A would be assigned the recipro-cal value. Interpretations for the pair-wise comparisons are summarised in Table 11. A complete set of such scores constitutes a pair-wise comparison matrix. At the final level of the hierarchy each possible outcome must be considered relative to a single sub-element of the previous level.
In the third and final phase of the AHP, the pair-wise comparison matri-ces are evaluated by solving for their eigenvalues. The eigenvalues repre-sent the weighting functions for each set of pair-wise comparison matrices. Each set of lower level eigenvalues are then scaled by the eigenvalues cor-responding to the next level in the hierarchy. Continuing the process of ei-genvalue extraction and weighting through the levels of the hierarchy leads to a global weighting scale. The global priorities for the final level reflect the decision maker’s relative weights for the alternatives
Table 11 Interpretations for the pair wise comparisons for AHP
Ratings of absolute importance Explanation
Factor A to Factor B Two factors contribute equally to the objective and are of the highest importance.
Factor A to Factor B 3 Experience and judgment moderately favour A over B

Evaluating e-Government ��
Factor A to Factor B 5 Experience and judgment strongly favour A over B
Factor A to Factor B A is strongly favoured over B and its dominance is demonstrated in practice.
Factor A to Factor B The evidence favouring A over is the highest possible.
Factor A to Factor B 2,4,6,8 When compromise is needed.
Reciprocals If Factor A has one of the above numbers assigned to it when compared with activity then B has the reciprocal value when com-pared to A.
Setting up a problem as a hierarchy is an efficient and intuitive way of dealing with complexity and identifying the relevant components of the problem. AHP is flexible in allowing decision makers structure a hierarchy to fit individual needs and preferences. In addition, used in a group setting, AHP to may help to isolate areas of disagreement so that more attention can be focused on them in order to achieve consensus.
Table 12 shows the rating scale that was used for the expert judgment during the evaluation of frameworks.
Table 12 Rating scale for expert judgment in AHP
Value Description for expectation Description for perception
9 The parameter is of utmost importance
The parameter is taken care of and the satisfaction levels are very high.
7 The parameter is important The parameter is taken care of properly and the satisfaction level of the benefi-ciary is high
5 The parameter is somewhat important
The parameter is moderately taken care of, and satisfactory performance is observed.
3 The parameter is less impor-tant
The parameter is not taken care of prop-erly, and unsatisfactory performance against that parameter is observed.
1 The parameter is least important
The parameter is not taken care of at all, and absolutely unsatisfactory perform-ance is noted against the parameter.

�0 e-Governance: Case Studies
The experts were asked to evaluate each of the models based on the three parameters which were found to be the most important. For each of the pa-rameters, marks out of 10 were given.
In the present case of illustration, inputs were taken from the experts and acknowledged persona in the e-governance sector. The number of such inputs was small, and only averaging was done on the inputs thus received. The inputs were used to identify the parameters and also define the impact of one of the parameters with respect to the other. That is, the relative im-portance of the parameters. Each of the experts consulted were asked to rateEach of the experts consulted were asked to rate the relative importance of each of the parameters. These were averaged out in fractions and then converted to the relations as depicted. We can use the relevancy test shown in Table 13 to choose factors that may be applicable to our sort of project. This test is usually done for projects with a heavy tech-nological inclination – a lot of factors need not be included in our project.

Evaluating e-Government �1Ta
ble
13 T
able
for
rel
evan
cy t
est
Fact
orS
ub-
fact
orS
ub-
sub-
fact
orR
elev
ant?
Su
pp
orti
ng
dat
a/ev
-id
ence
/ doc
um
ent/
No
Yes
Cit
izen
-ce
ntr
icit
yE
ffic
ien
cyPe
rcen
tage
com
pli
ance
to
serv
ice
leve
ls s
pec
ifie
d
Tota
l u
ser
tim
e sa
ved
Tot
al u
ser
mon
ey s
aved
Nu
mbe
r of
in
term
edia
ries
rem
oved
Perc
enta
ge i
ncr
ease
in
usa
ge
Perc
enta
ge t
arge
t u
sers
rea
ched
Use
r C
onve
nie
nce
Ava
ilab
ilit
y of
th
e sy
stem
24
×7
Use
of
loca
l la
ngu
age
inte
rfac
e
Sim
pli
city
of
usa
ge
Use
fuln
ess
of h
elp
men
us
Kn
owle
dge
of
serv
ice
pro
vid
er/ s
taff
Con
ven
ien
ce o
f lo
cati
on
Sin
gle
win
dow
in
terf
ace
Ser
vice
s Pr
ovid
edA
lign
men
t of
ser
vice
s p
rovi
ded
to
use
r n
eed
s

�� e-Governance: Case StudiesE
xten
t of
pro
cess
re-
engi
nee
rin
g fo
r re
mov
al o
f n
on-
valu
e ad
ded
act
ion
s
Perc
enta
ge o
f se
rvic
e ch
ain
th
at c
an b
e fu
lly
exec
ute
d
at c
entr
e or
web
Valu
e A
dd
itio
nD
ecre
ase
in c
orru
pti
on
Incr
ease
in
tra
nsp
aren
cy
Incr
ease
in
dem
and
Ava
ilab
ilit
y of
in
form
atio
n
New
ser
vice
s p
rovi
ded
Incr
ease
in
gov
ern
men
t ci
tize
n i
nte
ract
ion
Tech
nol
-og
yA
rch
itec
ture
Com
pre
hen
sive
nes
s of
arc
hit
ectu
re
Con
form
ance
to
nat
ion
al/i
nte
rnat
ion
al a
rch
itec
ture
Ext
ent
of u
se o
f op
en-s
ourc
e sy
stem
s
Sta
nd
ard
sC
omp
lian
ce w
ith
op
en s
tan
dar
ds
Des
ign
an
d a
dop
tion
of
met
a-d
ata
stan
dar
ds
Sec
uri
tyE
xten
t of
com
pli
ance
wit
h s
ecu
rity
arc
hit
ectu
re
Priv
acy
of u
ser
dat
a, p
rese
nt
and
kn
own
to
use
rs
Ext
ent
of u
ser
and
fin
anci
al a
uth
enti
cati
on p
roce
du
re
Dat
a ba
se i
nte
grit
y an
d s
cala
bili
ty

Evaluating e-Government ��D
egre
e of
sca
labi
lity
of
pro
ject
Sca
labi
lity
Sco
pe
for
enh
ance
men
ts o
f H
W i
nte
rfac
es
Sco
pe
to w
ork
wit
h a
lter
nat
e p
ower
an
d c
onn
ecti
vity
Sco
pe
to h
and
le i
ncr
ease
d n
um
ber
of u
sers
Rel
iabi
lity
Acc
ura
cy o
f re
sult
s
Rep
eata
ble
Rep
rod
uci
ble
Mee
ts S
LA p
aram
eter
s
Ext
ern
al A
ud
it
Abi
lity
Sys
tem
for
arc
hit
ectu
re c
omp
lian
ce a
nd
au
dit
Op
en s
tan
dar
ds
com
pli
ance
en
forc
emen
t m
ech
anis
m
Sec
uri
ty s
tan
dar
ds
com
pli
ance
mec
han
ism
Mai
nta
inab
ilit
yE
ase
of i
nst
alla
tion
Ext
ent
of p
aram
eter
isat
ion
for
cu
stom
isat
ion
Tech
nol
ogy
mad
e ac
cord
ing
to I
nd
ian
wea
ther
an
d
usa
ge s
tan
dar
ds
Rem
ote
syst
em m
ain
ten
ance
abi
lity
Alt
ern
ativ
es i
n c
ase
of s
yste
m b
reak
dow
n
Su
stai
n-
abil
ity
Inte
rnal
/ O
rgan
isa-
tion
alO
rgan
isat
ion
al s
tru
ctu
re t
o su
pp
ort
the
pro
ject

�� e-Governance: Case StudiesE
xten
t an
d a
deq
uac
y of
em
plo
yee
trai
nin
g
Rol
e cl
arit
y an
d e
mp
loye
e bu
y-in
Em
plo
yee
invo
lvem
ent
in d
esig
n a
nd
im
ple
men
tati
on
Con
tin
uit
y of
top
ch
amp
ion
s of
th
e p
roje
cts
Exi
sten
ce o
f u
ser
grou
ps
and
ser
vice
rev
iew
s
Ext
ern
al
Peri
od o
f co
nti
nu
ous
fun
ctio
nin
g
Str
engt
h o
f P
PP
arr
ange
men
t
Cos
t-ef
fect
iven
ess
Red
uct
ion
of
cost
to
gove
rnm
ent
Sys
tem
of
coll
ecti
on o
f u
ser
char
ges
Ext
ent
of i
ncr
ease
in
rev
enu
e
Mec
han
ism
to
reco
ver
cap
ital
cos
t
If P
PP,
ext
ent
of c
omm
erci
al v
iabi
lity
to
pri
vate
par
tner
Rep
lic-
abil
ity
Fun
ctio
nal
Ext
ent
to w
hic
h p
roje
ct r
esu
lts
in a
pro
du
ct
Ext
ent
of o
ther
pro
ject
s th
at h
as b
een
rep
lica
ted
in
th
is
pro
ject
(n
ot t
o be
sco
red
)
Tech
nic
alE
xten
t to
wh
ich
pro
ject
res
ult
s in
a p
rod
uct
Ext
ent
of o
ther
pro
ject
s th
at h
as b
een
rep
lica
ted
in
th
is
pro
ject
(n
ot t
o be
sco
red
)
Mu
ltip
le p
latf
orm
dep
loym
ent
feas
ibil
ity

Evaluating e-Government ��Q
ual
ity
of p
roje
ct d
ocu
men
tati
on
Com
mer
cial
Ava
ilab
ilit
y of
com
mer
cial
arr
ange
men
t fo
r re
pli
cati
on
Att
ract
iven
ess
of t
ran
sact
ion
cos
ts t
o in
du
ce r
epli
ca-
tion
Mec
han
ism
for
mar
keti
ng
the
pro
ject
Inte
gra-
tion
Ser
vice
sLi
nks
to
sim
ilar
an
d c
omp
lem
enta
ry s
ervi
ces
Ext
ent
of g
rou
pin
g of
ser
vice
s
Vert
ical
Abi
lity
to
acce
ss t
he
serv
ice
at t
he
stat
e or
fed
eral
lev
el
from
th
e sa
me
entr
y in
th
e lo
cal
por
tal
Perc
enta
ge o
f se
rvic
es t
hat
hav
e be
en i
nte
grat
ed
Hor
izon
tal
Com
ple
te o
ne-
stop
sh
op f
or e
very
gov
ern
men
t se
rvic
e
Sea
mle
ss i
nte
grat
ion

�� e-Governance: Case Studies
Arriving at Weights per Factor
a. For the project concerned, with the help of experts, relevance test is conducted and the factors based on which to evaluate the genre of projects is selected.
b. Once the factors are selected, the hierarchy which the factors follow is obtained.
c. A team of experts assigns weightages to each set of factors at every level of hierarchy. i.e for a set of four sub-factors falling under one main factor, the experts assign them weights such that the sum of weights equals 20.
d. Using this, the relative weightages table of AHP is arrived at.e. From this, the normalisation table is obtained by dividing each cell by
the sum of the elements in that column.f. The factor weight is obtained by averaging each row.g. A confidentiality test is conducted to ensure consistency in assigning
weights. For eg, if sustainability is 3 times as important as replicability and replicability is as important as technology, in that case, sustain-ability cannot be anything but three times as important as technology. But in normal weighting course, due to human error, certain incon-sistencies may creep in. This is verified through the consistency test.
Scoring each Factor
a. For each project, scores ranging from 0 to 5 for each of the relevant factors selected is assigned.
b. The composite score is calculated by multiplying the scores by weights attached to each factor.
c. The hierarchy is moved up and the final project score is calculated
Implementation Flowchart
To implement the above framework, we use the analytic hierarchy process which is a participative decision-making tool. Setting up a problem as a hierarchy is an efficient and intuitive way of dealing with complexity and identifying the relevant components of the problem. AHP is flexible in al-lowing decision-makers to structure a hierarchy to fit individual needs and preferences. In addition, used in a group setting, AHP may help to isolate areas of disagreement so that more attention can be focused on them in order to achieve consensus. Refer to Tables 5–9 for the marking scheme for the AHP to be applied. This comparison is used to indicate the relative im-portance between two parameters taken as a pair at a time. The implemen-tation flowchart for project assessment framework is shown in Fig. 3

Evaluating e-Government ��
Fig. 3 Implementation flowchart for project assessment framework
Illustrative Example
After the relevance test was conducted, the factors arrived at for evaluating a simple project were selected. The hierarchy tree obtained is as follows (Fig. 4):

�� e-Governance: Case Studies
Fig. 4 Relevant factors hierarchy for project assessment
Based on the above, an evaluation sheet (Table 14) is formed using which the assessor can assign scores to the projects. At the same time, the core team needs to calculate the weightages attached to each of the chosen fac-tors in the hierarchy.
Table 14 Sample evaluation sheet for project assessment
Factor Sub-Factors Rating1 2 3 4 5
Remarks
Citizen-centric-ity (F1)
Efficiency: Speed of delivery of service
( ) ( ) ( ) ( ) ( )
User convenience ( ) ( ) ( ) ( ) ( )
Services ( ) ( ) ( ) ( ) ( )
Value adds ( ) ( ) ( ) ( ) ( )
Technology (F2)
Architecture ( ) ( ) ( ) ( ) ( )
Standards ( ) ( ) ( ) ( ) ( )
Security attributes ( ) ( ) ( ) ( ) ( )
Modularity of the software ( ) ( ) ( ) ( ) ( )

Evaluating e-Government ��
Sustainability (F3)
Internal sustainability ( ) ( ) ( ) ( ) ( )
Cost-effectiveness ( ) ( ) ( ) ( ) ( )
External sustainability ( ) ( ) ( ) ( ) ( )
Replicability (F4)
Functional ( ) ( ) ( ) ( ) ( )
Technical ( ) ( ) ( ) ( ) ( )
Commercial ( ) ( ) ( ) ( ) ( )
Each of the experts is asked to assign weights to the factors at all levels of the hierarchy:
These are averaged and the weightage of each factor is obtained (Table 15).
Table 15 Sample weightages of major factors
Weightages of major factors
PART (V) OVERALL WEIGHTAGES (F5)
Please allot 20 points among the following 4 param-eters. Note that he total should be 20
Citizen-centricity 6.5
Technology 4
Sustainability 5.75
Replicability 3.75
Current Sum 20
SUM SHOULD BE = 20
From the above, with the help of ratios, pair-wise comparisons among factors are derived (Table 16).
Table 16 Pair-wise comparison among major factors
P5 Citizen-centricity
Technology Sustainability Replicability
Citizen-centricity 1 3 1 3
Technology 1/3 1 1/3 1
Sustainability 1 3 1 3
Replicability 1/3 1 1/3 1

�0 e-Governance: Case Studies
From the above, the normalised matrix is obtained by dividing each cell with the sum of the elements of that column (Table 17).
Table 17: Normalised matrix for major factors weights
Citizen-centricity 0.3750 0.3750 0.3750 0.3750 0.3750
Technology 0.1250 0.1250 0.1250 0.1250 0.1250
Sustainability 0.3750 0.3750 0.3750 0.3750 0.3750
Replicability 0.1250 0.1250 0.1250 0.1250 0.1250
The final result is the project evaluation, a sample of which is shown in Tables 18–21.
Table 18 Sample project evaluation: Part A
Project title
1. Citizen-centricity
Efficien-cy
User con-venience
Serv-ices
Value addition
Weighted (1a,1b,1c,1d)
1a 1b 1c 1d Weighted (1a,1b,1c,1d)
Samadhan 4 5 5 5 4.7031
Akshaya 4 4 5 4 4.246
KAVERI (Karna-taka valuation and e-registration
5 5 5 5 4.9995
e-Krishi Vipanan (ekvi)
4 4 4 5 4.2103
Municipal corpo-ration resource planning (MCRP)
4 4 4 5 4.2103
e-governance and citizens’ charter
5 5 5 5 4.9995
e-Gram Suvidha 4 4 3 3 3.5425
e-Sagu: Web-based agricultural expert advice dissemination system
4 5 4 4 4.246
CaseiInformation system (district courts computeri-sation)
4 4 4 4 3.9996

Evaluating e-Government �1Ta
ble
19 S
amp
le p
roje
ct e
valu
atio
n: P
art
B
2.
Tec
hn
olog
y
Proj
ect
titl
e
Arc
hit
ectu
reS
tan
dar
ds
Sec
uri
tyM
odu
lari
tyW
eigh
ted
(2
a,2b
,2c,
2d)
2a2b
2c2d
Wei
ghte
d
(2a,
2b,2
c,2d
)
Sam
adh
an3
24
33.
2
Aks
hay
a4
44
44
KA
VE
RI
(Kar
nat
aka
valu
atio
n a
nd
e-r
egis
trat
ion
43
44
3.8
e-K
rish
i V
ipan
an (
ekvi
)4
44
54.
2
Mu
nic
ipal
cor
por
atio
n r
esou
rce
pla
nn
ing
(MC
RP
)5
44
54.
4
e-go
vern
ance
an
d c
itiz
ens’
ch
arte
r 4
32
22.
6
e-G
ram
Su
vid
ha
44
44
4
e-S
agu
: Web
-bas
ed a
gric
ult
ura
l ex
per
t ad
vice
dis
sem
ina-
tion
sys
tem
44
35
3.8
Cas
e in
form
atio
n s
yste
m (
dis
tric
t co
urt
s co
mp
ute
risa
tion
)4
34
54

�� e-Governance: Case StudiesTa
ble
20 S
amp
le p
roje
ct e
valu
atio
n: P
art
C
Pr
ojec
t ti
tle
3. S
ust
ain
abil
ity
Inte
rnal
su
s-ta
inab
ilit
yE
xter
nal
su
s-ta
inab
ilit
yC
ost
effe
c-ti
ven
ess
Wei
ghte
d
(3a,
3b,3
c,3d
)
3a3b
3cW
eigh
ted
(3
a,3b
,3c,
3d)
Sam
adh
an5
45
4.83
02
Aks
hay
a5
55
5
KA
VE
RI
(Kar
nat
aka
valu
atio
n a
nd
e-r
egis
trat
ion
44
44
e-K
rish
i V
ipan
an (
ekvi
)3
35
3.88
58
Mu
nic
ipal
cor
por
atio
n r
esou
rce
pla
nn
ing
(MC
RP
)4
34
3.83
02
e-go
vern
ance
an
d c
itiz
ens’
ch
arte
r 4
34
3.83
02
e-G
ram
Su
vid
ha
54
44.
3873
e-S
agu
: Web
-bas
ed a
gric
ult
ura
l ex
per
t ad
vice
dis
sem
ina-
tion
sys
tem
43
43.
8302
Cas
e in
form
atio
n s
yste
m (
dis
tric
t co
urt
s co
mp
ute
risa
tion
)4
44
4

Evaluating e-Government ��
Table 21 Sample Project Evaluation:Part D
Project title
Overall Rank
Weighted (4a,4b,4c,4d)
Weighted (4a,4b,4c,4d)
Samadhan 4.5 4.5374875
Akshaya 3.5 4.40475
KAVERI (Karnataka valuation and e-registra-tion
3.5 4.2873125
e-Krishi Vipanan (ekvi) 4.75 4.1547875
Municipal corporation resource planning (MCRP)
4.5 4.1276875
e-governance and citizens’ charter 2.75 3.9798875
e-Gram Suvidha 3.75 3.942425
e-Sagu: Web-based agricultural expert advice dissemination system
3.5 3.941075
Case information system (district courts com-puterisation)
3.5 3.93735
PKI project 3.75 3.8643
Thus we see that composite scores have been identified for each of the ten projects with relevant factors in the evaluation frame. We can change the set of parameters based on which to evaluate depending upon the pur-pose of the project.
Re-valuation of the E-governance Assessment Framework, led us to re-assemble some of the factors and add a new category called integration based on our review of projects for the CSI–Nihilent National E Governance Awards 2005. We also proposed and illustrated a detailed methodology to capture the scores without any assumption or pre-conceived notion error.
Overall Impact of e-Government
The overall impact of e-government can be felt on many aspects that in-clude saving taxpayers money, government’s time, support for small busi-nesses, dissuading corruption, promoting participation in government and also streamlining government operation. But this impact of e-governance cannot be measured adequately by using the traditional cost–benefit analy-

�� e-Governance: Case Studies
sis and return on investment calculations. Usage of e-government services determines the return on investment. People’s awareness about e-govern-ment services must be increased extensively to ensure higher usage and maximise the return on investment. This has to be coupled with a continu-ous assessment of the level of acceptance of citizens with the help of prefer-ence polls, customer satisfaction surveys and online trend monitoring.
Due to the tight budgetary situation felt by all governments universally, there was a need to measure the overall impact of e-governance – a proposi-tion generally found to be difficult. Also government CIOs require guide-lines on the subject. This necessitated the US government to constitute an Intergovernmental Advisory Board (IAB) consisting of three federal, three state and three local government chief information officers, IT experts in GSA and Federation of Government Information Processing Councils. GSA is a centralised agency in USA for federal procurement and property man-agement. The objective of the IAB was to identify the quality that make as e-governance programme exceptionally valuable to its sponsors, and how these sponsors measure the payoff delivered. The IAB report was released in May 2003 in ‘High Payoff in Electronic Government: Measuring the Re-turn on E-Govenmnent Investments’. This report defines ‘high payoff’ as a value for taxpayers by cost saving, economic development, synergies achieved through integration of government processes, strengthened dem-ocratic processes, and service to citizens and other constituent groups. It offered the following measures :
• Financial: Reduced costs of government operations/enhanced revenue collection. Web-enabling customer service processes eliminates pa-perwork and printing
• Economic development • Reduced redundancy: Consolidating and integrating government sys-
tems• Fostering democratic principles. • Improved service to citizens and other constituencies.
The above categories are broad and to measure the performance of spe-cific programmes will require a specific tool for each different value. Any e-government programme should address at least one of the above catego-ries. More successful ones will provide benefits in more than one area. The alignment of the performance objectives of the programme and that of its sponsors, with the nature of benefits determines the appropriate metrics. These might include
• Financial measures, such as return on investment, cost–benefit analy-sis, including net present value and internal rate of return
• Indicators of public approval and acceptance, such as customer satis-faction measures and e-government take-up, or adoption rates
• Benchmarking• Balanced scorecard measures• Business cases

Evaluating e-Government ��
• Portfolio analysis and risk management.
The measures suggested above at best serve the purpose of being treated as a broad framework of evaluating an e-governance programme. Look-ing for hard numbers to determine government project viability is never recommended; so is the case with the e-government projects since these are primarily driven with the aim to deliver better service to citizens/busi-ness/interest group constituency. It is, therefore, prudent to deal with e-government project case-by-case and take into account the quality, speed and comprehensiveness of the service to citizen, economic deficiency, and alignment with government’s strategic/political priorities. In any evalua-tion approach, importance of factors such as risk of changing technology, potential overruns of cost and changing requirement of the users, cannot be over-emphasised.
Concluding Remarks
Evaluation of e-government is necessary but approaches are not standard. Choice of an evaluation method would depend on what aspect of e-govern-ment we want to evaluate. There are three broad identifiable scenario of evaluation: e-readiness of the context, performance of specific e-govern-ment projects or programmes and overall impact of e-government on vari-ous developmental factors. Several approaches have been attempted by the researcher who recommends the choice to be dependant upon a particular situation. An overall evaluation could be ascertained in the broader frame-work discussed in this chapter. The framework provided is by no means op-timal. Based on other ideas and research, the framework can be changed for which the grading and subsequently, various qualitative aspects of meas-urements could change.
Notes
Mingers J. (1997). Towards critical pluralism. In: Mingers J and Gill A (eds). Mul-timethodology: Theory and Practice of Combining Management Science Methodolo-gies. Chichester: Wiley. p. 407–440.
Wolstenholme E.F. (1999). Qualitative vs quantitative modelling: The evolving bal-ance. Journal of the Operational Research Society 50: p.422–428.
Munro I. and Mingers J. (2002). The use of multimethodology in practice—results of a survey of practitioners. Journal of the Operational Research Society 53: p. 369–378.
Seitz N.E. (1989). Capital budgeting and long term financing decision. Hindsdale IL: Dyden Press.
Glazer A., Kanniainen V., Niskanen E. (2002). Bequests, control rights, and cost–

�� e-Governance: Case Studies
benefit analysis. European Journal of Political Economy. 19: p. 71–82.
Shinjo K.,and Zhang X. (2003). Productivity analysis of IT capital stock: The USA–Japan comparison. J. Japanese Int. Economies 17 (1): p. 81–100.
Brynjolfsson E. and Hitt L.M. (1998). Beyond the productivity paradox. Communi-cations of ACM 41 (8): p. 49–55.
Kaylor C., Deshazo R., and Eck V. D. (2001). Gauging e-government: A report on implementing services among American cities. Government Information Quarterly 18: p. 293–307.
West, D.M. (2000). Assessing e-government: The internet democracy, and service de-livery. Available: http://www.insidepolitics.org/govtreport00.html (30 March 2003)
Green C.B. (1993), Benchmarking the IT function, NY: The Conference Board.
Turban E, & Mclean E, & Wetherbe J. (2001). Information technology economics. In-formation Technology for Management, Making Connections for Strategic Advantage. New York: John Wiley & Sons Inc.:p. 557–601.
Layne K., & Lee J. (2001). Developing fully functional e-government: A four stage model. Government Information Quarterly 18: p. 122–136.
Feltham G.A. (1972). Information Evaluation. Sarasota, Fla: American Accounting Association.
Gupta M. P. (1999). Assessing return on information. South Asian Journal of Man-agement 6 (3&4): p.1–19.
High Payoff in Electronic Government: Measuring the Return on E-Government In-vestments. The IAB report. 2003.