Embed Size (px)
Citation preview
Chapman and Ward HMPOR slide 1 © 2011 John Wiley & Sons Ltd.
Chris Chapman and Stephen Ward
How to Manage Project Opportunity and Risk
Why uncertainty management
can be a much better approach than risk management

Chapman and Ward HMPOR slide 2 © 2011 John Wiley & Sons Ltd.
Some introductory comments
• What do you want to take away?• Course structure• Course text• Other reading• Case studies• Participant background variations• Other issues• Questions?

Chapman and Ward HMPOR slide 3 © 2011 John Wiley & Sons Ltd.
Part one – setting the scene
• An unrestricted view of basic definitions• A broad view of projects• Two key project frameworks• Uncertainty, risk and opportunity relationships• Some key perspectives and concepts• Key motives for uncertainty management• Generic process frameworks

Chapman and Ward HMPOR slide 4 © 2011 John Wiley & Sons Ltd.
Basic definitions and their nominal/default nature
• Uncertainty – lack of certainty
• Risk – possible unfavourable outcomes
• Opportunity – possible favourable outcomes

Chapman and Ward HMPOR slide 5 © 2011 John Wiley & Sons Ltd.
Projects (programmes and portfolios)
Turner (1992) provides a useful illustrative definition of a project:
an endeavour in which human, material and financial resources
are organised in a novel way, to undertake a unique scope of work of given specification,
within constraints of cost and time, so as to achieve unitary, beneficial change,
through the delivery of quantified and qualitative objectives.

Chapman and Ward HMPOR slide 6 © 2011 John Wiley & Sons Ltd.
Project system examples
(a) Chain configuration: stages in a primary project may be managed as a chain of component projects.
(b) Parallel configuration: aspects of a primary project may be managed as a set of parallel component projects.
(c) Project hierarchy: the primary project as a three-level hierarchy of component projects.
component component component
primary project
Time
component project
component project
component project
primary project
Time
Time
tertiary project
tertiary project
secondary project
tertiary projectsecondary project
primary project
component component component

Chapman and Ward HMPOR slide 7 © 2011 John Wiley & Sons Ltd.
Corporate, operations and project management as three interlocking perspectives

Chapman and Ward HMPOR slide 8 © 2011 John Wiley & Sons Ltd.
A traditional four stage asset lifecycle example
Basic lifecycle stages
Dominant management aspect
Conceptualisation Operations or corporate management initially, then corporate management
Planning Corporate management initially, then project management
Execution and delivery
Project management
Utilisation Operations management

Chapman and Ward HMPOR slide 9 © 2011 John Wiley & Sons Ltd.
Conceptualisation decomposed
Stage purposes Steps Labels
Concept, project objectivesand business casedevelopment incorporatestrategy terms
Trigger event Concept captureClarification of project purposeConcept elaborationBusiness case developmentConcept, objectives and business case evaluation in corporate strategy terms
Concept shaping
Governance Consolidate plans and confirm deliverables Concept gateway

Chapman and Ward HMPOR slide 10 © 2011 John Wiley & Sons Ltd.
Planning decomposed
Design, operations and termination (DOT) strategy development from a design and operations management perspective
Design and operations strategy capture from
corporate strategy Development of lifecycle performance
criteriaIntegrated development of design,
operationsand termination strategy Integrated evaluation of design, operations and termination strategy
DOT shaping
Governance Consolidate plans and confirm deliverables
DOT gateway
Execution and delivery (E&D) strategy development from a project management perspective
Activity and related resource use capture from
corporate strategy and design strategyDevelopment of timing targets and
milestonesStrategic plan development for execution
and delivery Evaluation of execution and delivery
strategy
E&D shaping
Governance Consolidate plans and confirm deliverables
Strategy gateway
Detailed design and planning for execution, delivery, operation and termination purposes
Shifting the perspective to implementation Development of detailed design and
planning criteria for implementation purposesDevelopment of detail designs and plansDevelopment of resource allocation and contracting criteriaDetailed design and plan evaluation
Tactics shaping
Governance Consolidate plans and confirm deliverables
Tactics gateways

Chapman and Ward HMPOR slide 11 © 2011 John Wiley & Sons Ltd.
Execution and delivery decomposed
Execution Implementation of actions plans Coordinate, control and monitor progressModification of all targets, commitments and
resourceallocations as neededOngoing execution evaluation
Execution
Delivery Undertake delivery Deliverable modificationManage stakeholder expectations about delivery and operational performance Delivery evaluation
Delivery

Chapman and Ward HMPOR slide 12 © 2011 John Wiley & Sons Ltd.
Utilisation decomposed
Operation and support(O&S)
Operational utilisation of asset Ongoing development of operations & support
criteriaOngoing development of operations & support Ongoing operations & support evaluation
O&S
Termination Development of detailed plans for transfer of ownership
or replacement or decommissioningTermination executionTermination evaluation
Termination

Chapman and Ward HMPOR slide 13 © 2011 John Wiley & Sons Ltd.
Key project definition questions – the seven Ws
1. who who are the parties involved?
parties
2. why what do the parties want to
achieve?
motives
3. what what is the deliverable product the parties areinterested in?
design
4. whichway how will all relevant plans in
each lifecycle stage deliver
what is needed?
plans for: relationships and contracts,
business case purposes,
operations, activities
5. wherewithal
what key resources arerequired to achieve
executionof these plans?
resource plans for: operations, activities
6. when when do all relevant events
have to take place?
integration of all plan-based timetables
7. where where will the project takeplace? (in location and allother context terms)
context

Chapman and Ward HMPOR slide 14 © 2011 John Wiley & Sons Ltd.
Key project definition questions – the seven Ws
whatthe design ofthe product
of the project
who
all project parties ultimately involved
plans for relationships
and contracts
plans foroperations
why
project motives: profit and
other motives
plans forbusiness case
purposes
wherewithal
resource plans for activities
whenintegration of all
plan-based timetables
whichway
plans foractivities
resource plans for operations
where - the location of theproject and all the relevant wider context issues

Chapman and Ward HMPOR slide 15 © 2011 John Wiley & Sons Ltd.
Key components of uncertainty
• Ambiguity uncertainty• Inherent variability• Event uncertainty• Systemic uncertainty

Chapman and Ward HMPOR slide 16 © 2011 John Wiley & Sons Ltd.
Most ‘sources of uncertainty’ are composites of two or more of these basic components of uncertainty, decomposition of uncertainty raises key questions about what structure is best suitedto the decomposition task in the particular context involved, and ‘events’ or ‘conditions’ is never the exclusive or universal answer.

Chapman and Ward HMPOR slide 17 © 2011 John Wiley & Sons Ltd.
Using the performance lens and the knowledge lens
uncertainty
‘the project’
uncertainty about theachievement of objectives
do we wantto continue to developthis project?
opportunityandrisk
all other views ofuncertainty
what else do we need to knowto get to the next stage?
how should weshape our plansto get to the next stage?
what do weneed to doto get to thenext stage?
performance lens
knowledge lens
how does thisproject fit ouroverall strategyand operations plans?

Chapman and Ward HMPOR slide 18 © 2011 John Wiley & Sons Ltd.
The role of criteria-plan relationship structures
• Plans for activities• Resource plans for activities• Plans for operations• Resource plans for operations• Plans for relationships and contracts• Plans for business case purposes • Integration of all plan-based timetables• The design of the product of the process• All the motives for being involved in the project• All the parties involved with relevant plans

Chapman and Ward HMPOR slide 19 © 2011 John Wiley & Sons Ltd.
Possible criteria value outcomes: a simple interval estimate example
0
Probability
Outcome value
Density formatportrayal
0 5 10 15 Outcome value
0
1.0
Cumulative probability
0.5
the medianis equal to theexpected value
Cumulative probability format
0 5 6 10 14 15

Chapman and Ward HMPOR slide 20 © 2011 John Wiley & Sons Ltd.
An illustration of the approximation involved using a density portrayal
Probability
0 5 6 10 14 15
0
Outcome value
presumed reality, although multiple modes may be involved
working assumptions for the model

Chapman and Ward HMPOR slide 21 © 2011 John Wiley & Sons Ltd.
Targets, commitments and expected values
• Using P10 a default target, and alternatives• Using P90 as a default commitment, and alternatives• Expected values, and alternative ‘best estimates’• Provisions• Contingencies• Range estimates as a default, and point estimate
alternatives• Expected values as an opportunity/risk datum, and
alternatives• A clear opportunity/risk/uncertainty relationship• Clarifying relationships between plans and outcomes

Chapman and Ward HMPOR slide 22 © 2011 John Wiley & Sons Ltd.
A basic probability-impact grid (PIG)
Probability
high
low
low medium high
medium
Impact
p1
p2
p0 = 0
p3 = 1
i0 = 0 i1 i2 i3
r2 r3 r4
r1 r2 r3
r3 r4 r5

Chapman and Ward HMPOR slide 23 © 2011 John Wiley & Sons Ltd.
Sensitivity diagram: Highways Agency example
Cumulative probability
1. base value estimating uncertainty2. uncertainty associated with previous risk registers3. other uncertainty sources which the HA is held accountable for which have not been considered at a portfolio level
Cost as a % of the base estimate value
1.0
0
0.5
base estimate value
1 2 3
Probability curves show the cumulative effect of:
100 150 200
P90
P50
P10

Chapman and Ward HMPOR slide 24 © 2011 John Wiley & Sons Ltd.
Extract from Sally’s BCS cost estimate and contract
Item description
Target minimum
Target maximum
Target mid-point
Remove old floor covering and prepare surfaceLay new flooring Provision for cleanup and other
time
4 8 2
12 12 6
8 10 4
Total hours Total cost
14 £ 420
30 £ 900
22 £ 660
Estimated value contract option basis is £ 660 + 10% = £ 726
Chapman and Ward HMPOR slide 25 © 2011 John Wiley & Sons Ltd.
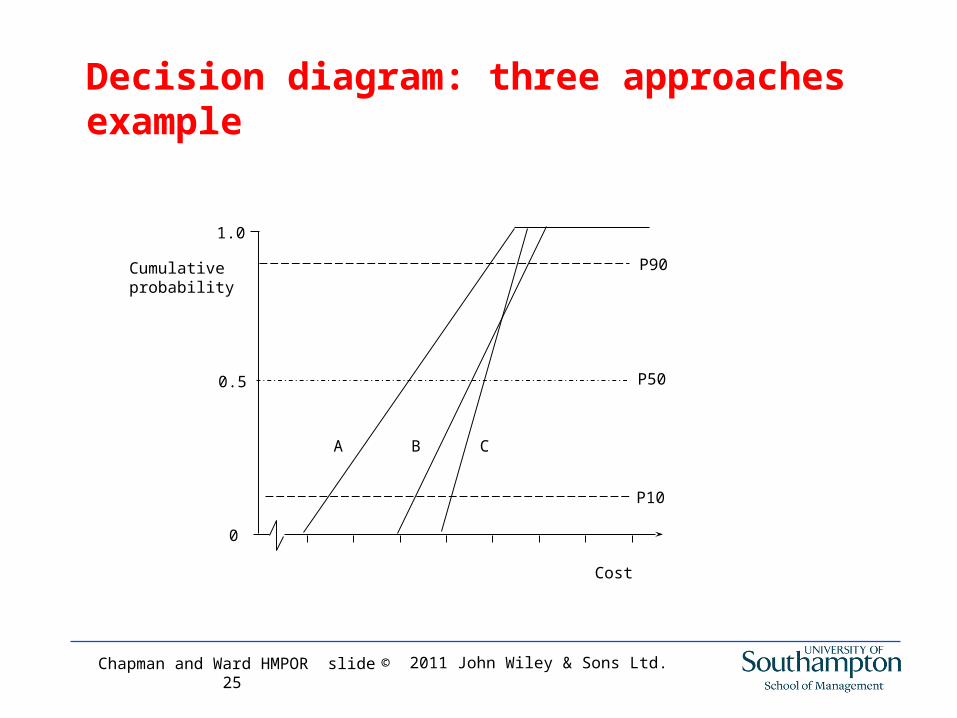
Decision diagram: three approaches example
Cumulative probability
Cost
0.5
1.0
0
A CB
P10
P90
P50

Chapman and Ward HMPOR slide 26 © 2011 John Wiley & Sons Ltd.
Clarity efficiency: ‘efficient frontier’ portrayal
cost (of acquiring clarity)
clarity(insightwhich can be shared)
Key:
a
b3
cd
competent management area
e1
non-feasible area
b2
b1
e2 e3
incompetent management area
a-c efficient boundary target, with a maximum clarity approach c minimum clarity approach bi intermediate approaches c-d inappropriate clarity levels ei
inefficient approaches

Chapman and Ward HMPOR slide 27 © 2011 John Wiley & Sons Ltd.
Sensitivity diagram: activity level example
5th yearMar NovDec Jan Feb Apr May Jun Jul Aug Sep Oct
Probabilityof achievementby dates indicated
0.2
0.4
0.6
0.8
1
0
0.3
0.5
0.7
0.9
0.1
Base plan completion date
1 2 3 4
56
Notes:1. the curves assume a minimum fabrication period of 20 months2. no work is transferred offsite to improve progress3. no major fire, explosion or other damage
Probability curves show the cumulative effect of the following sources of uncertainty:
1. yard not available, or mobilisation delays2. construction problems / adverse weather3. subcontracted nodes delivery delays
6. delayed award of fabrication contract
4. material delivery delays5. industrial disputes

Chapman and Ward HMPOR slide 28 © 2011 John Wiley & Sons Ltd.
Risk efficient options: ‘efficient frontier’ portrayal
risk (in terms of all relevant objectives)
expectedreward(profitor a moregeneralcompositeofpositiveobjectives)
a-c efficient boundary target, with a maximum reward approach c minimum reward approach bi intermediate reward approachesc-d inappropriate reward levels ei inefficient approaches
Key:
a
b3
cd
competent management area (opportunity management area)
e1
non-feasible area
b2
b1
e2 e3
incompetent management area

Chapman and Ward HMPOR slide 29 © 2011 John Wiley & Sons Ltd.
Decision diagram: one risk efficient choice example
Cost
0.5
1.0
Cumulative probability
0
expected costusing the 1.6 m barge
expected costusing the 3.0 m barge
3.0 m barge curve
1.6 m barge curve

Chapman and Ward HMPOR slide 30 © 2011 John Wiley & Sons Ltd.
Decision diagram: two risk efficient choices example
Cost
0.5
1.0
Cumulative probability
0
1.6 m barge curve
3.0 m barge curve
expected cost using the 1.6 m barge
expected costusing the 3.0 m barge
Chapman and Ward HMPOR slide 31 © 2011 John Wiley & Sons Ltd.
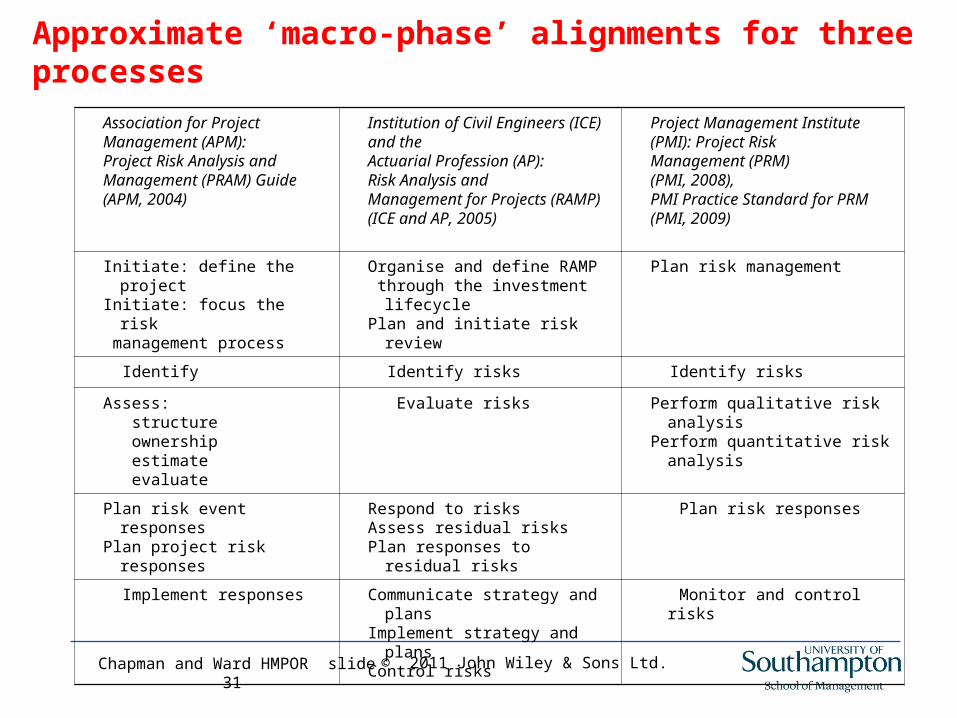
Approximate ‘macro-phase’ alignments for three processes
Association for ProjectManagement (APM): Project Risk Analysis and Management (PRAM) Guide (APM, 2004)
Institution of Civil Engineers (ICE) and the Actuarial Profession (AP): Risk Analysis and Management for Projects (RAMP) (ICE and AP, 2005)
Project Management Institute (PMI): Project Risk Management (PRM) (PMI, 2008), PMI Practice Standard for PRM (PMI, 2009)
Initiate: define the projectInitiate: focus the risk management process
Organise and define RAMP through the investment lifecyclePlan and initiate risk review
Plan risk management
Identify Identify risks Identify risks
Assess: structure ownership estimate evaluate
Evaluate risks Perform qualitative risk analysisPerform quantitative risk analysis
Plan risk event responsesPlan project risk responses
Respond to risksAssess residual risksPlan responses to residual risks
Plan risk responses
Implement responses Communicate strategy and plansImplement strategy and plansControl risks
Monitor and control risks

Chapman and Ward HMPOR slide 32 © 2011 John Wiley & Sons Ltd.
The basic PUMP process
Seven phase basic PUMP portrayal Basic PUMP portrayal as three macro-phases
define the projectfocus the process
develop the basis for analysis
identify all relevant sources, responses, conditions
structure all uncertaintyclarify ownership
execute the qualitative analysis
quantify some uncertaintyevaluate all the relevant implications
execute the quantitative analysis

Chapman and Ward HMPOR slide 33 © 2011 John Wiley & Sons Ltd.
Basic PUMP process flowchart
define the project
focus the process
identify sources, responses, conditions
structure all uncertainty
clarify ownership
quantify some uncertainty
evaluate all implications
start
stop
the context is importantin each of the seven phases

Chapman and Ward HMPOR slide 34 © 2011 John Wiley & Sons Ltd.
Example PUMP bar chart for the first pass
PUMPphase
define
focus
structure
ownership
quantify
evaluate
identify
start of the process
end of the firstcomplete cycle
intense activity ongoing activity intermittent activityKey:

Chapman and Ward HMPOR slide 35 © 2011 John Wiley & Sons Ltd.
Five key shortcomings of common practice risk management processes
1.A focus phase equivalent which is not used as a flexible basis for adjusting the process to the context of a particular project, or used to modifying the process as the project lifecycle progresses, beginning with concept shaping and ending with project termination.
2.A focus phase equivalent which is unclear about the motives for the process in relation to the various interested parties, or the links between motives for analysis of uncertainty, opportunity and risk and the models selected.
3.A define phase equivalent which is too detailed in terms of activities, and which fails to address all seven Ws, the project lifecycle, and linking financial cash flow models in a balanced manner.
4.An identify phase equivalent which is limited to event based uncertainty, which cannot cope effectively with composite uncertainties, and which fails to structure sources of uncertainty and associated risk and responses usefully, often generating excessively long and detailed ‘risk registers’ that address minor issues in excessive detail.
5.Absence of a structure phase equivalent, with little evidence of robustness testing or effective structuring decisions, including the lack of a significant search for common or general responses and a failure to identify significant linkages and interdependences between important sources of uncertainty.

Chapman and Ward HMPOR slide 36 © 2011 John Wiley & Sons Ltd.
Five more key shortcomings of common practice risk management processes
1.Lack of an explicit ownership phase equivalent, with resulting inadequate attention to the implications of contractual arrangements for motivating parties to manage uncertainty, including inappropriate use of simple contracts.
2.A quantify phase equivalent which is costly but not cost effective, ineffectively linked to earlier qualitative analysis, resulting in biased estimates that are usually highly conditional on scope assumptions and other assumptions which are lost sight of.
3.An evaluate phase equivalent which combines different sources of uncertainty without capturing crucial dependence or without providing the insight to clarify how revisiting earlier analysis can clarify uncertainty where appropriate, develop effective responses where appropriate, facilitate crucial choices to achieve risk efficiency and balance, or demonstrate the robustness of those choices when necessary.
4.Absence of an effective iterative process structure which embeds all seven PUMP phases and a failure to distinguish planned iterations which involve limited costs, successive applications of an iterative process as a project lifecycle progresses, and unplanned iterations to deal with surprises which are costly.
5.Lack of a clear and shared understanding of all relevant objectives, measurable or not, with an orderly process for considering all relevant tradeoffs in opportunity efficiency terms.
Chapman and Ward HMPOR slide 37 © 2011 John Wiley & Sons Ltd.
Part one review, questions and discussion

Chapman and Ward HMPOR slide 38 © 2011 John Wiley & Sons Ltd.
Part two – the basic PUMP process
• Assume the project is in the execution and delivery strategy shaping stage most of the time
• Assume a client perspective most of the time
• Assume a high clarity approach most of the time

Chapman and Ward HMPOR slide 39 © 2011 John Wiley & Sons Ltd.
The process as a programme of projects
• Each phase is a project – use the Gantt chart• The programme is a portfolio of 7 projects• The portfolio needs holistic management• Everything we know about good project and
programme/portfolio management can be brought to bear on managing the process
• This includes uncertainty management• Portfolio/programme/project uncertainty management
distinctions are a question of degree for present purpose, a process ‘driver’
Chapman and Ward HMPOR slide 40 © 2011 John Wiley & Sons Ltd.
Process ‘drivers’ and linked assumptions
When looking at each phase in detail, what is
involved is a function of process ‘drivers’, so
we have to make assumptions for discussion
purposes. Some key process drivers (and
the related assumptions) are:
- strategy / tactical level of the project (strategic)
- perspective and motives (client wanting insight)
- learning curve position (low down)- decisions of interest (shaping strategic plans for
execution and delivery as per the assumed stage)

Chapman and Ward HMPOR slide 41 © 2011 John Wiley & Sons Ltd.
The ‘qualitative analysis’ part of the process in detail, considering it phase by phase, starting with the ‘basis of analysis’ part of the process

Chapman and Ward HMPOR slide 42 © 2011 John Wiley & Sons Ltd.
Define the project
• This phase involves problem structuring ‘craft skills’, a key aspect of the modelling skills required by the person in charge of leading and shaping the process, the ‘process manager’
• All ‘process staff’ require interpersonal skills• The importance of using a simple strategic level activity
(task) structure aligned with the nature of the risks involved• The need to move from a task orientation to an objectives
orientation• The role of the 12 stage nominal project lifecycle• The role of the 7 Ws framework and the plan-criteria
relationship structure

Chapman and Ward HMPOR slide 43 © 2011 John Wiley & Sons Ltd.
Key project definition questions – the seven Ws
whatthe design ofthe product
of the project
who
all project parties ultimately involved
plans for relationships
and contracts
plans foroperations
why
project motives: profit and
other motives
plans forbusiness case
purposes
wherewithal
resource plans for activities
whenintegration of all
plan-based timetables
whichway
plans foractivities
resource plans for operations
where - the location of theproject and all the relevant wider context issues

Chapman and Ward HMPOR slide 44 © 2011 John Wiley & Sons Ltd.
Define phase specific tasks
the project parties
the project design
the project objectives
the wherewithal plans
the project timing
the project lifecycle
deliverables fit for purpose?
no
yes
complete the focus
phase
elaborate and resolve
start the
process
consolidate
the whichway plans
the project context

Chapman and Ward HMPOR slide 45 © 2011 John Wiley & Sons Ltd.
Four common tasks for all phases
• document – record in text, tables and diagrams, with a view to ease of understanding for all parties involved
• verify – ensure all providers of information agree as far as possible, and important differences of opinion are highlighted
• assess – evaluate the analysis to date in context to ensure it is ‘fit for purpose’
• report – release verified documents and present findings as appropriate

Chapman and Ward HMPOR slide 46 © 2011 John Wiley & Sons Ltd.
A simple BCS example to compare with the offshore North Sea examples used to illustrate the define phase earlier

Chapman and Ward HMPOR slide 47 © 2011 John Wiley & Sons Ltd.
Focus the process
• This phase involves ‘process design’ craft skills, a crucial aspect of modelling skills needed by the ‘process manager’
• Understanding what these ‘process design’ craft skills involve is a core requirement for those aspiring to manage the process
• It is also crucial for decision takers – who have to trust their judgement when selecting advisors – to ensure that they have a clear idea what they are looking for in terms of ‘process design’ skills
• A useful place to start to understand what is involved is an overview of the task structure for this phase

Chapman and Ward HMPOR slide 48 © 2011 John Wiley & Sons Ltd.
Focus phase specific tasks
clarify the process partiesclarify the process objectives
top-down uncertainty appreciation
consolidate the process strategy
needsdevelopment
unacceptable
start the process
scope the process
clarify the process lifecycle clarify the process context
needsdevelopment
select a process approach
determine resources required
determine timing
plan the process
unacceptable
assess the process
scope
satisfactory
assess the process
plan
satisfactory
stop theproject
to theIdentify phase

Chapman and Ward HMPOR slide 49 © 2011 John Wiley & Sons Ltd.
Some of the objectives which may be relevant
• Risk efficiency• Clarity efficiency• Opportunity efficiency• Opportunity management as the dominant goal• Culture change• Targets, expectations and commitments distinguished• Contingencies and provisions clarified and given clear
owners• Bottom up communication encouraged, with a shared
‘big picture’ perspective• Creativity and satisfaction (fun) used as effective
objectives

Chapman and Ward HMPOR slide 50 © 2011 John Wiley & Sons Ltd.
Key concerns which are often not addressed
• What subset of these objectives is appropriate for this particular application of the generic process
• How should the process be shaped to this subset of appropriate objectives
• What are the other important drivers, like value at risk, project novelty, project complexity, time and resources available, learning curve position, lifecycle position, decisions of interest, and strategy/task level focus
• Which of the 7 Ws is the focus, and how do the objectives of immediate interest relate to the plans which are most relevant
• What are the most important questions which need addressing first

Chapman and Ward HMPOR slide 51 © 2011 John Wiley & Sons Ltd.
Simple predesigned processeslike the BCS example, evolving complex processes like the BP offshore North Sea examples, and the implications for a range of intermediate contexts, with examples like the Highways Agency and National Power

Chapman and Ward HMPOR slide 52 © 2011 John Wiley & Sons Ltd.
Identify all relevant sources, responses & conditions
• This phase is relatively straightforward if it is not confused with common practice event uncertainty identification processes
• A basic understanding of modelling issues is needed (the minimum - maximum clarity spectrum needs to be understood, for example) and a clear understanding of clarity efficient uncertainty decomposition is crucial
• A basic concern is the level of detail required and the way the depth of decomposition required needs to be developed on successive passes
• A useful place to start to understand what is involved is an overview of the task structure for this phase

Chapman and Ward HMPOR slide 53 © 2011 John Wiley & Sons Ltd.
Identify phase specific tasks
clarify the immediate priorities
decompose the next priority source if this is appropriate clarify the relevant primary responses
clarify the relevant secondary sources and responses
deliverables fit for purpose?
no
yes
to the structure
phase
from earlier phases
search and classify
clarify the immediate needfor more breadth or depth
clarify the relevant conditions
Chapman and Ward HMPOR slide 54 © 2011 John Wiley & Sons Ltd.
Offshore project examples of immediate priorities,the composite nature of relevant sources of uncertainty,secondary sources of uncertainty, and sources best treated as conditions

Chapman and Ward HMPOR slide 55 © 2011 John Wiley & Sons Ltd.
A table of generic response types
Type of response Method of handling uncertainty
Modify objectives Reduce or raise performance targets expressed as constraints, changing tradeoffs between multiple objectives
Avoid Plan to avoid specified sources of uncertainty
Influence probability Change the probability of potential variations
Modify consequences Modify the possible consequences of variations
Transfer consequences Transfer consequences to another party via contract provisions or insurance
Develop contingency plans
Set aside resources or make other plans to provide a reactive ability to cope
Keep options open Delay choices and commitments, choosing versatile options
Monitor Collect and update data about all sources of uncertainty
Accept Acknowledge and accept uncertainty, doing nothing about it
Remain unaware Ignore uncertainty, taking no action to identify or manage it
Optimise all the above Explicitly recognise the value of selecting an optimal combination

Chapman and Ward HMPOR slide 56 © 2011 John Wiley & Sons Ltd.
Some illustrations of process variants in the identify phase, building on earlier offshore project examples, including common shortcomings and simple contexts when minimum decomposition of all relevant uncertainty is the key, as in the Highways Agency example

Chapman and Ward HMPOR slide 57 © 2011 John Wiley & Sons Ltd.
The checklist approach – source reinterpretation
Source of uncertainty Impact Likelihood Exposure
Definition of project
Concept and design
Financing arrangements
Logistics
Local conditions
Resource estimates
Industrial relations
Communications
Project organization

Chapman and Ward HMPOR slide 58 © 2011 John Wiley & Sons Ltd.
Typical uncertainty management issues in the lifecycle stages of immediate interest, and other prompt lists for sources of uncertainty
Execution anddelivery (E&D) strategy shaping stage
Identifying and allowing for regulatory constraints Concurrency of activities required Capturing dependency relationships Errors and omissions
Tactics shaping stage Adequate accuracy of resource estimates Estimating resources required Defining responsibilities (number and scope of contracts) Defining contractual terms and conditions Selecting capable participants (tendering procedures and bid
selection)
Execution stage
Exercising adequate coordination and control Determining the level and scope of control systems Ensuring effective communication between participants Provision of appropriate organizational arrangements Ensuring effective leadership Ensuring continuity in personnel and responsibilities Responding effectively to sources which are realized
Delivery stage
Adequate testing Adequate training Managing stakeholder expectations Obtaining licences to operate

Chapman and Ward HMPOR slide 59 © 2011 John Wiley & Sons Ltd.
Structure all uncertainty
The need to test the robustness of working assumptions in the search for clarity efficiency is central to this phase, requiring basic modelling skills and a clear understanding of the range of possible approaches available
It is also coupled to concerns like:
- we need to order sources of uncertainty
- we need to order responses
- we need to identify general responses
- we need to understand dependencies

Chapman and Ward HMPOR slide 60 © 2011 John Wiley & Sons Ltd.
Structure phase specific tasksfrom the
identify phase
review other plans and Ws and associated sources
identify general responses and order responses examine links between sources and responses develop diagrams and review associated models
review key plan components and associated sources
other selectiverestructuring
explore interactions
developorderings
refine classifications
deliverables fit for purpose?
to the ownershi
p phase
yes
no

Chapman and Ward HMPOR slide 61 © 2011 John Wiley & Sons Ltd.
Portion of a source-response diagram for an offshore project platform fabrication activity
start-up problems
yard not available
productivity variations
industrial disputes
mobilize and accept a short delay
long delay
find analternative yard
none available
accept along delay

Chapman and Ward HMPOR slide 62 © 2011 John Wiley & Sons Ltd.
Linking this portrayal to some alternatives
• The three ‘yard not available’ scenarios and a traditional probability-impact grid (PIG) equivalent
• A traditional decision tree equivalent• A traditional fault tree or event tree equivalent• Systems dynamics, inference diagrams and other
feedback loop portrayals

Chapman and Ward HMPOR slide 63 © 2011 John Wiley & Sons Ltd.
Cognitive mapping portrayal of feedback loops
Reproduced by permission of the Operational Research Society
Lack of system freeze
Tight time scale
Enforced work on unfrozen items
Increased rework
Increased delay
More limited resources
Increased cross-relationbetween parallel activities
More parallel activities
Increase in activity durations
More work to do
Design changes
Approved delays

Chapman and Ward HMPOR slide 64 © 2011 John Wiley & Sons Ltd.
The valuable role of diagrams when source-response structures are complex, other complex structure tools and models, and simple structures when this is clarity efficient

Chapman and Ward HMPOR slide 65 © 2011 John Wiley & Sons Ltd.
Clarify ownership
• the nature of this phase is highly dependant upon the position in terms of iterative cycles
• three examples to illustrate the range:
- corporate contracting stance early on
- work packaging at a mid point
- named parties towards the end

Chapman and Ward HMPOR slide 66 © 2011 John Wiley & Sons Ltd.
Ownership phase specific tasks
strategy fit for purpose?
plans fit for purpose?
overall fit for purpose?
from the structure
phase
scope the contracting strategy
to the quantify phase
clarify the objectives of the contracting strategyidentify owners for the sources of uncertainty and responsesuncertainty appreciation and contract design
plan/re-plan the contracts
select a contract approachselect contract terms
contract timing
stop the project
no
yes
no
no
yes
yesmaybe

Chapman and Ward HMPOR slide 67 © 2011 John Wiley & Sons Ltd.
The ‘quantitative’ part of the process

Chapman and Ward HMPOR slide 68 © 2011 John Wiley & Sons Ltd.
Estimating probabilities group exercise
Assume everyone in the room puts their date of birth on a piece of paper, all the pieces of paper are put into a hat, and one piece of paper is selected at random. Assume no communication is allowed, and everyone agrees to tell the truth. What is the probability the paper selected indicates a birth date in June?
Several exercises will be involved. Make brief notes for each.

Chapman and Ward HMPOR slide 69 © 2011 John Wiley & Sons Ltd.
Some key estimate phase issues
• The estimate phase and the evaluate phase are very closely coupled, in the sense that the approach to one tends to assume an approach to the other, and in terms of the iterative looping structure
• A wide variety of different approaches are advocated• Understanding the rational of the alternatives is
important, as is understanding what the alternatives deliver (or not)

Chapman and Ward HMPOR slide 70 © 2011 John Wiley & Sons Ltd.
Some further important estimate phase issues
• Sizing identified sources of uncertainty is the starting point• Later refinement may be about decomposing the structure
of the uncertainty to resolve ambiguity, and searching for appropriate data
• Still later the defence of key decisions may become the issue
• Data may be available, but usually it is not, and ‘there is no such thing as a directly relevant objective estimate’
• Getting comfortable with subjectivity and coping with no data is important

Chapman and Ward HMPOR slide 71 © 2011 John Wiley & Sons Ltd.
Alternative approaches to estimating
• ‘Traditional quantitative approaches’ as used by many leading edge organisations for many decades, based on specific distribution shapes most of the time, but based on rectangular histograms some of the time, and probability (decision) trees some of the time
• The discrete or continuous variable divide• The use of ‘qualitative’ probability-impact grids (PIGs)
with a range of alternative labels, sometimes as a ‘first pass’, as used by those organisations adopting ‘common practice’, still promoted by many professional bodies
• The ‘simple scenario’ response• The ‘minimalist’ response• The integration of these approaches

Chapman and Ward HMPOR slide 72 © 2011 John Wiley & Sons Ltd.
The triangular distribution
Probability
L M Costlowerbound
most likely value
upperbound
Expected value = (L + M + U) / 3
U

Chapman and Ward HMPOR slide 73 © 2011 John Wiley & Sons Ltd.
Common probability distribution alternatives
• Beta distributions as adopted for PERT• Normal• Log Normal• Exponential• Poisson• Uniform

Chapman and Ward HMPOR slide 74 © 2011 John Wiley & Sons Ltd.
Tabular format for a common interval approach
_________________________________________
Value Probability Product_____________________________________________ 5 0.15 0.75 6 0.35 2.10 7 0.25 1.75 8 0.15 1.20
9 0.10 0.90 Expected value (mean) 6.70____________________________________________

Chapman and Ward HMPOR slide 75 © 2011 John Wiley & Sons Ltd.
Probability tree interpretation of this example
5
6
7
8
9
0.15
0.35
0.25
0.15
0.10

Chapman and Ward HMPOR slide 76 © 2011 John Wiley & Sons Ltd.
Rectangular histogram density format interpretation
most likely value(most probable
class mark)
Outcome value
Probability
3 4 5 6 7 8 9 10
0.05
0.15
0.25
0.35
0
0.10
0.20
0.30
expected value (point of balance)

Chapman and Ward HMPOR slide 77 © 2011 John Wiley & Sons Ltd.
Cumulative probability format (piecewise linear)
1.0
Outcome value
0
3 4 5 6 7 8 9 10
0.2
0.4
0.6
median (50%) value
Cumulative probability
0.8

Chapman and Ward HMPOR slide 78 © 2011 John Wiley & Sons Ltd.
Tabular format for a three interval estimate
__________________________________________
Value Probability Product
_____________________________________________ 10 0.3 3.0 15 0.5 7.5 20 0.2 4.0 _____________________________________________ Expected value (mean) 14.5
___________________________

Chapman and Ward HMPOR slide 79 © 2011 John Wiley & Sons Ltd.
Continuous variable portrayal with three intervals
Cumulative probability
1.0
Lay days per month in April
0.3
05 7.5 10 12.5 15 17.5 20 22.5
0.8
Piece-wise linear cumulative format
Probability
Lay days per month in April
area=0.5
0
0.1
5 7.5 10 12.5 15 17.5 20 22.5
area=0.2 area=0.3
Rectangular density format

Chapman and Ward HMPOR slide 80 © 2011 John Wiley & Sons Ltd.
The effect of adding more classes
Days First-cut using three classes
Second-cut using five classes
5 0.10
10 0.3 0.20
15 0.5 0.50
20 0.2 0.15
25 0.05
Expected value 14.5 14.25
Chapman and Ward HMPOR slide 81 © 2011 John Wiley & Sons Ltd.
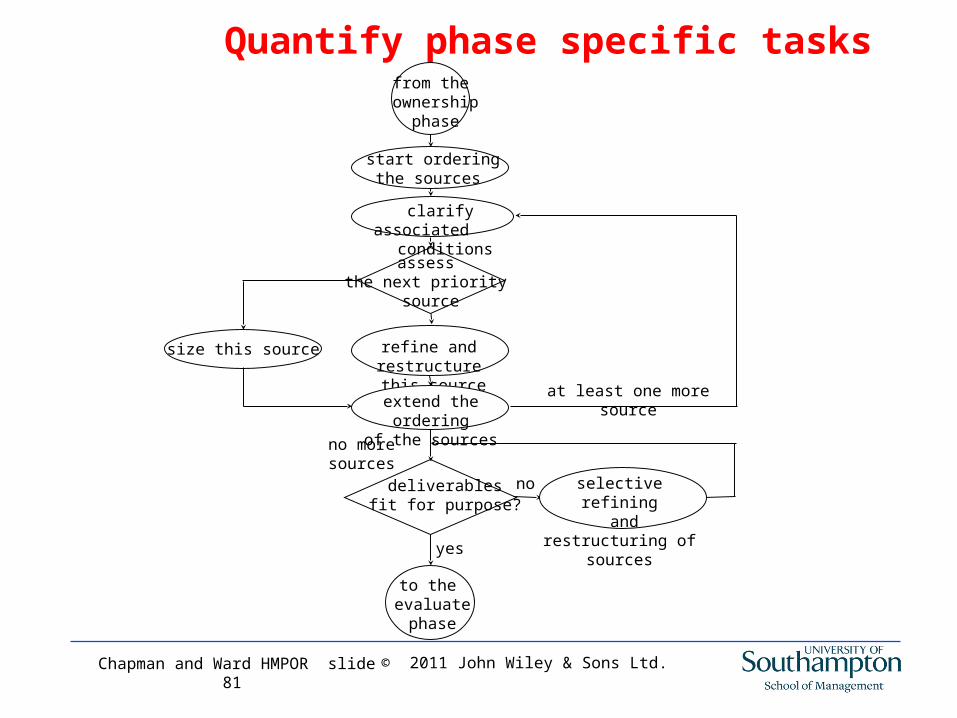
Quantify phase specific tasks
deliverables fit for purpose?
to the evaluate
phase
refine and restructure this source
assess the next priority
source
from the ownership
phase
extend the ordering
of the sources
yes
no
at least one more source
clarify associated conditions
size this source
selective refining and restructuring
ofsources
no more sources
start ordering the sources

Chapman and Ward HMPOR slide 82 © 2011 John Wiley & Sons Ltd.
Simple estimate portrayal for design change approval
0 3 9 15
0
Probability
Outcome value
presumed reality, although multiple modes may be involved
working assumptions for the model

Chapman and Ward HMPOR slide 83 © 2011 John Wiley & Sons Ltd.
Two scenario portrayal for design change approval
0 5 10 15 20 25
0
Probability
Outcome value
presumed reality, although multiple modes may be involved
working assumptions for the model
Chapman and Ward HMPOR slide 84 © 2011 John Wiley & Sons Ltd.
The rationale for a multiple scenario approach
• A simple form of uncertainty decomposition, refining the structure used to understand uncertainty, quite different to refining an estimate of uncertainty within a given structure
• Can be extended to three or more scenarios
- normal variability
- abnormal outcomes (10 year return period)
- extreme outcomes (100 year return period)
- very extreme, etc

Chapman and Ward HMPOR slide 85 © 2011 John Wiley & Sons Ltd.
The rationale for a common interval approach
• Simple• Clear and transparent approximation• The degree of approximation to any assumed
distribution shape can be adjusted by adding more intervals
• No distribution function assumptions are required, but any plausible distribution function and its assumptions can be used as a starting point
• Complex shapes with no appropriate function can be accommodated
• Multiple scenarios, decision trees and conditional probabilities are easily accommodated

Chapman and Ward HMPOR slide 86 © 2011 John Wiley & Sons Ltd.
Current use of probability-impact grids (PIGs) with numeric bounds and risk index values
Probability
high
low
low medium high
medium
Impact
p1
p2
p0 = 0
p3 = 1
i0 = 0 i1 i2 i3
r2 r3 r4
r1 r2 r3
r3 r4 r5

Chapman and Ward HMPOR slide 87 © 2011 John Wiley & Sons Ltd.
Reinterpretation of PIGs in more powerful terms
Impact0 … etc with a complete scale for outcome values
Probability
1.0
0
source number 2 – very uncertain probability, but predictable impact
source number 1 – uncertain probability and impact
source number 3 – reliable probability estimateavailable, but very uncertain impact
source number 4 is notshown because its probability is 1, so it does not lend itself tothis portrayal, and it isomitted in conventionalrisk management usingprobability-impact grids
completescale from0 to 1.0

Chapman and Ward HMPOR slide 88 © 2011 John Wiley & Sons Ltd.
Estimate phase approach overall implications
• There is no satisfactory way to combine ‘qualitative estimates’ – a ‘weak quantitative analysis’ interpretation of PIGs is needed – and all sources need attention
• Combining first pass quantified individual sources of uncertainty is the starting point
• Looping back after the evaluate phase, changing the proposed project plans to make effective use of all available insights and achieve overall corporate risk efficiency is the end point
• In between, managing the process to achieve simplicity efficiency at the most appropriate level of effort is the goal, adding more estimation detail on aspect of this
• This phase and the closely coupled evaluate phase are at the core of the iterative process

Chapman and Ward HMPOR slide 89 © 2011 John Wiley & Sons Ltd.
Evaluate phase specific tasks
deliverables fit for purpose?
from the quantify
phase
diagnose the implications
interim or
gateway report
portray the effect
to the define phase
no – restructureor extend
global yes
combine the subset of sources
select an appropriate subset of sources
specify dependence
local yes

Chapman and Ward HMPOR slide 90 © 2011 John Wiley & Sons Ltd.
Sensitivity diagrams as a key evaluate phase tool: activity level offshore project example used earlier
5th yearMar NovDec Jan Feb Apr May Jun Jul Aug Sep Oct
Probabilityof achievementby dates indicated
0.2
0.4
0.6
0.8
1
0
0.3
0.5
0.7
0.9
0.1
Base plan completion date
1 2 3 4
56
Notes:1. the curves assume a minimum fabrication period of 20 months2. no work is transferred offsite to improve progress3. no major fire, explosion or other damage
Probability curves show the cumulative effect of the following sources of uncertainty:
1. yard not available, or mobilisation delays2. construction problems / adverse weather3. subcontracted nodes delivery delays
6. delayed award of fabrication contract
4. material delivery delays5. industrial disputes

Chapman and Ward HMPOR slide 91 © 2011 John Wiley & Sons Ltd.
Sensitivity diagrams as a key evaluate phase tool: offshore project intermediate level output example
5th year2nd year 3rd year 4th year
Award of designcontract (1)
1 23 4
56
Fabrication complete
(6)
Probabilityof achievementbydatesindicated
0.2
0.4
0.6
0.8
1.0
0
0.3
0.5
0.7
0.9
0.1
Award of fabrication contract (2)
and major material orders (3)
Steel (4) and other (5)
deliveries complete
Offshore installationcomplete (7)
7

Chapman and Ward HMPOR slide 92 © 2011 John Wiley & Sons Ltd.
Sensitivity diagrams as a key evaluate phase tool: addition of items A, B and C as in the BCS example
Cost
Cumulativeprobability
0.2
0.4
0.6
0.8
1.0
0
A A + B A + B + C
P90
P10

Chapman and Ward HMPOR slide 93 © 2011 John Wiley & Sons Ltd.
Using decision diagrams to evaluate risk efficient choices: one risk efficient choice example
Cost
0.5
1.0
Cumulative probability
0
expected costusing the 1.6 m barge
expected costusing the 3.0 m barge
3.0 m barge curve
1.6 m barge curve

Chapman and Ward HMPOR slide 94 © 2011 John Wiley & Sons Ltd.
Using decision diagrams to evaluate risk-reward tradeoffs: two risk efficient choices example
Cost
0.5
1.0
Cumulative probability
0
1.6 m barge curve
3.0 m barge curve
expected cost using the 1.6 m barge
expected costusing the 3.0 m barge

Chapman and Ward HMPOR slide 95 © 2011 John Wiley & Sons Ltd.
Using decision diagrams to evaluate other criteria tradeoffs: the photocopier example
Cost
0.5
1.0
0
A CB
P10
P90
P50
Cumulative probability

Chapman and Ward HMPOR slide 96 © 2011 John Wiley & Sons Ltd.
Managing opportunity efficiency as an overall objective, with risk efficiency in relation to each objective, plus clarity efficiency,plus optimal tradeoffs between all objectives, whether or not objectives are measurable.
Optimal tradeoffs between all objectives is the goal, and it is crucial to systematically seek this goal.

Chapman and Ward HMPOR slide 97 © 2011 John Wiley & Sons Ltd.
Build comprehensively from the bottom-up, moving the bottom down selectively, then present selectively top-down
• Understand specific sources of uncertainty, responses and conditions at the bottom level, moving the bottom down where this seems worth while
• Understand the role of dependence as uncertainty accumulates and decomposition is refined
• Understand composite uncertainty and general responses at higher levels
• Manage the uncertainty plus any associated opportunity and risk as the build-up evolves
• Present the ‘bottom line’ first• Explain where it came from working top-down• Make sure conditions and non-quantified objectives do not get
overlooked, emphasising the key ones• Focus all presentations on what matters most

Chapman and Ward HMPOR slide 98 © 2011 John Wiley & Sons Ltd.
Approaches to combining uncertainty
• Methods based on moments (mean-variance approaches in particular)
• Methods based on discrete probabilities (as used in decision analysis and other probability tree models)
• Methods based on simulation (Monte Carlo simulation in particular)
The norm is using simulation without a gradual build up of intermediate results – no ‘sensitivity diagrams’ are the obvious symptom – but simulation can be used for any approach to any decomposition structure, and simulation is a reasonable default assumption

Chapman and Ward HMPOR slide 99 © 2011 John Wiley & Sons Ltd.
Approaches to dependence to be aware of
• Assuming independence as a default position is the norm
• Assuming perfect positive correlation as a simple form of complete dependence as a default is the recommended clarity efficient starting position
• Intermediate correlation and percentage dependence provides a simple compromise
• Conditional specifications start to provide the insight needed to understand simple and complex forms of statistical dependence
• Causal structures provide a practical maximum insight approach sometimes, but they may not be clarity efficient

Chapman and Ward HMPOR slide 100 © 2011 John Wiley & Sons Ltd.
Part two review, questions and discussion

Chapman and Ward HMPOR slide 101 © 2011 John Wiley & Sons Ltd.
Part three – the generic process in all lifecycle stages
• Start by considering roles for PUMPs in the strategy shaping stages, and the way the 7Ws plan-criteria relationship structure focus shifts
• Consider the strategy gateway as a performance uncertainty management process (PUMP) which is very different to the basic PUMP
• Then consider earlier lifecycle strategy shaping PUMPs and associated gateway PUMPs, working back towards the concept stage
• Follow with the later lifecycle stage PUMPs, working forward to the termination stage
• The overall strategy gateway as a watershed

Chapman and Ward HMPOR slide 102 © 2011 John Wiley & Sons Ltd.
Roles for PUMPs in the strategy shaping stages
Lifecycle stage Stage purposes Roles for the associated PUMP
Concept shaping Concept, project objectives and business case development in corporate strategy terms
Confirm the initial concept from a corporate perspective Identify stakeholders and their expectations Identify appropriate performance objectivesProvide unbiased initial estimates of business case
outcomesEvaluate the concept and business case in corporate
strategy terms
Concept gateway Consolidation Governance
Consolidate the base and contingency plans Confirm expectations about the deliverables
DOT shaping Design, operations and termination (DOT) strategy development from a design and operations management perspective
Confirm the design basis from a design and operations perspective
Develop lifecycle operations performance criteriaAssess the feasibility of the design strategyAssess the likely costs and benefits of design changes Evaluate the operations and termination strategyTest the reliability of designs and their operations
effectiveness
DOT gateway Consolidation Governance
Consolidate the base and contingency plansConfirm expectations about the deliverables
E&D shaping Execution and delivery (E&D) strategy development from a project management perspective
Confirm the execution basis from an execution perspectiveEstimate the resources required at a strategic levelIdentify and allow for regulatory constraints Assess contracting strategy at an overview levelAssess the feasibility of plans Assess the likely duration of execution Assess the likely cost of execution and delivery Determine the appropriate milestones Determine the appropriate levels of contingency fundsAssess the effect of changes to plans
Strategy gateway Consolidation Governance
Consolidate the base and contingency plansConfirm expectations about the deliverables

Chapman and Ward HMPOR slide 103 © 2011 John Wiley & Sons Ltd.
Overall strategy gateway specific tasks
to the next lifecycle
stage
from the evaluate
phase
deliverablesfit for
purpose?
maybe
gateway yes
no
consolidate and explain the strategy
stop the
project
support and convince
to the define phase
commitment plans
contingency plans
base plans
PUMP report

Chapman and Ward HMPOR slide 104 © 2011 John Wiley & Sons Ltd.
Gateway processes viewed from anuncertainty management perspective and the governance issues which need to be addressed

Chapman and Ward HMPOR slide 105 © 2011 John Wiley & Sons Ltd.
Adapting the basic PUMP to the design, operations and termination (DOT) shaping stage
• The PetroCanada liquefied natural gas storage example and the Yukon River pipeline crossing example
• Terminology changes• Modelling concerns which stay the same• Interaction with different people with different
perspectives and agendas• Safety as a special case, and the questions raised by
tradeoffs between fatalities and cost• Integration with the formation and shaping of operations
strategy

Chapman and Ward HMPOR slide 106 © 2011 John Wiley & Sons Ltd.
Adapting the basic PUMP to the concept stage
• UK Nirex example (nuclear waste disposal), and simpler examples
• Terminology changes• Modelling concerns which stay the same• Interaction with different people with different
perspectives and agendas• Integration with the formation and shaping of corporate
strategy• The relationship between constraints imposed by
broader strategic goals and multiple criteria tradeoffs • Whole lifecycle issues

Chapman and Ward HMPOR slide 107 © 2011 John Wiley & Sons Ltd.
Overall project evaluation involvesthe whole project lifecycle and the use of decision frameworks based on NPV (Net Present Value) or closely related variants like IRR (Internal Rate of Return)

Chapman and Ward HMPOR slide 108 © 2011 John Wiley & Sons Ltd.
A very simple initial example
Based on a paper published to illustrate a parametric
approach to discounting (Chapman and Cooper,1983)
The basic example context: insulating the walls of a
house in the UK in the early 1980s
The more complex underlying example context: the
State of Alaska considering a major hydro-electric
facility development or the incremental development
of coal-fired electric power

Chapman and Ward HMPOR slide 109 © 2011 John Wiley & Sons Ltd.
The perceived differential cash flow
X0 X1 X2 … Xt … Xn
-C F F F F+S
where money of the day (eg 1981£) is used for
C the capital cost
F the fuel cost saving per annum
S the scrap value at the planning horizon
n the number of years in the planning horizon

Chapman and Ward HMPOR slide 110 © 2011 John Wiley & Sons Ltd.
The need to inflate, escalate and discount
It a general inflation factor for period t
Et an escalation factor for F
At an appreciation factor for S
Dt a real discount factor

Chapman and Ward HMPOR slide 111 © 2011 John Wiley & Sons Ltd.
Net Present Value (NPV = V) basic definition
V = - C
+ the sum over t = 1…n of the F It Et / It Dt
+ S In An / In Dn
General inflation cancels out, so we can work in
‘real terms’ with respect to ‘economic desirability’
‘Financial feasibility’ requires attention to general
inflation patterns

Chapman and Ward HMPOR slide 112 © 2011 John Wiley & Sons Ltd.
Composition of parameters
R = the sum over t = 1…n of the Et / Dt
T = S An / Dn
N = C – T
V = F R – N
The purpose of composition

Chapman and Ward HMPOR slide 113 © 2011 John Wiley & Sons Ltd.
NPV based tests
‘V greater than zero?’ is the basic test
If V is set equal to 0, equivalent tests include:
D greater than ‘correct D’?
n greater than the expected planning horizon?
N greater than F R ?
F less than N / R ?
The purpose of alternative frameworks

Chapman and Ward HMPOR slide 114 © 2011 John Wiley & Sons Ltd.
Embedding this model in a simple process
step 1 estimate n 5 years
2 R E / D = 1.1
R = 6.72
3 N C = £400
S = £250
A = 1.025
T = £283
N = £117
Alternative insulation types as an example
component decision embedded in step 3

Chapman and Ward HMPOR slide 115 © 2011 John Wiley & Sons Ltd.
The simple process continued, steps 4 and 5
step 4 estimate F = £40
then V = F R – N
= 40 x 6.72 – 117
= 152
step 5 tabulate V as n varies over a
plausible range, and determine
the value of n which flips the
decision given the expected
value of all other parameters

Chapman and Ward HMPOR slide 116 © 2011 John Wiley & Sons Ltd.
Key composite parameters as a function of n
n T N R N/R V1 256 144 1.10 130.9 -1002 263 137 2.31 49.3 -45 3 269 131 3.64 36.0 15 *4 276 124 5.11 24.3 805 283 117 6.72 17.4 1526 290 110 8.49 13.0 2307 297 103 10.44 9.9 3158 305 95 12.58 7.6 4089 312 88 14.94 5.9 51010 320 80 17.53 4.6 621

Chapman and Ward HMPOR slide 117 © 2011 John Wiley & Sons Ltd.
The simple process continued, steps 6 - 9
step 6 generalise step 5 to determine the flip
point values of all other parameters
eg n = 2.8 (via diagram, often useful)
T = £131
F = £17.5
step 7 identify key parameters
step 8 choose a suitable framework
step 9 illustrate with scenarios

Chapman and Ward HMPOR slide 118 © 2011 John Wiley & Sons Ltd.
The more complex underlying example
State of Alaska decision - hydro verses coal
The perceived differential cash flow involves
the same notation symbols but:
C is the capital cost of hydro less coal
F is the fuel and other operating costs saving
S is the ‘scrap’ value after 40 years of the hydro facility assuming zero for the coal facility
Scrap value focus for evaluation (NTV)

Chapman and Ward HMPOR slide 119 © 2011 John Wiley & Sons Ltd.
Disposal of nuclear waste example
UK Nirex context
C0 = £2500 million
Cn = £5000 millionS = £135 millionr = 1 / (1 + D/100)D = 6%n = 50 years
The changes in notation (r/D and S in particular)
Chapman and Ward HMPOR slide 120 © 2011 John Wiley & Sons Ltd.
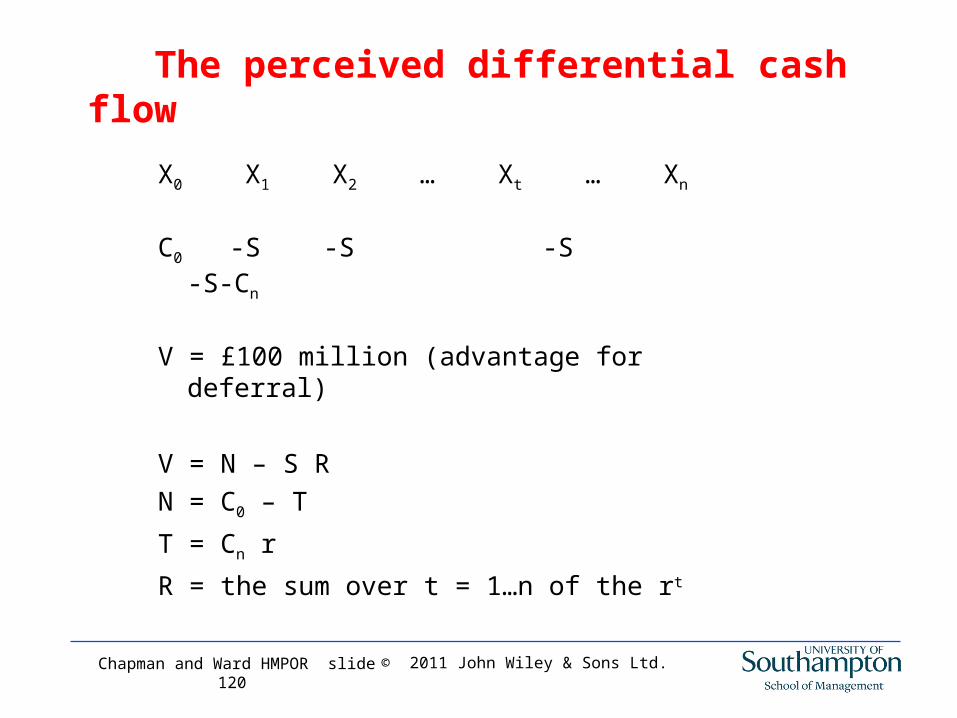
The perceived differential cash flow
X0 X1 X2 … Xt … Xn
C0 -S -S -S -S-Cn
V = £100 million (advantage for deferral)
V = N – S R
N = C0 – T
T = Cn r
R = the sum over t = 1…n of the rt

Chapman and Ward HMPOR slide 121 © 2011 John Wiley & Sons Ltd.
Key composite parameters as a function of D
D T N R N/R N/R-S V
0 5000 -2500 50.00 -50 -185 -9250
2 1860 640 31.42 20 -115 -3600
4 710 1790 21.48 83 -52 -1100
6 270 2230 15.76 141 6 100 *
8 110 2390 12.23 195 40 740
Chapman and Ward HMPOR slide 122 © 2011 John Wiley & Sons Ltd.
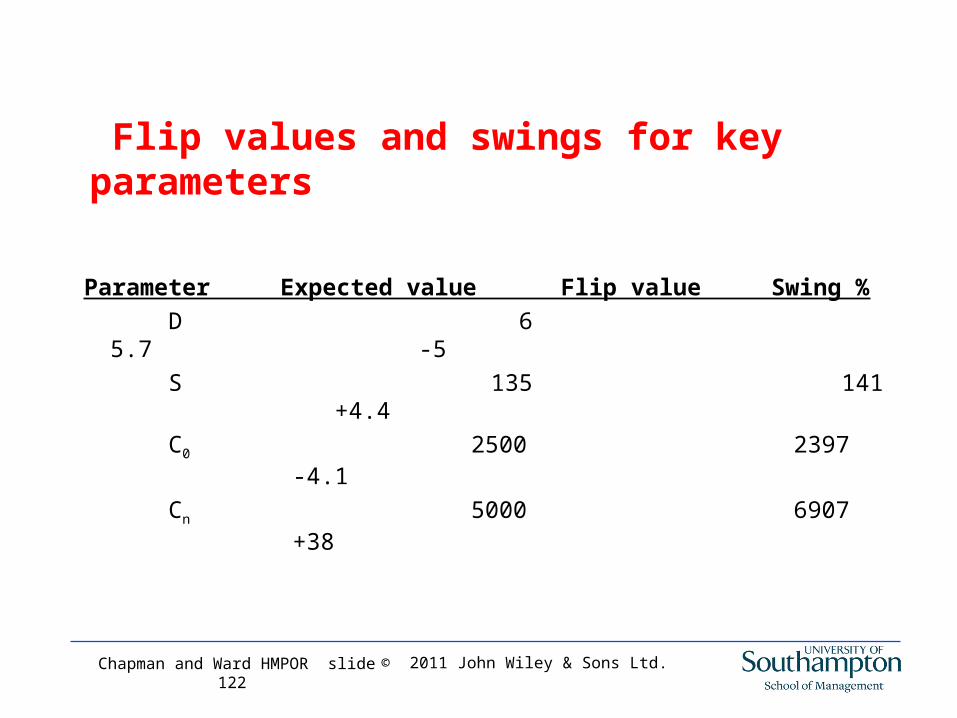
Flip values and swings for key parameters
Parameter Expected value Flip value Swing %
D 6 5.7 -5
S 135 141 +4.4
C0 2500 2397 -4.1
Cn 5000 6907 +38

Chapman and Ward HMPOR slide 123 © 2011 John Wiley & Sons Ltd.
Integrating probabilistic analysis
• a minimum clarity approach for the first pass• further uncertainty clarification for various reasons
eg Cn
C0 and C0 / Cn relationship
S
D

Chapman and Ward HMPOR slide 124 © 2011 John Wiley & Sons Ltd.
Responding to the ‘real options’ critique
• The value (cost or benefit) of delay• The value of information • The value of responding to threats and opportunities• The value of flexibility (general responses)• The need to address all ‘real options’ critiques of NPV
as ‘actual options’ via decision analysis in an uncertainty management framework using a creative approach to option generation

Chapman and Ward HMPOR slide 125 © 2011 John Wiley & Sons Ltd.
Responding to ‘Green Book’ discussions
• HM Treasury advice on the ‘correct’ discount rate: 10%, 6%, 3.5% declining in stages to 1% by year 300
• Conflicting theoretical basis for these rates• Discount hurdle rate decision rule or a decision
process• Proposed resolution for the public sector• Anticipated implications for PFI (PPP)• Anticipated implications for the private sector (plc and
other structures)

Chapman and Ward HMPOR slide 126 © 2011 John Wiley & Sons Ltd.
Traffic light view of the proposed process
review t = 0
submit project
review t = 1…n
bond tests
return tests
legacy tests
risk tests
option tests
further tests
implement project implement portfolioreject project
amberred
red
red
red
red
red
amber
amber
amber
amber
amber
review for t = 0 review for t = 1, 2, …
submit project

Chapman and Ward HMPOR slide 127 © 2011 John Wiley & Sons Ltd.
Corporate strategy formation issues
• There are lots of different perspectives for ‘strategic management’
• The concern here is understanding ‘bottom-up’ and ‘top-down’ approaches to strategy formation and shaping, their integration, and the way they relate to operations strategy and programme/portfolio strategy, building on earlier aspects of our discussions

Chapman and Ward HMPOR slide 128 © 2011 John Wiley & Sons Ltd.
Taking a contractor’s perspective
• Bidding for work as a context• The Transcon case as an example• Background to the development of this case• The case information• The way the case is usually addressed• The basis for some key ideas to take away

Chapman and Ward HMPOR slide 129 © 2011 John Wiley & Sons Ltd.
The ‘watershed’ aspect of the strategy gateway
• The argument for understanding execution and delivery strategy shaping and its gateway first
• The argument for implementing PUMPs from the outset of the concept stage
• The integration implications• The implications of a failure to integrate• Moving on to the rest of the lifecycle assuming
integration – strategy implementation• Escalating expenditure issues and contractual
implications• Using PUMPs now dependent on earlier PUMPs

Chapman and Ward HMPOR slide 130 © 2011 John Wiley & Sons Ltd.
Roles for PUMPs in the tactics shaping and gateway stages
Lifecycle stage Stage purposes Roles for the associated PUMP
Tactics shaping Detailed design and planningfor execution,delivery, operation and termination purposes
Help to shift the perspective to implementationConsolidate the strategic plans for implementation
purposesDevelop detailed designs and plansDevelop resource allocation and contracting criteriaEstimate the resources required at a more detailed levelAssess the contracting strategy at a more detailed levelEvaluate alternative procurement strategies Define contractual terms and conditions Determine appropriate risk sharing arrangements Assess the implications of contract conditions Assess and compare competitive tenders Determine the appropriate target costs and bid prices for
contracts Evaluate detailed designs and plans
Tactics gateways
Consolidation Governance
Consolidate the base and contingency plansConfirm the deliverables

Chapman and Ward HMPOR slide 131 © 2011 John Wiley & Sons Ltd.
An overview of tactics shaping and gateways
formulate the tactics
overall strategy approved
base and contingency plans
tactics shaping PUMPs
commitment plansaction
plans
deliverablesfit for
purpose? tactics planning team yes
deliverables
fit forpurpose?
maybe
tactics gateway yes
no stop the
project
support and convince
to an appropriate
define phase
to thenext lifecycle
stage
no

Chapman and Ward HMPOR slide 132 © 2011 John Wiley & Sons Ltd.
Tactics shaping and the tactical/strategic plans relationship
• We have been concerned with shaping the strategy of the project earlier, and now want to implement it
• Strategy implementation requires detailed plans, and developing detailed plans involves another lifecycle stage
• Detailed plans are a waste of effort until an appropriate strategy has been developed
• Detailed plans beyond a limited time horizon are a waste of effort• The tactics shaping stage is about appropriate detailed planning,
to prepare for strategy implementation, after gaining approval for the strategy
• Multiple gateways may be involved• Prior testing for ‘the devil in the detail’

Chapman and Ward HMPOR slide 133 © 2011 John Wiley & Sons Ltd.
Roles for PUMPs in the execution and later stages
Execution Execution Support the execution of the plansCoordinate, control and monitor progressModify all targets, commitments and resource allocations as
neededRevise estimates of cost on completion or completion timeProvide ongoing execution evaluationAssess the implications of changes to designs or plans Support responding to crises and disasters
Delivery Delivery Support the delivery of the asset created by the projectIdentify issues impacting delivery Assess the feasibility of delivery schedules Assess the feasibility of meeting performance criteria Assess the availability of commissioning facilitiesAssess the reliability of testing equipment Assess the resources needed to modify the delivered asset
O&S Operation and support(O&S)
Support the operation of the asset created by the projectAssess the effectiveness of uncertainty management strategies Provide ongoing uncertainty management of all relevant
concernsUpdate assessments of asset performanceSupport the design and planning of maintenance Assess appropriate levels of resources required Support responding to crises and disasters
Termination Termination
Assess options for replacement, decommissioning, or transferIdentify the extent of future liabilitiesSupport the termination of the asset

Chapman and Ward HMPOR slide 134 © 2011 John Wiley & Sons Ltd.
An overview of the execution and delivery stages
from the tactics gateways
to the next lifecycle
stage
manage crises and be prepared to
respondto disasters
manage planned execution and delivery
actions
roll execution and delivery action plans
forward
monitor and control
enlightened governanceuntil these stages are complete
Chapman and Ward HMPOR slide 135 © 2011 John Wiley & Sons Ltd.
Execution and delivery stages
• Earlier stages obtained approval for strategic plans, developed appropriately detailed action plans, and obtained approval for these action plans
• The project can now be executed, which requires ongoing management in ‘cutting metal’ or ‘writing code’ terms
• ‘The talking ends, the action begins’ in terms of emphasis, although a lot of ongoing planning with related communication issues remains essential
• The ‘enlightened governance’ requirement, and selective re-planning as required

Chapman and Ward HMPOR slide 136 © 2011 John Wiley & Sons Ltd.
Operations and support and prior tactics shaping from the strategy approval gateway
to the next
lifecycle stage
manage crises and be prepared to
respondto disasters
manage planned actions
roll action plans forward
monitor and control
enlightened governanceuntil this stage is complete
tactics shaping for operations
and support

Chapman and Ward HMPOR slide 137 © 2011 John Wiley & Sons Ltd.
The termination stage and prior tactics shaping from the strategy approval gateway
end ofthe
project
manage crises and be prepared to
respondto disasters
manage planned actions
roll action plans forward
monitor and control
enlightened governanceuntil this stage is complete
tactics shaping for termination

Chapman and Ward HMPOR slide 138 © 2011 John Wiley & Sons Ltd.
Some alternative generic process descriptions
• PRAM 2004 (APM) and forthcoming
• RAMP 2005 (ICE AND IoA) and forthcoming
• PMBOK chapter 11 2008 (PMI) and forthcoming

Chapman and Ward HMPOR slide 139 © 2011 John Wiley & Sons Ltd.
The role of generic processes in the development of processes for particular organizations and particular contexts
Chapman and Ward HMPOR slide 140 © 2011 John Wiley & Sons Ltd.
Part three summary, questions and discussion

Chapman and Ward HMPOR slide 141 © 2011 John Wiley & Sons Ltd.
Part four – key corporate implications
• Start by considering developing corporate capability as a project in the ‘programme’ sense
• Then look at contracts and governance as frameworks for enlightened relationship management
• Conclude with a corporate capability perspective

Chapman and Ward HMPOR slide 142 © 2011 John Wiley & Sons Ltd.
Some key implementation issues to get started
• Selling the idea to all concerned• Choosing a demonstration project• Context as a process design issue• Planning the introduction as a project/programme• Starting by being clear about initial and long term
objectives, and the evolution planned• Integrating risk and opportunity management across
the organization• Being clear about the skills needed, skills and
knowledge development, and role of consultants• Governance

Chapman and Ward HMPOR slide 143 © 2011 John Wiley & Sons Ltd.
Selling a ‘best practice’ perspective
• choosing the best ‘brand’ label• benefits as objectives• a clear understanding of the possibilities• processes tailored to deliver what is required
Chapman and Ward HMPOR slide 144 © 2011 John Wiley & Sons Ltd.
Objectives which may be relevant
• Opportunity management • Clarity, risk and opportunity efficiency• Culture change• Targets, expectations and commitments distinguished• Bottom up communication encouraged, with a shared
‘big picture’ perspective• Creativity and satisfaction (fun) used as effective
objectives• Corporate learning and knowledge management• Linking projects, strategy and operations

Chapman and Ward HMPOR slide 145 © 2011 John Wiley & Sons Ltd.
Expected, commitment and target values, and associated provision and contingency
stretch target value
commitment value
expected value
Duration, cost, …
Probability
a density portrayal is convenientfor understanding what is involved
trigger target value
provisioncontingency

Chapman and Ward HMPOR slide 146 © 2011 John Wiley & Sons Ltd.
Stretch targets as goals are crucial
• targets should stretch people• targets may have little chance of achievement,
but targets must be plausible

Chapman and Ward HMPOR slide 147 © 2011 John Wiley & Sons Ltd.
Properly defined commitments and trigger target values are crucial
• separating contingencies and provisions• understanding asymmetric penalties• being clear about the ownership of risk• the need for contractual flexibility and trust• the need for Balanced Incentive And Risk Sharing
(BIARS) contracts

Chapman and Ward HMPOR slide 148 © 2011 John Wiley & Sons Ltd.
Using the concept of risk efficiency is crucial
• Risk efficiency involves a maximum level of expected performance for an appropriate level of downside risk
• Ensuring choices are risk efficient can be seen as one of the core purpose of risk management
• Along with clarity efficiency it provides a foundation for opportunity efficiency
• Decision diagrams are a key tool when uncertainty about key measurable objectives is important

Chapman and Ward HMPOR slide 149 © 2011 John Wiley & Sons Ltd.
Decision diagrams: the one risk efficient choice example showing how complex choice comparisons can become reasonably straightforward illustrates an important idea
the 3.0m barge involvesa lower expected cost andless risk – which makes it a risk efficient choice
Cost
0.5
1.0
Cumulative probability
0
expected costusing the 1.6 m barge
expected costusing the 3.0 m barge
3.0 m barge curve 1.6 m barge
curve
Chapman and Ward HMPOR slide 150 © 2011 John Wiley & Sons Ltd.
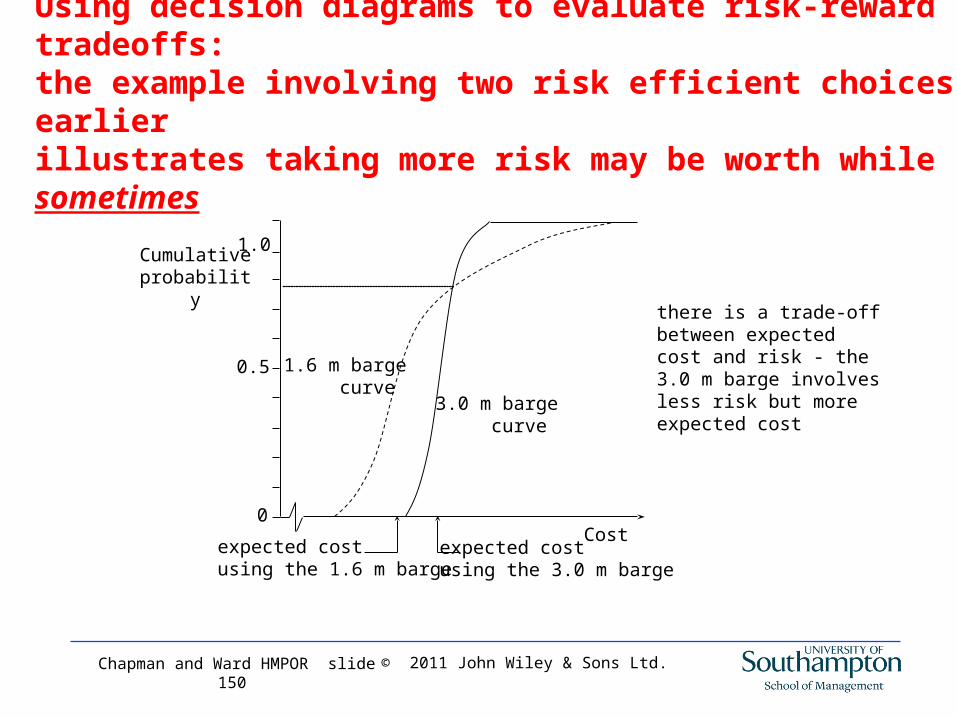
Using decision diagrams to evaluate risk-reward tradeoffs: the example involving two risk efficient choices used earlier illustrates taking more risk may be worth while sometimes
Cost
0.5
1.0
Cumulative probability
0
1.6 m barge curve
3.0 m barge curve
expected cost using the 1.6 m barge
expected costusing the 3.0 m barge
there is a trade-offbetween expectedcost and risk - the 3.0 m barge involvesless risk but more expected cost

Chapman and Ward HMPOR slide 151 © 2011 John Wiley & Sons Ltd.
Using decision diagrams in very simple forms can be useful: the photocopier example illustrates this in terms of contract cost risk, and this example also illustrates how to consider secondary criteria which may not be quantifiable directly
Cost
0.5
1.0
0
A CB
P10
P90
P50
Probability

Chapman and Ward HMPOR slide 152 © 2011 John Wiley & Sons Ltd.
Understanding risk efficiency at a corporate level as well as at a project level is crucial
• Understanding the basic implications• Using it to make decisions simpler• Using it as a engine of culture change to replace
a ‘blame culture’ with an ‘opportunity culture’

Chapman and Ward HMPOR slide 153 © 2011 John Wiley & Sons Ltd.
Returning to our list of implementation issues
• Choosing a demonstration project• Context as a process design issue• Planning the introduction as a project/programme• Starting by being clear about initial and long term
objectives, and the evolution planned• Integrating risk and opportunity management across
the organization• Being clear about the skills needed, skills and
knowledge development, and role of consultants• Governance

Chapman and Ward HMPOR slide 154 © 2011 John Wiley & Sons Ltd.
Contracts and governance as frameworks for
enlightened relationship management

Chapman and Ward HMPOR slide 155 © 2011 John Wiley & Sons Ltd.
Some pathways for uncertainty management development
• Current uncertainty management activity may not be evenly developed
• Some possible development options: - focus on building uncertainty management into one unit or process - launch a company-wide initiative - concentrate on a wider use of a limited process - target quick or large wins

Chapman and Ward HMPOR slide 156 © 2011 John Wiley & Sons Ltd.
Risk management maturity models: Deloach (2000) example
Description
Maturity Level
1 Initial 2 Repeatable 3 Defined 4 Managed 5 Optimising
Capability (Ad hoc/chaotic)
No institutionalised processes
Reliance on the
competence of individuals
(Intuitive)Processes
establishedand
repeatingReliance onindividuals
reduced
(Qualitative/quantitative)
Policies, processes
and standards
defined and uniformly applied
across the organization
(Quantitative)Risks
measured and
managed quantitative
ly, and aggregated enterprise
wide Risk/reward
tradeoffs considered
(Continuous feedback)
Emphasis on taking and
exploiting risk Knowledge accumulated and shared
Hillson (1997) and Hopkinson (2011) are example alternatives

Chapman and Ward HMPOR slide 157 © 2011 John Wiley & Sons Ltd.
Some common issues
• Limited definitions of levels of maturity• Benchmarking of existing practice against maturity
levels• Identification of weakest links to focus development
efforts• How to move from one level to the next

Chapman and Ward HMPOR slide 158 © 2011 John Wiley & Sons Ltd.
Aspects of uncertainty management capability: descriptors
1. The focus of attention
Threats, opportunities and threats, or uncertainty.
2. Application contexts
UM applied to operations, projects, programmes, or strategies.
3. The nature and quality of processes employed
The degree of formality, level of documentation, the scope of processes, the nature of steps involved, the tools and techniques employed, the extent and quality of quantification.

Chapman and Ward HMPOR slide 159 © 2011 John Wiley & Sons Ltd.
Aspects of uncertainty management capability: facilitators
1. Supporting uncertainty management infrastructureGuiding principles, objectives and scope of UM, policies (operating rules), allocation of responsibilities for UM, formal processes for administration of UM applications, information systems, resources applied to UM.
2. Supporting organisational capabilitiesAdministrative structures, communication, information systems, knowledge management, organisation learning.
3. Organisation cultureAttitude to risk and uncertainty, tolerance of mistakes, level of trust, openness, etc.
4. Human resource capability for risk managementKnowledge and experience of UM methodology and techniques, perceived roles and responsibilities, motivation to undertake UM, motivation to develop UM expertise

Chapman and Ward HMPOR slide 160 © 2011 John Wiley & Sons Ltd.
Facilitating infrastructure
• Guiding principles• Objectives and scope for uncertainty management• The strategy for use and development • Assignment of formal roles• Policies and guidelines for uncertainty management
application• Nature of decision support and information systems

Chapman and Ward HMPOR slide 161 © 2011 John Wiley & Sons Ltd.
Some guiding principles
The strategic perspective• Which business areas to operate in • What risks are central/inherent to this business• Shareholder expectations about corporate risk taking
Risk tolerance• How much is the firm willing to lose?• What resources are available to support potential
losses?• Is the firm getting sufficient return for the risks being
taken?

Chapman and Ward HMPOR slide 162 © 2011 John Wiley & Sons Ltd.
The organisation’s risk ‘philosophy’ ?
• Exposure to risk is necessary for success• Risk is uncertainty about performance: it includes
‘upside’ as well as ’downside’ variability • ‘A stitch in time saves nine’• Risk is not something to be avoided, but represents
the source of opportunities • Uncertainty needs to be understood so that
opportunities can be seized effectively• Everyone retains some responsibility for managing risk• Risk management is an opportunity for creative
thinking and having fun

Chapman and Ward HMPOR slide 163 © 2011 John Wiley & Sons Ltd.
Policies and guidelines for a best practice approach to uncertainty management application
• The purpose of uncertainty management • What form uncertainty management should take• Who should do it• How uncertainty management should be carried out,
supported, and monitored• When uncertainty management should be undertaken• What resources should be applied

Chapman and Ward HMPOR slide 164 © 2011 John Wiley & Sons Ltd.
Example uncertainty management policy statement issues
The level and nature of risk which is acceptable for particular business activities or programmes
with context conditions and a risk-reward tradeoffs basisResponsibilities for the management of particular sources of uncertainty and
associated financing arrangementsRoles and responsibilities for carrying out various uncertainty management
activitiesMechanisms for monitoring and reviewing uncertainty management activitiesMechanisms for monitoring and reviewing uncertainty management principles,
policies, and guidelinesRules for reporting significant uncertainty, opportunity and risk higher up the
hierarchyThe nature of PUMPs and other uncertainty management processes in various
contextsUse of standard documentation for analysis and reportingUse of particular sensitivity analysis tools and techniques for ranking and
evaluating sources of uncertaintyUse of particular tools for making decisions between available option choicesTreatment of interdependencies between sources of uncertainty in a range of ways
for different levels of clarityGuidance on achieving clarity efficiency and overall opportunity efficiency

Chapman and Ward HMPOR slide 165 © 2011 John Wiley & Sons Ltd.
Corporate benefits of a best practice uncertainty management approach
more profit
win more contracts
competitiveadvantage
keener pricing
lower costs
ability to manage issues
more realisticquantification of uncertainty
corporate knowledge base
documentation of sources and responses
appreciationof uncertainty
better quality opportunityand risk management
improved designof projects
reduce costof tendering
avoid ‘disaster’contracts

Chapman and Ward HMPOR slide 166 © 2011 John Wiley & Sons Ltd.
Corporate benefits of a best practice uncertainty management culture
more profit
higher quality staff
fewer ‘disasters’ more opportunities
more smiles
less wasted effort uncertainty as
opportunities
enlightened gambles
effective planning horizons
enlightened caution
enlightened controls
more ‘pleasure’ +
more trustmore opennessbetter communicationmore congruent objectivesmore lateral thinkingmore creativitymore constructive insubordinationbetter ‘bonding’better teamwork and partneringmore ‘empowerment’more training, less directingbetter ‘management of expectations’better use of diverse experiencesgood management recognised
less ‘pain’
less wasted effortless frustrationfewer crisesless confrontationfewer witch-huntsbad luck recognised
more smiles =

Chapman and Ward HMPOR slide 167 © 2011 John Wiley & Sons Ltd.
The way forward
• Enormous potential for improving organisational performance? Current risk management activity is limited.
• Start by recognising dimensions for development.• Consider the full range of objectives, and linkage
management.• Major obstacles to development?• Need for a strategy to develop uncertainty
management capability.

Chapman and Ward HMPOR slide 168 © 2011 John Wiley & Sons Ltd.
Part four summary, questions and discussion