Embed Size (px)
Citation preview

Changes in Material Hardship Preceding Entry into the Supplemental Security Income Program:
Evidence from the Survey of Income and Program Participation
Rajan A. Sonik
Lurie Institute for Disability Policy
Heller School for Social Policy and Management
Brandeis University
Faculty Mentor:
Susan Parish, PhD, MSW
Dean and Professor of Health Sciences
Bouvé College of Health Sciences
Northeastern University
360 Huntington Avenue
Boston, MA 02115
The research reported herein was performed pursuant to a grant from Policy Research, Inc. as
part of the U.S. Social Security Administration’s (SSA’s) Improving Disability Determination
Process Small Grant Program. The opinions and conclusions expressed are solely those of the
author(s) and do not represent the opinions or policy of Policy Research, Inc., SSA or any other
agency of the Federal Government.

2
Changes in Material Hardship Preceding Entry into the Supplemental Security Income Program:
Evidence from the Survey of Income and Program Participation
Abstract
Not all eligible individuals seek benefits from means-tested social welfare programs, but
the reasons behind this phenomenon are poorly understood. Evidence from studies of the
Supplemental Nutrition Assistance Program suggests that beneficiaries may be those whose
hardship levels rise shortly before applying for benefits. In this project, I embarked on a
preliminary investigation into whether similar patterns exist for the Supplemental Security
Income (SSI) program through use of data from the nationally representative Survey of Income
and Program Participation. I found preliminary evidence to suggest that uninsurance and food
insecurity rise for eventual SSI recipients as compared to eligible non-recipients prior to program
entry. The information provided here may help in the development of policies that can alleviate
vulnerabilities for people before they have a need for SSI benefits.
3
Background
The drivers of participation in means-tested social welfare programs are poorly
understood. Not all eligible individuals or families seek benefits from these programs, and
participation rates vary considerably from state to state. For example, the US Department of
Agriculture (2015) estimates that 2012 Supplemental Nutrition Assistance Program (SNAP;
formerly the Food Stamps Program) participation rates among eligible individuals ranged from
56% in Wyoming to nearly 100% in Oregon and Maine. This type of data is not collected as
regularly for Supplemental Security Income (SSI) program, but one recent study estimated that
SSI participation among working age people with disabilities ranged from 13% in Utah to 33%
in New York (Ben-Shalom & Stapleton, 2014). Another inquiry found that 54% of those aged
70 or older who were eligible for SSI benefits actually received them (Davies, 2003).
The lack of full participation in these programs raises important policy questions. Why
might individuals who are otherwise eligible to receive program benefits not seek them? And
what causes some people to effectively overcome these barriers and ultimately obtain program
benefits?
Some answers to this latter question may arise from analyses aimed at understanding the
effects of these programs. Much of the existing research has focused on the SNAP program,
which is the largest domestic program aimed at alleviating food insecurity (United States
Department of Agriculture, 2016). The example of SNAP will illustrate the questions regarding
SSI explored here.
Multiple studies have tried to examine the extent to which SNAP participation reduces
food insecurity. Paradoxically, most early studies found that receiving SNAP benefits was
actually associated with higher rates of food insecurity, even when samples were limited to
people who were income-eligible for the program (e.g., Alaimo, Briefel, Frongillo, & Olson,
1998; Cohen, Ohls, Andrews, Ponza, Moreno, Zambrowski, & Cohen, 1999; Jensen, 2002; Ribar
& Hamrick, 2003; Wilde & Nord, 2005). Though lack of awareness of the program surely exists,
these findings appeared to rule out an information gap as the primary difference between
participants and non-participants. Otherwise, among people who were eligible for the program,
beneficiaries would tend to have less food insecurity, even in simple cross-sectional analyses.
The hypothesized explanation for the actual results was twofold: perhaps SNAP
beneficiaries somehow have heightened vulnerability that precipitates their entry into the
program, and perhaps SNAP partially but incompletely alleviates this vulnerability (Ratcliffe,
McKernan, & Zhang, 2011). Using more advanced methods, including the use of panel data
(Mabli & Ohls, 2015; Nord & Golla, 2009) and instrumental variables approaches (Ratcliff et al.,
2011; Shaefer & Gutierrez, 2013), more recent research has supported both hypotheses. For
example, in one study food insecurity increased during the six months before eventual SNAP
participants received benefits (Nord & Golla, 2009), and in another study SNAP receipt lowered
the chance of being food insecure by 30% after controlling for the bias caused by the self-
selection of highly food insecure families into the program (Ratcliff et al., 2011).
Together, these studies offer initial insights into why some individuals enter the SNAP
program while others who are also eligible do not. Namely, within the context of low-income
individuals and families, additional factors beyond traditional socioeconomic measures may
increase food insecurity among some households and in turn catalyze them to seek SNAP. Cross-
sectional models adjusted for socioeconomic factors, and so something else had to be causing the
increase food insecurity prior to SNAP enrollment. This is consistent with past research

4
demonstrating that family, health, and socioeconomic shocks contribute significantly to variation
in material hardship levels among low-income families (Heflin, 2014). Recent work has also
indicated that economic and family shocks, are among the triggering factors for SNAP
enrollment (Kim & Shaefer, 2015).
Sudden changes in material hardship levels could be relevant for SSI as well. However,
SSI differs in important ways from SNAP. Unlike with SNAP, SSI recipients must have
significant disabilities in addition to having limited income and assets. Further, SSI recipients
automatically receive Medicaid in many states, raising the potential importance of health
insurance coverage in decisions about seeking SSI. Despite these differences, it is likely that
increased material hardship may precipitate entry into SSI, as it does with SNAP. The research
regarding SSI is not as robust as it is for SNAP in this area, but a handful of studies have been
done. Recent work by Rose-Jacobs and her colleagues (2016) found that, among low-income
families that include children with special health care needs, those receiving SSI were more
likely to report household food insecurity. This result is telling because families raising children
with disabilities generally have already-high baseline rates of hardship and deprivation (Parish,
Rose, Grinstein-Weiss, Richman, & Andrews, 2008). Also, there is some evidence to suggest
that SSI improves health outcomes among the elderly (Herd, Schoeni, & House, 2008).
This limited existing research suggests that the questions explored for SNAP must be
investigated for SSI. However, there is much work to be done to identify the predictors of SSI
program participation. The present study is an initial step towards addressing this gap in the
literature by using the Survey of Income and Program Participation to explore factors that
precipitate entry into SSI.
Statement of problem and research questions
Benefits from the SSI program are generally seen as “assistance of last resort” (Mashaw,
Perrin, & Reno, 1996; Parish, Ghosh, & Igdalsky, 2013). This phenomenon implies that the need
for SSI benefits does not arise instantaneously. Rather, functional impairments and economic
hardships may increase vulnerability gradually prior to being punctuated by family and economic
shocks that push families over the edge. Such a scenario indicates that early interventions and
supports designed to address specific vulnerabilities at the right time may prevent certain
individuals (and families in the case of children with disabilities) from needing to seek benefits
in the first place.
To advance an understanding of the mechanisms precipitating participation in the SSI
program, this project will address the following research questions: (1) is SSI receipt associated
with health and food-related material hardships in cross-sectional analyses?; and (2) is entry into
the SSI program associated with pre-entry increases in health and food related material
hardships?
Methods
Data I utilized publicly accessible data from the 2008 panel of the Survey of Income and
Program Participation. The Survey of Income and Program Participation is a nationally
representative longitudinal study of the non-institutionalized US population (US Census Bureau,
n.d.). The 2008 panel was administered to approximately 42,000 households over the course of
5
sixteen waves, which took place every four months. A set of core questions were asked during
each wave. These included questions about income, assets, employment, receipt of benefits from
government programs (including SSI), and a wide range of other variables. Also, additional sets
of questions referred to as topical modules were asked during twelve of the sixteen waves. In
waves 6 and 9 of the 2008 Survey of Income and Program Participation, there was a topical
module focused on adult well-being, which included questions about health, economic hardship,
and living conditions. Wave 6 also included topical modules related to functional limitations and
disabilities among adults and children. In addition to the core data from each wave, data from
these topical modules were focus of this project.
The sampling design of the Survey of Income and Program Participation
The Survey of Income and Program Participation uses a two-stage sampling design aimed
at providing a representative sample of the U.S. (United States Census Bureau, n.d.). The
sampling frame is the Master Address File, which is generated by the US Postal Service and
utilized by the US Census Bureau for a number of its surveys. The primary sampling units are
counties (each primary sampling unit is either one county if its population is large enough or
multiple geographically contiguous counties with smaller populations). Primary sampling units
with large populations are guaranteed inclusion in the Survey of Income and Program
Participation. Less populated primary sampling units are stratified by state, and two from each
state are then chosen. The probability of selection for each of these smaller primary sampling
unit is in proportion to their size. Each chosen primary sampling unit is further stratified into two
groups based on income, with one strata containing a disproportionate number of low-income
households. This allows for oversampling of lower-income households. This oversampling is
part of a broader systematic selection strategy (US Census Bureau, n.d.).
The Survey of Income and Program Participation provides various weighting variables
that take into account this complex design and the probability of someone being in the sample
(SIPP User Guide, 2008). These weights allow for relatively direct estimates of the number of
people and households across the United States who are represented by each surveyed person
and household. Person-weights can be used to calculate descriptive statistics for individual-level
variables, such as race and gender. For household-level variables, such the percentage of
households with income below the federal poverty level, household-weights can be used. For
variance estimations, the Survey of Income and Program Participation recommends using Fay’s
modified balanced repeat replication method (SIPP User Guide, 2008). To prevent respondents
from small geographic areas from being identifiable, the Survey of Income and Program
Participation alters its primary sample units by combining them into larger variance strata and
then splitting each stratum into two variance units. Fay’s method is recommended for variance
estimation because it is able to account for both halves of the strata that are generated. Resulting
variance estimates are nominally conservative (SIPP User Guide, 2008).
Analytic samples
The core and topical module data for each wave of the Survey of Income and Program
Participation is provided in separate data files. These files must be merged in order to conduct
analyses involving multiple waves or involving both core and topical module data. To form my
working data set, I first merged the core datasets from waves 6 through 12 and the topical
module datasets from waves 4, 6, 7, and 9. Each core data set contains four time points of data,
6
one for each of the four months between the current and previous wave’s questioning. The fourth
month of data is generally considered to contain the most accurate data, as it is the most recent;
this issue is referred to as “seam bias” (Moore, 2007). For this reason, I only utilized the month 4
data from each wave’s core data files. Topical module data only contain information from the
time of the survey, and so this problem does not arise for those files. In all, the resulting fully
merged data file included seven continuous time points (one for each of waves 6-12) collected
over the course of over two years from May-August 2010 to May-August 2012, in addition
topical data from wave 4 (collected in September-December 2009).
From this starting place, I identified samples for two sets of analyses, one for research
question (1) and one for research question (2). The first set comprised cross-sectional analyses
comparing the material hardship levels of SSI recipients and eligible non-recipients. The second
set of analyses compared changes in material hardships among eventual SSI recipients and
eligible non-recipients in the time just before eventual recipients entered the SSI program (“pre-
entry analyses”). The data I utilized from each wave of the Survey of Income and Program
Participation for each of these sets of analyses are summarized in Table 1.
These specific data were chosen because they offer information on individuals during
wave 6, during the one year after wave 9, and during the year in between these two waves.
Waves 6 and 9 were particularly important because they were the only waves that provide
detailed information on material hardships. Also, wave 6 provided highly detailed information on
disability status. Using a year’s worth of data on either side of these waves further allowed a
balancing of two factors: (i) incorporating enough time to capture entry into SSI and its
aftereffects in the context of lengthy application and approval processes, and (ii) limiting losses
of sample size due to attrition.
Criteria for inclusion in the analytic samples. I used related but separate criteria for
including individuals in the analytic samples for the cross-sectional and pre-entry analyses. I
identified two comparison groups in each set of analyses: SSI recipients (or eventual SSI
recipients), and eligible non-recipients.
For the cross-sectional analyses, an individual was identified as an SSI recipient if she or
he was the head of household and reported receiving SSI benefits in the interview month for
wave 6. The head-of-household restriction was used because the Survey of Income and Program
Participation only records material hardships at the household level, and it assesses household
level material hardships through interviews with the head of household.
Eligible non-recipients had to meet several criteria. These individuals had to be heads of
households and not receive SSI in wave 6. In addition, they had to either report having a
disability (as defined below) or be 65 years or older in wave 6 (this is referred to as “categorical
eligibility”). As in previous work attempting to identify categorically eligible non-participants in
survey data (Ben-Shalom & Stapleton, 2014a; Gettens, Lei, & Henry, 2016), any reported
disability was accepted. The potential limitations of this approach are discussed below, given the
high level of disability severity required for actual acceptance into the SSI program. Finally,
these individuals also had to meet the strict income eligibility criteria for SSI based on their
incomes in wave 6, and they had to meet the strict asset eligibility criteria for SSI based on their
assets in wave 4 (income and asset eligibility are together referred to as “financial eligibility”).
The complex income and asset calculations for SSI financial eligibility were assessed using the
methods described by Davies and colleagues (2001) for using variables in the Survey of Income
and Program Participation for this purpose.

7
Table 1. Data utilized from the Survey of Income and Program Participation
Wave Cross-sectional analyses Pre-entry analyses
4 Assets information No data used
6 SSI status
Disability status
Income information
Head-of-household status
Material hardships
Health status
SSI status
Disability status
Income information
Head-of-household status
Material hardships
Health status
7 No data used SSI status
Assets information
Head-of-household status
8 No data used SSI status
9 No data used SSI status
Head-of-household status
Material hardships
10 No data used SSI status
11 No data used SSI status
12 No data used SSI status
For the pre-entry analyses, the criteria for identifying eventual SSI recipients were
designed to allow for measurement of material hardship levels at two time points. The two time
points were designed to be one year apart, with the second time point occurring just before SSI
receipt. Achieving a one year gap between the time points was straightforward: the Survey of
Income and Program Participation only measured material hardship levels during waves 6 and
wave 9. Because each wave is 4 months apart, this meant that waves 6 and 9 were 1 year apart.
Ensuring that the second time point occurred just before SSI receipt was more complex.
Ideally, I would have only included people who first reported SSI receipt in wave 10. Doing so
would have yielded wave 9 material hardships data that were reported only 4 months before
initial SSI receipt. In turn, the wave 6 material hardships data would have been reported 16
months before initial SSI receipt (i.e. one year prior to wave 9).
However, utilizing only these individuals would have led to an extremely limited sample
size. In order to increase the sample size, I also included individuals who first reported receiving
SSI in waves 11 or 12. For people first reporting SSI receipt in wave 11, the wave 9 data on
material hardships was reported 8 months before initial SSI receipt, meaning that the wave 6 data
were reported 20 months before receipt. Similarly, for people first reporting SSI receipt in wave
12, the wave 9 data on material hardships was reported 12 months before initial SSI receipt, and
the wave 6 data was reported 24 months before receipt.
In sum, for the people I identified as eventual SSI recipients, I had two time points of
material hardship data. The first time point (from the wave 6 data) was between 16 and 24
months prior to initial SSI receipt, and the second time point (from the wave 9 data) was between
4 and 12 months prior to initial SSI receipt. To identify these individuals, I used the following
criteria: the individuals were present in the survey continuously from waves 6 through 12, they
were heads of households in both waves 6 and 9, they did not receive SSI in any of waves 6
through 9, and they reported receiving SSI in at least one of waves 10, 11, or 12.

8
Material hardship I used the health and food-related material hardships utilized by Heflin, Sandberg, and
Rafail (2009). The Survey of Income and Program Participation provides data on numerous
individual material hardships. Heflin and colleagues (2009) developed latent constructs from
these data, and I utilize the three individual health-related and three individual food-related
measures from their final model. The three health-related hardships asked about household
insurance status, any unmet need to see a doctor or visit the hospital, and any unmet need to see a
dentist. The three food-related hardships asked about an inability to afford balanced meals,
whether food lasted in the household, and whether household members had enough to eat.
Other measures Disability status was identified using the methodology delineated by the US Census
Bureau for identifying individuals with disabilities in the Survey of Income and Program
Participation (Brault, 2012). This method uses approximately 60 variables and allows for the
differentiation of disabilities by severity and by the domain of impaired activities (Brault, 2012).
In addition to the material hardship variables, I examined demographic variables (e.g., gender,
marital status, race/ethnicity, education), employment status, and self-reported health status
(dichotomized to “fair or poor” versus “excellent, very good, or good”). The grouping
independent variable for the cross-sectional and pre-entry analyses were dichotomized variables
that distinguished between the SSI recipients (or eventual SSI recipients) and the eligible non-
recipients relevant for each respective analysis. Finally, for the pre-entry analyses, I developed a
“Post” variable to indicate whether data for an individual was coming from wave 6 or wave 9. In
order to create this variable, I had to restructure the data from wide format to long format.
Statistical approach I used Stata (version 14.0) for all analyses. For the cross-sectional analyses, I conducted
weighted bivariate analyses. I compared SSI recipients and eligible non-recipients on each of the
6 individual material hardship variables (three each for health and food), on each demographic
variable, and on health status. Next, I ran logistic regressions on the 6 individual hardships (as
well as one logistic regression for health status), adjusting for demographic factors.
For the pre-entry analyses, I again started with bivariate comparisons and continued to
models of each individual hardship. I used hierarchical generalized linear models to examine the
6 individual hardships in the pre-entry analyses. The conceptual frame for these models was
difference-in-differences. For the pre-entry analyses, I investigated whether the group ultimately
receiving SSI benefits had a change in outcome levels between waves 6 and 9 that differed from
the change in outcome levels for the group that never received SSI benefits during this time.
Multi-level modeling was used in order to account for the fact that I had repeated (and therefore
dependent) measures on the same individuals. This frame also allowed initial material hardship
levels to vary randomly between individuals. I used the following general set of multi-level
equations:
Level 1 (time):
Ytj = π0j + π1j*Posttj + rtj

9
Level 2 (individual):
π0j = β00 + β01-05*(Demographics1-5)j + β06*(SSI_receipt)j + u0j
π1j = β10 + β11*(SSI_receipt)j
Combined:
Ytj = β00 + β01-05*(Demographics1-5)j + β06*(SSI_receipt)j + β10*Posttj
+ β11*(SSI_receipt)j*Posttj + u0j+ rtj
Ytj is the outcome at time t (i.e. either wave 6 or 9) for person j. Demographics1-5 are the five
demographic variables (as measured at wave 6) that I included as covariates (age, race/ethnicity,
marital status, education status, and employment status). Adjusted for demographics, β00
represents the average outcome level at wave 6 for people never receiving SSI during the study
period, the quantity (β00 + β0(n+1)) represents the average outcome level at wave 6 for people
receiving SSI during the study period, the quantity (β00 + β10) represents the average outcome
level at wave 9 for people never receiving SSI during the study period, and the quantity (β00 +
β0(n+1) + β10 + β11) represents the average outcome level at wave 9 for people receiving SSI
during the study period. β11 was the estimate of interest, as it represents the difference-in-
differences (i.e. the average difference in the change of outcome levels from waves 6 to 9
between the people receiving and not receiving SSI). Weighted analyses were not used, as Stata
does not provide goodness-of-fit statistics for multilevel models calculated using weights;
however, weighted and unweighted estimates were only nominally different.
Results
Cross-sectional analyses The final sample for the full cross-sectional analyses included 1,312 SSI recipients and
4,756 eligible non-recipients. In bivariate comparisons, SSI recipients differed from eligible non-
recipients on a host of demographic factors and material hardship outcomes. Demographically,
SSI recipients were, on average, younger (56 years versus 66 years, p < 0.001), more likely to be
women (67% versus 63%, p = 0.04), less likely to be married and living with their spouse (17%
versus 29%, p < 0.001), less likely to be non-Hispanic white (48% versus 69%, p < 0.001), and
less likely to have a high school diploma or general education diploma (62% versus 76%, p <
0.001) (Table R1). SSI recipients were less likely to report having very good (11% versus 16%,
p < 0.001) or good (25% versus 34%, p < 0.001) health, and they were more likely to report
having fair (38% versus 31%, p < 0.001) or poor (23% versus 16%, p < 0.001) health (Table
R1).
For health-related material hardships, SSI recipients were less likely to live in a
household where someone lacked health insurance (18% versus 22%, p = 0.006), but they were
as likely as eligible non-recipients to have unmet dental or medical needs (Table R1).
Meanwhile, SSI recipients were more likely than eligible non-recipients to experience all three
food-related material hardships (Table R1).
Logistic regression models for individual material hardships and health status. The
results for logistic regressions comparing SSI recipients to eligible non-recipients on the six
individual material hardships and health status, adjusting for covariates, are presented in Table

10
Table R1 Comparison of SSI recipients to financially and categorically eligible non-recipients
Variable Eligible non-recipientsa
(n = 4,756)
SSI recipientsb
(n = 1,312) Fc P-
value
Basic demographics
Age (mean), years (SE) 66.3 (0.2) 56.1 (0.5) 336.9 <0.001
Women, % (SE) 63.0 (0.7) 66.6 (1.4) 4.5 0.04
Married, living with spouse, % (SE) 28.9 (0.7) 16.9 (1.1) 63.5 <0.001 Employed at all, % (SE) 13.8 (0.6) 9.5 (1.0) 12.4 <0.001
Race/ethnicity, % (SE)
Non-Hispanic white 69.3 (0.8) 47.8 (1.6) 150.2 <0.001
Non-Hispanic black 16.3 (0.7) 28.2 (1.5) 58.3 <0.001 Non-Hispanic Asian 1.6 (0.2) 3.6 (0.5) 24.3 <0.001 Non-Hispanic, other 2.6 (0.3) 4.2 (0.5) 9.6 0.002
Hispanic 10.2 (0.5) 16.2 (1.2) 30.0 <0.001 Educational attainment
High school/GED or more, % (SE) 76.2 (0.7) 61.8 (1.3) 108.2 <0.001 Bachelor’s degree or more, % (SE) 10.3 (0.5) 6.0 (0.6) 25.4 <0.001 Health status, % (SE)
Excellent 4.2 (0.3) 3.4 (0.5) 1.4 0.24
Very good 15.7 (0.6) 10.8 (1.0) 15.1 <0.001 Good 33.5 (0.8) 25.0 (1.4) 29.7 <0.001 Fair 30.5 (0.8) 37.5 (1.5) 17.1 <0.001 Poor 16.1 (0.6) 23.3 (1.4) 29.6 <0.001 Health hardshipsd, % (SE)
Uninsured 22.2 (0.6) 18.4 (1.1) 7.9 0.006
Unmet dentist need 14.6 (0.6) 15.6 (1.1) 0.9 0.33
Unmet doctor/hospital need 13.2 (0.6) 11.0 (0.9) 3.5 0.06
Food hardshipsd, % (SE)
Could not afford balanced meals 19.4 (0.6) 31.6 (1.5) 71.7 <0.001
Food did not last 20.7 (0.6) 32.0 (1.5) 68.8 <0.001 Not enough to eat 5.0 (0.4) 9.1 (0.9) 28.5 <0.001 a Eligible non-recipients met SSI (Supplemental Security Income) income limits, met SSI assets limits, had a disability
or were at least 65 years old, were ≥18 years old, and were heads of households; b SSI recipients were ≥18 year old
heads of households; c For comparisons of weighted means (e.g., age), STATA conducts adjusted Wald tests, and for
comparisons of weighted percentages (e.g., gender), STATA conducts corrected Pearson’s χ2 tests. Both produce F
statistics. All analyses weighted; d All hardships measured at household level (e.g., anyone in household uninsured?)
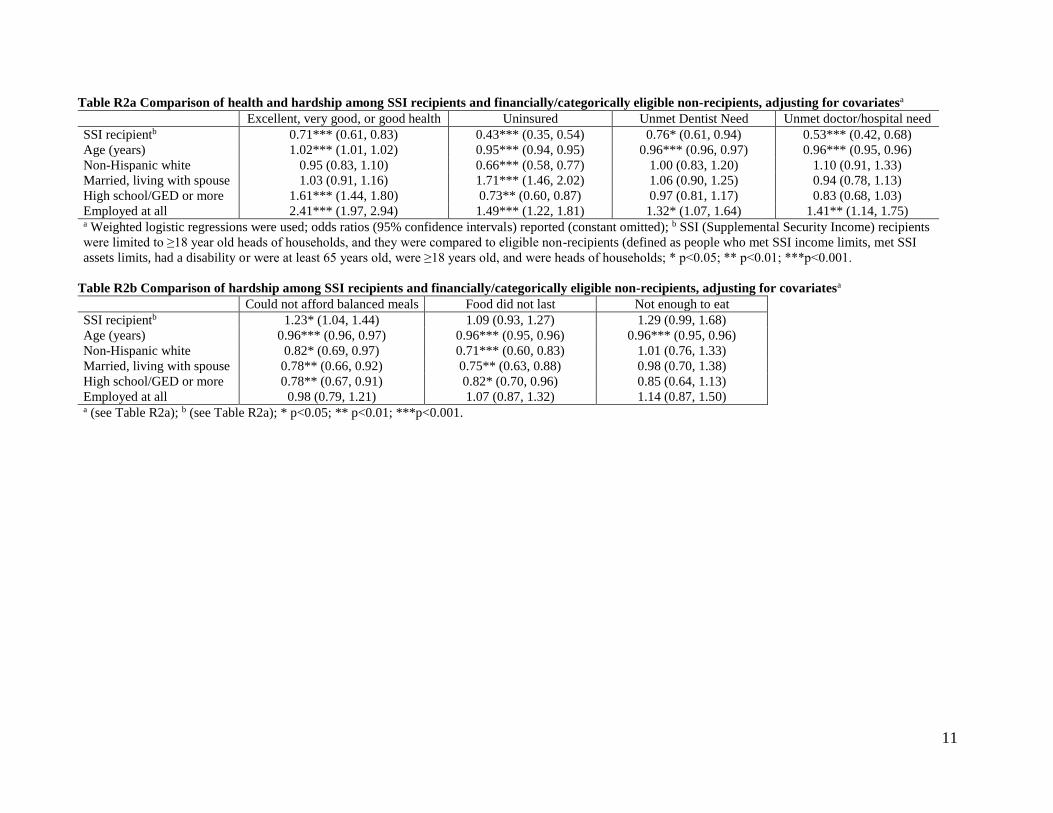
R2 (a-b). SSI recipients were significantly less likely to report each health-related material
hardship (uninsured: OR = 0.43, 95% CI: 0.35, 0.54; dental hardships: OR = 0.76, 95% CI: 0.61,
0.94; medical hardship: OR = 0.53, 95% CI: 0.42, 0.68) (Table R2). Regarding food-related
hardships, SSI recipients were significantly more likely to not be able to afford balanced meals
(OR = 1.23, 95% CI: 1.04, 1.44), but differences in experiencing the other two food hardships
were not significant once adjusting for covariates (Table R2). Finally, SSI recipients were
significantly less likely to report a positive health status (OR = 0.71, 95% CI: 0.61, 0.83) (Table
R2).
11
Table R2a Comparison of health and hardship among SSI recipients and financially/categorically eligible non-recipients, adjusting for covariatesa
Excellent, very good, or good health Uninsured Unmet Dentist Need Unmet doctor/hospital need
SSI recipientb 0.71*** (0.61, 0.83) 0.43*** (0.35, 0.54) 0.76* (0.61, 0.94) 0.53*** (0.42, 0.68)
Age (years) 1.02*** (1.01, 1.02) 0.95*** (0.94, 0.95) 0.96*** (0.96, 0.97) 0.96*** (0.95, 0.96)
Non-Hispanic white 0.95 (0.83, 1.10) 0.66*** (0.58, 0.77) 1.00 (0.83, 1.20) 1.10 (0.91, 1.33)
Married, living with spouse 1.03 (0.91, 1.16) 1.71*** (1.46, 2.02) 1.06 (0.90, 1.25) 0.94 (0.78, 1.13)
High school/GED or more 1.61*** (1.44, 1.80) 0.73** (0.60, 0.87) 0.97 (0.81, 1.17) 0.83 (0.68, 1.03)
Employed at all 2.41*** (1.97, 2.94) 1.49*** (1.22, 1.81) 1.32* (1.07, 1.64) 1.41** (1.14, 1.75) a Weighted logistic regressions were used; odds ratios (95% confidence intervals) reported (constant omitted); b SSI (Supplemental Security Income) recipients
were limited to ≥18 year old heads of households, and they were compared to eligible non-recipients (defined as people who met SSI income limits, met SSI
assets limits, had a disability or were at least 65 years old, were ≥18 years old, and were heads of households; * p<0.05; ** p<0.01; ***p<0.001.
Table R2b Comparison of hardship among SSI recipients and financially/categorically eligible non-recipients, adjusting for covariatesa
Could not afford balanced meals Food did not last Not enough to eat
SSI recipientb 1.23* (1.04, 1.44) 1.09 (0.93, 1.27) 1.29 (0.99, 1.68)
Age (years) 0.96*** (0.96, 0.97) 0.96*** (0.95, 0.96) 0.96*** (0.95, 0.96)
Non-Hispanic white 0.82* (0.69, 0.97) 0.71*** (0.60, 0.83) 1.01 (0.76, 1.33)
Married, living with spouse 0.78** (0.66, 0.92) 0.75** (0.63, 0.88) 0.98 (0.70, 1.38)
High school/GED or more 0.78** (0.67, 0.91) 0.82* (0.70, 0.96) 0.85 (0.64, 1.13)
Employed at all 0.98 (0.79, 1.21) 1.07 (0.87, 1.32) 1.14 (0.87, 1.50) a (see Table R2a); b (see Table R2a); * p<0.05; ** p<0.01; ***p<0.001.

12
Pre-entry analyses Table R3 presents the pre-entry bivariate comparisons of the eventual SSI recipients (n =
148) to the eligible non-recipients (n = 3,193). Demographically, the eventual recipients were on
average significantly younger (51 years versus 67 years, p < 0.001), more likely to be employed
(37% versus 14%, p < 0.001), and less likely to be non-Hispanic white (55% versus 71%, p <
0.001) (Table R3).
Table R3 presents material hardship comparisons of the eventual SSI recipients and
eligible non-recipients at two time points. The first time point was 16-24 months prior to SSI
receipt and the second time point was 4-12 months prior to SSI receipt. SSI recipients were more
likely to experience all six material hardships at both time points, and material hardship levels
grew more for SSI recipients between the two time points for each of the material hardships
(Table R3). The differences in each of the food-related hardships increased enough that,
although none of the differences were statistically significant at the first time point, all of the
differences were statistically significant at the second time point (Table R3; Figure R1).
Notably and in contrast to the cross-sectional findings involving individuals already receiving
SSI, the eventual recipients were significantly more likely at both time points to live in a
household where at least one person lacked health insurance.
Hierarchical difference-in-differences models for individual material hardships. Difference-in-differences models for the individual hardships are presented in Table R4 (a-b).
The variable of interest in all models was the interaction term, which is labeled “SSI_recipient x
Time_1” in the tables. Due to the complications associated with interpreting odds ratios for
interaction terms, coefficients are presented in log odds.
For the eventual SSI recipients in these pre-entry models, the chance of experiencing
uninsurance (p = 0.09) and an inability to afford balanced meals (p = 0.03) increased more
between the two time points than they did for the eligible non-recipients, with at least marginal
statistical significance after adjusting for covariates (Table R4).
Limitations
The SIPP relies on self-reported data. Both disability status and receipt of public benefits
like SSI carry stigma, and individuals in the survey would need to overcome these stigmas in
order to be included in my analytic sample. The potential inaccuracies associated with self-
reported data and the differing definitions of disability used by the Social Security
Administration and the SIPP likely contributed to the fact that some individuals who identified
themselves as SSI recipients also reported data suggesting a lack of categorical and/or financial
eligibility for SSI. However, limiting the sample of SSI recipients to only those reporting
categorical and financial eligibility did not yield different results than using the full sample of
individuals identifying as SSI recipients. This result implies that self-reported receipt of SSI was
likely more accurate than self-reported disability, income, and assets. Determining SSI receipt
required only one question, whereas determining disability status, for example, required 60
questions. Further, the income and asset eligibility calculations were complex. It therefore seems
plausible that the SSI information was more reliable. Still, there remains a degree of uncertainty
created by these differing measures.
Relatedly, relying on the SIPP definition of disability to identify categorically eligible
non-recipients was a potential issue because the SSI program’s specific definition of disability
that requires high severity. Assigning categorical eligibility to any person reporting disability in

13
Table R3 Comparison of material hardship among eventual SSI recipients to financially and categorically eligible non-
recipients at 16-24 months prior and 4 to 12 months prior to entry of the eventual recipients into SSI.
16 to 24 months prior to SSI receipt 4 to 12 months prior to SSI receipt
Variable
Eligible non-
recipientsa
(n = 3,193)
Eventual
Recipientsb
(n = 148)
Fc P-value
Eligible non-
recipients
(n = 3,193)
Eventual
Recipients
(n = 148)
Fc P-value
Basic demographics
Age (mean), years (SE) 67.1 (0.3) 51.0 (1.1) 191.5 <0.001
Women, % (SE) 64.0 (0.9) 58.0 (4.2) 2.0 0.16
Married/living with spouse, % (SE) 29.5 (0.8) 35.8 (4.0) 2.6 0.11
Employed at all, % (SE) 14.3 (0.7) 36.7 (4.4) 43.7 <0.001
Race/ethnicity, % (SE)
Non-Hispanic white 71.2 (1.1) 54.8 (4.1) 19.8 <0.001
Non-Hispanic black 14.8 (0.7) 27.1 (4.0) 13.3 <0.001
Non-Hispanic Asian 1.3 (0.2) 1.0 (0.7) 0.2 0.68
Non-Hispanic, other 2.5 (3.2) 3.5 (1.4) 0.6 0.44
Hispanic 9.5 (0.8) 13.6 (2.8) 2.7 0.10
Educational attainment
High school/GED or more, % (SE) 76.5 (0.8) 75.7 (3.6) 0.0 0.83
Bachelor’s degree or more, % (SE) 9.7 (0.6) 9.8 (2.8) 0.0 0.95
Health status, % (SE)
Excellent 5.0 (0.4) 10.2 (3.0) 5.5 0.02
Very good 17.7 (0.7) 17.6 (3.6) 0.0 0.98
Good 34.9 (0.9) 27.5 (3.9) 2.9 0.09
Fair 28.4 (1.0) 34.3 (4.2) 2.0 0.16
Poor 14.0 (0.7) 10.4 (2.6) 1.3 0.25
Health hardshipsd, % (SE)
Uninsured 20.2 (0.8) 37.5(4.9) 18.6 <0.001 18.4 (0.7) 39.1 (4.8) 29.9 <0.001
Unmet dentist need 15.3 (0.7) 15.6 (3.4) 0.0 0.94 14.6 (0.7) 18.0 (3.9) 0.9 0.35
Unmet doctor/hospital need 12.4 (0.6) 17.1 (3.7) 2.0 0.16 11.7 (0.7) 18.5 (4.3) 3.4 0.07
Food hardshipsd, % (SE)
Could not afford balanced meals 19.2 (0.7) 25.5 (3.8) 3.2 0.08 19.6 (0.7) 36.3 (4.0) 25.1 <0.001 Food did not last 20.2 (0.7) 26.2 (3.7) 2.8 0.10 20.1 (8.6) 34.7 (4.1) 17.2 <0.001 Not enough to eat 4.6 (0.4) 7.6 (2.3) 2.4 0.12 4.7 (0.4) 10.9 (2.6) 10.9 0.001
a Eligible non-recipients never received SSI (Supplemental Security Income) from waves 6 through 12 (data from each wave
collected 4 months apart), met SSI income limits at wave 6, met SSI assets limits at wave 7, had a disability or were at least 65
years old at wave 6, and were heads of households at both waves 6 and 9; b Eventual SSI recipients were heads of households
at both waves 6 and 9, did not receive SSI in any of waves 6 through 9, and received SSI in at least one of waves 7, 8, or 9; c
For comparisons of weighted means (e.g., age), STATA conducts adjusted Wald tests, and for comparisons of weighted
percentages (e.g., gender), STATA conducts corrected Pearson’s χ2 tests. Both produce F statistics. All analyses weighted
using weight at wave 6; d All hardships measured at household level (e.g., anyone in household uninsured?)
the SIPP thus created a potential issue of having comparison groups that differed in terms of
disability severity. Gettens and colleagues (2016) analyzed the potential biases and measurement
errors created by using an approach similar to this one. The authors found that these potentially
negative effects were unlikely to have altered their results substantially (Gettens et al., 2016).
One possible explanation for these low levels of added bias is the stigma associated with
reporting disability that I noted above. It is possible that such stigma leads to people with less
severe disabilities to simply not report their functional impairments. Regardless, the different
disability definitions between the SIPP and the SSI program are an important limitation here.
Another limitation of was the set of restrictions for including individuals in the sample. In
particular, the samples in the pre-entry analyses were restricted to individuals who were adults,

14

15
Table R4a Difference-in-difference analyses comparing hardships among eventual SSI recipients and financially/
categorically eligible non-recipients at 16-24 months prior to SSI receipt (“Time_0”) and 4-12 months prior to SSI
receipt (“Time_1”), adjusting for covariatesa
Uninsured Unmet Dentist Need Unmet doctor/hospital need
SSI_recipientb -0.66 (-1.82, 0.51) -1.08** (-1.79, -0.37) -0.71† (-1.42, 0.00)
Time_1 -0.31* (-0.55, -0.07) -0.13 (-0.31, 0.05) -0.16 (-0.36, 0.03)
SSI_recipient x Time_1 0.78† (-0.11, 1.67) 0.21 (-0.57, 0.99) 0.24 (-0.55, 1.03)
Age (years) -0.21*** (-0.24, -0.18) -0.08*** (-0.09, -0.07) -0.08*** (-0.09, -0.07)
Non-Hispanic white -1.86*** (-2.42, -1.30) -0.17 (-0.44, 0.11) -0.04 (-0.33, 0.25)
Married, living with spouse 1.00*** (0.45, 1.54) -0.11 (-0.38, 0.17) -0.07 (-0.36, 0.22)
High school/GED or more -1.06*** (-1.65, -0.46) 0.09 (-0.21, 0.39) -0.16 (-0.48, 0.15)
Employed at all 0.78* (0.12, 1.44) 0.31† (-0.02, 0.65) 0.38* (0.03, 0.72) a Hierarchical generalized linear models were used (variance term, constant, and model fit statistics omitted);
log odds (95% confidence intervals) reported; b Eligible non-recipients and eventual SSI (Supplemental
Security Income) recipients defined as in R1.9 notes (a) and (b); † p<0.10; * p<0.05; ** p<0.01;
***p<0.001.
Table R4b Difference-in-difference analyses comparing hardships among eventual SSI recipients and financially/
categorically eligible non-recipients at 16-24 months prior to SSI receipt (“Time_0”) and 4-12 months prior to SSI
receipt (“Time_1”), adjusting for covariatesa
Could not afford
balanced meals Food did not last Not enough to eat
SSI_recipientb -0.47 (-1.07, 0.13) -0.49 (-1.08, 0.10) -0.37 (-1.30, 0.56)
Time_1 0.00 (-0.16, 0.16) -0.02 (-0.18, 0.14) 0.02 (-0.26, 0.3)
SSI_recipient x Time_1 0.71* (0.06, 1.37) 0.53 (-0.12, 1.17) 0.59 (-0.43, 1.62)
Age (years) -0.08*** (-0.08, -0.07) -0.08*** (-0.09, -0.07) -0.08*** (-0.09, -0.06)
Non-Hispanic white -0.61*** (-0.85, -0.37) -0.75*** (-0.98, -0.51) -0.56** (-0.94, -0.18)
Married, living with spouse -0.39** (-0.63, -0.15) -0.32** (-0.56, -0.08) -0.15 (-0.54, 0.25)
High school/GED or more -0.36** (-0.62, -0.11) -0.29* (-0.54, -0.04) -0.25 (-0.67, 0.17)
Employed at all -0.02 (-0.32, 0.28) -0.05 (-0.35, 0.25) -0.02 (-0.49, 0.44) a (see Table R4a); b (see Table R4a); † p<0.10; * p<0.05; ** p<0.01; ***p<0.001.
heads of households, and newly entering the SSI program. Those receiving SSI continuously
from childhood into adulthood would not appear in these analyses because by definition they
could not be new SSI entrants as adults. Also, people with disabilities preventing them from
being a head of household would not appear in the analyses.
In the pre-entry analyses, an additional key limitation was that the relatively small
samples required the use of time ranges rather than precise points in time. For example, I
included in the SSI group of the pre-entry analyses anyone receiving SSI starting in waves 10,
11, or 12. Although this may have allowed for less precision than if I had limited the SSI group
to only those who started receiving SSI in wave 10 (right after the second measurement point in
wave 9), my approach was necessary in order to have an adequately sized analytical sample.
Finally, the one year gap between waves 6 and 9 may have been too small. Especially given the
length of the disability determination process, it is likely that many eventual SSI recipients in my
sample would have already applied for benefits by the time of the first material hardship
measurement in wave 6. The finding that there were already large disparities in material hardship
prevalence between the comparison groups in wave 6 supports this idea, suggesting that there
could be a rise in material hardship that starts more than 16-24 months prior to SSI receipt. If
true, this would have made the results from my pre-entry difference-in-differences analyses more
conservative.

16
Discussion
Using cross-sectional data, I found mixed support for the idea that receipt of
Supplemental Security Income (SSI) benefits would be associated with elevated levels of health
and food-related material hardships. Before adjusting for covariates, SSI recipients experienced
greater food insecurity but were less likely to experience a lack of health insurance. However,
these results changed somewhat after adjusting for covariates. In the logistic models, SSI
recipients still experienced lower levels of all health-related hardships and greater levels of only
one of the food-related hardships.
In the unadjusted pre-entry analysis, the prevalence of virtually every hardship increased
for eventual SSI recipients more than they did for the eligible non-recipients. These differing
patterns were particularly apparent for food-related hardships (Figure R2). In the adjusted
models, there was still evidence that problems with health insurance and affording balanced
meals rose more for the eventual SSI recipients, but results for the other hardships were no
longer statistically significant.
The results regarding uninsurance were particularly interesting. In most states, SSI
receipt brings guaranteed Medicaid benefits. These Medicaid benefits are likely the primary
driver for the cross-sectional finding that, even when adjusting for covariates, SSI recipients are
significantly less likely than eligible non-recipients to live in households facing a lack of health
insurance. Combined with the finding that the prevalence of uninsurance was significantly higher
among eventual SSI recipients prior to program entry and that this disparity grew in the pre-entry
period (albeit with marginal statistical significance) suggests that uninsurance declines sharply
after SSI receipt. Also, Medicaid coverage for SSI recipients appears to be primarily replacing a
state of uninsurance rather than replacing other forms of coverage. It is therefore conceivable
that individuals seek SSI at least in part because of their need for health insurance. The idea that
worsening health and increasing health care needs may partially drive adults to seek Medicaid
via SSI is also consistent with previous findings that children with worse health status are more
likely to be enrolled in Medicaid (Lin et al., 2003).
This potential connection between SSI and health insurance status emphasizes the
importance of the linkage between SSI and Medicaid. The heightened medical needs of
individuals with disabilities means that the SSI program may be particularly important for their
health outcomes. Another important implication is that expanding Medicaid coverage may lead
to reduced SSI participation, if in fact at least some SSI beneficiaries seek SSI primarily because
of a need for health insurance. Further work comparing trends in SSI participation rates between
states that did and did not expand Medicaid coverage under the Affordable Care Act could yield
important insights in this regard.
Proposals from the new congress and presidential administration to reverse Medicaid
expansion, to reduce Medicaid funding in various ways, and to eliminate the SSI program for
children could have dramatic and lasting effects on low-income people with disabilities and the
US health care system (Congressional Budget Office, 2016; US House of Representatives
Committee on the Budget, 2017). If health crises among people with disabilities are a key driver
of their participation in SSI, then reductions in Medicaid coverage will likely heighten this need.
If, in turn, SSI benefits are cut or eliminated, large numbers of people with disabilities in the
midst of health crises may be left without any avenues to obtain health insurance. In addition to
the potentially devastating health and financial effects that this could have on these individuals
and their families, such a scenario would most likely also cause increased burdens on the health

17
care system. Hospitals will likely see large increases in the quantity and intensity of
unreimbursed emergency care that they have to provide, straining resources. The Medicaid and
SSI programs are thus not only critical to the health and well-being of individuals with
disabilities. They are also critical to the stability of the current health care delivery systems in the
United States.
Regarding food insecurity, the pre-entry and cross-sectional results support a conclusion
that food insecurity rises just before SSI receipt and that SSI benefits do not fully address this
elevated food insecurity. This result among adults is consistent with past cross-sectional results
focused on child SSI recipients (Rose-Jacobs et al., 2016), and it is particularly striking given
that SSI recipients are significantly more likely than non-recipients to receive Supplemental
Nutrition Assistance Program (SNAP) benefits (Trenkamp & Wiseman, 2007). Food insecurity
carries especially heightened health risks for vulnerable populations such as people with
disabilities (Coleman-Jensen & Nord, 2013; Perez-Zepeda et al., 2016). Even combined SSI,
Medicaid, and SNAP benefits do not appear to eliminate disparities in food insecurity between
SSI recipients and eligible non-recipients. Deeper examinations into the interrelations between
these programs are needed. Still, the present findings are strong evidence that the cash and food
assistance benefits of these programs should be increased. Under current benefit levels, the
health of people with disabilities receiving SSI will remain highly susceptible to the effects of
food insecurity. If enacted, current congressional proposals to reduce both the SSI and SNAP
programs would likely amplify this problem.

18
References
Alaimo, K., Briefel, R. R., Frongillo Jr., E. A., & Olson, C. M. (1998). Food insufficiency exists
in the United States: Results from the Third National Health and Nutrition Examination
Survey (NHANES III). American Journal of Public Health, 88(3), 416-426.
Ben-Shalom, Y., & Stapleton, D. (2014). National and state program participation rates of
working-age people with disabilities. Washington, DC: Mathematica Policy Research.
Retrieved February 21, 2016, from http://www.mathematica-
mpr.com/~/media/publications/pdfs/disability/program_participation_ratios.pdf
Brault, M. (2012). Americans with disabilities: 2010. Washington, DC: United States
Department of Commerce. Current Population Reports, P70-131. Retrieved February 21,
2016, from http://www.census.gov/prod/2012pubs/p70-131.pdf
Cohen, B., Ohls, J., Andrews, M., Ponza, M., Moreno, L., Zambrowski, A., & Cohen, R. (1999).
Food Stamp participants’ food security and nutrient availability: Final report.
Washington, DC: United States Department of Agriculture, Food and Nutrition Service.
Coleman-Jensen, A., & Nord, M. (2013). Food insecurity among households with working-age
adults with disabilities. Economic Research Report 144. Washington, DC: United States
Department of Agriculture. Retrieved from
http://ageconsearch.umn.edu/bitstream/142955/2/err_144.pdf
Congressional Budget Office. (2016). Eliminate Supplemental Security Income benefits for
disabled children. Washington, DC: Congressional Budget Office/ Retrieved from
https://www.cbo.gov/budget-options/2016/52183
Davies, P. S., Huynh, M., Newcomb, C., O’Leary, P., Rupp, K., and Sears, J. (2001). Modeling
SSI financial eligibility and simulating the effect of policy options. Social Security Bulletin,
64(2), 16-45.
Davies, P. S. (2003). SSI eligibility and participation among the oldest old: Evidence from the
AHEAD. Social Security Bulletin, 64(3), 38-63.
Gettens, J., Lei, P., & Henry, A. (2016). Accounting for geographic variation in DI and SSI
participation. Princeton, NJ: Mathematica Center for Studying Disability Policy.
Retrieved from https://www.mathematica-mpr.com/-
/media/publications/pdfs/disability/2016/drc-wp-geographic-variation.pdf
Heflin, C., Sandberg, J., & Rafail, P. (2009). The structure of material hardship in U.S.
households: An examination of the coherence behind common measures of well-being.
Social Problems, 56(4), 746-764.
Heflin, C. (2014). Family instability and the risk of material hardship. Focus 31(1), 7-9.
Herd, P., Schoeni, R. F., House, J. S. (2008). Upstream solutions: Does the Supplemental
Security Income program reduce disability in the elderly? The Milbank Quarterly, 86(1),
5-45.
Jensen, H. H.. (2002). Food insecurity and the Food Stamp Program. American Journal of
Agricultural Economics, 84(5), 1215-1228.
Kim, J., & Shaefer, H. L. (2015). Are household food expenditures responsive to entry into the
Supplemental Nutrition Assistance Program? Social Science Quarterly, 96(4), 1086-
1102.

19
Lin, C. J., Lave, J. R., Change, C. C., Marsh, G. M., LaVallee, C. P., & Jovanovic, Z. (2003).
Factors associated with Medicaid enrollment for low-income children in the United
States. Journal of Health & Social Policy, 16(3), 35-51.
Mabli J., & Ohls J. (2015). Supplemental Nutrition Assistance Program participation is
associated with an increase in household food security in a national evaluation. Journal of
Nutrition, 145(2), 344–351.
Mashaw, J. L., Perrin, J. M., & Reno, V. P (1996). Restructuring the SSI disability program for
children and adolescents: Report of the Committee on Childhood Disability of the
Disability Policy Panel. Washington, DC: National Academy of Social Insurance.
Retrieved February 21, 2016, from http://www.nasi.org/usr_doc/Restructuring_SSI.pdf
Moore, J. C. (2007). Seam bias in the 2004 SIPP panel: Much improved, but much bias still
remains. Washington, DC: United States Census Bureau. Retrieved February 21, 2016,
from https://psidonline.isr.umich.edu/Publications/Workshops/ehc-
07papers/Seam%20Bias%20in%20the%202004%20SIPP%20Panel.pdf
Nord, M., Golla, A. M. (2009). Does SNAP decrease food insecurity: untangling the self-
selection effect. Retrieved February 21, 2016, from
http://www.ers.usda.gov/media/184824/err85_1_.pdf
Parish, S. L., Ghosh, S., & Igdalsky, L. (2013). Hardship among low-income US families that
receive children’s Supplemental Security Income (SSI). Waltham, MA: Lurie Institute for
Disability Policy. Retrieved February 21, 2016, from
http://lurie.brandeis.edu/pdfs/SSI%20hardship%20pol%20brief%20final.pdf
Parish, S. L., Rose, R. A., Grinstein-Weiss, M., Richman, E. L., & Andrews, M. E. (2008).
Material hardship in U.S. families raising children with disabilities. Exceptional
Children, 75(1), 71-92.
Perez-Zepeda, M. U., Castrejon-Perez, R. C., Wynne-Bannister, E., & Garcia-Pena, C. (2016).
Frailty and food insecurity in older adults. Public Health Nutrition, 2, 1-6.
Ratcliffe, C., McKernan, S.-M., & Zhang, S. (2011). How much does the Supplemental Nutrition
Assistance Program reduce food insecurity? American Journal of Agricultural
Economics, 93(4), 1082-1098.
Ribar, D. C., & Hamrick, K. S. (2003). Dynamics of poverty and food sufficiency. Washington,
DC: United States Department of Agriculture, Food and Nutrition Research Report No.
36.
Rose-Jacobs, R., Goodhart Fiore, J., Ettinger de Cuba, S., Black, M., Cutts, D. B., Coleman, S.
M., et al. (2016). Children with special health care needs, Supplemental Security Income,
and food insecurity. Journal of Developmental and Behavioral Pediatrics, 37(2), 140-
147.
Shaefer, H. L., & Gutierrez, I. A. (2013). The Supplemental Nutrition Assistance Program and
material hardships among low-income households with children.
Survey of Income and Program Participation user guide. (2008). Washington, DC: US Census
Bureau. Retrieved February 21, 2016 from
http://www.census.gov/content/dam/Census/programs-
surveys/sipp/methodology/SIPP_USERS_Guide_Chapter8_2008.pdf

20
Wilde, P., & Nord, M. (2005). The effect of Food Stamps on food security: A panel data
approach. Review of Agricultural Economics 27(3), 425-432
United States Census Bureau. (n.d.). Survey of Income and Program Participation: Methodology.
Retrieved February 21, 2016, from http://www.census.gov/programs-
surveys/sipp/methodology/sampling.html
United States Department of Agriculture. (2015). Reaching those in need: Estimates of state
Supplemental Nutrition Assistance Program Participation Rates in 2012. Retrieved
February 21, 2016, from
http://www.fns.usda.gov/sites/default/files/ops/Reaching2012.pdf
United States Department of Agriculture. (2016). Supplemental Nutrition Assistance Program
(SNAP). Retrieved February 21, 2016, from http://www.fns.usda.gov/snap/supplemental-
nutrition-assistance-program-snap
United States House of Representatives Committee on the Budget. (2017). Fiscal year 2017
Budget. Washington, DC: United States House of Representatives Committee on the
Budget. Retrieved from http://budget.house.gov/fy2017/


![Council Policy - Financial Hardship Policy for Ratepayers · 2020-06-25 · 1 Council Policy Financial Hardship Policy for Ratepayers D20/27488[v2] 1. Title Financial Hardship Policy](https://img.dokumen.tips/doc/110x75/5f32eb42c78e59222a73ea4e/council-policy-financial-hardship-policy-for-ratepayers-2020-06-25-1-council.jpg)