Embed Size (px)
Citation preview

DEPRESSION AND ANXIETY 00:1–11 (2014)
Research ArticleCHALLENGING THE MYTH OF AN “EPIDEMIC” OFCOMMON MENTAL DISORDERS: TRENDS IN THE
GLOBAL PREVALENCE OF ANXIETY AND DEPRESSIONBETWEEN 1990 AND 2010
Amanda J. Baxter, M.P.H.,1,2∗ Kate M. Scott, Ph.D.,3 Alize J. Ferrari, B.Psy.Sc.,1,2 Rosana E. Norman, Ph.D.,1,4
Theo Vos, Ph.D.,1,5 and Harvey A. Whiteford, M.D.1,2
Background: Anxiety disorders and major depressive disorder (MDD) are com-mon and disabling mental disorders. This paper aims to test the hypothesis thatcommon mental disorders have become more prevalent over the past two decades.Methods: We conducted a systematic review of prevalence, remission, duration,and excess mortality studies for anxiety disorders and MDD and then used aBayesian meta-regression approach to estimate point prevalence for 1990, 2005,and 2010. We also conducted a post-hoc search for studies that used the Gen-eral Health Questionnaire (GHQ) as a measure of psychological distress andtested for trends to present a qualitative comparison of study findings Results:This study found no evidence for an increased prevalence of anxiety disorders orMDD. While the crude number of cases increased by 36%, this was explainedby population growth and changing age structures. Point prevalence of anxietydisorders was estimated at 3.8% (3.6–4.1%) in 1990 and 4.0% (3.7–4.2%) in2010. The prevalence of MDD was unchanged at 4.4% in 1990 (4.2–4.7%)and 2010 (4.1–4.7%). However, 8 of the 11 GHQ studies found a significantincrease in psychological distress over time. Conclusions: The perceived “epi-demic” of common mental disorders is most likely explained by the increasingnumbers of affected patients driven by increasing population sizes. Additionalfactors that may explain this perception include the higher rates of psychologicaldistress as measured using symptom checklists, greater public awareness, andthe use of terms such as anxiety and depression in a context where they do notrepresent clinical disorders. Depression and Anxiety 00:1–11, 2014. C© 2014Wiley Periodicals, Inc.
Key words: anxiety/anxiety disorders; depression; epidemiology; stress; mooddisorders; international; obesity; crossnational
1School of Population Health, University of Queensland, Her-ston, Australia2Queensland Centre for Mental Health Research, Wacol, Aus-tralia3Department of Psychological Medicine, University of Otago,Dunedin, New Zealand4Queensland Children’s Medical Research Institute, Universityof Queensland, Herston, Australia5Institute for Health Metrics and Evaluation, University ofWashington, Seattle, Washington
Contract grant sponsor: Queensland Department of Health; Con-tract grant sponsor: Bill and Melinda Gates Foundation.
∗Correspondence to: Amanda J. Baxter, School of PopulationHealth, University of Queensland, Herston Road, Herston, Queens-land 4002, Australia. E-mail: [email protected] for publication 15 October 2013; Revised 21 November2013; Accepted 28 November 2013
DOI 10.1002/da.22230Published online in Wiley Online Library(wileyonlinelibrary.com).
C© 2014 Wiley Periodicals, Inc.

2 Baxter et al.
INTRODUCTIONPopular perception paints our modern era as the “age ofanxiety and melancholy” with observers citing an alarm-ing rise in common mental disorders over the past threedecades.[1–6] If there is an increase in prevalence of clin-ical disorders, this is relevant to health care policy andplanning in view of the high burden associated with anx-iety and depressive disorders.[7]
Anxiety disorders and major depressive disorder(MDD) are common across the world,[8, 9] but the cur-rently available evidence supporting a rise in prevalenceis decidedly mixed. Some recent epidemiological stud-ies have yielded higher prevalence estimates than earlierstudies for anxiety disorders[10–13] and MDD[14] whileothers, such as the Dutch NEMSIS studies, report stableestimates over time.[15] However, variations in the waythat disorders are diagnosed make it difficult to interpretstudy findings. For instance, reported 12-month anxietydisorders in the United States rose from 13.3% in the1980–1985 the Epidemiological Area Catchment (ECA)study[16] to 17.2% in the 1990–1992 National Comor-bidity Survey (NCS) study[10] and 18.1% in the 2001–2003 NCS-R[11] study. When the clinical threshold forECA and NCS surveys were reconciled, however, differ-ences in prevalence between the two time periods dis-appeared (ECA: 12.7%; NCS: 12.1%).[17] Prevalence inMDD similarly rose in the later NCS and NCS-R studies(10.7 and 6.7%, respectively)[10, 11] compared with lowerrates found in the earlier ECA study (3.0%).[16] After theclinical threshold criteria were considered, the preva-lence harmonized somewhat but an increase in preva-lence remained between the ECA and the NCS study.[17]
In two comparative studies of common mental dis-orders in children,[18, 19] both reported lack of seculartrends in prevalence based on parental report, althoughone study did find a slight increase in self-reported de-pressive symptoms for 8-year-old girls.[18]
Reviews of the literature report increasing rates ofcommon mental disorders in China[20] and anxiety dis-orders in the United States.[1] Reviewers note that thisrise stems, at least in part, from variable diagnostic cat-egories, sampling methods (increased use of multistagerandom sampling), and survey administration (e.g., theuse of probe questions). The evidence for a secular trendin prevalence is further confounded by reporting of“mental disorders” based on symptom screening instru-ments as was the case in the latter review.[1] These resultscannot be interpreted as a rise in the prevalence of anxi-ety disorders, however, as symptom scales identify casesof psychological distress, the threshold of which is muchlower than for a mental disorder.
It has been postulated that an increased exposure topsychosocial stressors, such as rising urbanization, maylead to higher rates of mental disorders.[21] However,it is also possible that the perceived increase in com-mon mental disorders is explained by a rise in psy-chological distress, which can include feelings of exces-sive worry and unhappiness. Dimensional scales such as
symptom checklists like the General Health Question-naire (GHQ) provide measures of distress based on non-specific psychopathology. However the threshold for adiagnosis is only reached when an identified number ofsymptoms of sufficient severity or persistence are met.Inconsistent findings of increased mental health prob-lems may be explained by use of symptom checklists assome studies have found a trend for higher rates overtime.[22–24] These studies do not provide conclusive ev-idence for a rise in clinical disorders.
It is of concern that we do not know whether the globaldistribution of anxiety and depressive disorders is actu-ally changing as this is essential information for thosewho need to plan health services and funding allocation.The primary aim of this paper was to test our hypothesisthat anxiety disorders and MDD have not become moreprevalent in the past two decades once methodologicaldifferences in surveys were accounted for. We drew onprevalence models for anxiety disorders and MDD de-veloped to inform estimates for the Global Burden ofDisease study (GBD 2010) and present here the age-standardized current prevalence of anxiety disorders andMDD for 1990, 2005, and 2010. As our analysis showedthat the prevalence of common mental disorders has notincreased, we propose possible explanations for why theperception that it has prevails by testing for a seculartrend in GHQ scores.
METHODSOVERVIEW
For anxiety disorders and MDD, we calculated prevalence esti-mates using a Bayesian meta-regression approach that was designedto pool epidemiological data, adjusting for methodological differencesbetween studies. An internally consistent set of disease parameters(prevalence, incidence, remission, and mortality) were derived by cap-italizing on the the logical relationships between the different diseaseparameters: a prevalent case must have been an incident case at somepoint in time and prevalent cases only stop being so by getting better(remission) or dying (from the disease or from other causes). Informa-tive prior settings which are useful in establishing parameter rangeswere used where empirical data were poor.
Model-derived point prevalence was estimated for anxiety disor-ders and MDD defined as reaching the clinical threshold accordingto Diagnostic and Statistical Manual of Mental Disorders (DSM)[25]
or International Classification of Diseases: Classification of Mental andBehavioural Disorders (ICD)[26] diagnostic criteria. Anxiety disordersinclude generalized anxiety disorder (GAD; DSM-IV code: 300.02;ICD-10 code: F41.1); panic disorder and agoraphobia (300.01,300.21–300.22; F41.0); social phobia (300.23; F40.1,F93.2); specific phobia(300.29; F40.2,F93.1); obsessive–compulsive disorder (300.3; F42);posttraumatic stress disorder (PTSD; 309.81; F43.1); separation anx-iety disorder (309.21; F93.0); and anxiety disorders not otherwisespecified (NOS; 300.00; F41.2-F41.9). Given the high degree of co-occurrence between anxiety disorders, we defined a case as meetingcriteria for any of the specific anxiety conditions to avoid “doublecounting” those with more than one disorder. MDD (296.2, 296.3,311; F32–33) was modeled separately.
We also conducted a post-hoc search in Medline and GoogleScholar for supplementary information on evidence for secular changesin psychological distress. Our review included studies that used the
Depression and Anxiety
Research Article: Challenging Myths of a Mental Disorder Epidemic 3
GHQ survey to examine changes in scores over time within compara-ble populations.
EMPIRICAL DATA COLLECTIONWe drew upon systematic reviews of community-based studies that
reported epidemiological data for “total” or “all” anxiety disorders andMDD as defined by standard diagnostic criteria (the DSM or ICD).Reviews were conducted according to PRISMA guidelines,[27] and in-cluded searches of the peer-reviewed literature (1980–2009), nonin-dexed online databases, and consultation with mental health expertsand epidemiologists for additional information. Full details on thesereviews have been previously reported.[28,29] In brief, studies were in-cluded where samples were representative of the general community.Our review included studies conducted between 1980 and 2009, aswell as those identified through periodic re-assessment of the litera-ture and expert consultation. There were no limits placed on languageof publication, study sample size, or age of respondents.
Current (point or past month) or past-year prevalence were cap-tured, but lifetime prevalence was excluded as symptom recall is lessreliable the longer the recall period.[30] GBD 2010 criteria stipulatedthat remission be defined as no longer meeting clinical threshold. Es-timates were sought from longitudinal studies with naturalistic follow-up (i.e., no specific intervention during follow-up period) of at least2 years. Standardized mortality ratios or relative risk of mortality fromall causes were included.
In total, our review identified 22,423 possible data sources for anx-iety disorders and 35,579 potential sources for MDD. Of these ap-proximately 99% did not meet the inclusion criteria: 22,324 anxietydisorder papers were excluded and 35,441 MDD papers. The primaryreasons for noninclusion were use of nonrepresentative samples, epi-demiological estimates were not reported or only lifetime estimateswere available, or case definitions were not based on clinical diag-nostic thresholds. A recent overarching discussion paper looks at thisissue in greater depth.[31] After applying our review inclusion crite-ria, 91 prevalence studies for anxiety disorders[28] and 116 studies forMDD[29] were finally included. The studies identified in our reviewsvaried considerably, reflecting different methodologies and inconsis-tent grouping of age ranges and study periods (for more detail on searchresults see [28,29]). The most commonly used classificatory system usedwas the DSM. DSM diagnostic criteria were used in 74 of the anxietyprevalence studies and in 106 of the MDD studies (note that somestudies used both DSM and ICD criteria). A full list of prevalencestudies identified in our review and included in analyses is reportedin Supporting Information. Model input for excess mortality in MDDwas based on data from 11 studies. As evidence for excess all-causemortality across the anxiety disorders was limited and ambiguous,[28]
we decided to assume no excess mortality.Each study was coded for study year (the mid-point of data col-
lection), geographic coverage (e.g., national, regional, or communitylevel), and country. Countries were grouped into 21 world regionsbased on broad geographic regions and epidemiological contiguity.[32]
See http://www.globalburden.com.au/project-description for moreinformation on GBD 2010 world region classifications.
COVARIATESData were also extracted for study methods so that methodologi-
cal variables could be included to adjust for between-study variability.Information was collected for sampling method, sample size, responserate, population coverage, diagnostic criteria, diagnostic instrument,degree of training for person administering the survey, and prevalenceperiod. We also collected information on how studies defined the dis-order of interest, for example, in the case of anxiety disorders, this
included the specific types of anxiety disorders captured within totalanxiety estimates.
Higher rates for anxiety (particularly PTSD) and MDD have beenlinked with exposure to war and conflict. In the GBD2010 mortal-ity analyses, separate consideration was given to modeling mortal-ity “shocks” due to disasters and armed conflict using internationaldatabases on battle deaths during armed conflict and databases ondeaths due to natural disasters.[33] We used a current conflict covari-ate based on the natural log of mortality rates due to armed conflict.The postconflict covariate was calculated as the lagged natural log of thesame mortality rates within the past 10 years.
STATISTICAL ANALYSESWe used a generic disease modeling program, DisMod-MR that
was developed for deriving patterns of disease distribution in the GBD2010 study.[34] DisMod-MR builds a generalized negative binomialmodel[34] in two stages. It pools and reconciles epidemiological datadrawing on the generic relationship between epidemiological param-eters and addresses data heterogeneity using study-level covariates. Arandom effects approach was used to create region and country inter-cepts and fixed effects to develop age patterns. The input for anxietydisorders and MDD prevalence models comprised empirical data es-timates (prevalence, remission or duration, and excess mortality) andprior settings to inform the model where data were limited.
Priors were implemented by setting informative levels and rangeson age of onset and (for anxiety) trends in age patterns. While the di-agnostic criteria do not stipulate a minimum age for onset of anxietydisorders and MDD, it is difficult to diagnose these disorders in earlychildhood because discriminant validity of diagnoses in children is rela-tively poor.[35] So we set priors for lower bound values of prevalence at2 years of age for anxiety disorders and 3 years of age for MDD as thesewere the minimum age for our data points. There were limited dataamong the oldest ages for anxiety disorders, which meant there wasnot enough power to calculate consistent age patterns. Given that theliterature suggests prevalence of anxiety disorders decreases in olderages,[8] we included priors to suggest that prevalence did not increaseas a function of age after 75 years of age. The priors on coefficientsfor random and fixed effects were normalized to have a mean of zeroand standard deviation of one which meant that they were “weakly”informative, allowing the model to be largely data driven.
The inclusion of study-level covariates was guided by results ofprevious meta-analytic reviews that examined heterogeneity in preva-lence of anxiety[8] and MDD.[9] Covariates were dichotomized to markprevalence type (point prevalence vs. past-year prevalence), sample cover-age (national surveys as opposed to regional studies), survey instrument(fully structured vs. semistructured surveys), and clinical diagnosis (ad-ministration of instrument by clinician vs. lay interviewer). Diagnosticcriteria were explored as two covariates: DSM versus ICD, and morerecent diagnostic criteria (DSM-IV and ICD-10) versus older versions.Specific to anxiety disorders, we coded multiple covariates to test forthe effect of including (or excluding) specific disorders (e.g., anxiety-NOS, GAD, specific phobias) as well as the total number of specificdisorders captured. Comprehensiveness identified studies that capturedseven or more specific anxiety disorders as compared to those whichcaptured six or less.
Study covariates were implemented using fixed effects. Nestedrandom effects were included for region and country to capture unex-plained systematic variation besides the measurement error and study-level unexplained variation. Studies with data collected in 1997 andearlier contributed to the 1990 estimates, and data collected after 1997contributed to 2005 and 2010 estimates. Differences for each year werealso informed by country-level covariates that varied over time, for ex-ample, where populations transitioned from current to past conflictstatus within this period.[34]
Depression and Anxiety

4 Baxter et al.
To calculate uncertainty around final prevalence estimates DisMod-MR fitted a randomized Markov-Chain Monte Carlo algorithm[34] in-formed by error estimates from the empirical data input, estimated agepatterns, prior settings, regional and country patterns, and study andcountry covariates. For comparison of regional prevalence estimates,we used the direct standardization method and the 2001 standard pop-ulation proposed by WHO.[36]
GHQ STUDIESWe then conducted a post-hoc search for studies that used GHQ
surveys to examine secular trends in psychological distress.[22–24,37–43]
Our review identified 11 community-based studies: four from Scot-land, England, Greece, and Germany examining psychological distressin adolescents[24,37,41] and seven from the Netherlands,[42] UnitedKingdom,[38–40,44] Taiwan,[22] and Iran[23] focusing on adults. Yearsfor comparison fell between 1977 and 2010 with a mean study periodof 17.7 years (range: 12–20 years). Four versions of the GHQ wereidentified: the GHQ-12 was used in five studies, the GHQ-28 in threestudies, the GHQ-30 in two studies, and the Chinese GHQ (CHQ)once. More information on these studies can be found in SupportingInformation Table S3. In comparing the GHQ-12 with alternate ver-sions, the CHQ and the GHQ-28 include additional items markingsomatic symptoms (for instance feeling “run down and out of sorts,”“tightness or pressure in the head,” or palpitations) and the GHQ-30and CHQ include additional markers of social dysfunction.
RESULTSFINAL MODELS
The anxiety prevalence model for 1990 was informedby 36 prevalence studies and for 2005/2010 by 59 stud-ies. The final MDD model was informed by 70 preva-lence studies for the 1990 estimates and 74 studies for the2005/2010 estimates. No prevalence data were availableat any time point for four regions (Central Asia, An-dean Latin America, Oceania, and Central Sub-SaharanAfrica). Two regions provided anxiety prevalence datafor the earlier time period only: Latin America Southand the Caribbean; and in six regions (Asia-Pacific HighIncome, Asia East, Asia Southeast, East and Central Eu-rope, and West Sub-Saharan Africa) there was only dataavailable for the later period. For MDD, no data wereavailable for Asia Southeast or Europe Central for 1990estimates and all regions where prevalence studies werefound provided information for 2005/2010.
The final models included covariates that adjusted forprevalence type, nonnational samples, low response rates, useof symptom scales (for MDD only), and comprehensive-ness for inclusion of specific disorders (for anxiety dis-orders only). Covariates that identified anxiety disorderestimates that excluded specific disorders (e.g., Anxiety-NOS, GAD, and specific phobias) were not significantlyassociated with overall prevalence and hence were not in-cluded in the final model. Once adjustments were madefor these factors diagnostic criteria were not significantlyassociated with prevalence and were therefore excludedfrom the final models.
PREVALENCE OF ANXIETY DISORDERSOur model showed no evidence for a change in the
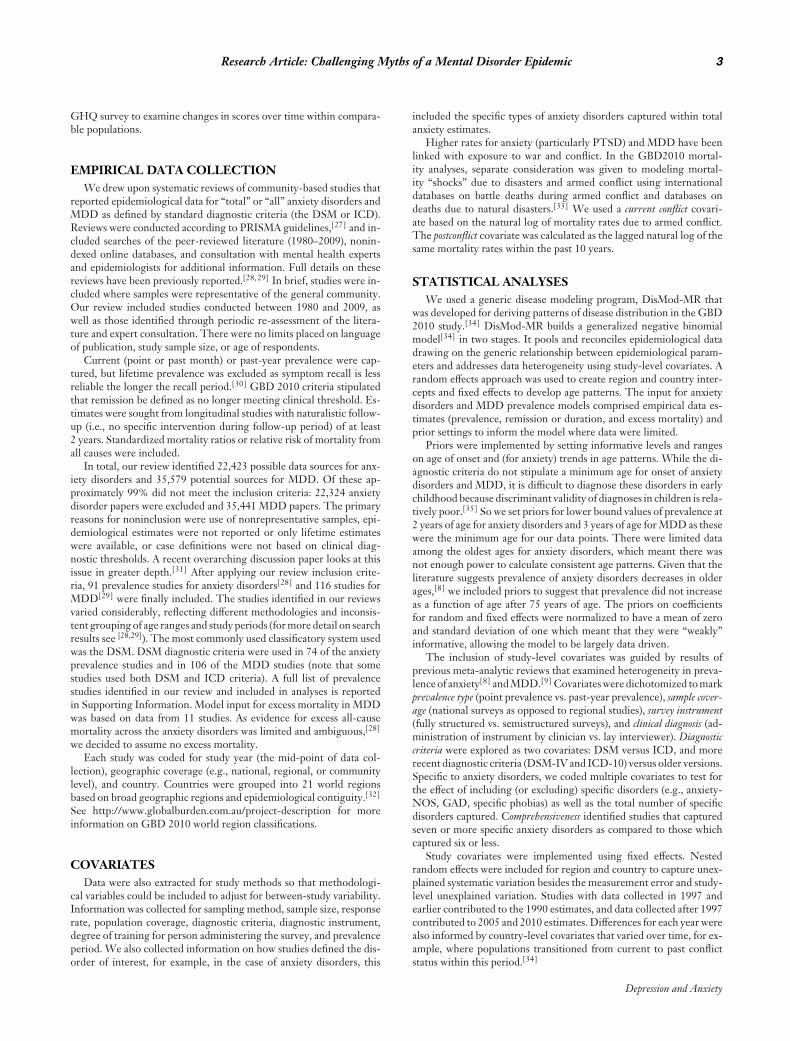
global prevalence of anxiety disorders over the past twodecades once methodological factors were taken intoaccount. Age-standardized point prevalence was 3.8%(3.6–4.1%) in 1990 and 4.0% (3.7–4.2%) in 2005 and2010. As expected, prevalence was higher in women thanin men with a female to male ratio of 1.9:1 which re-mained relatively constant across time. Prevalence rosesharply in adolescents, with the greatest proportion ofcases falling within adolescent and young adult agegroups (15–35 years). At global level, the lack of timetrend was consistent by gender and age group. The totalnumber of prevalent cases rose by 36% from 200.2 mil-lion cases in 1990 to 272.2 million cases in 2010. Thisis consistent with the increase in global population andchanging age structures over that period.
Table 1 shows that Asia East consistently had the low-est prevalence of anxiety for both males and females overthe 20-year period. The most noticeable change overtime was at the higher range of regional estimates. Be-tween 1990 and 2010, prevalence for females increasedminimally in North Africa/Middle East and dropped ap-proximately 1% in Central Sub-Saharan Africa and LatinAmerica South. In contrast, there was no observable re-gional change for males (see Table 1). Again, uncertaintyranges had substantial overlap indicating no evidence fora significant time difference.
Next, we assessed whether prevalence of disorders fol-lowed different trajectories by age range. In 1990, 2005,and 2010, we saw a similar age pattern with anxiety in-creasing substantially in childhood and adolescence topeak in the late teens and early adulthood (Fig. 1). Preva-lence was constant for age groups across the time period.
PREVALENCE OF MDDSimilar to results for anxiety disorders, the model of
MDD also found no evidence of a change in prevalencebetween 1990 and 2010. The age-standardized pointprevalence was 4.4% (4.2–4.7%) in 1990 and 4.4% (4.1–4.7%) in both 2005 and 2010. The number of prevalentcases increased by 37% from 218 million cases in 1990to 299 million cases in 2010, consistent with populationchanges. The higher proportion of cases occurred in fe-males (187 million cases). Sex differences were consistentacross time points.
Although there were considerable regional differencesin the prevalence of MDD, this too was consistent be-tween 1990 and 2010. North Africa/Middle East was theregion with the highest prevalence in both 1990 (7.3%[6.5–8.2%]) and 2010 (7.4% [6.5–8.2%]) while Asia-Pacific High Income had the lowest prevalence in both1990 (2.7% [2.2–3.2%]) and 2010 (2.5% [2.1–3.1%]; seeTable 1 and Fig. 2). Given the lack of data available fromthese regions, the wide and overlapping range of un-certainty around these estimates was not surprising andshould be taken into consideration when interpretingresults.
Depression and Anxiety

Research Article: Challenging Myths of a Mental Disorder Epidemic 5
TA
BL
E1.
Age
-sta
ndar
dize
dpo
int
prev
alen
ceof
anxi
ety
diso
rder
san
dm
ajor
depr
essi
vedi
sord
er,w
ith
95%
unce
rtai
nty
inte
rval
s(U
I),f
orm
ales
and
fem
ales
in19
90an
d20
10,b
yw
orld
regi
on
Anx
iety
diso
rder
sM
ajor
depr
essi
vedi
sord
erFe
mal
eM
ale
Fem
ale
Mal
e19
9020
1019
9020
1019
9020
1019
9020
10W
orld
regi
on%
(95%
UI)
%(9
5%U
I)%
(95%
UI)
%(9
5%U
I)%
(95%
UI)
%(9
5%U
I)%
(95%
UI)
%(9
5%U
I)
Asi
a,C
entr
al6.
1(3
.7–9
.7%
)6.
1(3
.6–1
0.0%
)4.
0(2
.5–6
.6%
)3.
9(2
.3–6
.0%
)6.
0(4
.9–7
.6%
)6.
1(4
.8–7
.8%
)3.
6(2
.8–4
.4%
)3.
6(2
.9–4
.6%
)A
sia,
Eas
t2.
8(2
.2–3
.4%
)2.
7(2
.2–3
.4%
)1.
5(1
.2–1
.8%
)1.
5(1
.2–1
.8%
)4.
1(3
.0–5
.3%
)3.
8(2
.8–4
.9%
)2.
4(1
.9–3
.1%
)2.
3(1
.7–2
.9%
)A
sia
Pac
ific,
HI
4.3
(3.6
–5.1
%)
4.3
(3.6
–5.0
%)
2.3
(1.9
–2.7
%)
2.4
(2.0
–2.8
%)
3.3
(2.5
–4.4
%)
3.2
(2.4
–4.1
%)
2.0
(1.5
–2.6
%)
1.9
(1.5
–2.5
%)
Asi
a,So
uth
5.2
(4.3
–6.4
%)
5.2
(4.2
–6.4
%)
2.9
(2.3
–3.5
%)
2.8
(2.3
–3.6
%)
5.2
(3.7
–7.1
%)
5.1
(3.7
–6.9
%)
3.1
(2.2
–4.3
%)
3.0
(2.2
–4.1
%)
Asi
a,So
uthe
ast
5.1
(3.0
–8.9
%)
4.7
(2.9
–7.8
%)
2.8
(1.7
–4.6
%)
2.5
(1.5
–4.0
%)
6.4
(5.1
–8.2
)6.
2(4
.9–7
.9%
)3.
8(3
.0–5
.0%
)3.
6(2
.8–4
.5%
)A
ustr
alas
ia7.
0(6
.2–7
.7%
)7.
1(6
.4–7
.9%
)3.
6(3
.3–4
.0%
)3.
7(3
.3–4
.1%
)4.
1(3
.3–5
.1)
4.2
(3.4
–5.2
%)
2.5
(2.0
–3.0
%)
2.5
(2.0
–3.0
%)
Car
ibbe
an6.
8(3
.9–1
1.3%
)6.
4(3
.6–1
1.1%
)4.
4(2
.5–7
.1%
)4.
1(2
.3–7
.0%
)6.
9(5
.2–9
.1)
6.5
(5.0
–8.4
%)
4.1
(3.2
–5.3
%)
3.8
(2.9
–4.9
%)
Eur
ope,
Cen
tral
7.6
(5.4
–11.
0%)
7.0
(4.8
–11.
1%)
4.1
(2.9
–5.8
%)
3.6
(2.6
–5.5
%)
5.9
(4.8
–7.3
%)
5.1
(4.1
–6.2
%)
3.5
(2.9
–4.3
%)
3.1
(2.5
–3.8
%)
Eur
ope,
Eas
t4.
3(2
.3–9
.0%
)4.
1(2
.0–7
.9%
)2.
3(1
.2–5
.0%
)2.
2(1
.1–4
.4%
)7.
7(5
.5–1
0.3%
)7.
2(5
.1–1
0.2%
)4.
5(3
.2–6
.4%
)4.
3(3
.1–6
.1%
)E
urop
e,W
est
6.5
(5.8
–7.2
%)
6.5
(5.9
–7.2
%)
3.4
(3.1
–3.8
%)
3.2
(2.9
–3.5
%)
5.6
(5.0
–6.3
%)
5.8
(5.2
–6.5
%)
3.4
(3.1
–3.8
%)
3.5
(3.1
–3.9
%)
Lat
inA
mer
ica,
And
ean
7.0
(3.2
–13.
4%)
6.9
(3.3
–13.
3%)
4.7
(2.0
–9.7
%)
4.6
(2.2
–9.0
%)
6.6
(4.7
–8.9
%)
5.7
(4.1
–8.0
%)
3.9
(2.8
–5.4
%)
3.4
(2.4
–4.7
%)
Lat
inA
mer
ica,
Cen
tral
5.7
(4.7
–7.1
%)
5.5
(4.5
–7.0
%)
3.1
(2.5
–3.9
%)
2.9
(2.4
–3.7
%)
6.2
(5.0
–7.6
%)
5.5
(4.4
–6.8
%)
3.8
(3.0
–4.6
%)
3.3
(2.6
–4.0
%)
Lat
inA
mer
ica,
Sout
h7.
8(3
.8–1
5.5%
)7.
1(3
.8–1
3.4%
)4.
2(2
.1–8
.5%
)3.
8(2
.0–7
.6%
)6.
0(4
.2–8
.5%
)5.
9(4
.1–8
.8%
)3.
6(2
.5–5
.2%
)3.
6(2
.5–5
.2%
)L
atin
Am
eric
a,T
ropi
cal
6.2
(5.6
–7.0
%)
6.3
(5.7
–7.0
1%)
3.5
(3.1
–3.9
%)
3.4
(3.1
–3.8
%)
6.5
(4.8
–8.7
%)
6.8
(4.9
–9.1
%)
3.8
(2.8
–5.1
%)
4.1
(3.0
–5.5
%)
Nor
thA
fric
a/M
iddl
eE
ast
7.7
(6.0
–10.
0%)
8.1
(6.5
–10.
6%)
4.1
(3.2
–5.3
%)
4.1
(3.2
–5.4
%)
9.2
(7.8
–10.
8%)
9.2
(7.9
–10.
8%)
5.5
(4.7
–6.5
%)
5.6
(4.8
–6.5
%)
Nor
thA
mer
ica,
HI
7.7
(6.8
–8.8
%)
7.5
(6.6
–8.6
%)
4.0
(3.5
–4.6
%)
4.0
(3.5
–4.5
%)
4.8
(3.8
–6.0
%)
5.6
(4.4
–6.9
%)
2.8
(2.3
–3.5
%)
3.3
(2.6
–4.1
%)
Oce
ania
5.3
(2.4
–10.
7%)
5.3
(2.3
–11.
6%)
3.5
(1.5
–7.1
%)
3.4
(1.5
–6.9
%)
5.8
(4.0
–8.1
%)
5.9
(4.0
–8.9
%)
3.5
(2.4
–4.8
%)
3.5
(2.4
–5.2
%)
Sub-
Saha
ran
Afr
ica,
Cen
tral
7.4
(3.5
–15.
4%)
6.7
(3.2
–13.
9%)
4.7
(2.3
–9.6
%)
4.5
(2.2
–8.8
%)
7.7
(5.5
–10.
5%)
7.1
(5.0
–9.8
%)
4.6
(3.2
–6.3
%)
4.2
(3.0
–5.9
%)
Sub-
Saha
ran
Afr
ica,
Eas
t7.
1(5
.5–9
.4%
)7.
0(5
.4–9
.2%
)3.
9(3
.0–5
.2%
)3.
8(2
.9–5
.1%
)6.
9(5
.8–8
.3%
)6.
8(5
.7–8
.0%
)4.
1(3
.4–4
.8%
)4.
0(3
.4–4
.7%
)Su
b-Sa
hara
nA
fric
a,So
uth
5.2
(4.3
–6.3
%)
5.3
(4.3
–6.4
%)
2.9
(2.3
–3.5
%)
2.9
(2.4
–3.6
%)
6.3
(4.6
–8.6
%)
6.3
(4.6
–8.6
%)
3.7
(2.8
–5.2
%)
3.7
(2.7
–5.0
%)
Sub-
Saha
ran
Afr
ica,
Wes
t5.
1(4
.2–6
.2%
)5.
2(4
.3–6
.4%
)2.
7(2
.2–3
.3%
)2.
8(2
.3–3
.4%
)6.
1(5
.1–7
.2%
)5.
3(4
.4–6
.2%
)3.
6(3
.1–4
.3%
)3.
1(2
.6–3
.7%
)W
orld
5.2
(4.8
–5.7
%)
5.2
(4.8
–5.7
%)
2.8
(2.6
–3.0
%)
2.8
(2.6
–3.0
%)
5.6
(5.1
–6.0
)5.
5(5
.0–6
.0%
)3.
3(3
.0–3
.6%
)3.
3(3
.0–3
.6%
)
Depression and Anxiety

6 Baxter et al.
0%
2%
4%
6%
8%
10%
12%
Nor
th A
fric
a/M
iddl
e Ea
st
Nor
th A
mer
ica,
HI
La�n
Am
eric
a, A
ndea
n
Sub-
saha
ran
Afric
a, C
entr
al
La�n
Am
eric
a, S
outh
Sub-
saha
ran
Afric
a, E
ast
Aust
rala
sia
Euro
pe, C
entr
al
Carib
bean
Asia
, Cen
tral
La�n
Am
eric
a, T
ropi
cal
Euro
pe, W
est
Oce
ania
La�n
Am
eric
a, C
entr
al
Sub-
saha
ran
Afric
a, S
outh
Sub-
saha
ran
Afric
a, W
est
Asia
, Sou
th
Asia
, Sou
thea
st
Asia
Pac
ific,
HI
Euro
pe, E
ast
Asia
, Eas
t
Prev
alen
ce o
f anx
iety
diso
rder
s (%
)
1990
2005
2010
0%
1%
2%
3%
4%
5%
6%
7%
8%
0
01-
04
05-
09
10-
14
15-
19
20-
24
25-
34
35-
44
45-
54
55-
64
65-
74
75-
84
85+
Prev
alen
ce o
f anx
iety
diso
rder
s (%
)
1990 female
2005 female
2010 female
1990 male
2005 male
2010 male
Figure 1. Estimated point prevalence of anxiety disorders in 1990, 2005, and 2010 by world region and by age range.
Figure 2 shows that the age patterns for MDD in2010 mirrored those of previous years with males andfemales following a similar trajectory across the lifespan.As with anxiety disorders, prevalence increased rapidlyin childhood and adolescence; however, peak prevalenceoccurred later in adulthood and a secondary peak is ap-parent in older age groups.
PREVALENCE OF PSYCHOLOGICAL DISTRESSEight of the 11 GHQ studies found a significant in-
crease in levels of psychological distress over time. Allstudies in which the GHQ-30, GHQ-28, or CHQ wereused found evidence for increased prevalence (Fig. 3). Ofthe five studies based on the GHQ-12, only two foundan increasing time trend for psychological distress andthis finding applied to female adolescents but not maleadolescents.[37, 41] Figure 3 shows the change in GHQscores over time by survey version.
DISCUSSIONPREVALENCE OF COMMON MENTALDISORDERS
This study, carried out as part of the epidemiologicalmodeling for GBD 2010, found no evidence for increas-ing prevalence of anxiety or depressive disorders between1990 and 2010, challenging the widely held popular per-ception of a modern epidemic of mental disorders. Whileprevalence rose slightly in regions known to be affectedby conflict, the differences were minor and did not af-fect the global prevalence estimate. A post-hoc analysisof GHQ studies, however, seems to indicate a significantincrease in levels of psychological distress over time.
It has been hypothesized that common mental dis-orders may be increasing due to psychosocial stressorssuch as rising urbanization, which has been linkedto mental health problems through higher rates ofsocial and income inequality, occupational stress, andunemployment.[21] This proposition suggests that
Depression and Anxiety

Research Article: Challenging Myths of a Mental Disorder Epidemic 7
0%
2%
4%
6%
8%
10%
12%
Nor
th A
fric
a/M
iddl
e Ea
st
Euro
pe, E
ast
Sub-
saha
ran
Afric
a, C
entr
al
La�n
Am
eric
a, T
ropi
cal
Sub-
saha
ran
Afric
a, E
ast
Carib
bean
Sub-
saha
ran
Afric
a, S
outh
Asia
, Cen
tral
Asia
, Sou
thea
st
La�n
Am
eric
a, S
outh
Oce
ania
Euro
pe, W
est
La�n
Am
eric
a, A
ndea
n
Nor
th A
mer
ica,
HI
La�n
Am
eric
a, C
entr
al
Sub-
saha
ran
Afric
a, W
est
Euro
pe, C
entr
al
Asia
, Sou
th
Aust
rala
sia
Asia
, Eas
t
Asia
Pac
ific,
HI
Prev
alen
ce o
f MDD
(%)
1990
2005
2010
0%
1%
2%
3%
4%
5%
6%
7%
8%
0
01-
04
05-
09
10-
14
15-
19
20-
24
25-
34
35-
44
45-
54
55-
64
65-
74
75-
84
85+
Prev
alen
ce o
f MDD
(%)
1990 female
2005 female
2010 female
1990 male
2005 male
2010 male
Figure 2. Estimated point prevalence of major depressive disorders in 1990, 2005, and 2010 by world region and by age range.
populations which have experienced a substantial ruralto urban population shift should reflect increasingrates of anxiety and MDD. Yet our analyses foundstable prevalence rates in, for example, Asia East,
where the urban population of mainland China in-creased from 25 to 40% between 1990 and 2005(http://siteresources.worldbank.org/DATASTATISTICS/Resources/table3_10.pdf). There is inconsistent
Figure 3. Changes in prevalence of psychological distress based on the General Health Questionnaire (GHQ), by study and by differentversions of the GHQ.
Depression and Anxiety

8 Baxter et al.
evidence for higher urban rates of anxiety and MDD[45]
while in contrast there appears a more consistent corre-lation between urban living and rural–urban migrationand sub-threshold symptomatology such as stressreactions and psychological distress.[46, 47] Anotherexplanation for the lack of increase in prevalence overtime may be that, while some risk factors for mentaldisorders have increased (e.g., relationship breakdowns)others have been mitigated to some degree, such asimproved living standards leading to, for instance,higher rates of education[48] and lower levels of illnessdue to communicable disease and malnutrition.[49]
WHY THE PERCEPTION OF A MODERN AGE OFANXIETY AND DEPRESSION?
We propose three explanations for the perceived in-crease in common mental disorders. One possible ex-planation is the misperception of psychological dis-tress, measured using symptom screening scales suchas the GHQ, as mental disorders. Evidence suggeststhat measures of psychological distress are increasing,particularly where surveys include questions on so-matic symptoms.[22–24] Of 10 GHQ studies that examinechanges in psychological distress within our data collec-tion timeframe (1980–2009),[22–24, 37, 38, 40–42, 44] four in-cluded additional items marking somatic symptoms (forinstance, feeling “run down and out of sorts,” “tightnessor pressure in the head,” or palpitations) and in all ofthese studies measures of distress increased significantlyover time for both adolescent[24] and adult samples.[22, 23]
Poor psychosocial health is strongly linked with self-reported ill health and longstanding illnesses.[39] Re-search shows that items in the GHQ reflecting somaticsymptoms nonspecific to psychological problems havea high sensitivity.[50] Therefore, it is possible that highGHQ-28 and CHQ scores mark individuals with phys-ical conditions that are increasing in prevalence, for in-stance cardiovascular disease and diabetes, in addition tothose with common mental disorders.
Higher scores over time on symptom scales mayalso reflect changing lifestyle factors which lead togreater levels of fatigue. Technological advancementshave led to lifestyle changes associated with shortersleep duration[51] particularly in females,[52] reducedphysical activity,[53] and higher rates of obesity.[54, 55]
These factors are correlated in a bidirectional relation-ship with fatigue,[56, 57] which increases likelihood of en-dorsement for somatic items.[58] Sleep disturbance,[59]
physical inactivity,[53] and weight gain[60, 61] have alsobeen associated with symptoms of anxiety and depres-sive disorders, however a direct causal relationship is farfrom clear as these constitute diagnostic criteria for anx-iety (PTSD and GAD) and MDD[62] and are often con-sidered outcomes rather than risk factors.
The misinterpretation of a secular trend in levels ofpsychological distress as reflecting an increase in com-mon mental disorders is exacerbated when studies re-port nonclinical outcomes using terminology associated
with clinical disorders. In academic publications, includ-ing those described above, cases of psychological distresshave been described as anxiety,[1] mental disorders,[22, 23]
and psychiatric disorders.[42] The mass media generatesfurther confusion through linking research on emotionalstates (such as stress), psychological distress (based onsymptom checklists), and clinically diagnosed disordersas if referring to the same entity (see examples[5,6]). Giventhe interchangeable use of terminology in mental healthlexicon, it is understandable that the community under-standing of patterns in common mental disorders hasbecome skewed.
A final factor that is likely contributing to theperceived mental health crisis is increased communityawareness of anxiety and MDD. Individuals are nowmore likely to report symptoms of common mentaldisorders than they have in past decades.[14, 63] Further-more, there is increased media focus on mental healthproblems: the average number of newspaper articles withtitles that feature “anxiety,” “depression,” or “mentaldisorders” rose by 88% from the 1980s to 2000s. Inter-estingly, this appears to be an international phenomenonrather than confined to Western societies as the numberof reports from India increased by 167% in comparisonto an increase of 100% in the United Kingdom and80% in the United States (see Supporting Informationfor further detail). Using a Google Trends search(http://www.google.com/trends/?hl=en), we found9.7 million blog homepages devoted to depressionand 4.4 million homepages for anxiety disorders.Increasingly common usage of terms such as anxietyand depression in the mass media and on social net-working sites may be another factor contributing to theperception of higher rates of disorders.
STUDY STRENGTHS AND LIMITATIONSThis study is unique in that it reports age-standardized
prevalence of anxiety disorders and MDD reachingdiagnostic thresholds, across a 20-year period, basedon a comprehensive body of empirical and clinicalevidence. Our findings confirm those of populationsurveys,[14, 63–66] which have reported stable rates of dis-orders over the past two decades. Previous contradic-tory survey[12] and literature review findings[1, 20] of timetrends for common mental disorders were largely basedon comparison of studies with varying disorder defini-tions and study designs. In contrast, our models werebased on a diverse range of data sources where synthesisof multiple data sources and inclusion of study covariatesreduced the likelihood of systematic bias.
Many studies have found an inverse relationship be-tween age and prevalence for anxiety[18, 23, 24] and depres-sive disorders[25, 26] raising the suggestion of a cohort ef-fect. However, these prior findings could be interpretedas either a cohort effect or an age effect. This paper’sfindings are consistent with the interpretation of the re-lationship as an age effect.
Depression and Anxiety

Research Article: Challenging Myths of a Mental Disorder Epidemic 9
Although these findings seem to be relatively consis-tent, they should be interpreted in light of a number oflimitations of our analysis. It should be acknowledgedthat there were regions for which no data were avail-able in either time period (specifically Central Asia, An-dean Latin America, Oceania, and Central Sub-SaharanAfrica) and regions for which data were available in onlyone time period, for instance Central Europe and South-east Asia. While our analyses to derive estimates for theseregions drew on data from comparable populations, it ispossible that there may have been secular trends in preva-lence within specific regions that our model was unableto detect.
Moreover it is possible that some studies reflected bi-ased population samples, for example, those in conflict-affected countries may oversample groups exposed togreater levels of violence. While we found that MDDwas more common in current conflict populations andanxiety disorders more common in postconflict popula-tions, a national mental health survey in Israel[67] foundrelatively low levels of mental disorders in comparisonto nonconflict countries such as the United States.[11]
Region-specific prevalence estimates and the effect ofconflict on population prevalence should therefore beinterpreted within this context.
Furthermore, the models reported here do not capturethe possibility of changes in prevalence over shorter timeperiods, for instance between our time points 1990 and2005, or for earlier epochs. There is mixed evidence foran increase in anxiety and MDD prior to 1990, espe-cially for the post-Second World War period (1950s–1970s).[2, 68] We specifically focused on data from 1980onward as classifications became more standardized withthe introduction of diagnostic criteria in the 1980 editionof the DSM.[62]
CONCLUSIONResults of this study showed no change in the preva-
lence of anxiety disorders and MDD over the past twodecades, challenging the myth that modern society facesa global epidemic of common mental disorders. Whilethese findings should be interpreted cautiously in view ofthe heterogeneity between studies which makes it diffi-cult to detect changes over time, they do confirm resultsof the few studies which report comparable estimatesover time in the same population, failing to detect anytime trend.
A criticism of modern psychiatry is that of medicaliz-ing aspects of normal human experience.[69] This wouldinclude lowering the threshold for anxiety and depressivedisorders to include psychological distress which maywell be increasingly common. Our findings argue that,when clear diagnostic criteria are applied, there is noevidence that the prevalence of common mental disor-ders is increasing. Despite the lack of a secular trend inprevalence of common mental disorders, it remains clearthat these disorders are important contributors to bur-
den of disease in all parts of the world[7] while availabletreatment options are underutilized.
Acknowledgments. A.J.B. and A.J.F. are employedby the Queensland Centre for Mental Health Research,which receives core funding from the Queensland De-partment of Health. At the time of analyses, R.E.N.and T.V. were part of the Centre for Burden of Dis-ease and Cost-Effectiveness (BoDCE), which receivedsome funding for the Global Burden of Disease Study(GBD 2010) from the Bill and Melinda Gates Founda-tion. H.A.W., R.E.N., T.V., and K.S. are employed bytheir respective universities. No funding bodies had anyrole in study design, data collection and analysis, decisionto publish, or preparation of the manuscript.
Conflict of interest. The authors have declared thatno competing interests exist.
Ethics statement. No ethics approvals were requiredfor this study.
REFERENCES1. Twenge JM. The age of anxiety? The birth cohort change
in anxiety and neuroticism, 1952–1993. J Pers Soc Psychol2000;79(6):1007–1021.
2. Hagnell O, Lanke J, Rorsman B, Ojesjo L. Are we entering an ageof melancholy? Depressive illnesses in a prospective epidemiolog-ical study over 25 years: the Lundby Study, Sweden. Psychol Med1982;12(2):279–289.
3. Kramer M. The increasing prevalence of mental disorders: a pan-demic threat. Psychiatr Q 1983;55(2–3):115–143.
4. Culliton G. Anxiety Disorders: A Modern Problem. Ireland: IrishMedical Times; 2008.
5. Morris N. Suicide and Depression on Rise Across UK. The Inde-pendent. London, UK; 2010.
6. Fynes-Clinton J. Stress Will Take Its Toll. The Courier-Mail.Brisbane, Australia; 2012.
7. Whiteford HA, Degenhardt L, Rehm J, et al. Global burden ofdisease attributable to mental and substance use disorders: find-ings from the Global Burden of Disease Study 2010. Lancet2013;382(9904):1575–1586.
8. Baxter AJ, Scott KM, Vos T, Whiteford HA. Global prevalence ofanxiety disorders: a systematic review and meta-regression. Psy-chol Med 2013;43(5):897–910.
9. Ferrari AJ, Somerville AJ, Baxter AJ, et al. Global variation inthe prevalence and incidence of major depressive disorder: a sys-tematic review of the epidemiological literature. Psychol Med2013;43(3):471–481.
10. Kessler RC, McGonable KA, Zao S, et al. Lifetime and 12-monthprevalence of DSM-III-R psychiatric disorders in the UnitedStates; results from the National Comorbidity Survey. Arch GenPsychiatry 1994;51(1):8–19.
11. Kessler RC, Chiu WT, Demler O, Walters EE. Prevalence,severity, and comorbidity of 12-month DSM-IV disorders in theNational Comorbidity Survey Replication. Arch Gen Psychiatry2005;62:617–627.
12. McEvoy PM, Grove R, Slade T. Epidemiology of anxiety dis-orders in the Australian general population: findings of the 2007Australian National Survey of Mental Health and Wellbeing. AustN Z J Psychiatry 2011;45(11):957–967.
Depression and Anxiety

10 Baxter et al.
13. WMHS Consortium. Unpublished data provided by the WorldMental Health Survey (WMHS) Consortium, December 2008.Available at: http://www.hcp.med.harvard.edu/wmh.
14. Kovess-Masfety V, Briffault X, Sapinho D. Prevalence, risk fac-tors, and use of health care in depression: a survey in a large regionof France between 1991 and 2005. Prevalence, facteurs de risque etutilisation des soins de sante dans la depression : une enquete dansune vaste region de France, entre 1991 et 2005. 2009;54(10):701–709.
15. de Graaf R, ten Have M, van Gool C, van Dorsselaer S. Prevalenceof mental disorders and trends from 1996 to 2009. Results fromthe Netherlands Mental Health Survey and Incidence Study-2.Soc Psychiatry Psychiatr Epidemiol 2012;47(2):203–213.
16. Regier DA, Boyd JH, Burke JD, Jr., et al. One-month prevalence ofmental disorders in the United States. Based on five EpidemiologicCatchment Area sites. Arch Gen Psychiatry 1988;45(11):977–986.
17. Narrow WE, Rae DS, Robins LN, Regier DA. Revised prevalenceestimates of mental disorders in the United States: using a clinicalsignificance criterion to reconcile 2 surveys’ estimates. Arch GenPsychiatry 2002;59(2):115–123.
18. Sourander A, Niemela S, Santalahti P, et al. Changes in psychi-atric problems and service use among 8-year-old children: a 16-year population-based time-trend study. J Am Acad Child AdolescPsychiatry 2008;47(3):317–327.
19. Tick NT, van der Ende JAN, Koot HM, Verhulst FC. 14-Yearchanges in emotional and behavioral problems of very young dutchchildren. J Am Acad Child Adolesc Psychiatry 2007;46(10):1333–1340.
20. Guo WJ, Tsang A, Li T, Lee S. Psychiatric epidemiological sur-veys in China 1960–2010: how real is the increase of mental dis-orders? Curr Opin Psychiatry 2011;24(4):324–330.
21. Bhat MA, Rather TA. Socio-economic factors and mental health ofyoung people in India and China: an elusive link with globalization.Asian Soc Work Policy Rev 2012;6(1):1–22.
22. Fu TS-T, Lee C-S, Gunnell D, et al. Changing trends in the preva-lence of common mental disorders in Taiwan: a 20-year repeatedcross-sectional survey. Lancet 2012;381(9862):235–241.
23. Noorbala AA, Bagheri YSA, Hafezi M. Trends in change of mentalhealth status in the population of Tehran between 1998 and 2007.Arch Iran Med 2012;15(4):201–204.
24. Fichter MM, Xepapadakos F, Quadflieg N, et al. A comparativestudy of psychopathology in Greek adolescents in Germany andin Greece in 1980 and 1998—18 years apart. Eur Arch PsychiatryClin Neurosci 2004;254(1):27–35.
25. American Psychiatric Association. Diagnostic and Statistical Man-ual of Mental Disorders (DSM-IV-TR). Washington, DC: Amer-ican Psychiatric Association; 2000.
26. World Health Organisation. International Classification of Im-pairment, Disability and Handicap. Geneva, Switzerland: WorldHealth Organisation; 1980.
27. Liberati A, Altman DG, Tetzlaff J, et al. The PRISMA statementfor reporting systematic reviews and meta-analyses of studies thatevaluate health care interventions: explanation and elaboration.PLoS Med 2009;6(7):1–28.
28. Baxter AJ, Vos T, Scott KM, et al. The regional distribution ofanxiety disorders: implications for the Global Burden of DiseaseStudy, 2010. Int J Methods Psychiatr Res 2014. In press.
29. Ferrari AJ, Charlson FJ, Norman RE, et al. The epidemiologicalmodelling of major depressive disorder: application for the globalburden of disease study 2010. PLoS One 2013;8(7):e69637.
30. Kruijshaar ME, Barendregt J, Vos T, et al. Lifetime prevalenceestimates of major depression: an indirect estimation method anda quantification of recall bias. Eur J Epidemiol 2005;20:103–111.
31. Baxter AJ, Patton G, Degenhardt L, et al. Global epidemi-
ology of mental disorders: what are we missing? PLoS One2013;8(6):e65514.
32. Murray CJL, Ezzati M, Flaxman AD, et al. GBD 2010: design,definitions, and metrics. Lancet 2012;380(9859):2063–2066.
33. Wang H, Dwyer-Lindgren L, Lofgren KT, et al. Age-specific andsex-specific mortality in 187 countries, 1970–2010: a systematicanalysis for the Global Burden of Disease Study 2010. Lancet2012;380(9859):2071–2094.
34. Vos T, Flaxman AD, Naghavi M, et al. Years lived with disability(YLDs) for 1160 sequelae of 289 diseases and injuries 1990–2010:a systematic analysis for the Global Burden of Disease Study 2010.Lancet 2012;380(9859):2163–2196.
35. Schniering CA, Hudsona JL, Rapeea RM. Issues in the diagnosisand assessment of anxiety disorders in children and adolescents.Clin Psychol Rev 2000;20(4):453–478.
36. Ahmad O, Boschi-Pinto C, Lopez A, et al. Age standardization ofrates: a new WHO standard. Geneva, Switzerland: World HealthOrganization; 2001.
37. West P, Sweeting H. Fifteen, female and stressed: changing pat-terns of psychological distress over time. J Child Psychol Psychi-atry 2003;44(3):399–411.
38. Corbett J, Given L, Gray L, et al. The Scottish Health Survey2008. Edinburgh, UK: Scottish Government; 2009.
39. Aresu M, Chaudhury M, Diment E, et al. Health Survey for Eng-land, 2009. In: Craig R, Hirani V, editors, Joint Health Sur-veys Unit: National Centre for Social Research Department ofEpidemiology and Public Health. London, UK: UCL MedicalSchool; 2010.
40. Blake M, Chaudhury M, Deverill C, et al. Health Survey for Eng-land 2003: a survey carried out on behalf of the Department ofHealth. In: Sproston K, Primatesta P, editors, Joint Health Sur-veys Unit: National Centre for Social Research Department ofEpidemiology and Public Health. London, UK: Stationery Of-fice; 2004.
41. Collishaw S, Maughan B, Natarajan L, Pickles A. Trends in ado-lescent emotional problems in England: a comparison of twonational cohorts twenty years apart. J Child Psychol Psychiatry2010;51(8):885–894.
42. Hodiamont PPG, Rijnders CAT, Mulder J, Furer JW. Psychi-atric disorders in a Dutch Health Area: a repeated cross-sectionalsurvey. J Affect Disord 2005;84(1):77–83.
43. Lewis G, Wilkinson G. Another British disease? A recent increasein the prevalence of psychiatric morbidity. J Epidemiol Commu-nity Health 1993;47(5):358–361.
44. Jokela M, Batty GD, Kivimaki M. Ageing and the preva-lence and treatment of mental health problems. Psychol Med2013;43(10):2037–2045.
45. Judd FK, Jackson HJ, Komiti A, et al. High prevalence disor-ders in urban and rural communities. Aust N Z J Psychiatry2002;36(1):104–113.
46. Lederbogen F, Kirsch P, Haddad L, et al. City living and urbanupbringing affect neural social stress processing in humans. Nature2011;474(7352):498–501.
47. Mair C, Roux AVD, Galea S. Are neighbourhood characteristicsassociated with depressive symptoms? A review of evidence. J Epi-demiol Community Health 2008;62(11):940–946.
48. Bank W. World Development Indicators 2013. Washington, DC:World Bank; 2013.
49. Murray CJL, Vos T, Lozano R, et al. Disability-adjusted life years(DALYs) for 291 diseases and injuries in 21 regions, 1990–2010: asystematic analysis for the Global Burden of Disease Study 2010.Lancet 2012;380(9859):2197–2223.
50. Willmott S, Boardman J, Henshaw C, Jones P. The pre-dictive power and psychometric properties of the General
Depression and Anxiety

Research Article: Challenging Myths of a Mental Disorder Epidemic 11
Health Questionnaire (GHQ-28). J Ment Health 2008;17(4):435–442.
51. Iglowstein I, Jenni OG, Molinari L, Largo RH. Sleep durationfrom infancy to adolescence: reference values and generationaltrends. Pediatrics 2003;111(2):302–307.
52. Santos-Silva R, Bittencourt LRA, Pires MLN, et al. Increasingtrends of sleep complaints in the city of Sao Paulo, Brazil. SleepMed 2010;11(6):520–524.
53. Nelson MC, Neumark-Stzainer D, Hannan PJ, et al. Longitudi-nal and secular trends in physical activity and sedentary behaviorduring adolescence. Pediatrics 2006;118(6):e1627–e1634.
54. Berg C, Rosengren A, Aires N, et al. Trends in overweight andobesity from 1985 to 2002 in Goteborg, West Sweden. Int J ObesRelat Metab Disord 2005;29(8):916–924.
55. Bell AC, Ge K, Popkin BM. The road to obesity or the path toprevention: motorized transportation and obesity in China. ObesRes 2002;10(4):277–283.
56. Yamada T, Demura S. Influence of exercise habits and physicalfitness level on subjective fatigue symptoms in adolescents. HumPerform Meas 2012;9:1–8.
57. Resnick HE, Carter EA, Aloia M, Phillips B. Cross-sectional rela-tionship of reported fatigue to obesity, diet, and physical activity:results from the third national health and nutrition examinationsurvey. J Clin Sleep Med 2006;2(2):163–169.
58. Schroevers MJ, Sanderman R, van Sonderen E, Ranchor AV. Theevaluation of the Center for Epidemiologic Studies Depression(CES-D) scale: depressed and positive affect in cancer patients andhealthy reference subjects. Qual Life Res 2000;9(9):1015–1029.
59. Mancuso CA, Rincon M, Sayles W, Paget SA. Psychosocialvariables and fatigue: a longitudinal study comparing individu-als with rheumatoid arthritis and healthy controls. J Rheumatol2006;33(8):1496–1502.
60. Scott KM, Bruffaerts R, Simon GE, et al. Obesity and mental
disorders in the general population: results from the World MentalHealth Surveys. Int J Obes 2008;32:192–200.
61. Scott KM, McGee MA, Wells JE, Oakley-Browne MA. Obesityand mental disorders in the adult general population. J PsychosomRes 2008;64:97–105.
62. American Psychiatric Association. Diagnostic and Statistical Man-ual of Mental Disorders (DSM-III). Washington, DC: AmericanPsychiatric Association; 1980.
63. Murphy JM, Laird NM, Monson RR, et al. A 40-year perspectiveon the prevalence of depression: The Stirling County Study. ArchGen Psychiatry 2000;57(3):209–215.
64. Kessler RC, Demler O, Frank RG, et al. Prevalence andtreatment of mental disorders, 1990 to 2003. N Engl J Med2005;352(24):2515–2523.
65. de Graaf R, ten Have M, van Gool C, van Dorsselaer S. Preva-lence of mental disorders and trends from 1996 to 2009. Re-sults from the Netherlands Mental Health Survey and Inci-dence Study-2. Soc Psychiatry Psychiatr Epidemiol 2012;47:203–213.
66. Richter D, Berger K. Are mental disorders increasing? Update ofa systematic review on repeated cross-sectional studies. PsychiatrPrax 2013;40:176–182.
67. Farbstein I, Mansbach-Kleinfeld I, Levinson D, et al. Prevalenceand correlates of mental disorders in Israeli adolescents: resultsfrom a national mental health survey. J Child Psychol Psychiatry2010;51(5):630–639.
68. Murphy JM, Sobol AM, Neff RK, et al. Stability of preva-lence: depression and anxiety disorders. Arch Gen Psychiatry1984;41(10):990–997.
69. Moynihan R. Medicalization. A new deal on disease definition.Br Med J 2011;342:d2548. Available at: http://www.bmj.com/content/342/bmj.d2548?variant=full-text&keytype=ref&ijkey=6pXberf82XwzLlM.
Depression and Anxiety