Embed Size (px)
Citation preview

PCWG meting, DTU, Risø Campus, April 1st , 2014
Challenges accompanying the use of the Rotor Equivalent Wind Speed
Ioannis Antoniou, Alejandro Gonzalez, Jochen Cleve, Søren M. Pedersen, Julija Tastu, Apostolos Piperas

PCWG meting, DTU, Risø Campus, April 1st , 2014
Contents
• Motivation
• Influence of the wind speed expression on the values of the mean wind speed over the rotor
• BEM simulations of multi-MW turbines
• AEP values vs. wind speed expression
• Experimental results indicating influence of the wind speed expression
• More examples of combining BEM simulations and experimental data
• Conclusions
Page 2

Motivation (1)
PCWG meting, DTU, Risø Campus, April 1st , 2014
• The Rotor Equivalent Wind Speed (REWS) definition introduced in the coming IEC 12-1 standard:
• 𝑉𝑒𝑞 = 𝑣𝑖3𝑛
𝑖=1𝐴𝑖
𝐴
1/3
• The definition of the AEP estimation:
• 𝐴𝐸𝑃 = 𝑁ℎ 𝐹 𝑉𝑖 − 𝐹 𝑉𝑖−1𝑁𝑛𝑖=1
𝑃𝑖−1+𝑃𝑖
2
• Annex P of 12-1 standard: Wind shear normalization procedures (informative)
• Old references
Page 3
0 0.05 0.1 0.15 0.2 0.25 0.3 0.35 0.4 0.45 0.598.5
99
99.5
100
100.5
101
101.5
102
102.5
103
103.5
BHawC calculations, El. power for V=7m/s
Sh.exp ()
El.p
ow
er
(%)
TI:2.0%
TI:4.0%
TI:6.0%
TI:8.0%
TI:10.0%
TI:12.0%
TI:14.0%
0 0.05 0.1 0.15 0.2 0.25 0.3 0.35 0.4 0.45 0.598
99
100
101
102
103
104
shear exponent ()
En
erg
y flu
x th
rou
gh
th
e r
oto
r(%
)
Energy flux for v=7m/s

Motivation (2)
PCWG meting, DTU, Risø Campus, April 1st , 2014
•Assume a turbine is pc tested within the below 5 distinct flat sites: • How will the turbine’s power curve/AEP be affected by the local conditions?
• Is it possible to use the REWS (as indicated by the standard) and reproduce the power curve/AEP of a turbine between different locations characterized by different atmospheric conditions and roughness?
• Or is the inner-outer region considerations the only way forth?
(*) Courtesy D. Bernadett, “5 Distinct Power Curves As a Function of Shear and Turbulence In Time-Series Energy Capture Calculations”, PCWG, Brande 2013
Inner range
Outer range
Page 4

Comparison between different wind speed definitions
• A turbine rotor divided in segments of 1m height
• Assume exponential wind profiles of varying shear exponent
• Assume unity wind speed at hub height
• 𝑉 =1
𝐴 𝑣 𝑧𝑖 cos 𝜑𝑖 𝑘
3𝐴𝑖𝑁𝑖=1
3 𝑅𝑜𝑡𝑜𝑟 𝐸𝑞𝑢𝑖𝑣𝑎𝑙𝑒𝑛𝑡 𝑊𝑖𝑛𝑑 𝑆𝑝𝑒𝑒𝑑 (1)
• 𝑉 =1
𝐴 𝑣 𝑧𝑖 cos 𝜑𝑖 𝑘 𝐴𝑖𝑁𝑖=1 𝑊𝑒𝑖𝑔ℎ𝑡𝑒𝑑 𝐴𝑣𝑒𝑟𝑎𝑔𝑒 𝑊𝑖𝑛𝑑 𝑆𝑝𝑒𝑒𝑑 (2)
PCWG meting, DTU, Risø Campus, April 1st , 2014 Page 5
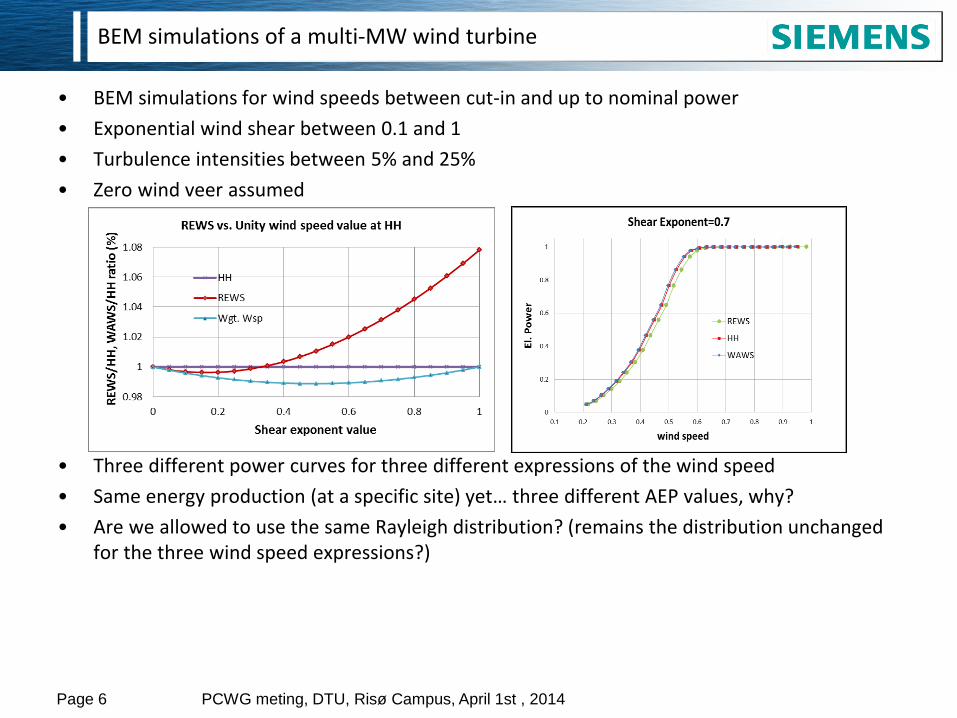
BEM simulations of a multi-MW wind turbine
• BEM simulations for wind speeds between cut-in and up to nominal power
• Exponential wind shear between 0.1 and 1
• Turbulence intensities between 5% and 25%
• Zero wind veer assumed
• Three different power curves for three different expressions of the wind speed
• Same energy production (at a specific site) yet… three different AEP values, why?
• Are we allowed to use the same Rayleigh distribution? (remains the distribution unchanged for the three wind speed expressions?)
PCWG meting, DTU, Risø Campus, April 1st , 2014 Page 6

AEP values influenced strongly by the wind speed expression
• BEM simulations for annual wind speed=X m/s and TI=10% vs. the shear exponent from 0.1 to 1 and different wind speed expressions
• 𝑉 =1
𝐴 𝑣 𝑧𝑖 cos 𝜑𝑖 𝑘
3𝐴𝑖𝑁𝑖=1
3 𝑅𝐸𝑊𝑆, 𝑒𝑛𝑒𝑟𝑔𝑦 𝑡ℎ𝑟𝑜𝑢𝑔ℎ 𝑡ℎ𝑒 𝑟𝑜𝑡𝑜𝑟 (1)
• 𝑉 =1
𝐴 𝑣 𝑧𝑖 cos 𝜑𝑖 𝑘 𝐴𝑖𝑁𝑖=1 𝑊𝐴𝑊𝑆,𝑚𝑎𝑠𝑠 𝑡ℎ𝑟𝑜𝑢𝑔ℎ 𝑡ℎ𝑒 𝑟𝑜𝑡𝑜𝑟 (2)
• (Same Weibull used for all three wind speed expressions)
PCWG meting, DTU, Risø Campus, April 1st , 2014 Page 7
Same energy, varying AEP
Increasing energy

Experimental results and o2o(*) BEM simulations indicate the same tendency
PCWG meting, DTU, Risø Campus, April 1st , 2014 Page 8
• Forested flat terrain data – High shear
– High veer
– Medium-high TI
– AEP ratios
(*): one-to-one, simulations using the measured profile
0 2 4 6 8 10 12 14 16 18 200
5
10
15
20
25
30
35
40
wind speed (m/s)
TI(
%)
TI (2914 data points)
binned mean
0 2 4 6 8 10 12 14 16 18 20 22-1
-0.5
0
0.5
1
1.5
2
wind speed (m/s)
Sh
ea
r e
xp
,( )
shear exp. hub height - midways
shear exp. midways - lower tip
0 2 4 6 8 10 12 14 16 18 20-20
-10
0
10
20
30
40
50
60
wind speed (m/s)
Dir. d
iff. h
ub
-tip
(°)
Dir. diff. hub-tip
0 2 4 6 8 10 12 14 16 18 200
5
10
15
20
25
30
35
40
wind speed (m/s)
TI(
%)
TI (1065 data points)
binned mean
0 2 4 6 8 10 12 14 16 18 20 22-1
-0.5
0
0.5
1
1.5
2
wind speed (m/s)
Sh
ea
r e
xp
,( )
shear exp. hub height - midways
shear exp. midways - lower tip
0 2 4 6 8 10 12 14 16 18 20-20
-10
0
10
20
30
40
50
wind speed (m/s)
Dir. d
iff. h
ub
-tip
(°)
Dir. diff. hub-tip
MAWS BEM results Measurements BEM results Measurements BEM results Measurements BEM results Measurements
7.5m/s 1.013 1.012 1.017 1.019 1.000 0.999 0.999 1.001
8.5m/s 1.010 1.009 1.014 1.015 1.000 0.999 1.000 1.001
9.5m/s 1.009 1.008 1.012 1.012 1.000 0.999 1.000 1.001
(shear below HH<0.4)/(all
data)
(shear below HH<0.3)/(all
data)
REWS (eq. 1) WAWS (eq. 2)(shear below HH<0.4)/(all
data)
(shear below HH<0.3)/(all
data)

Need for unifying the AEP results for different wind speed expressions
• Side-effects of the wind speed definition: – Dependency on the wind shear values
– Varying power curves, AEP values
• Challenge: Present IEC ed.2 needs a unifying procedure
• Example: doable in the (ideal) case of a constant exponential shear: – The ratio between the HH and the REWS or WAWS (figure in slide p.5) is constant
– Thus the wind speeds of the REWS or the WAWS power curves need just be devided by this ratio value
PCWG meting, DTU, Risø Campus, April 1st , 2014 Page 9
Same energy, varying AEP
Increasing energy
Wind speed ratios
Shear
exponent HH REWS WAWS
0 1 1 1
0.1 1 0.9922 0.9897
0.2 1 0.9916 0.9820
0.3 1 0.9970 0.9769
0.4 1 1.0076 0.9741
0.5 1 1.0230 0.9735
0.6 1 1.0425 0.9750
0.7 1 1.0658 0.9784
0.8 1 1.0928 0.9838
0.9 1 1.1233 0.9910
1 1 1.1571 1

PCWG meting, DTU, Risø Campus, April 1st , 2014
Conclusions
• The equivalent wind speed concept accounts for the wind profile deficit
but..
• … inherently influences the turbine’s AEP.
• Ambiguities exist in the use of the frequency distribution for the calculation of the AEP when using other than the hub height wind speed.
• Additional clarifications are needed in the coming IEC standard in order to make the above transparent .
• These ambiguities do not allow consistent AEP values to be produced when using different wind speed expressions
• Further standardization is needed in order to calculate specific site production (AEP), based on a “IEC standard” PC
• In the light of the previous points, the inner-outer region concept seems, until further, to be the only way forth.
Page 10


![International Journal of Engineering Research & Technology ... · can be obtained from the no load and blocked rotor tests data [13]. Fig.1 Per-phase equivalent circuit of induction](https://img.dokumen.tips/doc/110x75/5eadc847f8d7340a876deb3b/international-journal-of-engineering-research-technology-can-be-obtained.jpg)