Embed Size (px)
Citation preview

Australian Journal of Basic and Applied Sciences, 7(4): 353-365, 2013 ISSN 1991-8178
Corresponding Author: Halimatun Hashim, Department of Electrical Power Engineering, College of Engineering, Universiti Tenaga Nasional, Jalan IKRAM-UNITEN, 43000 Selangor, Malaysia. E-mail: [email protected]; [email protected]
353
An Out-of-Step Detection Based on Transient Stability Index
1H. Hashim, 1I.Z. Abidin, 1H.A.A. Rashid, 1N.Z. Zulkapli, 1S.H. Ibrahim, 2Sheik Kamar, 3Nik Sofizan
1Electrical Power Engineering, College of Engineering, Universiti Tenaga Nasional, Jalan IKRAM – UNITEN, 43000 Kajang, Selangor, Malaysia
2Tenaga Nasional Berhad Research 3Tenaga Nasional Berhad Transmission Engineering
Abstract: A group of generators in one or more areas of a power system may loss its synchronism with other areas when the power system is subjected to severe fault(s). At this condition, generators that loss their synchronism or running at out-of- step (OOS) condition are operating at high stress level situation. An early detection of OOS is very important so that the system can be secured to stability condition as fast as possible; thus, able to save generators and preventing the system from the possibility of widespread outage. The response of a power system to a disturbance depends on the initial operating state of the system, the severity of the disturbance, and the actions of protective relays and other power system controls. A power system may experience a stable power swing if the system remains in a state of equilibrium when subjected to a disturbance. Terminal voltage variations will activate generator voltage regulators while generator speed variations will activate prime mover governors. A fault on a critical part of a power system followed by its isolation by protective relays will cause variations in power flows, network bus voltages, and machine rotor speeds. The system is said to be transiently unstable when there is a loss of synchronism between groups of generators or between neighboring connected utility systems due to large separation of generator rotor angles, large fluctuations of voltages and currents, and large swings of power flows. This paper introduces a new technique to detect OOS condition as an early indicator using Area-Based Transient Stability Index Center of Inertia: Speed (TSI COI Speed). The analysis is carried out using PSSE33 software on IEEE 118-Bus Test System and other randomly selected test system. Results obtained from the experiments revealed that the TSI COI Speed able to provide an earlier detection of OOS; hence, an immediate action to secure the system to stability condition can be commenced immediately. Key words: Out-of-Step detection, System Integration Protection schemes, Area-Based Transient
Stability Indexes: COI Angle and COI Speed
INTRODUCTION At steady state condition, the electric power output, Pe from the generator produces an electric torque, τe
that balances the mechanical torque, applied to the generator rotor shaft. The generator rotor runs at rated speed; based on the swing equation, at this moment the accelerating power ( is zero. When two areas of an interconnected power system are in phase, the magnitude of the voltages are maximum and currents are minimum; however, when these two areas are out of phase by 180°, currents are at peak and voltages are close to zero. They lose synchronism when there is a large variation of voltages and currents throughout the power system (Kundur, 1994; Sauer, 1998; Karady, 2002; Joe Mooney, 2006; Zhang Xuemin, 2006; Hashim, 2010; Zulkepali, 2010; Hashim, 2011). The detection and tripping selection for an unstable power swing such as an out-of- step condition is determined through several system stability studies and the ability of the circuit breaker to isolate the circuit with a significant voltage angles across the breaker. It is necessary to recognize the power swing from the fault occurred through the following four techniques (Joe Mooney, 2006); first, the power swing should be analyzed. Second, a way of probability of fault occurrence must be found. Third, the critical condition under which the stability of a power system has been disturbed should be recognized. Last, the setting of the power swing relays has to be calculated.
When a fault occurs in the system, it reduces the amount of power transmission; the electric torque that counters the mechanical torque is also decreased. The mechanical power, Pm needs to be reduced during the period of the fault to prevent the generator rotor from accelerating due to the net remaining of torque input. Based on the concept of equal area criteria, the system remains in stable condition if the decelerating area is equal to or more than the accelerating area (Kundur, 1994; Sauer, 1998; Saadat, 2002; Joe Mooney, 2006; Zhang Xuemin, 2006; Machowski, 2008). Hence, it is important to make sure that the circuit breaker clears the fault before the critical fault clearing time, which is equivalent the critical angle, δC.

Aust. J. Basic & Appl. Sci., 7(4): 353-365, 2013
354
Analysis of Unstable Power Swing: Some of the methods used for power swing detection are using transient stability index; estimating the
swing center voltage and its rate of change; measuring the rate change of resistance or impedance; monitoring Center of Inertia (COI) rotor angle or accelerating power; applying system integrity protection schemes (SIPS), and measuring critical parameters using the synchrophasor measurement technique, (Billinton, 1980; Kundur, 1994; Rovnyak, 2000; Sauer, 1998; Zhang Xuemin, 2006; Noor Izzri (2008); Schweitzer, 2008). Power swing tripping must be set using data obtained from general stability studies by varying the system condition, creating the boundary equivalents, and determining the suitable place to apply the scheme and separating the system (Anderson, 1999). This paper introduces a TSI COI Speed as an indicator for early OOS detection. System Integration Protection schemes (SIPS) is used as a comparison and to validate the effectiveness of the indicator.
System Integrity Protection Scheme (SIPS):
Schweitzer (2008) introduces an improvement to SIPS using synchrophasor measurements. This method is good for two-area power systems to allocate the electrical center, which is equivalent to half of the total impedance between two sources. The electrical center of the system can be at a transmission line or at any other part of the system that corresponds to half of the total impedance. SIPS requires that the location of system electrical center must be between the relays that acquire the synchrophasor measurements. The out of step protection scheme uses the positive sequence voltage synchrophasors that relays acquire at two power system busbars to calculate the angle difference between these voltages. In assessing power system stability using SIPS (Schweitzer, 2008), the angle difference , slip frequency , and slip frequency acceleration are calculated; thus, predicting power angle of unstable conditions. A modal analysis based SIPS is then used to identify the undamped oscillations and take action before the system collapses.
(1)
(2)
(3) Where
is the positive-sequence voltage angle of Relay 1 at the k processing interval
is the positive-sequence voltage angle of Relay 2 at the k processing interval
is the slip frequency at the k processing interval is the acceleration at the k processing interval
Area-Based TSI: COI Angle and COI Speed:
When the system is subjected to disturbances, the synchronism assessment among generators can be made by analyzing the angular velocity in addition to checking the variation of rotor angle (Sauer, 1998; Kamwa, 2006; Zhang Xuemin, 2006; Hashim, 2010). The system is not stable if the rotor angle of a generator increases with respect to the rest of the system. Similarly, the angular velocity can be translated to system frequency. For a multi-machine system, Area-Based COI is a common transformation used in transient stability analysis (Sauer, 1998; Zhang Xuemin, 2006; Noor Izzri, 2008; Hashim, 2010; Zulkepali, 2010). The Area-based TSI: COI Angle and COI Speed are derived based on the swing equation (Saadat, 2002).
(4) Where M is the moment of inertia of the machine, δ is the electrical power angle, Pm is the mechanical
power, Pe is the electrical power, and is the Accelerating Power. The indexes shown in equation (5) and equation (9) relate to the rotor angle and angular speed of a particular area in a power grid and are based on an equivalent inertia representing the total inertia of the generators located in that area. The indexes are derived from the classical machine model by assuming that the dynamic behavior of generators in the system (Kundur, 1994; Sauer, 1998; Zhang Xuemin, 2006; Noor Izzri, 2008). If the indexes calculated show an out of step condition after the fault is cleared, the system is considered to be in an unstable condition. In addition, if the referred multi-machine system is in synchronism with all the machines turning at a constant speed (Sauer, 1998;
Aust. J. Basic & Appl. Sci., 7(4): 353-365, 2013
355
Zhang Xuemin, 2006; Hashim, 2010), the system frequency is equal to the dynamic frequency (possibly above or below the steady state speed, ωs). The COI reference transformation defines the COI Angle and COI Speed instead of referring to the angle of a specific machine (Sauer, 1998). The COI reference transformation defines the COI Angle as:
(5)
(6)
(7)
(8)
Where is the TSI COI Angle, N is the number of generator, MT is the total system inertia, δi is the
individual rotor angle, is the area equivalent rotor angle of each area, is the COI Angle of the system, while r is total number of areas in a power system. The COI reference transformation defines the COI Speed as:
(9)
(10)
(11)
Where is the TSI COI Speed, ωi is the individual rotor speed, is the area equivalent rotor speed and is the COI Speed of the system.
Wide Area Intelligent System: Synchrophasors are now used to solve a variety of power system protection, automation, and control
problems; they are being used to operate and manage the power system. Applications include voltage stability assessment, islanding distributed generation, control based on small signal instability detection, and system wide disturbance monitoring (Schweitzer, 2010). The implementation of wide area measurement system allows area-based TSI COI Speed to be applied as an early indicator to detect OOS condition. This is in line with the purpose of wide area measurement system (Kamwa, 2006): providing early warning of deteriorating system conditions, so operators can take corrective actions; offering more diagnostic tools than are currently available; and allowing for more effective use of automatic controls for self-correction such as automatic switching or controlling the flow of power. It is important to detect fault and take remedial action as soon as possible; delay action will cause power system failure wide spread. Early OOS detection would assist early OOS tripping; thus, it would avoid tripping a line when the angle between systems is near 180 degrees. Tripping during this condition imposes high stresses on the breaker and can cause restrikes and breaker damage (Demetrios, 2003). With the application of synchrophasor in the system, voltage angle can be used instead of rotor angle to calculate the TSI COI Speed including the Accelerating Power.
Test System:
In this research work, the analysis on the behavior of power system during abnormal condition is carried out on two test systems: IEEE118 Bus Test System that has 28 generators with and without dynamic loads as shown in Figure 1 and 790 Bus Test System Network but focusing on a selected area is shown in Figure 2. The last test system was further used to justify TSI COI Speed as an early indicator to detect an unstable power swing.

Aust. J. Basic & Appl. Sci., 7(4): 353-365, 2013
356
Fig. 1: IEEE118 Bus Test System
For IEEE118 Bus Test System, a few transient analysis studies were carried out to analyze system behavior
with respect to TSI: COI Angle and Speed, and Accelerating Power. This acts as a preliminary study before moving to a larger system with an aim to investigate the coherency of the results obtained; for comparison purpose, results for fault on Bus 19 are presented in this paper. Nevertheless, major research work was carried out on 790 Bus Test System as shown in Figure 2. The analysis is focusing on the system behavior for faults, which may occur on the Six Circuit that comprises of 4 lines between Bus1001 – Bus1007 and 2 lines between Bus1001 – Bus1006. Severe fault in these lines such as 6 Line Fault (6LF) may lead to unstable power swing to the two transmission lines between Bus1004 – Bus1005. Bus 1001, Bus1002 and Bus1003 are connected to thermal power power plants and supplying power to meet power demand in this area and also to support the demand to the rest of the grid system while Bus1004 is connected to a hydro power plant. Majority of the generated power from this area is exported to the load centers of the system through previously mentioned Six Circuit; conversely, another two line from Bus 1001 and Bus 1004 are leading to mostly domestic customers. The Six Circuit is considered as the main arteries connecting from the generation center to various load centers in the network, which are mostly commercials and industrials while the area beyond Bus 1004, the lines are carrying light load.
Generators that are connected to Bus1001, Bus1002 and Bus1003 consist of either gas turbine (GT) or steam turbine (ST). The input power to steam turbine of each block at Bus1001 and Bus1002 depends on the flue gas from the other two gas turbines. Hence, reducing power generation from gas turbine will affect power generated by the steam turbine of the respective block. However, at Bus1003 due to the design of the connected plant, generator that powered by the steam turbine of each block has to shutdown if any of the gas turbine is down on outage. Bus1004 is a hydro power plant that consists of 4 generators with each generator has a maximum power generation of 100MW. Scheduling of power from these generators depends on the nature and construction of each plant. Taking into consideration on the constraint and limitation of each type of power plant, different combinations of generation scheduling were simulated to create different scenarios in order to justify the selected method of OOS detection.
Fig. 2: 790 Bus Test System Simplified Equivalent Network

Aust. J. Basic & Appl. Sci., 7(4): 353-365, 2013
357
RESULTS AND DISCUSSIONS
IEEE118 Bus Test System: Bus fault was applied to Bus 19 with and without dynamic loads. The graphical illustrations in Figure 3 and
Figure 4 distinguish the vast differences in power system behavior between the two scenarios. Without dynamic load, the TSI COI Angles settles at values lesser than 90° while the TSI COI Speed and the Accelerating Power damp to zero eventually after some mild oscillations; the system maintains its stability. Figure 4 is meant for the system with dynamic loads, which reflects the unstable power swing: TSI COI Angles increase infinitely; TSI COI Speeds and the Accelerating Power do not converge but continue to diverge at significant values.
Fig. 3: TSI COI Angle; TSI COI Speed; and Accelerating Power for Bus 19 fault without Dynamic Load
Fig. 4: TSI COI Angle; TSI COI Speed; and Accelerating Power for Bus 19 fault with Dynamic Load 790 Bus Test System:
Numerous simulations were carried out on 790 Bus Test System Network for different network topologies at steady state and fault(s) conditions including the locations of fault: 1LF - Single line trip (Bus1001 – Bus1007); 1LF - Single line trip (Bus1001 – Bus1006); 2LF - Two parallel lines trip (Bus1001 – Bus1007); 3LF - Three parallel lines trip (Bus1001 – Bus1007); 4LF - Four parallel lines trip (Bus1001 – Bus1007); 5LF - Five lines trip (4 lines Bus1001 – Bus1007and 1 line Bus1001 – Bus1006); and 6LF - Six lines trip (4 parallel lines Bus1001 – Bus1007and 2 parallel lines Bus1001 – Bus1006) respectively. The system behaviors and response to bus fault were monitored in order to find the boundaries and segregate between stable and unstable conditions. Figure 5 shows the time line events of these faults: applying bus fault at Bus1001 at 1.0s and followed by tripping line(s) at a time delay of 100ms.
Fig. 5: Time Line Event for Bus Fault Followed by 6 Lines Trip
The objective of this system behavioral study is to determine the most suitable boundaries to detect OOS
using SIPS concept and the most suitable value of TSI COI Speed to serve as an OOS indicator that will distinguish between OOS and non OOS conditions. Out of all these seven scenarios, only 6LF will end up with an OOS condition while 5LF is declared as the boundary for the system stability.
0s Starts
1.1s Trip line(s)
1s Apply bus fault
15s Ends
Aust. J. Basic & Appl. Sci., 7(4): 353-365, 2013
358
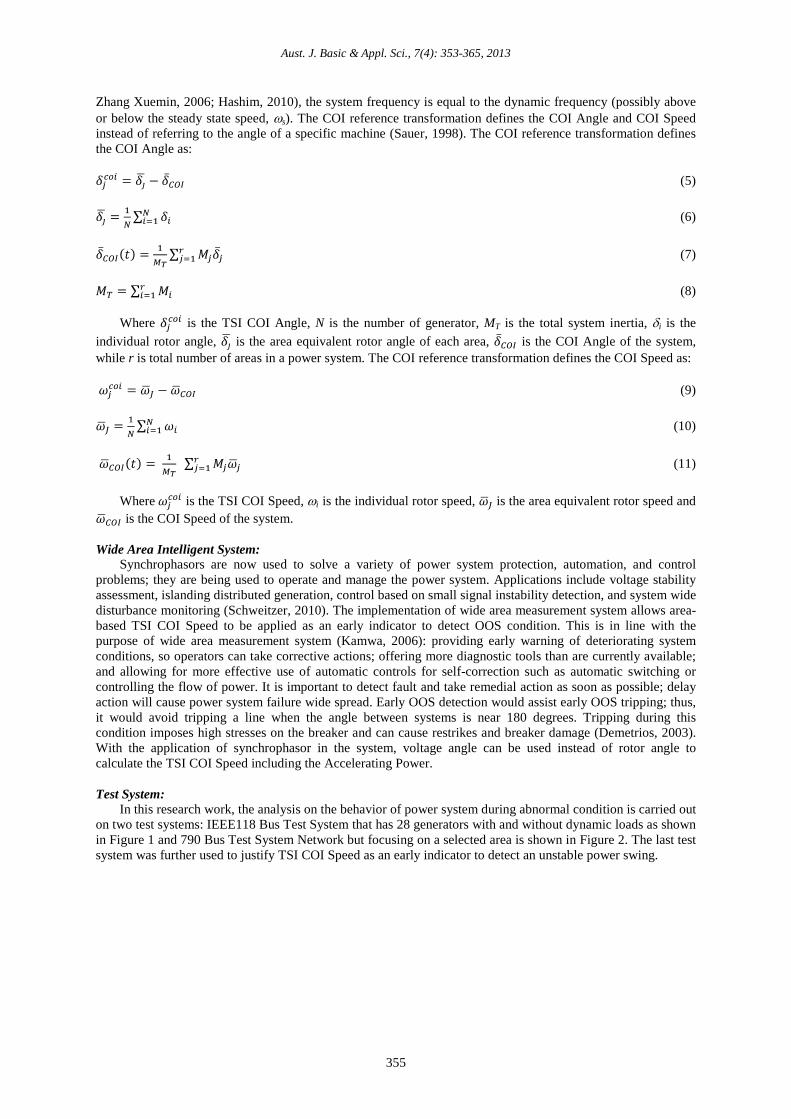
Development of Out-of-Step Detection Algorithm Using SIPS: SIPS method is selected as a comparison to detect OOS condition when the system is subjected to fault.
Based on Schweitzer (2008), boundaries in the form of two straight line equations of Slip Frequency Acceleration versus Slip Frequency characteristics are set up to categorize between stable and unstable power swing as shown in Figure 6a. Referring to the simulation results for different network topologies on 790 Bus Test System Network, the most suitable boundaries to detect OOS are found to be:
• The upper boundary - Afk1 = 3.125Sfk + 15 • The lower boundary - Afk2 = 3.125Sfk – 15 Using the algorithm in Figure 6b, a MatLab program was developed to detect OOS with respect to the
determined boundaries.
6a) 6b)
Fig. 6: OOS boundaries, Schweitzer (2008) and the flow chart of OOS detection using SIPS based on the determined boundaries. Stable conditions - Analysis using SIPS:
Figure 7 shows the slip frequency acceleration versus slip frequency graphs for a fault that the system can still maintain its stability. The graphs oscillate with small radius and within the boundaries at all monitored locations.
a) Between Bus1004 – Bus1005 b) Between Bus1001 – Bus1006 c) Between Bus1001 – Bus1007

Aust. J. Basic & Appl. Sci., 7(4): 353-365, 2013
359
d) Between Bus1001 – Bus1002 e) Between Bus1001 – Bus1004 f) Between Bus1001 – Bus1003 Fig. 7: Slip Frequency Acceleration versus Slip Frequency Characteristics at Monitored Locations for a
Scenario without OOS
Stable conditions: Analysis using TSI COI Angle, TSI COI Speed, and Accelerating Power: The oscillations in TSI COI Angle, TSI COI Speed and Accelerating Power are low and approaching
stability for 5LF at all the monitored buses as shown in Figure 8. Among the 4 monitored buses, Bus1001 has the least oscillation followed by Bus 1003 and Bus1002 while Bus 1004 oscillates the most. When fault occurs, the faulted lines will be completely isolated from the system, which is as good as removal of load from the generator; as a result, there will be an unbalance between power generated and demand that will yield to an increase in accelerating power. If the fault is not severe, the generators manage to continue operating in synchronism though some of them may not settle at their respective initial operating angle during the post fault condition. It is found that the magnitude of TSI COI Angle, TSI COI Speed and Accelerating Power (Pm – Pe) depend on the severity of the fault.
a) TSI COI Angle b) TSI COI Speed c) Accelerating Power (Pm – Pe)
Fig. 8: System Behavior at Monitored Buses due to 5 Line Fault (5LF); trip line(s) at 0.1s Unstable Condition – Analysis Using Psse Simulation Results:
When 6LF occurs in the system, all the six lines connecting from Bus1001 to Bus1007 and Bus 1006 respectively are completely isolated from the system. Generated power from this area will swing to Bus1004 and force to flow through the two remaining 275kV transmission lines that feeding the light load area. Another alternative route would be to Bus1011, which leads to Bus1010 connecting to moderate loads but important customers and other 132kV loads within that area as shown in Figure 2 and Figure 9.

Aust. J. Basic & Appl. Sci., 7(4): 353-365, 2013
360
Fig. 9: Power Flow to Bus1002
PSSE simulation report in Table 1 shows that the 132kV lines will sense the OOS phenomena first followed
by the 275kV lines with a time lag of about 75ms. If no immediate action is taken to limit the disturbances at early stage, these phenomena will grow and spread to other weak buses. It can be seen in Table 1 that at 1.775s, more buses are reported to be at OOS condition; this could lead to cascading tripping and eventually would result to wide area interruption of power supply.
Table 1: PSSE Simulation Report
OUT OF STEP CONDITION AT TIME = 1.700s: X------- F R O M -------X X--------- T O ---------X BUS# X-- NAME --X BASKV BUS# X-- NAME --X BASKV CKT MW MVAR VOLTAGE 1010 132 132.00 1012 132 132.00 1 121.0 134.6 0.3350 1012 132 132.00 1010 132 132.00 1 -73.4 69.7 0.1874 OUT OF STEP CONDITION AT TIME = 1.775s: X------- F R O M -------X X--------- T O ---------X BUS# X-- NAME --X BASKV BUS# X-- NAME --X BASKV CKT MW MVAR VOLTAGE 1010 132 132.00 1013 132 132.00 1 26.0 153.2 0.2810 1013 132 132.00 1010 132 132.00 1 8.7 35.2 0.0722 1010 132 132.00 1012 132 132.00 1 23.8 147.4 0.2810 1012 132 132.00 1010 132 132.00 1 22.2 47.5 0.0987 1005 275 275.00 1004 275 275.00 1 -277.1 201.2 0.2902
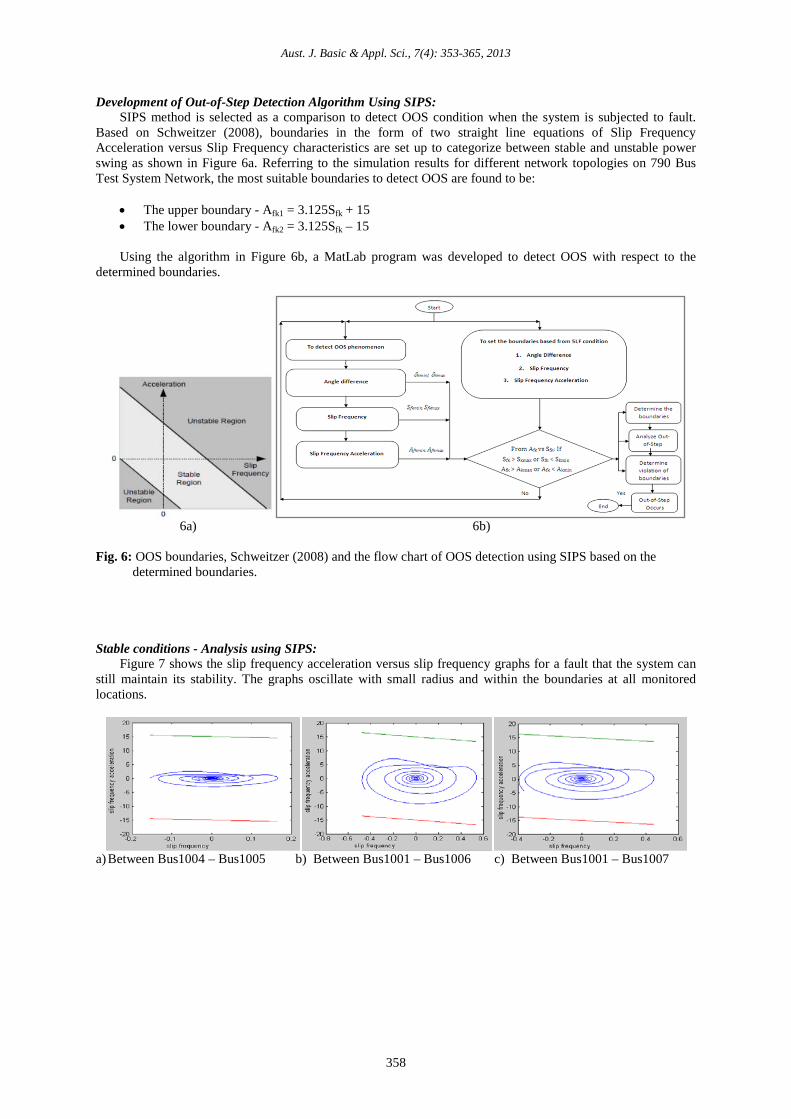
Unstable Condition - Analysis using SIPS: Comparing 6LF to 5LF as in the previous scenarios, the differences in system behavior are so obvious. The
graphical illustrations in Figure 10 have proven that 6LF forces the system to run in out-of-step phenomena; the characteristics exceed beyond the boundaries. The fault is so severe that causes most of the generators in that area to run out of synchronism.
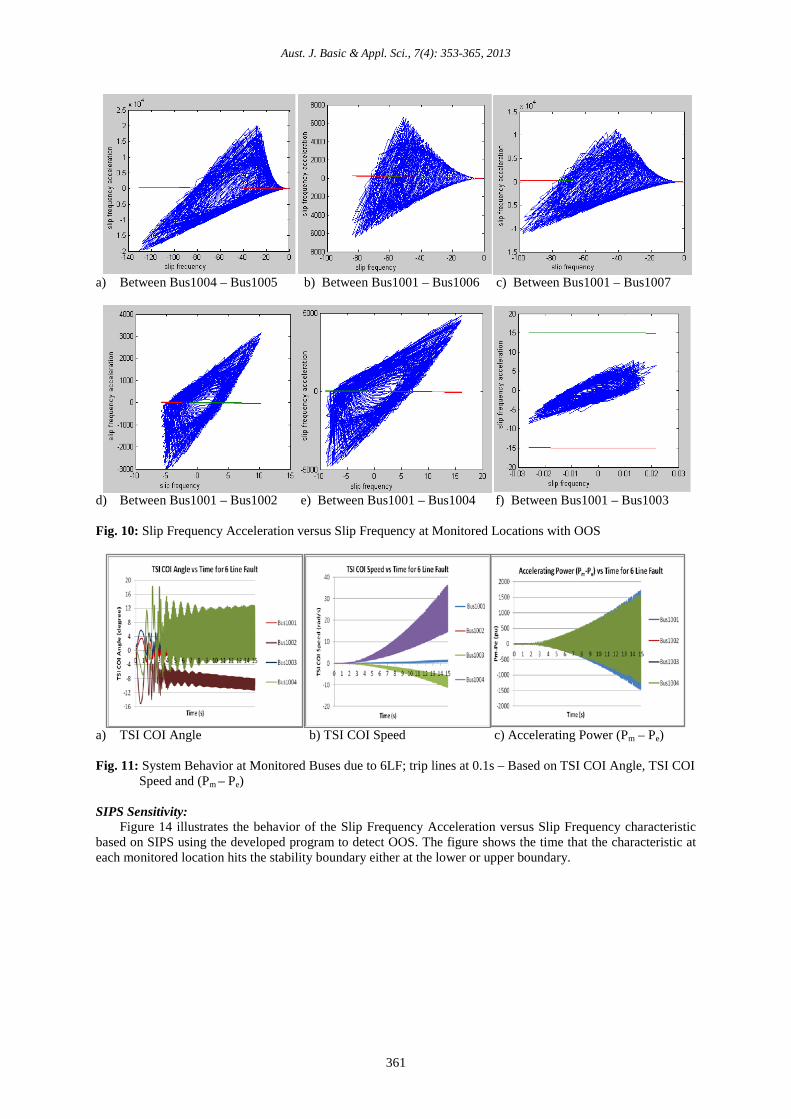
Unstable conditions - Analysis using TSI COI Angle, TSI COI Speed, and Accelerating Power:
Figure 11 shows system behavior based on TSI COI Angle, TSI COI Speed and Accelerating Power when 6LF occurs in the system. All the three graphical illustrations complement each other showing that the system is experiencing OOS condition: TSI COI Angle oscillates vigorously with TSI COI Speed and Accelerating Power infinitely increases at all the monitored locations. Results of all the methods used: SIPS, TSI COI Angle, TSI COI Speed and Accelerating Power have agreed that 6LF contributes OOS in the system.
Aust. J. Basic & Appl. Sci., 7(4): 353-365, 2013
361
a) Between Bus1004 – Bus1005 b) Between Bus1001 – Bus1006 c) Between Bus1001 – Bus1007
d) Between Bus1001 – Bus1002 e) Between Bus1001 – Bus1004 f) Between Bus1001 – Bus1003 Fig. 10: Slip Frequency Acceleration versus Slip Frequency at Monitored Locations with OOS
a) TSI COI Angle b) TSI COI Speed c) Accelerating Power (Pm – Pe)
Fig. 11: System Behavior at Monitored Buses due to 6LF; trip lines at 0.1s – Based on TSI COI Angle, TSI COI Speed and (Pm – Pe) SIPS Sensitivity:
Figure 14 illustrates the behavior of the Slip Frequency Acceleration versus Slip Frequency characteristic based on SIPS using the developed program to detect OOS. The figure shows the time that the characteristic at each monitored location hits the stability boundary either at the lower or upper boundary.

Aust. J. Basic & Appl. Sci., 7(4): 353-365, 2013
362
a) Between Bus1004 – Bus1005 b) Between Bus1001 – Bus1006 c) Between Bus1001 – Bus1007 b)
d) Between Bus1001 – Bus1002 e) Between Bus1001 – Bus1004 f) Between Bus1001 – Bus1003 Fig. 14: Graphical Illustration on OOS Detection using SIPS for GSN7_100MW
Table 2 summarizes the time that the slip frequency hits the boundary and moves out from the stable region
for different generation scheduling. To elaborate the table in detail; as an example, at GSN7_100MW: for Bus1004-Bus1005 the upper boundary is hit after 2.46s while the lower boundary is hit after 2.15s; for Bus1001-Bus1006 the hit time are after 3.39s and 2.18s; for Bus1001-Bus1007 after 3.00s and 2.13s; for Bus1001-Bus1002 after 2.87s and 2.50s; for Bus1001-Bus1004 after 2.43s and 2.57s and; for Bus1001-Bus1003 after 12.93s and 12.73s respectively. As a summary, it takes more than 1s after the 6LF is cleared for the OOS phenomena to be detected if SIPs were to be used, which is more than 50 cycles. Hence, it would delay the process of eliminating the OOS phenomena from the system and lead to wide area interruption.
Table 2: SIPS Results for Random Generation Scheduling GSN7_70MW – GSN7_100MW
Aust. J. Basic & Appl. Sci., 7(4): 353-365, 2013
363
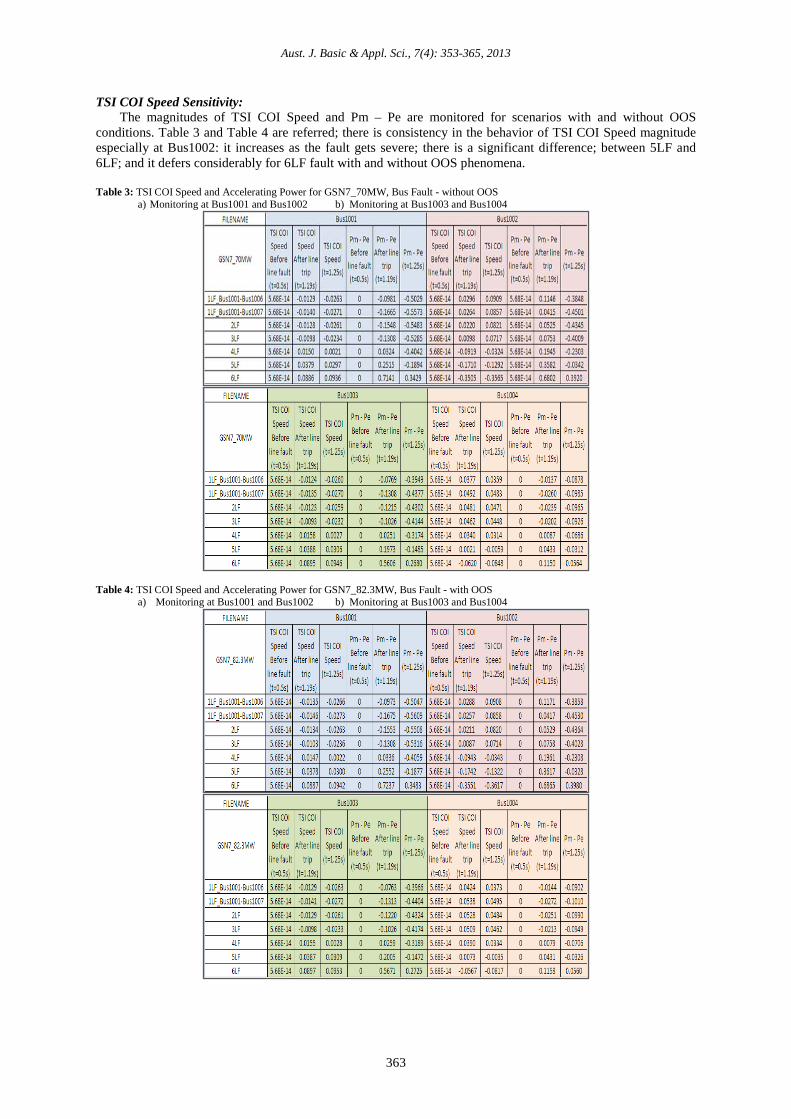
TSI COI Speed Sensitivity: The magnitudes of TSI COI Speed and Pm – Pe are monitored for scenarios with and without OOS
conditions. Table 3 and Table 4 are referred; there is consistency in the behavior of TSI COI Speed magnitude especially at Bus1002: it increases as the fault gets severe; there is a significant difference; between 5LF and 6LF; and it defers considerably for 6LF fault with and without OOS phenomena. Table 3: TSI COI Speed and Accelerating Power for GSN7_70MW, Bus Fault - without OOS
a) Monitoring at Bus1001 and Bus1002 b) Monitoring at Bus1003 and Bus1004
Table 4: TSI COI Speed and Accelerating Power for GSN7_82.3MW, Bus Fault - with OOS
a) Monitoring at Bus1001 and Bus1002 b) Monitoring at Bus1003 and Bus1004
Aust. J. Basic & Appl. Sci., 7(4): 353-365, 2013
364
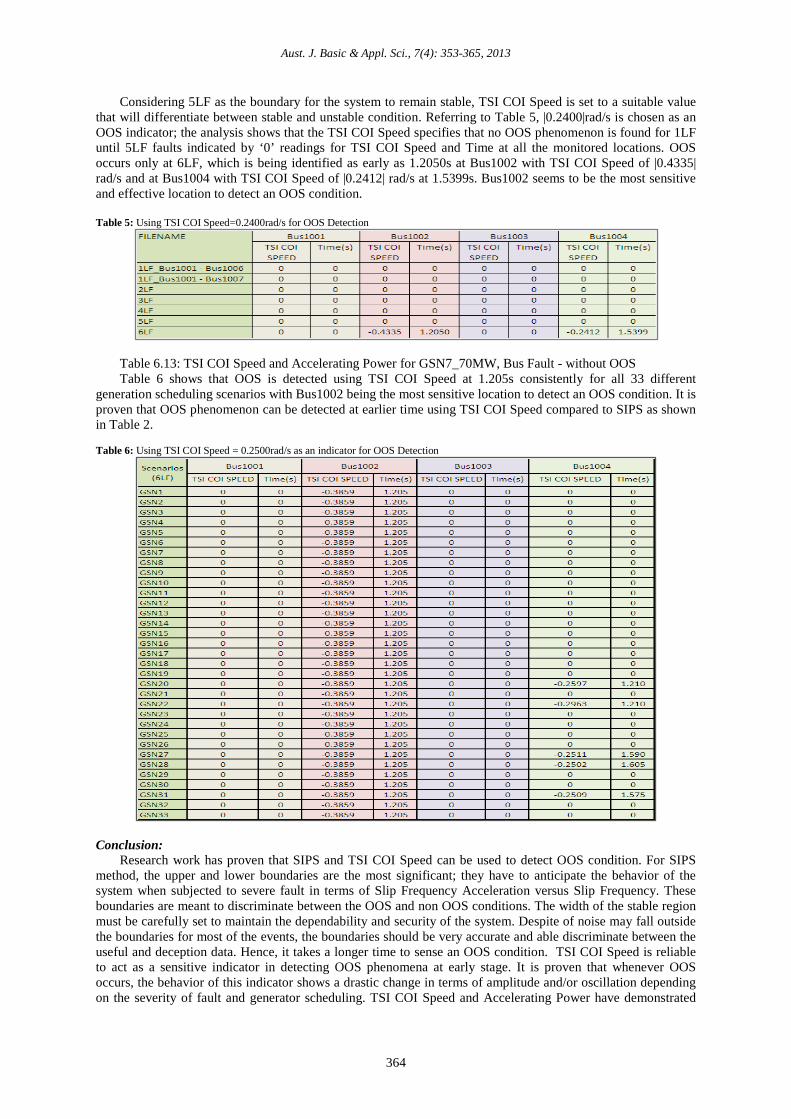
Considering 5LF as the boundary for the system to remain stable, TSI COI Speed is set to a suitable value that will differentiate between stable and unstable condition. Referring to Table 5, |0.2400|rad/s is chosen as an OOS indicator; the analysis shows that the TSI COI Speed specifies that no OOS phenomenon is found for 1LF until 5LF faults indicated by ‘0’ readings for TSI COI Speed and Time at all the monitored locations. OOS occurs only at 6LF, which is being identified as early as 1.2050s at Bus1002 with TSI COI Speed of |0.4335| rad/s and at Bus1004 with TSI COI Speed of |0.2412| rad/s at 1.5399s. Bus1002 seems to be the most sensitive and effective location to detect an OOS condition. Table 5: Using TSI COI Speed=0.2400rad/s for OOS Detection
Table 6.13: TSI COI Speed and Accelerating Power for GSN7_70MW, Bus Fault - without OOS Table 6 shows that OOS is detected using TSI COI Speed at 1.205s consistently for all 33 different
generation scheduling scenarios with Bus1002 being the most sensitive location to detect an OOS condition. It is proven that OOS phenomenon can be detected at earlier time using TSI COI Speed compared to SIPS as shown in Table 2. Table 6: Using TSI COI Speed = 0.2500rad/s as an indicator for OOS Detection
Conclusion:
Research work has proven that SIPS and TSI COI Speed can be used to detect OOS condition. For SIPS method, the upper and lower boundaries are the most significant; they have to anticipate the behavior of the system when subjected to severe fault in terms of Slip Frequency Acceleration versus Slip Frequency. These boundaries are meant to discriminate between the OOS and non OOS conditions. The width of the stable region must be carefully set to maintain the dependability and security of the system. Despite of noise may fall outside the boundaries for most of the events, the boundaries should be very accurate and able discriminate between the useful and deception data. Hence, it takes a longer time to sense an OOS condition. TSI COI Speed is reliable to act as a sensitive indicator in detecting OOS phenomena at early stage. It is proven that whenever OOS occurs, the behavior of this indicator shows a drastic change in terms of amplitude and/or oscillation depending on the severity of fault and generator scheduling. TSI COI Speed and Accelerating Power have demonstrated
Aust. J. Basic & Appl. Sci., 7(4): 353-365, 2013
365
consistent results for all case studies in this research work. It is proven that TSI COI Speed can single out the OOS event at an early stage.
REFERENCES
Amjady, N. and S. Banihashemi, 2010. "Transient Stability Prediction of Power Systems by a New
Synchronism Status Index and Hybrid Classifier,"Generation,Transmission & Distribution, IET., 4(4): 509-518. Anderson, P., 1999. Power System Protection, New York: McGraw-Hill. Billinton, R. and P. Kuruganty, 1980. "A probabilistic Index for transient Stability," Power Apparatus and
Systems, IEEE Transactions, Vols. PAS-99, 1: 195-206. Demetrios, D.H. A. Tziouvaras, 2003. "Out of Step Protection Fundamentals and Advancements," Journal
of Schweitzer Engineering Laboratories, Inc. Vacaville, CA USA. Hashim, H., I.Z. Abidin, K.S. Yap, I. Musirin and M.R. Zulkepali, 2011. "Optimization of Mechanical
Input Power to Synchronous Generator based on Transient Stability Center-of-Inertia: COI Angle and COI Speed," in The 5th International Power Engineering and Optimization Conf. (PEOCO2011),
Hashim, H., M.R. Zulkepali, Y.R. Omar, N. Ismail, I.Z. Abidin and S. Yusof, 2010. "An Analysis of Transient Stability Using Center-of-Inertia: Angle and Speed," in PECON.
Joe Mooney, P. and I. Normann Fischer, 2006. "Application guidelines for power swing detection on transmission systems," Journal of Schweitzer Engineering Labaratories.
Kamwa, I., J. Beland and D. Mcnabb, 2006. "PMU-Based Vulnerability Assessment Using Wide- Area Severity Indices and Tracking Modal Analysis," Power Systems Conference and Exposition, 2006. PSCE '06. 2006 IEEE PES Publication, pp: 139-149.
Karady, G., 2002. "Improving transient stability using generator tripping based on tracking rotor-angle," Power Engineering Society Winter Meeting, 2002. IEEE, 2: 1113-1118.
Kundur, P., 1994. Introduction to the Power System Stability Problem – Basic Concept and Definitions, Mid-term and Long-Term Stability. Power System Stability and Control: 33-34, New York: McGraw-Hil.
Machowski, J., J.W. Bialek and J. Bumby, 2008. “Power System Dynamics Stability and Control.” 2nd Edition, West Sussex: John Wiley & Sons.
Noor Izzri, A.W. and A. Mohamed, 2008. "Area-Based COI-Referred Transient Stability Index for Large-Scale Power System," International Journal of Power, Energy and Artificial Intelligence, 1(1).
Rovnyak, S.M., C.W. Taylor, Y. Sheng, 2000. “Decision trees using apparent resistance to detect impending loss of synchronism.” Power Delivery, IEEE Transactions on., 15(4)(s): 1157-1162.
Saadat, H., 2002. Power System Analysis. Second Edition, New York: McGraw-Hill. Sauer, P.W. and M.A. Pai, 1998. Power System Dynamics and Stability, New Jersey: Prentice Hall. Schweitzer, E.O., D. Whitehead, A. Guzman, Y. Gong and M. Donolo, 2008. "Advanced Real-Time
Synchrophasor Application," Journal of Reliable Power. Schweitzer, E.O., D. Whitehead, G. Zweigle, K.G. Ravikumar, 2010. “Synchrophasor-Based Power System
Protection and Control Applications,” Conference for Protective Relay Engineers. IEEE. Zhang Xuemin, Mei Shengwei, Lu Qiang, 2006. “A New Algorithm for Transient Stability Emergency
Control Based on Power Switching.” Industrial Electronics and Applications, 2006 1ST IEEE Conference on 24-26(s): 1-6.
Zulkepali, M., H. Hashim, Y. Omar, I. Abidin and S. Yusof, 2010. "An Evaluation on Transient Stability of Power System using Transient Stability in Static and Dynamic Environment," in APACEEE2010, CIRED, Kuala Lumpur, Malaysia.