Embed Size (px)
Citation preview

CFR Working Paper NO. 11-01
The Role of Hedge Funds as Primary Lenders
V. Agarwal • C. Meneghetti
1
The Role of Hedge Funds as Primary Lenders
Vikas Agarwal Georgia State University
Costanza Meneghetti West Virginia University
Forthcoming in the Review of Derivatives Research
Abstract We examine the role of hedge funds as primary lenders to corporate firms. We investigate both the reasons and the implications of hedge funds’ activities in the primary loan market. We examine the characteristics of firms that borrow from hedge funds and find that borrowers are primarily firms with lower profitability, lesser credit quality, and higher asymmetric information. Our results suggest that hedge funds serve as lenders of last resort to firms that may find it difficult to borrow from banks or issue public debt. We also examine the effect of hedge fund lending on the borrowing firms and find that borrowers’ profitability and creditworthiness improve subsequent to the loan. This beneficial effect of hedge fund lending is corroborated by our finding of positive abnormal returns for borrowers’ stocks around the loan announcement date. Overall, our findings are consistent with hedge funds adding value through their lending relationships and financial markets perceiving these activities as good news for the firms.
___________________________________________ Vikas Agarwal is from Georgia State University, Robinson College of Business, 35, Broad Street, Suite 1221, Atlanta GA 30303, USA: e-mail: [email protected] Tel: +1-404-413-7326, Fax: +1-404-413-7312. Vikas Agarwal is also a Research Fellow at the Centre for Financial Research (CFR), University of Cologne. Costanza Meneghetti is from West Virginia University, 1601 University Ave., Room 214, Morgantown, WV 26506-6025, USA: e-mail: [email protected] Tel: +1-304-293-7889, Fax: +1-304-293-5652. We are grateful to Rajesh Aggarwal, Gerald Gay, Wei Jiang, Jayant Kale, and Ilya Strebulaev for their comments. We are grateful for financial support from the BNP Paribas Hedge Fund Centre at HEC Paris. Meneghetti also acknowledges the financial support from the WVU Senate Summer Grant and the WVU College Research and Library Committee Grant. We are thankful to Linlin Ma for excellent research assistance. We are responsible for all errors.

2
The Role of Hedge Funds as Primary Lenders
The main purpose of this study is to investigate the role of hedge funds as primary
lenders. In recent years, hedge funds have been providing significant amount of capital to
companies in need of cash, and are emerging as an alternative financing source.1 In this paper,
we address three issues. First, we examine the characteristics of firms that turn to hedge funds,
instead of going to the banks or the public market, for their financing needs. Second, we study
the effect of hedge fund lending on the borrowers. Finally, we examine the abnormal returns of
the borrower’s stock around the loan announcement date.
There can be several reasons for hedge funds’ lending capital to firms. First, hedge funds
may be lending to a distressed firm to make a “cheap” bet on the firm’s recovery. This can allow
them to influence important decisions related to future firm value by serving on committees as
powerful creditors or changing the company’s management and board, operational strategies,
asset holdings or capital structure (Harner [2008]). Second, as lenders, hedge funds may obtain
more frequent information in the form of monthly financial updates as opposed to shareholders
and debtholders who may only receive quarterly reports.
We use Factiva to hand-collect data on a sample of 42 firms that borrow capital from 13
hedge funds for the period 1999-2006. We compare the firms borrowing from hedge funds with
those that either receive bank loans or issue public debt on three major attributes – profitability,
creditworthiness, and asymmetric information. Using different measures of these attributes, we
find that firms borrowing from hedge funds have lower profitability, lesser creditworthiness, and
higher asymmetric information compared to firms borrowing from banks or through the public 1 Although there is no data on the exact amount of loans owned by hedge funds, institutions as a group bought $224 billion of loans in 2005 compared with $50 billion in 2000 according to Reuters Loan Pricing Corporation (Anderson [2006]).

3
debt market. Interestingly, this finding complements the work of Brophy, Ouimet, and Sialm
[2009], which shows that hedge funds participate in private placements of firms with poor
fundamentals and greater information asymmetry.
Next, we examine the effect of hedge fund lending on the borrowing firms by studying
the changes in the borrowers’ characteristics one and two years after the loan. We find that
subsequent to receiving loans from hedge funds, there is an improvement in the borrowing firms’
profitability and asymmetric information. To corroborate this beneficial effect of hedge fund
lending, we examine the abnormal returns of the borrowing firms around the announcement
dates of the hedge fund loans. Intuitively, hedge funds can profit from lending if the borrowers
improve their profitability and creditworthiness and are eventually able to pay back the loan.
Thus, we expect borrowers’ firm value to increase after the loan. If this indeed is the case,
investors should perceive the news of hedge fund loans as good news and we should observe
positive abnormal returns for the borrowers’ stock around the date of the loan. Consistent with
this hypothesis, we find that the abnormal returns are positive and significant prior to the loan
announcement date.
Overall, our study makes two important contributions to the extant literature. First, it
shows how hedge funds can emerge as lenders of last resort for financially distressed firms that
are perhaps unable to raise money through the conventional means (typically borrowing from
banks or issuing public debt). Second, it provides new evidence on a hitherto unexplored subject
of hedge funds adding value to the borrowers through their activities in the primary loan market.
Literature review
Our paper is related to the recent literature analyzing the role of non-bank financial
institutions as primary lenders. Massoud, Nandy, Saunders, and Song [2010] investigate the

4
potential conflicts of interest that arise from hedge funds’ dual holdings of loans and short
positions in the equity of borrowing firms. Similarly, Jiang, Li, and Shao [2010] analyze the
simultaneous holding of both equity and debt claims of the same company by non-bank
institutional investors. Ivashina and Sun [2010] study the use of private information disclosed by
the borrowers during loan negotiations to benefit by simultaneously trading in public securities.
Finally, Brophy, Ouimet, and Sialm [2009], find that hedge funds are involved in private
investments in public equity (PIPES) of distressed firms with pronounced information
asymmetry. Our paper contributes to this emerging literature by examining hedge funds’ foray in
the primary loan market, its implications for borrowing firms, and market’s reaction to hedge
fund lending.
Data and variable definitions
Data
Information on loans initiated by hedge funds is not readily available. We use Factiva to
collect news articles on hedge fund-initiated loans for the period 1999-2006. We conduct several
checks to ensure that the loan initiators in our sample are indeed hedge funds. First, we use the
list of hedge funds in the comprehensive database used in Agarwal, Daniel, and Naik [2009] to
match with those found in the news articles from Factiva. Second, we follow Agarwal, Fos, and
Jiang [2010] to also check the websites of the hedge fund companies and their being listed by
industry publications such as Hedge Fund Group (HFG), Barron’s, Alpha Magazine, and
Institutional Investors. After finalizing the sample of hedge fund loans, we match this hand-
collected dataset with COMPUSTAT to retrieve information on the borrower firms’
characteristics using the first statement available at least two months prior to the loan date.
Exhibit 1 shows the composition of our sample. Our sample consists of 44 loans by 13 hedge
5
funds lending to 42 firms, out which 24 are public companies, 17 are traded in the OTC markets,
and one is not traded.2
Variable definitions
We compare three dimensions of firms that borrow from hedge funds with firms that
either borrow from banks or issue public debt. These dimensions are profitability,
creditworthiness, and asymmetric information.
Measures of profitability
We use three different measures of firm’s profitability: ROA (the ratio of the operating
income before depreciation to total assets), Cash Flow (sum of income before extraordinary
items and depreciation divided by total assets), and Loss (an indicator variable that equals 1 if the
operating income is negative, and 0 otherwise). Higher ROA and higher cash flows as well as
Loss variable being zero all correspond to greater profitability.
Measures of creditworthiness
We employ four different proxies for creditworthiness of the firms. Leverage is the sum
of the firm’s book value of long term debt and debt in current liabilities divided by the sum of
the book value of debt and market value of common equity. Interest Coverage is defined as
operating income before depreciation divided by interest expense, and measures the firm’s
ability to pay back its lenders. Z-Score is computed as (1.2*Working Capital+1.4*Retained
Earnings+3.3*Operating Income before Interest + Sales) / Total Assets as in Altman [1977].
Finally, Distance-to-default is measured as in Vassalou and Xing [2004], and refers to the
number of standard deviation decreases in firm value before it drops to the face value of debt
2 The number of loans slightly exceeds the number of borrowers as there are instances of repeated borrowing by a couple of firms. Information about the loan size and syndication is too sparse in the news articles for us to draw any meaningful inferences. Hence, we refrain from discussing incomplete information about the loans.

6
(i.e., the firm is in default). Higher Leverage, lower Interest Coverage, lower Z-score, and lower
Distance-to-default are associated with higher financial distress.
Measures of information asymmetry
We use several proxies for asymmetric information that include (a) Size, defined as the
book value of the firm’s total assets, (b) Tangibility, measured as the firm’s net property, plant,
and equipment scaled by its total assets, (c) ROA Volatility (Sales Growth Volatility), defined as
the standard deviation of firm’s ROA (Sales Growth) over the previous 6 years for which we
include all firms that have at least three observations for ROA (Sales Growth), (d) Illiquidity,
defined as in Amihud [2002] as the yearly average of the square root of |return| / (price ×
volume)3, (e) the number of analysts following the firm from I/B/E/S database where the analysts
make at least one recommendation on the firm during the year, (f) R&D Intensity and Capital
Intensity, defined as the R&D expense and capital expenditures scaled by the firm’s total assets,
(g) Analysts Forecast Dispersion computed as the standard deviation of analyst forecasts, and (h)
Analysts Forecast Error defined as | (mean EPS analyst forecasts - actual EPS) / actual EPS |.
Control Variables
In addition to focusing on the borrowing firms’ profitability, creditworthiness, and
information asymmetry, we control for several firm characteristics including (a) firms’ growth
opportunities as measured by Tobin’s Q ( book value of assets minus book value of common
equity plus market value of common equity, divided by book value of assets), (b) firms’ age,
defined as the number of years the firm has been in the COMPUSTAT database, and (c) the
sales-based Herfindahl Index, measured as the sum of the squared market share of each firm in
the 6-digit NAICS code industry.
Distinguishing characteristics of firms borrowing from hedge funds 3 This is essentially an empirical analogue to the inverse of Kyle’s [1985] lambda, or the inverse of market depth.

7
Next, we examine how firms borrowing from hedge funds (henceforth case firms) are
different from those that receive bank loans or issue public debt (henceforth control firms). The
objective of this exercise is to identify the reasons behind these firms turning to hedge funds for
financing.
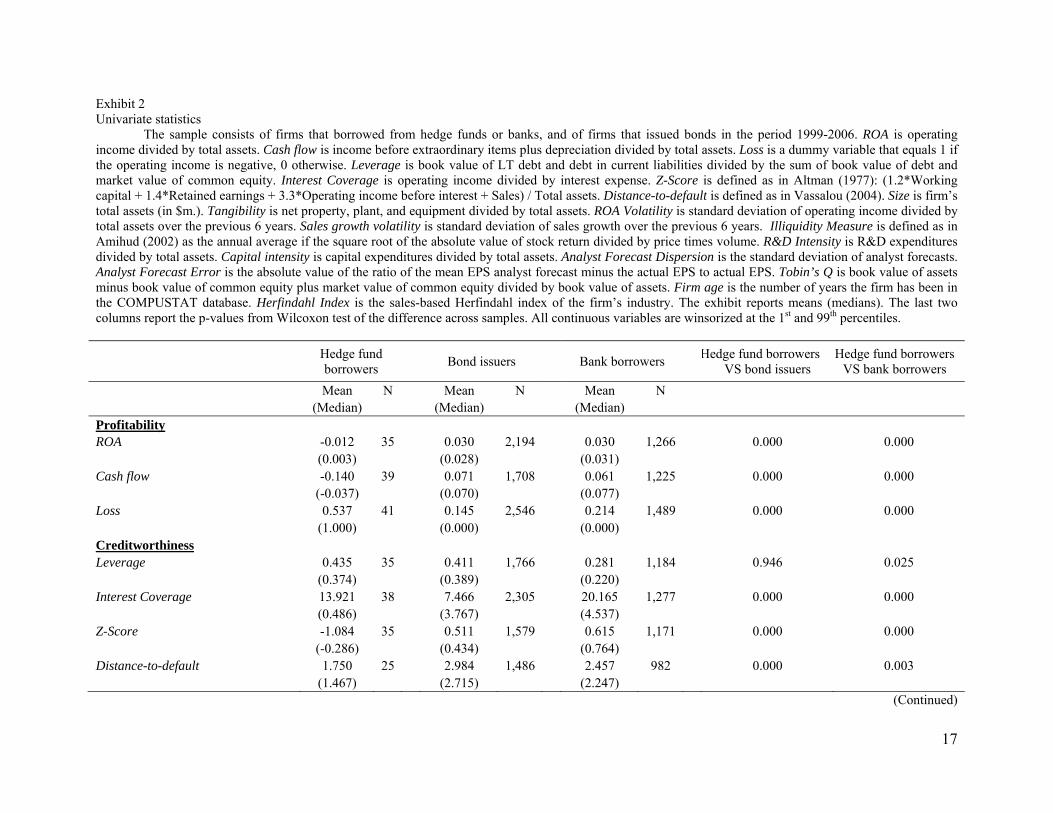
Exhibit 2 reports the mean and median firm characteristics for case and control firms.
Given the small sample size of the case firms, we focus on comparing the medians of firm
characteristics and discuss the results from the nonparametric Wilcoxon signed-rank test. We
compare case and control firms on three major attributes — profitability, creditworthiness, and
asymmetric information. Results in Exhibit 2 show that case firms that borrow from hedge funds
are significantly less profitable than control firms that either issue public debt or borrow from
banks. The median ROA for case firms is 0.003 and is significantly lower (at the 1% level) than
the median ROA for both types of control firms (0.028 for firms issuing public debt and 0.031 for
firms borrowing from banks). We obtain a similar result for our other two measures of
profitability — Cash Flow and Loss dummy. Exhibit 2 shows that the median cash flow of firms
(as a fraction of firm’s total assets) borrowing from hedge funds is negative (−0.037) and is
lower than the cash flow of the two types of control firms, both of which have positive median
cash flows (0.070 and 0.077).
Next, we compare the creditworthiness of case firms and control firms using four
different measures of creditworthiness – Leverage, Interest Coverage, Z-Score, and Distance-to-
default. Hedge fund borrowers have significantly higher median Leverage than that of bank
borrowers (0.374 versus 0.220). There is, however, no significant difference in the median
Leverage of hedge fund borrowers and bond issuers. Firms borrowing from hedge funds also
have a significantly lower median Interest Coverage compared to both bond issuers and bank

8
borrowers (0.486 versus 3.767 and 4.537 respectively). Furthermore, hedge fund borrowers
exhibit significantly lower median Z-Score when compared to bond issuers and bank borrowers
(−0.286 versus 0.434 and 0.764), and also have significantly lower Distance to-Default (1.467
versus 2.715 and 2.247). Overall, based on all four measures of creditworthiness, hedge fund
borrowers turn out to be of lower credit quality.
The results so far suggest that firms borrowing from hedge funds are characterized by a
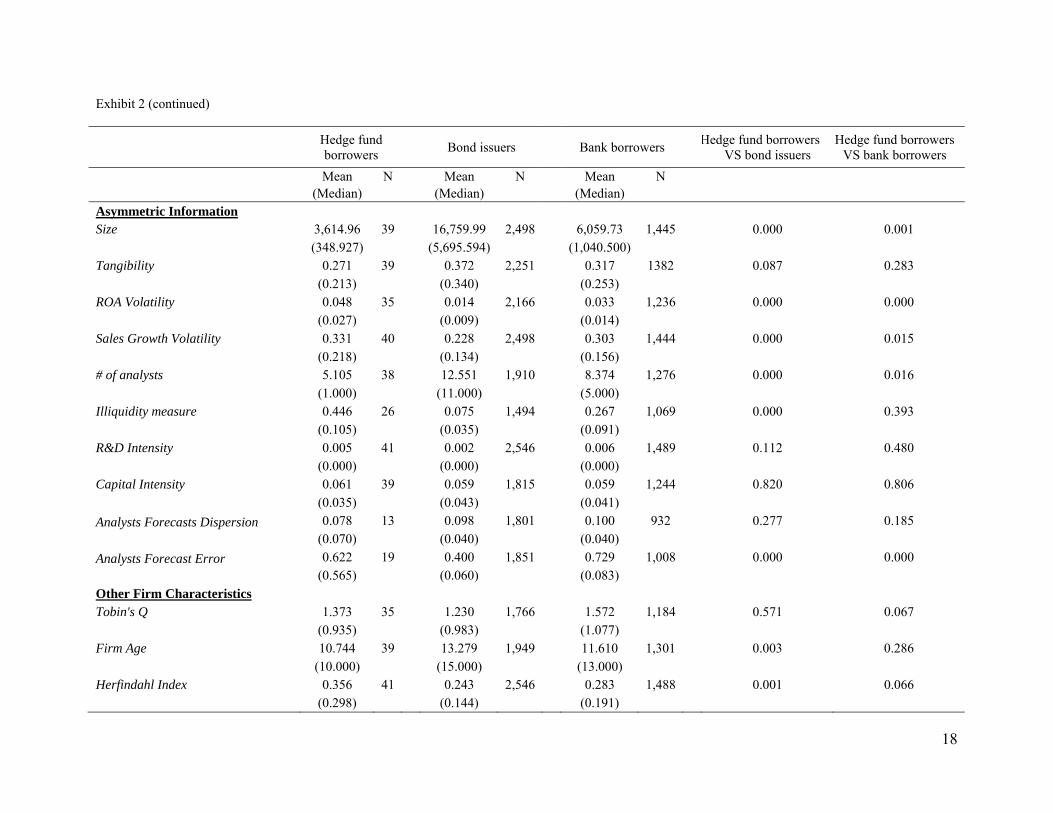
significantly lower profitability and lower credit quality in contrast to control firms. Finally, we
compare case and control firms on asymmetric information. Results in Exhibit 2 show that firms
borrowing from hedge funds are smaller (median size of $349 million compared to $5.7 billion
and $1.0 billion for bond issuers and bank borrowers), have higher ROA Volatility (median value
of 0.027 versus 0.009 for bond issuers and 0.014 for bank borrowers) and Sales Growth
Volatility (median of 0.218 compared to 0.134 and 0.156 for bond issuers and bank borrowers),
and have fewer analysts following the firm when compared to both bond issuers and bank
borrowers (median of 1 analyst versus 11 and 5 analysts for the two types of control firms). Case
firms also have lower median Tangibility although the difference is significant only vis-à-vis
bond issuers. Furthermore, firms borrowing from hedge funds are less liquid when compared to
bond issuers (median Amihud illiquidity measure of 0.105 versus 0.035). However, there are no
significant differences between the case firms and control firms for either R&D Intensity or
Capital Intensity. Finally, hedge fund borrowers exhibit higher Analysts Forecast Error. Taken
together, these results suggest that there is significantly greater asymmetric information in firms
borrowing from hedge funds.
Exhibit 2 shows that firms that borrow from hedge funds are significantly smaller than
firms that borrow from banks and bond issuers. This suggests that the relationship between size

9
and choice of financing source could be endogenous. As the median size of a hedge fund is
typically around $25 million (see Agarwal, Daniel, and Naik [2009]), hedge funds may not be
able to provide enough capital to large companies, who then have to either issue debt or
negotiate a syndicated bank loan. In an attempt to control for this potential endogeneity, we
match each case firm with a control firm (bank borrower or a bond issuer) by year, industry at
the 2-digit NAICS code level, and size. We perform a one-to-one caliper match to eliminate poor
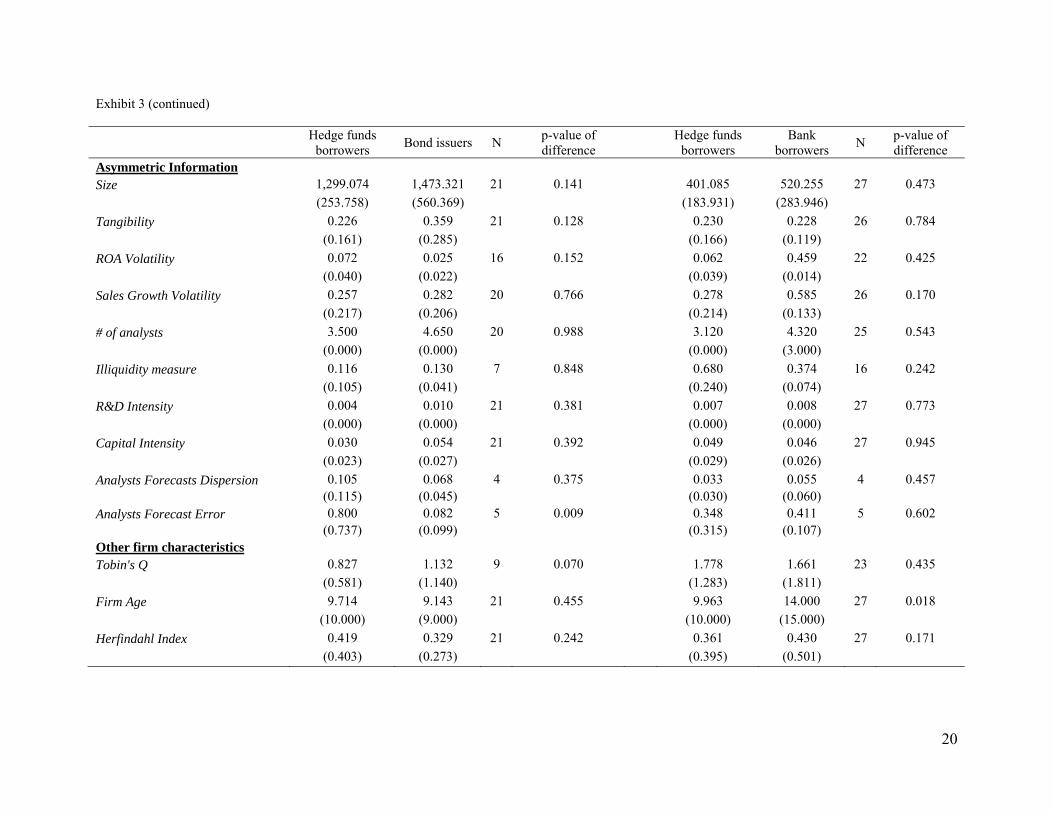
matches. Exhibit 3 reports the comparison of firm characteristics for the matched samples.
Notice that Size is now not significantly different across the three samples. Results do not change
significantly in terms of profitability and creditworthiness: ROA and Cash Flow continue to be
lower for hedge fund borrowers, while the percentage of firms with negative operating income is
higher when compared to both matched bond issuers and bank borrowers. Thus, case firms still
exhibit lower profitability, even after controlling for size effects. Leverage is not significantly
different across samples, while hedge fund borrowers still exhibit lower median Interest
Coverage, Z-Score, and Distance-to-Default than control firms. However, our measures of
asymmetric information are now not significantly different across the samples, with the
exception of Analysts Forecast Error, which is still greater for hedge fund borrowers when
compared to bond issuers. Since firm size itself is an important proxy for asymmetric
information and in Exhibit 3 we force the case and control firms to be of similar size, we believe
we are unlikely to observe significant differences in asymmetric information between the two
types of firms. Overall, the univariate results in Exhibits 2 and 3 confirm the role of hedge funds
as, primarily, lenders of last resort to firms with lower profitability, lower credit quality, and
greater asymmetric information.
10
We next extend this analysis to a multivariate setting by examining the determinants of
the firm’s decision to borrow from hedge funds. For this purpose, we estimate two separate
logistic regressions of the type of loan (hedge fund loan versus public debt, and hedge fund loan
versus bank loan) on firm’s characteristics. The first column of Exhibit 4 presents the results
from the logistic regression where the dependent variable takes a value of 1 if the lender is a
hedge fund and 0 if the firm issues a public bond. The coefficient on ROA is negative (−74.315)
and significant at the 1% level, which confirms our finding from the univariate analysis that
firms are more likely to borrow from hedge funds when they are less profitable.4 The positive
and negative coefficients on Leverage and Z-Score (5.032 and −2.242 respectively) also indicate
that firms that are less creditworthy (i.e., more levered and lower Z-score) are more likely to
borrow from hedge funds rather than issue public bonds. Finally, the negative coefficients on
Size and Tangibility suggest that asymmetric information is also a determinant of the financing
choice. Smaller firms (coefficient on logarithm of size being −0.725 and significant at the 1%
level) with fewer tangible assets (coefficient on tangibility being –7.095 and significant at the
5% level) are likely to have greater asymmetric information concerns and these are the types of
firms that use hedge funds for financing purposes.
In the second column of Exhibit 4, we use a different dependent variable, which now
takes a value of 1 if the lender is a hedge fund and 0 if the lender is a bank. We find qualitatively
similar results with each of the independent variables showing the same signs for the slope
coefficients as before. However, with the exception of ROA, Leverage, and Tangibility, the
4 We get similar results using the other two proxies for profitability: Cash Flow and Loss dummy. We do not include multiple proxies of profitability, creditworthiness, and asymmetric information in the multivariate regression due to multicollinearity concerns. Given our small sample, our final choices of proxies for each of these dimensions are those that have the maximum number of observations. For robustness, we repeat the regressions using alternative proxies and find similar results.

11
coefficients for other variables are not significant, perhaps due to a significant drop in the sample
size (663 firm-years instead of 1,148 firm-years in the earlier case).
Taken together, findings from both the univariate and multivariate analyses indicate that
less profitable firms with lower credit quality and greater information asymmetry obtain loans
from hedge funds.
Change in firm characteristics subsequent to borrowing from hedge funds
Next, we study the effect of hedge fund lending on the borrowing firms by examining the
changes in borrowers’ characteristics between one year prior to the loan to (a) one year after the
loan, and (b) two years after the loan. Following Barber and Lyon [1996], to control for mean
reversion of hedge fund borrowers upon survival, we match each of them with a COMPUSTAT
firm having the closest ROA (within the same 2-digit NAICS code industry) the year before the
hedge fund loan.5 We then compare the differences in firm characteristics between hedge fund
borrowers and control COMPUSTAT firms one year before, one year after, and two years after
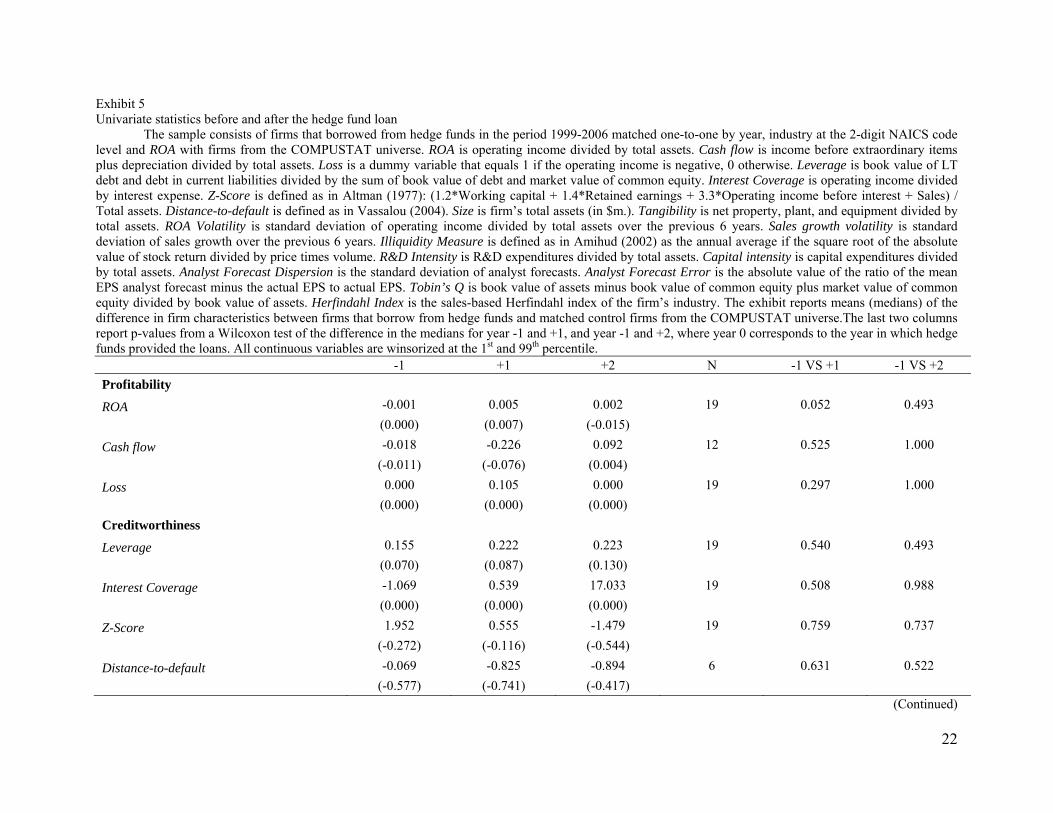
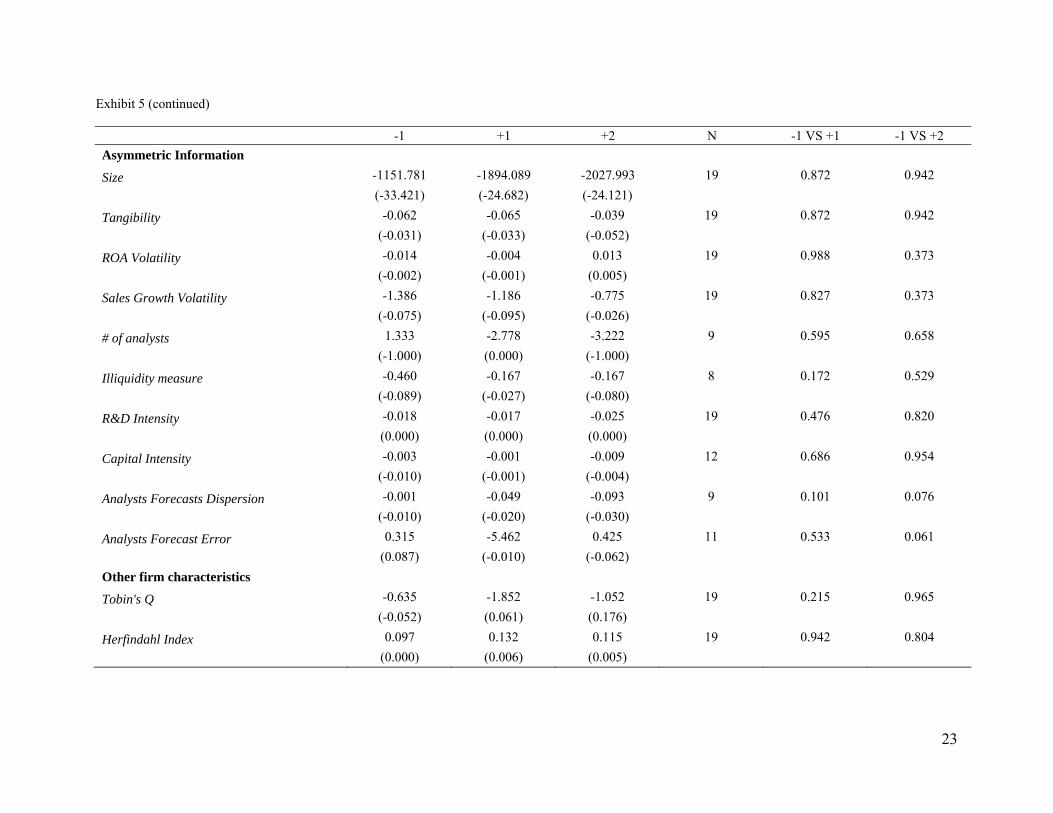
the hedge fund loan. Exhibit 5 reports the results. Despite the small sample and short time period
for which we conduct our analysis, Exhibit 5 shows that after the hedge fund loan there is an
improvement in the borrowing firms’ ROA in the first year after the event. Further, both Analysts
Forecasts Dispersion and Analysts Forecasts Error significantly diminish two years after the
hedge fund loan, indicating a reduction in information asymmetry. These results suggest that
borrowing from hedge funds helps improve these firms’ profitability and information
asymmetry.6
Market reaction to firms borrowing from hedge funds
5 We perform a one-to-one caliper match to eliminate poor matches. 6 In our sample, 4 firms did not survive for two years after the hedge fund loan, and are therefore not included in the event study in Exhibit5. Given the small number of bankrupted firms, the attrition rate is unlikely to severely bias our results.

12
If the firms borrowing from hedge funds benefit in terms of profitability and
creditworthiness, a natural question to ask is whether there is a positive market reaction to hedge
funds lending to these firms. In this section, we address this question by examining the abnormal
returns of the case firms around the announcement date of the hedge fund loan. We use the Fama
and French [1993] three-factor model (which controls for size and book-to-market, in addition to
the market) for estimating the abnormal returns.7 To avoid confounding effects, we eliminate
firms that borrow money from any source within three months before and after the hedge fund
loan. Intuitively, hedge funds can profit from lending if the borrowers improve their profitability
and creditworthiness and are eventually able to pay back the loan. Thus, we expect borrowing
firms’ value to increase after the loan. If this indeed is the case, we also expect investors to
perceive the news of a hedge fund loan as good news. Therefore, we expect to observe positive
abnormal returns for the borrower’s stock around the date of the loan (event date). Consistent
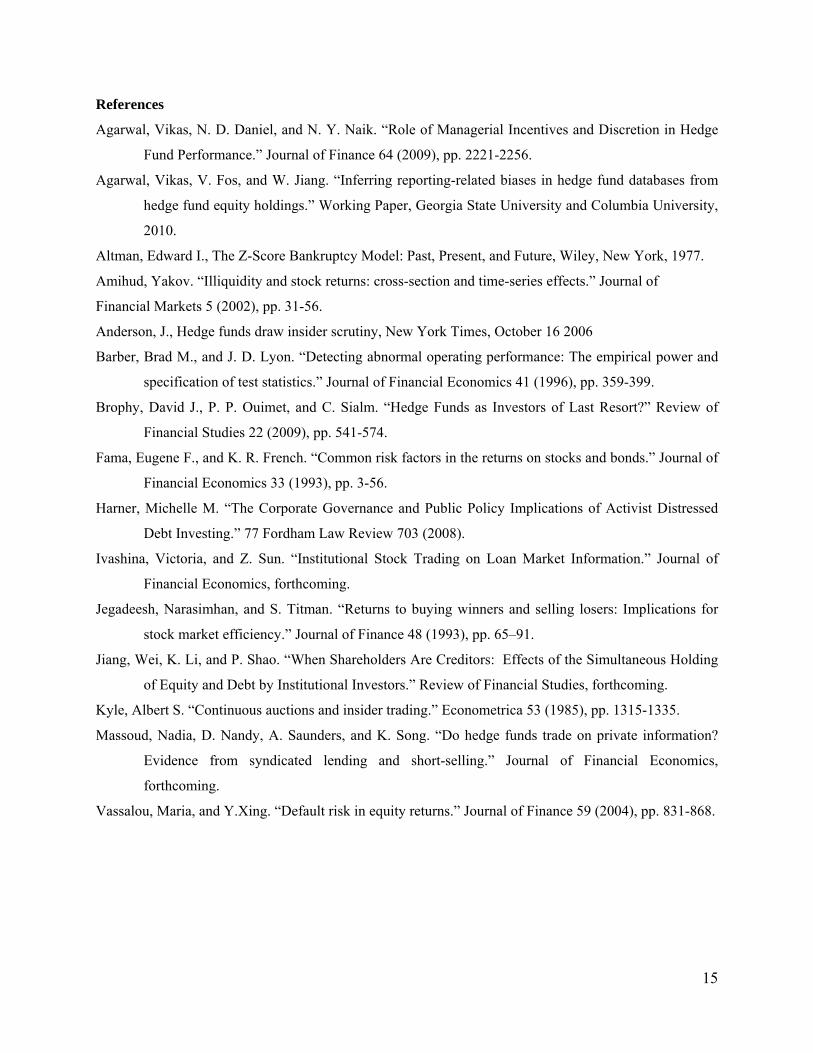
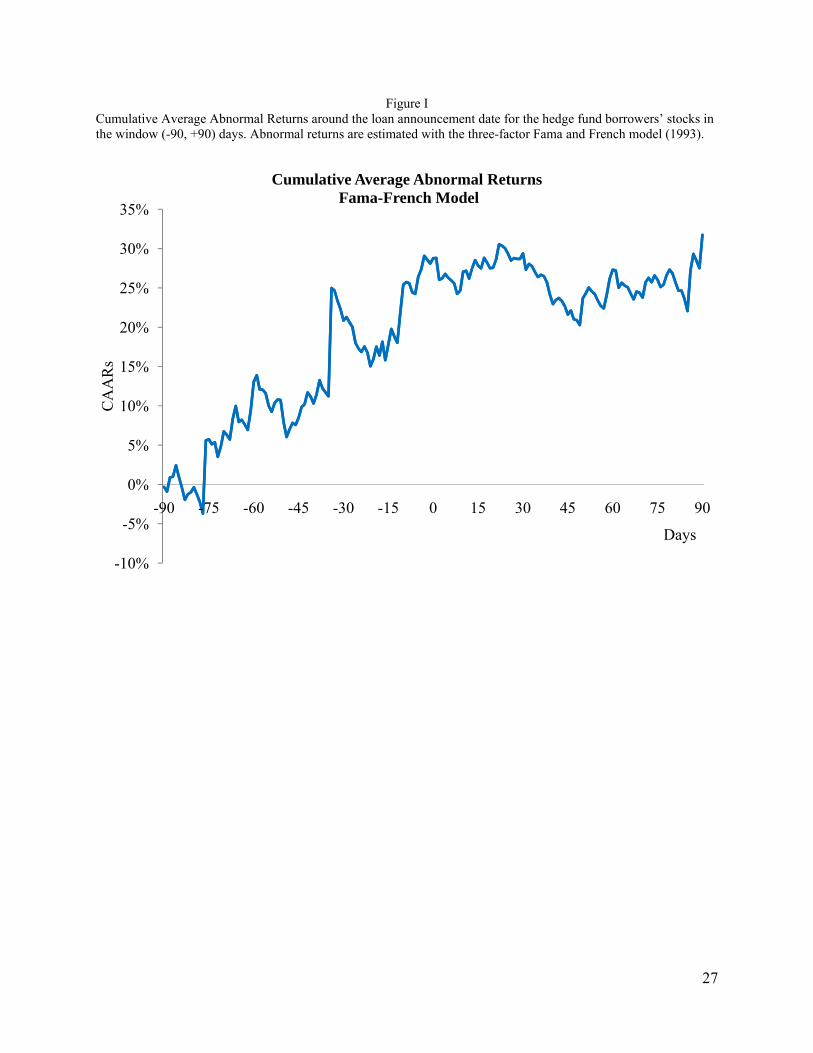
with this hypothesis, Figure 1 shows that the cumulative average abnormal returns (CAAR) are
positive before the event date.
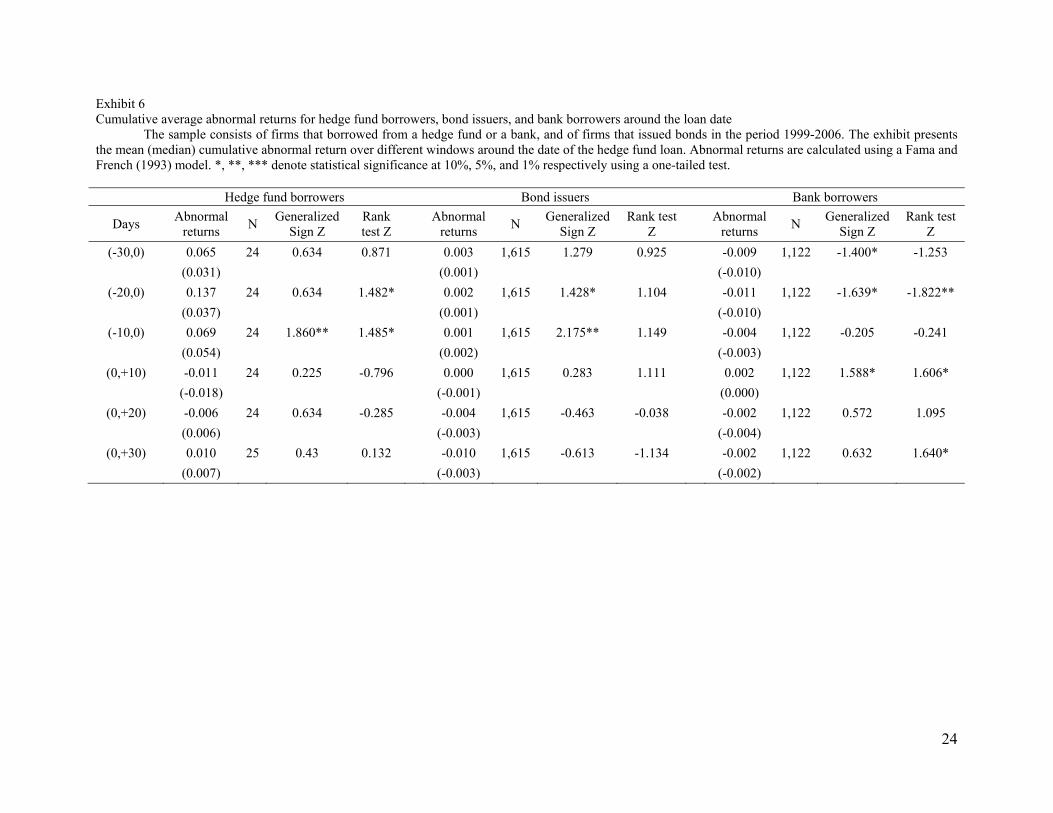
Exhibit 6 presents means (medians) of cumulative average abnormal returns (CAAR) for
case and control firms in different windows around the event date. The first column reports
significant mean (median) CAAR of 0.137 8 (0.037) over a 20-day window, and 0.069 (0.054)
over a 10-day window before the event. Thus, hedge fund loans are perceived as good news by
investors. For bond issuers, CAAR are positive in the 10-day and 20-day windows although the
magnitude is much smaller than that for hedge fund borrowers (e.g., mean (median) CAAR of
0.001 (0.002) compared to 0.069 (0.054) for 10-day window). CAAR of bank borrowers exhibit
an altogether different pattern: mean (median) CAAR is significantly negative over the 10-day
7 We also include the Jegadeesh and Titman [1993] momentum factor for computing the abnormal returns and find qualitatively similar results (not reported). 8 Throughout the paper we report the CAAR in decimals. For instance, a CAAR of 0.137 is equal to 13.7%.

13
window (-0.004 (-0.003)) and 20-day window (-0.011 (-0.010)) before the loan. Overall, the
results in Exhibit 6 suggest that large positive CAAR over the 10-day and 20-day windows
before the hedge fund loan are distinct from CAAR observed in case of bank borrowers and bond
issuers.
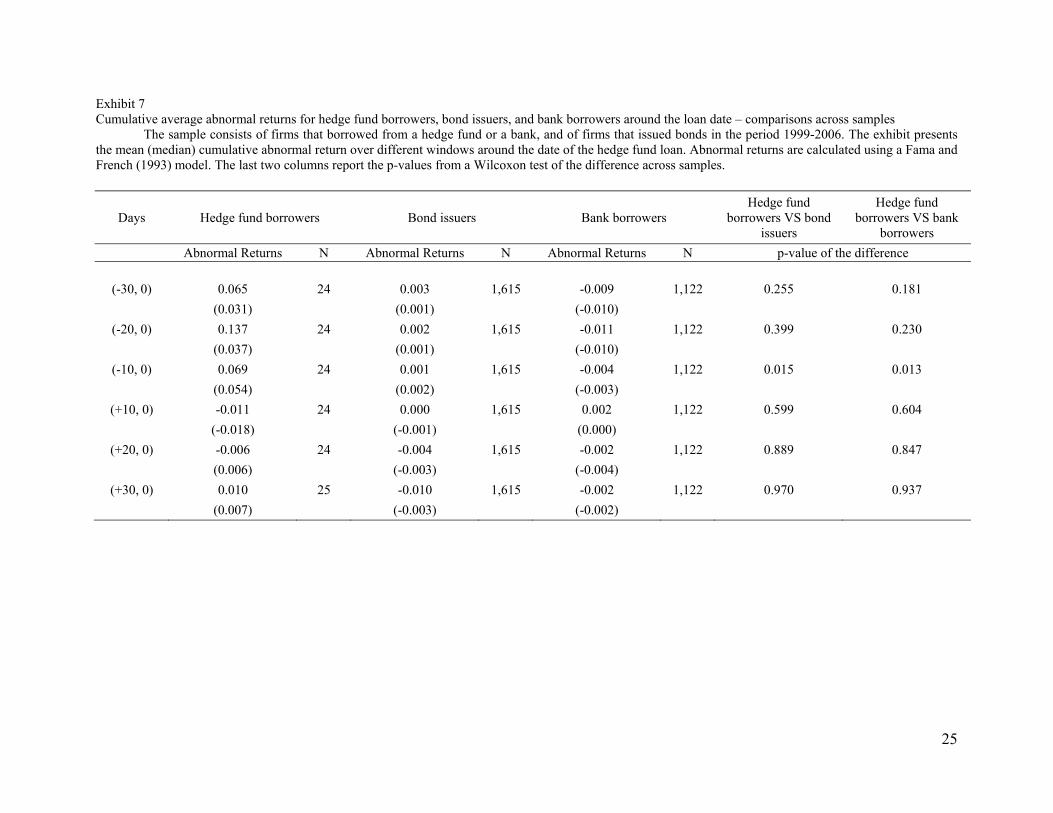
We formally test if CAAR for hedge fund borrowers are greater than the CAAR for the
two types of control firms (bank borrowers and bond issuers), and report the results in Exhibit 7.
We find that hedge fund borrowers indeed experience a significantly higher CAAR in the 10-day
window when compared to either bond issuers or to bank borrowers. Results from Exhibits 6 and
7 seem to indicate that a hedge fund loan is perceived as good news, more so than a bond issue
or a bank loan.
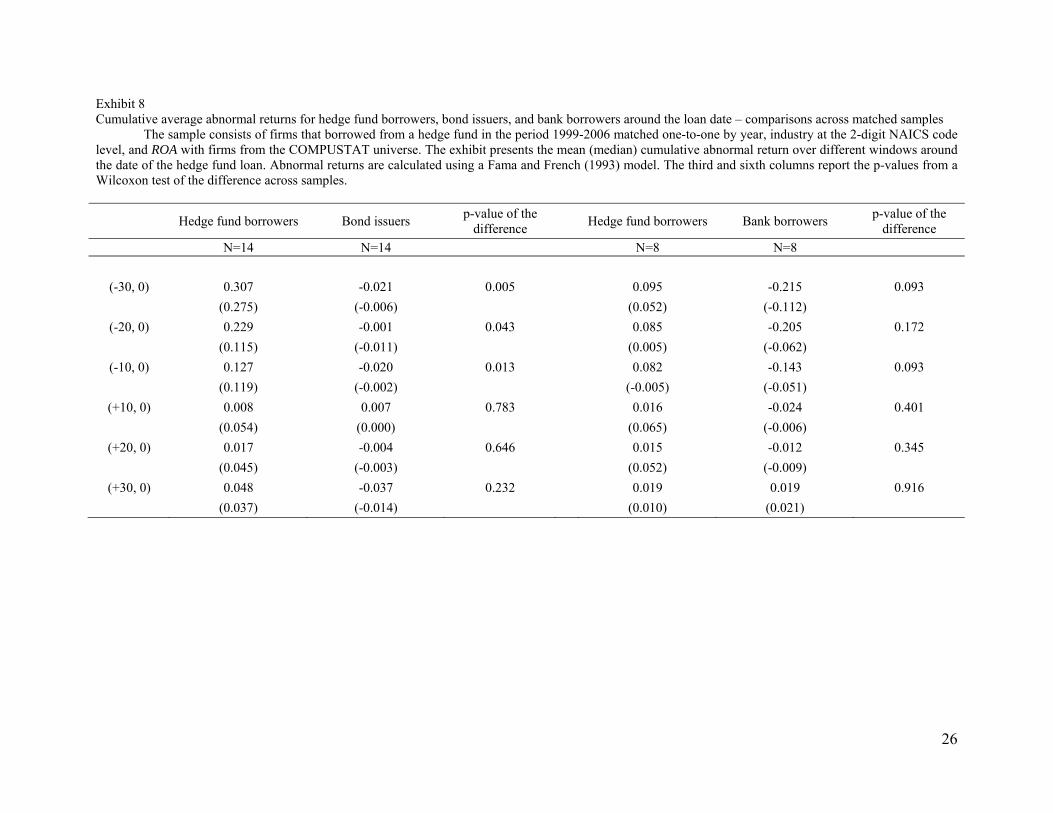
If hedge funds provide financing to financially distressed firms that are unable to either
issue bonds or obtain bank loans, the results from Exhibits 6 and 7 can be explained by mean
reversion in the performance of surviving firms. To control for this potential bias, we match
hedge fund borrowers with bond issuers and bank borrowers by industry, year, and ROA (again
following Barber and Lyon [1996]) and compute CAAR around the event date on the matched
sample. Results are presented in Exhibit 8. Hedge fund borrowers now outperform bond issuers
in terms of CAAR over the 10-day, 20-day, and 30-day windows before the event (p-value of
difference being 0.013, 0.043, and 0.005 respectively). When compared to bank borrowers,
hedge fund borrowers again exhibit higher CAAR over the three windows, although the
difference is significant only for the 10-day and 30-day windows. Results from Exhibit 8
corroborate our earlier finding about stronger positive market reaction to hedge fund loans.
Taken together, the findings in Exhibits 6 to 8 indicate that the market views hedge fund
loans positively, much more compared to firms issuing bonds or borrowing from banks. These

14
results also substantiate our finding improvement in profitability of firms subsequent to their
obtaining loans from hedge funds.
Conclusion
In this paper, we study hedge funds that act as primary lenders. The main objective of our
analysis is to understand the type of firms that turn to hedge funds for their external financing
needs and to analyze the effect of hedge fund lending on the borrowers. We find that firms that
borrow from hedge funds are less profitable, less creditworthy, and have higher information
asymmetry than firms that either issue public debt or request a bank loan. The unique
characteristics of firms borrowing from hedge funds seem to support the idea that hedge funds
are lenders of last resort.
Hedge funds can profit from their lending activities by improving the borrowers’ firm
value and profitability, which presumably enable these firms to pay back the loan. We find
supporting evidence on the positive effect of hedge fund loans on the borrowers. We observe that
borrowers’ profitability and creditworthiness do improve one and two years after the loan.
Consistent with this beneficial aspect of hedge fund lending, we find positive abnormal returns
before the loan date, indicating that investors respond favorably to hedge fund loans.
15
References
Agarwal, Vikas, N. D. Daniel, and N. Y. Naik. “Role of Managerial Incentives and Discretion in Hedge
Fund Performance.” Journal of Finance 64 (2009), pp. 2221-2256.
Agarwal, Vikas, V. Fos, and W. Jiang. “Inferring reporting-related biases in hedge fund databases from
hedge fund equity holdings.” Working Paper, Georgia State University and Columbia University,
2010.
Altman, Edward I., The Z-Score Bankruptcy Model: Past, Present, and Future, Wiley, New York, 1977.
Amihud, Yakov. “Illiquidity and stock returns: cross-section and time-series effects.” Journal of
Financial Markets 5 (2002), pp. 31-56.
Anderson, J., Hedge funds draw insider scrutiny, New York Times, October 16 2006
Barber, Brad M., and J. D. Lyon. “Detecting abnormal operating performance: The empirical power and
specification of test statistics.” Journal of Financial Economics 41 (1996), pp. 359-399.
Brophy, David J., P. P. Ouimet, and C. Sialm. “Hedge Funds as Investors of Last Resort?” Review of
Financial Studies 22 (2009), pp. 541-574.
Fama, Eugene F., and K. R. French. “Common risk factors in the returns on stocks and bonds.” Journal of
Financial Economics 33 (1993), pp. 3-56.
Harner, Michelle M. “The Corporate Governance and Public Policy Implications of Activist Distressed
Debt Investing.” 77 Fordham Law Review 703 (2008).
Ivashina, Victoria, and Z. Sun. “Institutional Stock Trading on Loan Market Information.” Journal of
Financial Economics, forthcoming.
Jegadeesh, Narasimhan, and S. Titman. “Returns to buying winners and selling losers: Implications for
stock market efficiency.” Journal of Finance 48 (1993), pp. 65–91.
Jiang, Wei, K. Li, and P. Shao. “When Shareholders Are Creditors: Effects of the Simultaneous Holding
of Equity and Debt by Institutional Investors.” Review of Financial Studies, forthcoming.
Kyle, Albert S. “Continuous auctions and insider trading.” Econometrica 53 (1985), pp. 1315-1335.
Massoud, Nadia, D. Nandy, A. Saunders, and K. Song. “Do hedge funds trade on private information?
Evidence from syndicated lending and short-selling.” Journal of Financial Economics,
forthcoming.
Vassalou, Maria, and Y.Xing. “Default risk in equity returns.” Journal of Finance 59 (2004), pp. 831-868.

16
Exhibit 1 Sample descriptions
The case sample consists of 42 firms that received loans from 13 hedge funds in the period 1999-2006.
Sample Description Number of loans 44 Number of firms 42 Number of publicly traded firms 24 Number of firms trading on the OTC 17 Number of non-traded firms 1 Number of hedge funds 13
17
Exhibit 2 Univariate statistics
The sample consists of firms that borrowed from hedge funds or banks, and of firms that issued bonds in the period 1999-2006. ROA is operating income divided by total assets. Cash flow is income before extraordinary items plus depreciation divided by total assets. Loss is a dummy variable that equals 1 if the operating income is negative, 0 otherwise. Leverage is book value of LT debt and debt in current liabilities divided by the sum of book value of debt and market value of common equity. Interest Coverage is operating income divided by interest expense. Z-Score is defined as in Altman (1977): (1.2*Working capital + 1.4*Retained earnings + 3.3*Operating income before interest + Sales) / Total assets. Distance-to-default is defined as in Vassalou (2004). Size is firm’s total assets (in $m.). Tangibility is net property, plant, and equipment divided by total assets. ROA Volatility is standard deviation of operating income divided by total assets over the previous 6 years. Sales growth volatility is standard deviation of sales growth over the previous 6 years. Illiquidity Measure is defined as in Amihud (2002) as the annual average if the square root of the absolute value of stock return divided by price times volume. R&D Intensity is R&D expenditures divided by total assets. Capital intensity is capital expenditures divided by total assets. Analyst Forecast Dispersion is the standard deviation of analyst forecasts. Analyst Forecast Error is the absolute value of the ratio of the mean EPS analyst forecast minus the actual EPS to actual EPS. Tobin’s Q is book value of assets minus book value of common equity plus market value of common equity divided by book value of assets. Firm age is the number of years the firm has been in the COMPUSTAT database. Herfindahl Index is the sales-based Herfindahl index of the firm’s industry. The exhibit reports means (medians). The last two columns report the p-values from Wilcoxon test of the difference across samples. All continuous variables are winsorized at the 1st and 99th percentiles.
Hedge fund borrowers
Bond issuers Bank borrowers Hedge fund borrowers
VS bond issuers Hedge fund borrowers
VS bank borrowers
Mean N Mean N Mean N (Median) (Median) (Median) Profitability ROA -0.012 35 0.030 2,194 0.030 1,266 0.000 0.000
(0.003) (0.028) (0.031) Cash flow -0.140 39 0.071 1,708 0.061 1,225 0.000 0.000
(-0.037) (0.070) (0.077) Loss 0.537 41 0.145 2,546 0.214 1,489 0.000 0.000
(1.000) (0.000) (0.000) Creditworthiness Leverage 0.435 35 0.411 1,766 0.281 1,184 0.946 0.025
(0.374) (0.389) (0.220) Interest Coverage 13.921 38 7.466 2,305 20.165 1,277 0.000 0.000
(0.486) (3.767) (4.537) Z-Score -1.084 35 0.511 1,579 0.615 1,171 0.000 0.000
(-0.286) (0.434) (0.764) Distance-to-default 1.750 25 2.984 1,486 2.457 982 0.000 0.003 (1.467) (2.715) (2.247)
(Continued)
18
Exhibit 2 (continued)
Hedge fund borrowers
Bond issuers Bank borrowers Hedge fund borrowers
VS bond issuers Hedge fund borrowers
VS bank borrowers
Mean N Mean N Mean N (Median) (Median) (Median) Asymmetric Information Size 3,614.96 39 16,759.99 2,498 6,059.73 1,445 0.000 0.001
(348.927) (5,695.594) (1,040.500) Tangibility 0.271 39 0.372 2,251 0.317 1382 0.087 0.283
(0.213) (0.340) (0.253) ROA Volatility 0.048 35 0.014 2,166 0.033 1,236 0.000 0.000
(0.027) (0.009) (0.014) Sales Growth Volatility 0.331 40 0.228 2,498 0.303 1,444 0.000 0.015
(0.218) (0.134) (0.156) # of analysts 5.105 38 12.551 1,910 8.374 1,276 0.000 0.016
(1.000) (11.000) (5.000) Illiquidity measure 0.446 26 0.075 1,494 0.267 1,069 0.000 0.393
(0.105) (0.035) (0.091) R&D Intensity 0.005 41 0.002 2,546 0.006 1,489 0.112 0.480
(0.000) (0.000) (0.000) Capital Intensity 0.061 39 0.059 1,815 0.059 1,244 0.820 0.806
(0.035) (0.043) (0.041)
Analysts Forecasts Dispersion 0.078 13 0.098 1,801 0.100 932 0.277 0.185 (0.070) (0.040) (0.040)
Analysts Forecast Error 0.622 19 0.400 1,851 0.729 1,008 0.000 0.000 (0.565) (0.060) (0.083)
Other Firm Characteristics Tobin's Q 1.373 35 1.230 1,766 1.572 1,184 0.571 0.067
(0.935) (0.983) (1.077) Firm Age 10.744 39 13.279 1,949 11.610 1,301 0.003 0.286
(10.000) (15.000) (13.000) Herfindahl Index 0.356 41 0.243 2,546 0.283 1,488 0.001 0.066
(0.298) (0.144) (0.191)

19
Exhibit 3 Univariate statistics – Matched sample
The sample consists of hedge fund borrowers matched by industry at the 2-digit NAICS code level, fiscal year, and size to bond issuers and bank borrowers in the period 1999-2006. ROA is operating income divided by total assets. Cash flow is income before extraordinary items plus depreciation divided by total assets. Loss is a dummy variable that equals 1 if the operating income is negative, 0 otherwise. Leverage is book value of LT debt and debt in current liabilities divided by the sum of book value of debt and market value of common equity. Interest Coverage is operating income divided by interest expense. Z-Score is defined as in Altman (1977): (1.2*Working capital + 1.4*Retained earnings + 3.3*Operating income before interest + Sales) / Total assets. Distance-to-default is defined as in Vassalou (2004). Size is firm’s total assets (in $m.). Tangibility is net property, plant, and equipment divided by total assets. ROA Volatility is standard deviation of operating income divided by total assets over the previous 6 years. Sales growth volatility is standard deviation of sales growth over the previous 6 years. Illiquidity Measure is defined as in Amihud (2002) as the annual average if the square root of the absolute value of stock return divided by price times volume. R&D Intensity is R&D expenditures divided by total assets. Capital intensity is capital expenditures divided by total assets. Analyst Forecast Dispersion is the standard deviation of analyst forecasts. Analyst Forecast Error is the absolute value of the ratio of the mean EPS analyst forecast minus the actual EPS to actual EPS. Tobin’s Q is book value of assets minus book value of common equity plus market value of common equity divided by book value of assets. Firm age is the number of years the firm has been in the COMPUSTAT database. Herfindahl Index is the sales-based Herfindahl index of the firm’s industry. The exhibit reports means (medians). The fourth and eighth columns report the p-values from Wilcoxon test of the difference across samples. All continuous variables are winsorized at the 1st and 99th percentiles. Hedge funds
borrowers Bond issuers N
p-value of difference
Hedge funds borrowers
Bank borrowers
N p-value of difference
Profitability ROA -0.010 0.034 16 0.002 -0.012 0.042 22 0.001
(0.001) (0.036) (0.003) (0.037)
Cash flow -0.081 0.087 21 0.001 -0.134 -0.012 27 0.001
(0.014) (0.071) (-0.058) (0.074)
Loss 0.524 0.143 21 0.010 0.593 0.222 27 0.006 (1.000) (0.000) (1.000) (0.000)
Creditworthiness Leverage 0.496 0.323 9 0.310 0.333 0.198 23 0.218
(0.575) (0.252) (0.245) (0.185)
Interest Coverage 7.867 4.218 18 0.059 4.182 14.285 26 0.001
(0.572) (2.140) (0.000) (11.104)
Z-Score -1.326 0.513 17 0.001 -0.761 -1.775 23 0.005 (-0.458) (0.689) (-0.277) (1.022)
Distance-to-default 1.663 2.489 7 0.110 1.523 2.938 15 0.002 (1.060) (2.818) (1.349) (2.889)
(Continued)
20
Exhibit 3 (continued)
Hedge funds
borrowers Bond issuers N
p-value of difference
Hedge funds borrowers
Bank borrowers
N p-value of difference
Asymmetric Information Size 1,299.074 1,473.321 21 0.141 401.085 520.255 27 0.473
(253.758) (560.369) (183.931) (283.946)
Tangibility 0.226 0.359 21 0.128 0.230 0.228 26 0.784 (0.161) (0.285) (0.166) (0.119)
ROA Volatility 0.072 0.025 16 0.152 0.062 0.459 22 0.425 (0.040) (0.022) (0.039) (0.014)
Sales Growth Volatility 0.257 0.282 20 0.766 0.278 0.585 26 0.170 (0.217) (0.206) (0.214) (0.133)
# of analysts 3.500 4.650 20 0.988 3.120 4.320 25 0.543 (0.000) (0.000) (0.000) (3.000)
Illiquidity measure 0.116 0.130 7 0.848 0.680 0.374 16 0.242 (0.105) (0.041) (0.240) (0.074)
R&D Intensity 0.004 0.010 21 0.381 0.007 0.008 27 0.773 (0.000) (0.000) (0.000) (0.000)
Capital Intensity 0.030 0.054 21 0.392 0.049 0.046 27 0.945 (0.023) (0.027) (0.029) (0.026)
Analysts Forecasts Dispersion 0.105 0.068 4 0.375 0.033 0.055 4 0.457 (0.115) (0.045) (0.030) (0.060)
Analysts Forecast Error 0.800 0.082 5 0.009 0.348 0.411 5 0.602 (0.737) (0.099) (0.315) (0.107)
Other firm characteristics Tobin's Q 0.827 1.132 9 0.070 1.778 1.661 23 0.435
(0.581) (1.140) (1.283) (1.811)
Firm Age 9.714 9.143 21 0.455 9.963 14.000 27 0.018 (10.000) (9.000) (10.000) (15.000)
Herfindahl Index 0.419 0.329 21 0.242 0.361 0.430 27 0.171
(0.403) (0.273) (0.395) (0.501)

21
Exhibit 4 Logit regression on the probability of borrowing from hedge funds
The sample consists of firms that borrowed from a hedge fund or a bank, and of firms that issued bonds in the period 1999-2006. ROA is operating income divided by total assets. Leverage is book value of LT debt and debt in current liabilities divided by the sum of book value of debt and market value of common equity. Interest coverage is operating income divided by interest expense. Z-Score is defined as in Altman (1977): (1.2*Working capital + 1.4*Retained earnings + 3.3*Operating income before interest + Sales) / Total assets. Size is firm’s total assets (in $m.). Tangibility is net property, plant, and equipment divided by total assets. ROA Volatility is standard deviation of operating income divided by total assets over the previous 6 years. R&D Intensity is R&D expenditures divided by total assets. Capital Intensity is capital expenditures divided by total assets. Tobin’s Q is book value of assets minus book value of common equity plus market value of common equity divided by book value of assets. Firm age is the number of years the firm has been in the COMPUSTAT database. Standard errors are robust and clustered by firm. Year and industry dummies are included. All continuous variables are winsorized at the 1st and 99th percentile. T-statistics are in parentheses. The symbols ***, **, and * denote significance at the 1%, 5%, and 10% level respectively. Hedge fund borrowers VS bond
issuers Hedge fund borrowers VS bank
borrowers
Intercept -13.684*** -18.284*** (-7.286) (-7.333)
Profitability ROA -74.315*** -19.228***
(-4.512) (-2.860) Creditworthiness Leverage 5.032** 2.723**
(2.415) (2.324) Interest Coverage 0.054*** 0.005
(5.455) (1.370) Z-Score -2.242*** -0.194
(-3.213) (-1.360) Asymmetric Information Ln(Size) -0.725*** -0.170
(-2.884) (-1.306) Tangibility -7.095** -3.601**
(-2.339) (-2.257) ROA Volatility 17.460 -0.942*
(1.152) (-1.759) R&D Intensity -155.805*** -35.732
(-3.844) (-1.204) Capital Intensity 10.355 6.776
(1.375) (1.394) Other firm characteristics Tobin's Q -1.420* -0.077
(-1.747) (-0.350) Firm Age -0.168* -0.066 (-1.759) (-1.152)
N 1,148 663
22
Exhibit 5 Univariate statistics before and after the hedge fund loan
The sample consists of firms that borrowed from hedge funds in the period 1999-2006 matched one-to-one by year, industry at the 2-digit NAICS code level and ROA with firms from the COMPUSTAT universe. ROA is operating income divided by total assets. Cash flow is income before extraordinary items plus depreciation divided by total assets. Loss is a dummy variable that equals 1 if the operating income is negative, 0 otherwise. Leverage is book value of LT debt and debt in current liabilities divided by the sum of book value of debt and market value of common equity. Interest Coverage is operating income divided by interest expense. Z-Score is defined as in Altman (1977): (1.2*Working capital + 1.4*Retained earnings + 3.3*Operating income before interest + Sales) / Total assets. Distance-to-default is defined as in Vassalou (2004). Size is firm’s total assets (in $m.). Tangibility is net property, plant, and equipment divided by total assets. ROA Volatility is standard deviation of operating income divided by total assets over the previous 6 years. Sales growth volatility is standard deviation of sales growth over the previous 6 years. Illiquidity Measure is defined as in Amihud (2002) as the annual average if the square root of the absolute value of stock return divided by price times volume. R&D Intensity is R&D expenditures divided by total assets. Capital intensity is capital expenditures divided by total assets. Analyst Forecast Dispersion is the standard deviation of analyst forecasts. Analyst Forecast Error is the absolute value of the ratio of the mean EPS analyst forecast minus the actual EPS to actual EPS. Tobin’s Q is book value of assets minus book value of common equity plus market value of common equity divided by book value of assets. Herfindahl Index is the sales-based Herfindahl index of the firm’s industry. The exhibit reports means (medians) of the difference in firm characteristics between firms that borrow from hedge funds and matched control firms from the COMPUSTAT universe.The last two columns report p-values from a Wilcoxon test of the difference in the medians for year -1 and +1, and year -1 and +2, where year 0 corresponds to the year in which hedge funds provided the loans. All continuous variables are winsorized at the 1st and 99th percentile. -1 +1 +2 N -1 VS +1 -1 VS +2
Profitability
ROA -0.001 0.005 0.002 19 0.052 0.493
(0.000) (0.007) (-0.015)
Cash flow -0.018 -0.226 0.092 12 0.525 1.000
(-0.011) (-0.076) (0.004)
Loss 0.000 0.105 0.000 19 0.297 1.000
(0.000) (0.000) (0.000)
Creditworthiness
Leverage 0.155 0.222 0.223 19 0.540 0.493
(0.070) (0.087) (0.130)
Interest Coverage -1.069 0.539 17.033 19 0.508 0.988
(0.000) (0.000) (0.000)
Z-Score 1.952 0.555 -1.479 19 0.759 0.737
(-0.272) (-0.116) (-0.544)
Distance-to-default -0.069 -0.825 -0.894 6 0.631 0.522
(-0.577) (-0.741) (-0.417) (Continued)
23
Exhibit 5 (continued) -1 +1 +2 N -1 VS +1 -1 VS +2
Asymmetric Information
Size -1151.781 -1894.089 -2027.993 19 0.872 0.942
(-33.421) (-24.682) (-24.121)
Tangibility -0.062 -0.065 -0.039 19 0.872 0.942
(-0.031) (-0.033) (-0.052)
ROA Volatility -0.014 -0.004 0.013 19 0.988 0.373
(-0.002) (-0.001) (0.005)
Sales Growth Volatility -1.386 -1.186 -0.775 19 0.827 0.373
(-0.075) (-0.095) (-0.026)
# of analysts 1.333 -2.778 -3.222 9 0.595 0.658
(-1.000) (0.000) (-1.000)
Illiquidity measure -0.460 -0.167 -0.167 8 0.172 0.529
(-0.089) (-0.027) (-0.080)
R&D Intensity -0.018 -0.017 -0.025 19 0.476 0.820
(0.000) (0.000) (0.000)
Capital Intensity -0.003 -0.001 -0.009 12 0.686 0.954
(-0.010) (-0.001) (-0.004)
Analysts Forecasts Dispersion -0.001 -0.049 -0.093 9 0.101 0.076
(-0.010) (-0.020) (-0.030)
Analysts Forecast Error 0.315 -5.462 0.425 11 0.533 0.061
(0.087) (-0.010) (-0.062)
Other firm characteristics
Tobin's Q -0.635 -1.852 -1.052 19 0.215 0.965
(-0.052) (0.061) (0.176)
Herfindahl Index 0.097 0.132 0.115 19 0.942 0.804
(0.000) (0.006) (0.005)
24
Exhibit 6 Cumulative average abnormal returns for hedge fund borrowers, bond issuers, and bank borrowers around the loan date
The sample consists of firms that borrowed from a hedge fund or a bank, and of firms that issued bonds in the period 1999-2006. The exhibit presents the mean (median) cumulative abnormal return over different windows around the date of the hedge fund loan. Abnormal returns are calculated using a Fama and French (1993) model. *, **, *** denote statistical significance at 10%, 5%, and 1% respectively using a one-tailed test.
Hedge fund borrowers Bond issuers Bank borrowers
Days Abnormal
returns N
Generalized Sign Z
Rank test Z
Abnormal returns
N Generalized
Sign Z Rank test
Z Abnormal
returns N
Generalized Sign Z
Rank test Z
(-30,0) 0.065 24 0.634 0.871 0.003 1,615 1.279 0.925 -0.009 1,122 -1.400* -1.253
(0.031) (0.001) (-0.010)
(-20,0) 0.137 24 0.634 1.482* 0.002 1,615 1.428* 1.104 -0.011 1,122 -1.639* -1.822**
(0.037) (0.001) (-0.010)
(-10,0) 0.069 24 1.860** 1.485* 0.001 1,615 2.175** 1.149 -0.004 1,122 -0.205 -0.241
(0.054) (0.002) (-0.003)
(0,+10) -0.011 24 0.225 -0.796 0.000 1,615 0.283 1.111 0.002 1,122 1.588* 1.606*
(-0.018) (-0.001) (0.000)
(0,+20) -0.006 24 0.634 -0.285 -0.004 1,615 -0.463 -0.038 -0.002 1,122 0.572 1.095
(0.006) (-0.003) (-0.004)
(0,+30) 0.010 25 0.43 0.132 -0.010 1,615 -0.613 -1.134 -0.002 1,122 0.632 1.640*
(0.007) (-0.003) (-0.002)
25
Exhibit 7 Cumulative average abnormal returns for hedge fund borrowers, bond issuers, and bank borrowers around the loan date – comparisons across samples
The sample consists of firms that borrowed from a hedge fund or a bank, and of firms that issued bonds in the period 1999-2006. The exhibit presents the mean (median) cumulative abnormal return over different windows around the date of the hedge fund loan. Abnormal returns are calculated using a Fama and French (1993) model. The last two columns report the p-values from a Wilcoxon test of the difference across samples.
Days Hedge fund borrowers Bond issuers Bank borrowers Hedge fund
borrowers VS bond issuers
Hedge fund borrowers VS bank
borrowers
Abnormal Returns N Abnormal Returns N Abnormal Returns N p-value of the difference
(-30, 0) 0.065 24 0.003 1,615 -0.009 1,122 0.255 0.181
(0.031) (0.001) (-0.010)
(-20, 0) 0.137 24 0.002 1,615 -0.011 1,122 0.399 0.230
(0.037) (0.001) (-0.010)
(-10, 0) 0.069 24 0.001 1,615 -0.004 1,122 0.015 0.013
(0.054) (0.002) (-0.003)
(+10, 0) -0.011 24 0.000 1,615 0.002 1,122 0.599 0.604
(-0.018) (-0.001) (0.000)
(+20, 0) -0.006 24 -0.004 1,615 -0.002 1,122 0.889 0.847
(0.006) (-0.003) (-0.004)
(+30, 0) 0.010 25 -0.010 1,615 -0.002 1,122 0.970 0.937
(0.007) (-0.003) (-0.002)
26
Exhibit 8 Cumulative average abnormal returns for hedge fund borrowers, bond issuers, and bank borrowers around the loan date – comparisons across matched samples
The sample consists of firms that borrowed from a hedge fund in the period 1999-2006 matched one-to-one by year, industry at the 2-digit NAICS code level, and ROA with firms from the COMPUSTAT universe. The exhibit presents the mean (median) cumulative abnormal return over different windows around the date of the hedge fund loan. Abnormal returns are calculated using a Fama and French (1993) model. The third and sixth columns report the p-values from a Wilcoxon test of the difference across samples.
Hedge fund borrowers Bond issuers p-value of the
difference
Hedge fund borrowers Bank borrowers p-value of the
difference N=14 N=14 N=8 N=8
(-30, 0) 0.307 -0.021 0.005 0.095 -0.215 0.093
(0.275) (-0.006) (0.052) (-0.112)
(-20, 0) 0.229 -0.001 0.043 0.085 -0.205 0.172
(0.115) (-0.011) (0.005) (-0.062)
(-10, 0) 0.127 -0.020 0.013 0.082 -0.143 0.093
(0.119) (-0.002) (-0.005) (-0.051)
(+10, 0) 0.008 0.007 0.783 0.016 -0.024 0.401
(0.054) (0.000) (0.065) (-0.006)
(+20, 0) 0.017 -0.004 0.646 0.015 -0.012 0.345
(0.045) (-0.003) (0.052) (-0.009)
(+30, 0) 0.048 -0.037 0.232 0.019 0.019 0.916
(0.037) (-0.014) (0.010) (0.021)
27
Figure I Cumulative Average Abnormal Returns around the loan announcement date for the hedge fund borrowers’ stocks in the window (-90, +90) days. Abnormal returns are estimated with the three-factor Fama and French model (1993).
-10%
-5%
0%
5%
10%
15%
20%
25%
30%
35%
-90 -75 -60 -45 -30 -15 0 15 30 45 60 75 90
CA
AR
s
Days
Cumulative Average Abnormal Returns Fama-French Model

CFR Working Paper Series
Centre for Financial Research Cologne
CFR Working Papers are available for download from www.cfr-cologne.de. Hardcopies can be ordered from: Centre for Financial Research (CFR), Albertus Magnus Platz, 50923 Koeln, Germany. 2011 No. Author(s) Title 11-08 11-07 11-06 11-05 11-04 11-03 11-02 11-01 2010 No.
G. Cici, L.-F. Palacios V. Agarwal, G. D. Gay, L. Ling N. Hautsch, D. Hess, D. Veredas G. Cici S. Jank G.Fellner, E.Theissen S.Jank V. Agarwal, C. Meneghetti Author(s)
On the Use of Options by Mutual Funds: Do They Know What They Are Doing? Window Dressing in Mutual Funds The Impact of Macroeconomic News on Quote Adjustments, Noise, and Informational Volatility The Prevalence of the Disposition Effect in Mutual Funds' Trades Mutual Fund Flows, Expected Returns and the Real Economy Short Sale Constraints, Divergence of Opinion and Asset Value: Evidence from the Laboratory Are There Disadvantaged Clienteles in Mutual Funds? The role of Hedge Funds as Primary Lenders Title
10-20 10-19 10-18 10-17 10-16
G. Cici, S. Gibson, J.J. Merrick Jr. J. Hengelbrock, E. Theissen, Ch. Westheide G. Cici, S. Gibson D. Hess, D. Kreutzmann, O. Pucker S. Jank, M. Wedow
Missing the Marks? Dispersion in Corporate Bond Valuations Across Mutual Funds Market Response to Investor Sentiment The Performance of Corporate-Bond Mutual Funds: Evidence Based on Security-Level Holdings Projected Earnings Accuracy and the Profitability of Stock Recommendations Sturm und Drang in Money Market Funds: When Money Market Funds Cease to Be Narrow
10-15 G. Cici, A. Kempf, A.
Puetz Caught in the Act: How Hedge Funds Manipulate their Equity Positions
10-14 J. Grammig, S. Jank Creative Destruction and Asset Prices

10-13 S. Jank, M. Wedow Purchase and Redemption Decisions of Mutual Fund
Investors and the Role of Fund Families 10-12 S. Artmann, P. Finter,
A. Kempf, S. Koch, E. Theissen
The Cross-Section of German Stock Returns: New Data and New Evidence
10-11 M. Chesney, A. Kempf The Value of Tradeability 10-10 S. Frey, P. Herbst The Influence of Buy-side Analysts on
Mutual Fund Trading 10-09 V. Agarwal, W. Jiang,
Y. Tang, B. Yang Uncovering Hedge Fund Skill from the Portfolio Holdings They Hide
10-08 V. Agarwal, V. Fos,
W. Jiang Inferring Reporting Biases in Hedge Fund Databases from Hedge Fund Equity Holdings
10-07 V. Agarwal, G. Bakshi,
J. Huij Do Higher-Moment Equity Risks Explain Hedge Fund Returns?
10-06 J. Grammig, F. J. Peter Tell-Tale Tails 10-05 K. Drachter, A. Kempf Höhe, Struktur und Determinanten der Managervergütung-
Eine Analyse der Fondsbranche in Deutschland 10-04 J. Fang, A. Kempf,
M. Trapp Fund Manager Allocation
10-03 P. Finter, A. Niessen-
Ruenzi, S. Ruenzi The Impact of Investor Sentiment on the German Stock Market
10-02 D. Hunter, E. Kandel,
S. Kandel, R. Wermers Endogenous Benchmarks
10-01 S. Artmann, P. Finter,
A. Kempf Determinants of Expected Stock Returns: Large Sample Evidence from the German Market
2009 No. Author(s) Title 09-17
E. Theissen
Price Discovery in Spot and Futures Markets: A Reconsideration
09-16 M. Trapp Trading the Bond-CDS Basis – The Role of Credit Risk
and Liquidity 09-14 A. Kempf, O. Korn,
M. Uhrig-Homburg The Term Structure of Illiquidity Premia
09-13 W. Bühler, M. Trapp Time-Varying Credit Risk and Liquidity Premia in Bond and
CDS Markets 09-12 W. Bühler, M. Trapp
Explaining the Bond-CDS Basis – The Role of Credit Risk and Liquidity
09-11 S. J. Taylor, P. K. Yadav,
Y. Zhang
Cross-sectional analysis of risk-neutral skewness
09-10 A. Kempf, C. Merkle,
A. Niessen Low Risk and High Return - How Emotions Shape Expectations on the Stock Market
09-09 V. Fotak, V. Raman,
P. K. Yadav Naked Short Selling: The Emperor`s New Clothes?
09-08 F. Bardong, S.M. Bartram,
P.K. Yadav Informed Trading, Information Asymmetry and Pricing of Information Risk: Empirical Evidence from the NYSE

09-07 S. J. Taylor , P. K. Yadav, Y. Zhang
The information content of implied volatilities and model-free volatility expectations: Evidence from options written on individual stocks
09-06 S. Frey, P. Sandas The Impact of Iceberg Orders in Limit Order Books 09-05 H. Beltran-Lopez, P. Giot,
J. Grammig Commonalities in the Order Book
09-04 J. Fang, S. Ruenzi Rapid Trading bei deutschen Aktienfonds: Evidenz aus einer großen deutschen Fondsgesellschaft
09-03 A. Banegas, B. Gillen,
A. Timmermann, R. Wermers
The Performance of European Equity Mutual Funds
09-02 J. Grammig, A. Schrimpf,
M. Schuppli Long-Horizon Consumption Risk and the Cross-Section of Returns: New Tests and International Evidence
09-01 O. Korn, P. Koziol The Term Structure of Currency Hedge Ratios 2008 No. Author(s) Title 08-12
U. Bonenkamp, C. Homburg, A. Kempf
Fundamental Information in Technical Trading Strategies
08-11 O. Korn Risk Management with Default-risky Forwards 08-10 J. Grammig, F.J. Peter International Price Discovery in the Presence
of Market Microstructure Effects 08-09 C. M. Kuhnen, A. Niessen Public Opinion and Executive Compensation 08-08 A. Pütz, S. Ruenzi Overconfidence among Professional Investors: Evidence from
Mutual Fund Managers 08-07 P. Osthoff What matters to SRI investors? 08-06 08-05 08-04
A. Betzer, E. Theissen P. Linge, E. Theissen N. Hautsch, D. Hess, C. Müller
Sooner Or Later: Delays in Trade Reporting by Corporate Insiders Determinanten der Aktionärspräsenz auf Hauptversammlungen deutscher Aktiengesellschaften Price Adjustment to News with Uncertain Precision
08-03 D. Hess, H. Huang,
A. Niessen How Do Commodity Futures Respond to Macroeconomic News?
08-02 R. Chakrabarti,
W. Megginson, P. Yadav Corporate Governance in India
08-01 C. Andres, E. Theissen Setting a Fox to Keep the Geese - Does the Comply-or-Explain
Principle Work? 2007 No. Author(s) Title 07-16
M. Bär, A. Niessen, S. Ruenzi
The Impact of Work Group Diversity on Performance: Large Sample Evidence from the Mutual Fund Industry

07-15 A. Niessen, S. Ruenzi Political Connectedness and Firm Performance: Evidence From Germany
07-14 O. Korn Hedging Price Risk when Payment Dates are Uncertain 07-13 A. Kempf, P. Osthoff SRI Funds: Nomen est Omen 07-12 J. Grammig, E. Theissen,
O. Wuensche Time and Price Impact of a Trade: A Structural Approach
07-11 V. Agarwal, J. R. Kale On the Relative Performance of Multi-Strategy and Funds of
Hedge Funds 07-10 M. Kasch-Haroutounian,
E. Theissen Competition Between Exchanges: Euronext versus Xetra
07-09 V. Agarwal, N. D. Daniel,
N. Y. Naik Do hedge funds manage their reported returns?
07-08 N. C. Brown, K. D. Wei,
R. Wermers Analyst Recommendations, Mutual Fund Herding, and Overreaction in Stock Prices
07-07 A. Betzer, E. Theissen Insider Trading and Corporate Governance:
The Case of Germany 07-06 V. Agarwal, L. Wang Transaction Costs and Value Premium 07-05 J. Grammig, A. Schrimpf Asset Pricing with a Reference Level of Consumption:
New Evidence from the Cross-Section of Stock Returns 07-04 V. Agarwal, N.M. Boyson,
N.Y. Naik
Hedge Funds for retail investors? An examination of hedged mutual funds
07-03 D. Hess, A. Niessen The Early News Catches the Attention:
On the Relative Price Impact of Similar Economic Indicators 07-02 A. Kempf, S. Ruenzi,
T. Thiele Employment Risk, Compensation Incentives and Managerial Risk Taking - Evidence from the Mutual Fund Industry -
07-01 M. Hagemeister, A. Kempf CAPM und erwartete Renditen: Eine Untersuchung auf Basis
der Erwartung von Marktteilnehmern 2006 No. Author(s) Title 06-13
S. Čeljo-Hörhager, A. Niessen
How do Self-fulfilling Prophecies affect Financial Ratings? - An experimental study
06-12 R. Wermers, Y. Wu,
J. Zechner Portfolio Performance, Discount Dynamics, and the Turnover of Closed-End Fund Managers
06-11 U. v. Lilienfeld-Toal,
S. Ruenzi Why Managers Hold Shares of Their Firm: An Empirical Analysis
06-10 A. Kempf, P. Osthoff The Effect of Socially Responsible Investing on Portfolio Performance
06-09 R. Wermers, T. Yao, J. Zhao
The Investment Value of Mutual Fund Portfolio Disclosure
06-08 M. Hoffmann, B. Kempa The Poole Analysis in the New Open Economy
Macroeconomic Framework
06-07 K. Drachter, A. Kempf, M. Wagner
Decision Processes in German Mutual Fund Companies: Evidence from a Telephone Survey
06-06 J.P. Krahnen, F.A.
Schmid, E. Theissen Investment Performance and Market Share: A Study of the German Mutual Fund Industry
06-05 S. Ber, S. Ruenzi On the Usability of Synthetic Measures of Mutual Fund Net-

Flows 06-04 A. Kempf, D. Mayston Liquidity Commonality Beyond Best Prices
06-03 O. Korn, C. Koziol Bond Portfolio Optimization: A Risk-Return Approach 06-02 O. Scaillet, L. Barras, R.
Wermers False Discoveries in Mutual Fund Performance: Measuring Luck in Estimated Alphas
06-01 A. Niessen, S. Ruenzi Sex Matters: Gender Differences in a Professional Setting 2005
No. Author(s) Title 05-16
E. Theissen
An Analysis of Private Investors´ Stock Market Return Forecasts
05-15 T. Foucault, S. Moinas,
E. Theissen Does Anonymity Matter in Electronic Limit Order Markets
05-14 R. Kosowski,
A. Timmermann, R. Wermers, H. White
Can Mutual Fund „Stars“ Really Pick Stocks? New Evidence from a Bootstrap Analysis
05-13 D. Avramov, R. Wermers Investing in Mutual Funds when Returns are Predictable 05-12 K. Griese, A. Kempf Liquiditätsdynamik am deutschen Aktienmarkt 05-11 S. Ber, A. Kempf,
S. Ruenzi Determinanten der Mittelzuflüsse bei deutschen Aktienfonds
05-10 M. Bär, A. Kempf,
S. Ruenzi Is a Team Different From the Sum of Its Parts? Evidence from Mutual Fund Managers
05-09 M. Hoffmann Saving, Investment and the Net Foreign Asset Position 05-08 S. Ruenzi Mutual Fund Growth in Standard and Specialist Market
Segments 05-07 A. Kempf, S. Ruenzi Status Quo Bias and the Number of Alternatives
- An Empirical Illustration from the Mutual Fund Industry –
05-06 05-05
J. Grammig, E. Theissen H. Beltran, J. Grammig, A.J. Menkveld
Is Best Really Better? Internalization of Orders in an Open Limit Order Book Understanding the Limit Order Book: Conditioning on Trade Informativeness
05-04 M. Hoffmann Compensating Wages under different Exchange rate Regimes 05-03 M. Hoffmann Fixed versus Flexible Exchange Rates: Evidence from
Developing Countries 05-02 A. Kempf, C. Memmel On the Estimation of the Global Minimum Variance Portfolio 05-01 S. Frey, J. Grammig Liquidity supply and adverse selection in a pure limit order
book market 2004 No. Author(s) Title 04-10
N. Hautsch, D. Hess
Bayesian Learning in Financial Markets – Testing for the Relevance of Information Precision in Price Discovery
04-09 A. Kempf, Portfolio Disclosure, Portfolio Selection and Mutual Fund

K. Kreuzberg Performance Evaluation 04-08 N.F. Carline, S.C. Linn,
P.K. Yadav Operating performance changes associated with corporate mergers and the role of corporate governance
04-07 J.J. Merrick, Jr., N.Y.
Naik, P.K. Yadav Strategic Trading Behavior and Price Distortion in a Manipulated Market: Anatomy of a Squeeze
04-06 N.Y. Naik, P.K. Yadav Trading Costs of Public Investors with Obligatory and
Voluntary Market-Making: Evidence from Market Reforms 04-05 A. Kempf, S. Ruenzi Family Matters: Rankings Within Fund Families and
Fund Inflows 04-04 V. Agarwal,
N.D. Daniel, N.Y. Naik Role of Managerial Incentives and Discretion in Hedge Fund Performance
04-03 V. Agarwal, W.H. Fung,
J.C. Loon, N.Y. Naik Risk and Return in Convertible Arbitrage: Evidence from the Convertible Bond Market
04-02 A. Kempf, S. Ruenzi Tournaments in Mutual Fund Families 04-01 I. Chowdhury, M.
Hoffmann, A. Schabert Inflation Dynamics and the Cost Channel of Monetary Transmission

Cfr/University of cologne
Albertus-Magnus-Platz
D-50923 Cologne
Fon +49(0)221-470-6995
Fax +49(0)221-470-3992