Embed Size (px)
Citation preview

CFR Working Paper NO. 10-19
Market Response to Investor Sentiment
J. Hengelbrock • E. Theissen •
C. Westheide

Market Response to Investor Sentiment
Jördis Hengelbrock Erik Theissen Christian Westheide†
This version: December 16, 2010
Abstract
Recent empirical research suggests that measures of investor sentiment
have predictive power for future stock returns over the intermediate and long
term. Given the widespread publication of sentiment indicators, smart in-
vestors should trade on the information conveyed by such indicators and thus
trigger an immediate market response to their publication. The present pa-
per is the first to empirically analyze whether an immediate response can be
identified from the data. We use survey-based sentiment indicators from two
countries (Germany and the US). Consistent with previous research we find
there is predictability at intermediate time horizons. For the US, however,
the predictability disappears after 1994. Using event study methodology
we find that the publication of sentiment indicators affects market returns.
The sign of the immediate response is the same as that of the predictability
over the intermediate term. This finding is consistent with the idea that
sentiment is related to mispricing, but is inconsistent with the idea that the
sentiment indicator provides information about future expected returns.
Keywords: Investor Sentiment, Event Study, Return Predictability
JEL-Classification: G12, G14
†Jördis Hengelbrock is from Bonn Graduate School of Economics, University of Bonn,[email protected]. Erik Theissen is from University of Mannheim, [email protected]. Christian Westheide is from Bonn Graduate School of Economics, University ofBonn, [email protected]. Hengelbrock and Westheide gratefully acknowledge fi-nancial support from the German Research Association (DFG). We are grateful to Jörg Breitung,Greg Brown, Mike Cliff, Daniel Dorn and Markus Glaser for helpful conversations.

1 Introduction
Recent empirical research suggests that survey measures of investor sentiment have
the ability to predict future stock returns over the intermediate and long term. The
usual econometric approach is to regress future stock index returns on a sentiment
indicator and appropriate control variables. The aim of using the controls is to
account for variables (such as the term and yield spread) that are already known
to predict future returns. A significant coefficient for the sentiment indicator is
interpreted as evidence that sentiment predicts future returns.
There are at least two potential explanations for the predictive ability of sentiment
indicators. First, sentiment indices may contain information about future expected
returns that is not already captured by the control variables.1 In this case, the
predictive ability of sentiment indicators does not necessarily imply a violation of
market efficiency. Second, sentiment indicators may be related to mispricing (as
proposed by Brown and Cliff (2005) and others). In this case, the predictive power
of sentiment measures provides evidence for a violation of market efficiency.
The implications of these two alternative explanations differ markedly. It is thus
very important to discriminate between the ’expected return news’ and ’mispric-
ing’ scenarios. The present paper makes a step in this direction. Our approach
is to simultaneously consider intermediate and long-horizon predictability on the
one hand, and the immediate market reaction to the publication of sentiment in-
dicators on the other. This approach has a simple intuition. Current prices are
inversely related to expected returns. If sentiment indicators contain information
about future expected returns, the sign of the immediate market reaction should
be opposite to that obtained from long-term predictive regressions. If, on the
other hand, sentiment indicators are related to mispricing, we should find that
the immediate market reaction has the same sign as that found from predictive
regressions. This is due to the fact that smart investors exploit the information1Alternatively, sentiment indicators could forecast higher expected future cash flows. In this
case the publication of the sentiment indicator should trigger an immediate price effect (i.e., asignificant announcement day return), but should not predict future returns over longer horizons.The intermediate and long-term predictability reported in previous research is thus inconsistentwith this interpretation. Therefore we only consider the "expected return news" explanation andconfront it with explanations based on mispricing.
1

contained in the sentiment indicator. If bullish sentiment predicts positive [neg-
ative] future returns smart investors will buy [sell] and thus cause an immediate
positive [negative] market reaction.2
To the best of our knowledge, our paper is the first to empirically analyze the
immediate response of stock returns to the publication of survey-based sentiment
measures. We use data from Germany and the US. In the first part of our analysis
we rely on the methodology proposed by Brown and Cliff (2005). We replicate
their tests for medium and long-term predictability. Consistent with previous
results in the literature, we find a significant negative relationship between the
sentiment indicator and subsequent medium term (up to three months) index
returns in the US for the earlier parts of our sample period (1987-1994 and, to
a much lesser extent, 1994-2001). This relationship disappears towards the end
of our sample period. In the final subperiod (2001-2008), the coefficients of the
predictive regressions are predominantly positive but only weakly significant. The
sentiment indicator for the German market is correlated positively with future
returns. This is consistent with the results from the US, because the German
sample covers he years 2001-2008, which is precisely the period for which we also
find positive coefficients in the US sample.
In the second step of our analysis, we use event study methodology to test whether
daily index returns respond to the publication of the sentiment indicator. We do
find a significant positive announcement day effect in Germany. However, not all
of the predictive power of the indicator is captured on the announcement day. This
pattern is consistent with a scenario of mispricing and of limited arbitrage. Smart
investors are aware of the predictive power of the sentiment indicator and trade
accordingly. However, they do not fully arbitrage the predictability away, possibly
because of increased noise trader risk (as in the model of De Long et al. (1990)).
For the US market there is evidence of a negative publication day effect in the
subperiod 1987-1994. As in the case of Germany this result is consistent with a
scenario of mispricing and limited arbitrage. In later subperiods there is no such2Of course, with perfect arbitrage we would expect to see only an immediate price reaction.
The stylized fact that sentiment does predict future returns can thus only be reconciled withmispricing if there are limits to arbitrage.
2

effect. This should come as no surprise, because the intermediate- to long-term
predictability also largely disappears towards the end of the sample period.
Our paper is related to previous studies investigating the predictive power of sen-
timent indicators. Brown and Cliff (2004, 2005), Clarke and Statman (1998),
Fisher and Statman (2000), Kaniel et al. (2008), Otoo (1999), Shiller (2000), Solt
and Statman (1988) and Verma et al. (2008) all analyze survey-based sentiment
measures for the US market.3 Although the results are mixed (probably due to
differences in sample periods, methodology, and the forecasting periods), on bal-
ance these previous studies find evidence of long-horizon predictability. Schmeling
(2007) applies a similar methodology to data from the German stock market and
also reports evidence of predictability. Although some papers have tested for short-
term predictability (e.g. at the weekly and monthly level as in Brown and Cliff
(2004)), to our knowledge, the present paper is the first to test for announcement
day effects.4
More generally, our paper also relates to previous research testing for return pre-
dictability (see Ang and Bekaert (2007) for a recent contribution). In particular,
certain methodological concerns (the problem of using persistent regressors, first
addressed by Stambaugh (1999), and the problem of using overlapping return
data) are also present in our study. We account for these problems by adopting
the bootstrap-based bias correction proposed by Brown and Cliff (2005).
The remainder of this paper is structured as follows. Section 2 describes our
data set. In section 3, we present the methodology and results of our tests for
predictability. Section 4 describes our tests for the existence of announcement day
effects. Section 5 concludes.3A large number of papers uses market-based sentiment measures. These sentiment proxies
include, but are not limited to, mutual fund flows (Brown et al. (2003)), the closed-end funddiscount (Elton et al. (1998), Lee et al. (1991), Neal and Wheatley (1998)), put-call ratios (Dennisand Mayhew (2002)) and various measures of trading activity (Barber and Odean (2008), Kumarand Lee (2002, 2006)). Baker and Wurgler (2006) construct a composite sentiment measurebased on six underlying proxies. Brown and Cliff (2004) analyze market-based and survey-basedsentiment measures and conclude that many of these measures are correlated.
4Schmitz et al. (2009) document short-term predictability (one and two days) of a sentimentmeasure constructed from data on warrant trades of retail investors. The data used to constructthis measure is, however, not publicly available.
3

2 Data
2.1 German Data
The analysis of intermediate and long-term predictability is based on weekly data.
We use survey data from Sentix as our measure of investor sentiment. We pre-
fer to use survey-based sentiment indicators over market-based ones because the
publication of the survey results constitutes new information, while market-based
indicators often only aggregate information that were already available.
Sentix conducts weekly surveys of institutional and private investors, and cur-
rently reaches over 2700 registered participants, about 800 of whom take part in
the survey each week. Individual investors constitute on average about 76% of
respondents, with this percentage generally varying between 70% and 80%. Vot-
ing is possible between Thursday afternoon and Saturday. Participants are asked
whether they are bullish, bearish, neutral, or have no opinion with regard to the
future trend of the DAX30 stock index over the following one and six months, re-
spectively. In our analysis we only use data for the six month horizon because the
AAII survey that we use in our US sample is also based on a six months forecasting
horizon.
From the individual opinions obtained, Sentix computes the so-called value index,
also known as the bull-bear spread. This is defined as
St =#bullish−#bearish
#total
The Sentix index is published every Sunday evening or Monday morning prior to
the opening of the market. It is available to all participants, and additionally, since
January 2004, it has been available trough Thomson DataStream and Bloomberg.
Furthermore, subindices that cover individual and institutional investors, respec-
tively, are made available exclusively to participants.
The Sentix data starts on February 26, 2001 and ends on June 30, 2008. For our
predictive regressions, we use forecasting horizons of 1, 4, 8, 13 and 26 weeks. To
this end, we combine the Sentix data with data on the DAX index for the period
February 26, 2001 to December 31, 2008. The aim of the predictive regressions is
4

to test whether the sentiment indicator contains information about future returns
beyond the information inferable from other publicly observable variables. We
therefore control for variables that are known to predict future market returns.
We include the return on the DAX30 for the previous week, the exchange rate
EUR/USD, the interest rate term spread between 10 year German government
bonds and the Euribor 3 month rate, the credit spread (defined as the spread
between yields on A rated corporate bonds of maturities between 3 and 5 years
and the mean of 3 and 5 year German government bond yields5), the liquidity
spread (defined as the spread between the Euribor 3-month and 1-month rates),
and the Euribor 1-month rate.
For the analysis of announcement day effects of the Sentix index, i.e. the test
whether the publication of the sentiment indicator has an immediate price effect,
we use daily data. As the Sentix index is published on the weekend, we consider the
return of the DAX30 between its closing value on Friday and that on Monday. To
this end, we regress daily DAX returns on a variable which is equal to the sentiment
indicator on Mondays and zero on all other days. The regression includes lagged
DAX returns, lagged S&P 500 returns (to account for the fact that respondents
may participate in the survey until Saturday and may therefore base their opinion
on the US stock market return from the previous week) and a Monday dummy (to
control for a weekend effect) as control variables.
Table 1 provides summary statistics of all the variables. The mean of the Sentix
index is 0.12, indicating that the respondents are, on average, slightly bullish. The
mean daily DAX return is very close to zero. The serial and cross correlations
(shown in the last two columns of the table) indicate that the Sentix index is
highly autocorrelated and depends on the previous values of the DAX index. Both
these observations are consistent with the findings of previous research.
[Table 1 about here.]5The number of corporate bonds issued by German firms and rated Aaa and Baa is to small
to reliably estimate the credit spread as the difference between the yields on Baa-rated andAaa-rated corporate bonds (as we do in our US sample). Therefore, we use the yield differencebetween A-rated corporate bonds and government bonds instead.
5

2.2 US Data
We use data obtained from the American Association of Individual Investors
(AAII). The AAII conducts weekly surveys of its members, the results of which
are published every Thursday6 morning, before the stock market opens. Partic-
ipants are asked whether they expect the direction of the stock market over the
following six months to be ’up’, ’no change’, or ’down’, and can participate once
during every weekly period ranging from Thursday to Wednesday. We use a value
index (bull-bear spread) that is calculated using these data. Our sample covers
more than 20 years. It starts on July 24, 1987 and extends until June 26, 2008.
As Table 2 shows, the mean, standard deviation and first order autocorrelation of
the AAII indicator are comparable to those of the German Sentix index.7
[Table 2 about here.]
The AAII survey does not specify which stock index it refers to. We therefore use
the Dow Jones Industrial Average, the Standard & Poors 500, the NASDAQ 100,
and the Russell 3000 indices. We estimate predictive regressions for forecasting
horizons of 1, 4, 8, 13 and 26 weeks. As for the German case, we include other
variables known to have predictive power for market returns as control variables.
We include the same variables as for the German sample but replace the Euribor
rates with Treasury bill rates. Thus, we control for the past week’s return of
the stock index in question, the exchange rate EUR/USD (DM/USD prior to
the introduction of the Euro), the interest rate term spread between 10 year US
Treasury bonds and the Treasury bill 3 month rate, the credit spread (defined as
the yield spread between Baa and Aaa rated corporate bonds), the liquidity spread6This applies to the period from November 1993 onwards. Before, the day of publication had
been Friday. In case of public holidays, the index is published on the last trading day before thatholiday. In our analysis, we take account of the exact publication days.
7Note that while the AAII index published on Thursday morning is more strongly relatedto the S&P return over the previous week (ending on the Wednesday prior to publication) incomparison to the German data, the relation is significant only for the later part of our sample.This is most likely due to the fact that, until 2000, the AAII survey was conducted by regularmail. This procedure obviously introduces a lag of several days. We find strong support for thisconjecture when we estimate the correlation between the AAII index and the S&P return overthe previous week separately for the period before and after the change in procedure. Prior to2000 the correlation is 0.010 whereas after 2000 it is 0.287.
6

(defined as the spread between the US Treasury bill 3 month and 1 month rates)
and the US Treasury bill 1 month rate.
In the analysis of announcement day returns, we again use daily data. We regress
daily index returns on a variable which is equal to the sentiment indicator on
Thursdays and zero on all other days. The regression includes lagged index returns
and a Monday dummy (to control for a weekend effect) as control variables.
3 Predictive Regressions
3.1 Results for Germany
In this section we analyze whether investor sentiment, measured using the Sentix
survey, is able to predict asset returns for horizons from one to 26 weeks. As
proposed by Brown and Cliff (2005), we use a bootstrap simulation to account
for problems caused by overlapping observations and persistent regressors.8 We
estimate
(rt+1 + ...+ rt+k) = α(k) + Θ′(k)zt + β(k)St + ε(k)t , (1)
where rt+k denotes the k week-ahead future DAX log return. α(k) is the constant
for a forecasting horizon of k weeks, and zt is a vector of the control variables listed
in section 2.1. St is the value of the long-term Sentix survey. Using the bootstrap
procedure, we obtain coefficient estimates and associated p-values based on the
distribution of the estimated coefficients. Details of the procedure are explained
in the Appendix.
Table 3 shows the results obtained using the procedure described above. It shows
that the aggregate Sentix index, which, on average, consists of roughly three quar-
ters individual and one quarter institutional respondents, has predictive power for
future DAX 30 returns for periods from one to 8 weeks. The bootstrap coefficient
estimates are always larger than the OLS estimates, although the differences are
small. In spite of their larger numerical values, the bootstrap coefficients have8Compare also Brown and Cliff (2005), p. 418.
7

higher p-values. Our interpretation of the results will be based on the more con-
servative bootstrap procedure.
[Table 3 about here.]
The sign of the relationship between the sentiment indicator and future DAX
returns is positive. From the standard deviation of the Sentix index shown in
Table 1 and the coefficient of the predictive regression shown in Table 3, it follows
that a change of one standard deviation in the Sentix index is associated with
a change in the DAX of almost 2%. over an 8-week horizon. This is not only
statistically, but also economically significant.
These results could indicate that the sentiment index foreshadows future misval-
uation. Interestingly, the coefficient in the 26-week predictive regression is the
smallest of all the five predictive regressions. This pattern is consistent with the
sentiment index indicating a future misvaluation which is subsequently corrected
in the second half of the 26-week prediction period. Alternatively, the sentiment
indicator may contain information on future expected returns. The analysis of the
announcement day effects in section 4.1 will allow us to discriminate between these
interpretations. As previously noted, if the sentiment indicator contains informa-
tion about future expected returns, the announcement day effect should have a
sign opposite to that in the predictive regressions.
3.2 Results for the US
We conduct the same analysis as for the Sentix data for the American Association
of Individual Investors sentiment index. We use the Standard & Poors 500 index
as the index whose return is to be predicted. However, the results are qualitatively
identical for the Dow Jones Industrial Average, the NASDAQ 100, and the Russell
3000 indices. First, we apply our procedure to the whole period from 1987 to 2008.
The results, shown in Table 4, indicate that US individual investor sentiment is
inversely related to future S&P 500 returns. Using the bootstrap results, this
relation is significant only for the 26-week ahead forecast. These findings are con-
sistent with those of Fisher and Statman (2000) and Brown and Cliff (2005). These
8

authors also find an inverse relationship between sentiment and future returns for
samples covering the periods 1987-1998 and 1963-2000, respectively. Our negative
coefficient is consistent with the sentiment index indicating a current misvaluation
which is subsequently corrected over the forecasting period.
The record of the AAII sentiment index is much longer than that of the Sentix
index. In order to check whether the results are stable over time we split the
AAII data into three subperiods of approximately equal length and apply our
bootstrap procedure to each of these subsamples. The third subsample coincides
with the same period as our German sample. Table 5 shows that the negative
relationship between the AAII index and subsequent returns disappears over time.
It is very pronounced and highly significant in the 1987-1994 sample. In the
1994-2001 sample the coefficients retain their sign but are smaller in magnitude
and (at least when considering the bootstrap results) mostly insignificant. In the
final subperiod, most coefficient estimates are positive, and the coefficients for
the one- and four-week horizons are significant at the 10 percent level. In this
subperiod, then, the results for the US are qualitatively similar to those obtained
for the German case documented in Table 3. We also found coefficients that were
unanimously positive and significant for short forecasting horizons in that case.
We can only speculate about the reasons for the change in the predictive ability
of the AAII index over time. One possible explanation is the change in the way
the AAII survey is conducted. Originally, the votes were collected by post which
resulted in a lag of some days. This lag ceased when AAII began to collect the
votes via the internet in 2000. The change in the procedure may also have affected
the composition of the subgroup of AAII members that respond to the survey.
Finally, it is conceivable that the characteristics of the AAII members themselves
have changed over time.
As noted above, for the period 2001 - 2008 we find positive coefficients in the
predictive regressions both for Germany and the US. Although the signs of the
coefficients are similar for the two countries, their magnitude is not. Consider
the 8-week forecasting period as an example. As noted in the previous section
a change of one standard deviation in the Sentix index is associated with a 2%
9

change in the DAX over an 8-week horizon. The corresponding figure for the US
is less than 0.5%. It thus appears that the predictive power of the Sentix index
is stronger than that of the AAII index. This may be due to differences in the
populations of the respective participants. The Sentix index is much younger than
the AAII survey and is much less well known to the general public. Participants in
the Sentix survey are likely to be active traders with a strong interest in financial
markets. This may not be generally true for respondents to the AAII survey.9
[Table 4 about here.]
[Table 5 about here.]
4 Announcement Day Effects
4.1 Results for Germany
Having established that the German investor sentiment survey Sentix is indeed
able to predict the future movements in the DAX index, we now test whether the
market reacts to the publication of the sentiment indicator. To this end, we regress
daily DAX log returns rDAXt−1,t on their first lag10 and on the variable Sentimentt
which captures the information content of the sentiment indicator. Because the
Sentix index is published on Sunday evenings or on Monday mornings prior to the
start of trading, the variable Sentimentt is non-zero on Mondays and zero from
Tuesdays to Fridays.
Respondents to the German survey can submit their statement after observing
the closing prices on the US stock market. We therefore include the lagged log9To shed more light on the differences between the Sentix and AAII indices we related them
to the time series of flows into mutual funds (results are omitted from the paper). The resultsindicate that the AAII index is highly positively correlated to net flows into equity funds whilethere is no significant relation for the Sentix index.
10The DAX index is calculated from the prices in Xetra, the by far most liquid market forGerman stocks. Until November 2003 trading in Xetra closed at 8 p.m. Since then, however,trading in Xetra closes at 5.30 p.m. while trading on the floor of the Frankfurt Stock Exchange(which coexists with Xetra) continues until 8 p.m. When survey respondents submit their opinionduring the week end they know the prices from floor trading. Therefore, from November 2003onwards, the lagged DAX return included on the right-hand side is the return of an index calledLate DAX. It is based on the same formula and weighting scheme as the DAX but uses the pricesfrom the floor of the Frankfurt Stock Exchange.
10

returns of the S&P 500 index, rS&P500t−2,t−1 in our regression.11 Finally, we include a
Monday dummy 1Mondayt in order to capture possible day-of-the-week effects. For
daily returns, problems induced by serial correlation are not an issue. However,
the pattern of OLS residuals indicates strong ARCH effects, for which we account
by specifying a GARCH(1,1) model. We estimate the following equations12:
rDAXt−1,t = a0 + a1Sentimentt + a2r
DAXt−2,t−1 + a3r
S&P500t−2,t−1 + a41Mondayt + et (2)
σ2t = b0 + b1e
2t−1 + b2σ
2t−1.
We estimate three specifications. In the first, sentiment is measured as the level
of the Sentix value index. The second specification includes the change in the
value index rather than its level. The third specification only uses the unexpected
change in the value index. We obtain the unexpected change by first regressing the
sentiment index on its own lagged values and lagged DAX and S&P 500 returns
and then using the residuals from this regression This procedure is implemented
using expanding windows. Thus, the first-pass regression used to identify the
unexpected component of the sentiment index only uses information available at
time (t-1).13 Results are presented in table 6.
[Table 6 about here.]
We find a positive and significant announcement day effect irrespective of the
specification used. Thus, all three sentiment variables are significantly positively
correlated to daily closing log returns. Hence, the market appears to react to the
publication of the investor sentiment index. The DAX increases after a rise and
decreases after a fall in the sentiment indicator. Lagged index returns are also11If we omitted the lagged S&P500 returns, the sentiment indicator could be significant merely
due to the possibility that it serves as a proxy for the US stock returns after the close of tradingin Germany.
12As mentioned previously the Sentix index is published on Sunday evening or Monday morningprior to the opening of the market (time index t). We analyze whether the publication of theSentix index affects the DAX return from Friday’s close (time t-1) to Monday’s close (t).
13We use the data for 2001 to initialize the procedure. The first observations included in thesecond-pass regression are those for January 2002. Therefore, the number of observations inmodel 3 is lower than in models 1 and 2.
11

significant, while we find no clear evidence in favor of a Monday effect on the
German stock market.
The announcement day effect is positive and thus has the same sign as the intermediate-
term predictability documented in section 3.1. This finding is inconsistent with
the idea that the sentiment indicator provides information about future expected
returns. If it did, we would expect the announcement day effect to have the op-
posite sign to that found in the predictive regressions for the intermediate term.
Our results thus support a misvaluation interpretation of the predictive power of
sentiment indicators.
4.2 Results for the US
We conduct a similar analysis to that described above for the AAII sentiment sur-
vey.14 Remember from section 3.2 that we found negative, but mostly insignificant
coefficients in the predictive regressions over the full sample period. Consistent
with this result, the first panel of table 7 shows that, for the whole period, there
is no significant announcement effect on the day the AAII sentiment is published.
By considering the three sub-samples, we find results that mirror those of the
predictive regressions shown in table 5. The publication of the sentiment index
triggers a negative announcement day effect in the first subsample. The respec-
tive coefficient is significant (at the 10% level or better) in two out of the three
specifications. We do not find a significant announcement day effect for the later
subsamples. This is not surprising because the predictive regressions presented
earlier led to the conclusion that the AAII index is largely unrelated to future
returns in these subperiods.
The announcement day effect in the first sub-period has the same sign as that of
the coefficients in the predictive regressions. The results for the US, like those for
Germany, are thus inconsistent with the expected return news scenario. Rather,
they support the interpretation that investor sentiment is related to misvaluation.
[Table 7 about here.]14Model 3 again uses a expanding-window procedure. The first year of data (July 1987 - June
1988) is used to initialize the procedure, the analysis of the announcement day effects starts inJuly 1988.
12

5 Conclusion
If sentiment indicators predict future stock market returns over the intermediate
and long term (as is suggested by previous empirical research), smart traders can be
expected to exploit the information conveyed by the indicator and thus trigger an
immediate market response to the publication of the sentiment indicator. The sign
of the immediate price reaction will then be the same as that of the intermediate
and long-term predictability. If, on the other hand, sentiment indicators provide
new information about future expected returns, the sign of the immediate price
reaction will be opposite to that of the intermediate and long-term predictability.
The present paper is the first to empirically analyze whether an immediate market
reaction can be identified in the data, and whether the sign of such a reaction
corresponds to the sign of the intermediate and long-term predictive ability. In
order to investigate these matters, we use survey-based sentiment indicators from
the US (the AAII sentiment index) and for Germany (the Sentix index). In a first
step, we replicate earlier results showing that the sentiment indicators do indeed
have predictive power for future stock market returns over the intermediate term.
We further document that the predictive power of the AAII index has largely
disappeared in recent years.
In the second step of our analysis, we use event study methodology to test whether
the daily index returns respond to the publication of the sentiment indicator. We
do find a significant positive announcement day effect in Germany. This pattern is
consistent with mispricing and limited arbitrage. Smart investors are aware of the
predictive power of the sentiment indicator and trade accordingly. However, they
do not fully arbitrage the predictability away, possibly because of increased noise
trader risk (as in the model of de Long et al. (1990)). For the US market, there
is evidence of a negative publication day effect in the subperiod 1987-1994. As for
the German case, this result is consistent with the mispricing scenario and limited
arbitrage. In later subperiods, there is no significant publication day effect. This is
unsurprising, because the intermediate to long-term predictability also disappears
towards the end of the sample period.
Notwithstanding the differences between the results for Germany and the US , the
13

results for the two countries share one characteristic. They are both consistent with
a mispricing interpretation of the predictive power of sentiment and inconsistent
with the hypothesis that the sentiment indicator contains information about future
expected returns.
Appendix
Similar to Brown and Cliff (2005), we regress future k-week returns on the current
value of the sentiment index and control variables
(rt+1 + ...+ rt+k) = α(k) + Θ′(k)zt + β(k)St + ε(k)t ,
where the variables are defined as in section 3.1. The fact that we use overlapping
observations for the regressand induces an MA(k− 1) structure in the error terms
under the null hypothesis that ε(1) is serially uncorrelated. Since robust standard
errors, suggested by Hansen and Hodrick (1980), are known to perform poorly
in small samples and the existence of persistent regressors leads to a bias in the
coefficient estimates, we opt for a simulation approach to account for the bias and
to obtain appropriate critical values for inference.
We replicate the bootstrap simulation of Brown and Cliff (2005), pp. 437, and
start by estimating a VAR(1) model for yt = [rtStz′t]. After the estimation, we
impose the null hypothesis that the Sentix sentiment survey does not predict 1-
week returns, by setting the appropriate element in the coefficient vector of the
return equation equal to zero. We then adjust the constant in the constrained
model by adding the contribution of average sentiment to the returns obtained
by multiplying the original slope value of the sentiment by the average sentiment
level to the constant of the return equation. We bootstrap the residuals from the
calibration estimates to account for heteroscedasticity, and generate and discard
100 additional observations to delete possible starting effects. In each of the repli-
cations, a number equal to our original sample of simulated observations is used
to estimate our equation of interest for horizons from one to 26 weeks. Analogous
to Brown and Cliff, we repeat the procedure 10,000 times in order to obtain a
14

distribution of the values of β̂(k).
In order to gauge the statistical significance of the coefficient estimates we com-
pare the sentiment coefficient of the original model with the simulated probability
distribution in order to obtain p-values. Because these p-values are based on the
actual distribution of the residuals, they are robust to deviations from the normal
distribution.
15

References
Ang, A. and G. Bekaert (2007). Stock Return Predictability: Is it There? Review
of Financial Studies 20 (3), 651–707.
Baker, M. and J. Wurgler (2006). Investor Sentiment and the Cross-Section of
Stock Returns. The Journal of Finance 61 (4), 1645–1680.
Barber, B. and T. Odean (2008). All That Glitters: The Effect of Attention and
News on the Buying Behavior of Individual and Institutional Investors. Review
of Financial Studies 21 (2), 785–818.
Brown, G. W. and M. T. Cliff (2004). Investor sentiment and the near-term stock
market. Journal of Empirical Finance 11, 1–27.
Brown, G. W. and M. T. Cliff (2005). Investor sentiment and asset valuation.
Journal of Business 78 (2), 405–440.
Brown, S., W. Goetzmann, T. Hiraki, N. Shirishi, and M. Watanabe (2003). In-
vestor sentiment in japanese and us daily mutual fund flows. NBER Working
Paper No. W9470 .
Clarke, R. and M. Statman (1998). Bullish or Bearish? Financial Analysts Jour-
nal 54 (3), 63–72.
De Long, J. B., A. Shleifer, L. H. Summers, and R. J. Waldmann (1990). Noise
trader risk in financial markets. Journal of Political Economy 98 (4), 703–738.
Dennis, P. and S. Mayhew (2002). Risk-Neutral Skewness: Evidence from Stock
Options. Journal of Financial and Quantitative Analysis 37 (3), 471–493.
Elton, E. J., M. J. Gruber, and J. A. Busse (1998). Do investors care about
sentiment? Journal of Business 71 (4), 477–500.
Fisher, K. and M. Statman (2000). Investor Sentiment and Stock Returns. Finan-
cial Analysts Journal 56 (2), 16–23.
16

Hansen, L. and R. Hodrick (1980). Forward exchange rates as optimal predic-
tors of future spot rates: An econometric analysis. The Journal of Political
Economy 88 (5), 829.
Kaniel, R., G. Saar, and S. Titman (2008). Individual Investor Sentiment and
Stock Returns. Journal of Finance 63 (1), 273–310.
Kumar, A. and C. Lee (2002). Individual Investor Sentiment and Comovement in
Small Stock Returns.
Kumar, A. and C. Lee (2006). Retail Investor Sentiment and Return Comovements.
The Journal of Finance 61 (5), 2451–2486.
Lee, C. M. C., A. Shleifer, and R. H. Thaler (1991). Investor sentiment and the
closed-end fund puzzle. Journal of Finance 46 (1), 75–109.
Neal, R. and S. M. Wheatley (1998). Do measures of investor sentiment predict
returns? Journal of Financial and Quantitative Analysis 33 (4), 523–547.
Otoo, M. (1999). Consumer sentiment and the stock market. FEDS Working
Paper No. 99-60 .
Schmeling, M. (2007). Institutional and individual sentiment: Smart money and
noise trader risk? International Journal of Forecasting 23 (1), 127–145.
Schmitz, P., M. Glaser, and M. Weber (2009). Individual Investor Sentiment and
Stock Returns-What Do We Learn from Warrant Traders? Working Paper .
Shiller, R. (2000). Measuring Bubble Expectations and Investor Confidence. The
Journal of Psychology and Financial Markets 1 (1), 49–60.
Solt, M. and M. Statman (1988). How useful is the sentiment index? Financial
Analysts Journal 44 (5), 45–55.
Stambaugh, R. (1999). Predictive regressions. Journal of Financial Eco-
nomics 54 (3), 375–421.
17

Verma, R., H. Baklaci, and G. Soydemi (2008). The impact of rational and irra-
tional sentiments of individual and institutional investors on DJIA and S&P500
index returns. Applied Financial Economics 18 (16), 1303–1317.
18

Tables
Table 1: Summary Statistics of German data
Mean Std. Dev. ρi ρs,i
Sentixt 0.121 0.113 0.773 1.000∆Sentixt -0.000 0.067 -0.301 0.335InnoSentixt 0.002 0.058 0.070 0.726rDAXt−2,t−1 0.000 0.032 0.016 0.048rS&P500t−2,t−1 0.000 0.022 -0.054 0.007EUR/USDt−1 1.185 0.187 0.988 0.029Term Spreadt−1 0.011 0.008 0.986 -0.107Credit Spreadt−1 0.011 0.003 0.946 -0.243Liquidity Spreadt−1 0.001 0.001 0.937 0.112Euribor 1mt−1 0.031 0.009 0.990 -0.025
The table presents summary statistics for the German data. All returns are from Fridayclose to the next Friday close. Other control variables (the EUR/USD exchange rate,the term, credit and liquidity spread and the Euribor 1-month rate) are from Friday.The Sentix index is published on Sunday evenings or Monday mornings. Sentixt denotesthe index level, ∆Sentixt denotes its weekly change, and InnoSentixt the unexpectedcomponent of the index (the residual of a linear regression of the index on its laggedvalue and the lagged DAX return). ρi denotes the first-order serial correlation of variablei, ρs,i denotes the correlation between the Sentix index and variable i.
19

Table 2: Summary Statistics of US data
Mean Std. Dev. ρi ρs,i
AAIIt 0.099 0.188 0.670 1.000∆AAIIt -0.001 0.152 -0.343 0.400InnoAAIIt 0.008 0.135 -0.144 0.738rS&P500t−2,t−1 0.001 0.021 -0.053 0.134USD/EURt−1 1.168 0.149 0.990 -0.198Term Spreadt−1 0.017 0.012 0.992 0.026Credit Spreadt−1 0.009 0.002 0.979 -0.202Liquidity Spreadt−1 0.027 0.012 0.989 -0.132Treasury bill 1mt−1 0.017 0.008 0.988 -0.152
The table presents summary statistics for the US data. All returns are for the weekprior to the publication of the AAII index. Other control variables (the USD/EURexchange rate, the term, credit and liquidity spread and the 1-month T-bill rate) arefromWednesdays. The AAII index is published on Thursday morning. AAIIt denotes theindex level, ∆AAIIt denotes its weekly change, and InnoAAIIt the unexpected componentof the index (the residual of a regression of the index on its lagged value and the laggedS&P return). ρi denotes the first-order serial correlation of variable i, ρs,i denotes thecorrelation between the AAII index and variable i.
20

Table 3: Sentiment Coefficient in k-Week Regressions for Aggregate 6 Month DAXSentiment
Reg. Horizon OLS Bootstrapβ̂OLS Sig. level β̃SIM Sig. level
1 week 0.0395∗∗ 0.011 0.0403∗∗ 0.0364 weeks 0.1101∗∗∗ 0.000 0.1156∗∗ 0.0498 weeks 0.1783∗∗∗ 0.000 0.1887∗∗ 0.04113 weeks 0.1337∗∗∗ 0.000 0.1519 0.19426 weeks -0.0455 0.712 -0.0179 0.958
The table presents the β coefficients of equation (rt+1 + ... + rt+k) = α(k) + Θ′(k)zt +β(k)St +ε(k)
t obtained from OLS estimation (columns 1 and 2) and bootstrap simulationsas explained in the appendix (columns 3 and 4). Results are presented for forecastinghorizons of k = 1, 4, 8, 13, 26 weeks. The control variables are listed in section 2.1. ∗ ∗ ∗,∗∗ and ∗ denote statistical significance at the 1%, 5% and 10% levels, respectively.
21

Table 4: Sentiment Coefficient in k-Week Regressions for AAII Sentiment and S&P500
Reg. Horizon OLS Bootstrapβ̂OLS Sig. level β̃SIM Sig. level
1 week 0.0024 0.810 0.0029 0.3714 weeks -0.0159∗∗∗ 0.002 -0.0142 0.2648 weeks -0.0252∗∗∗ 0.000 -0.0223 0.27313 weeks -0.0433∗∗∗ 0.000 -0.0389 0.12926 weeks -0.0729∗∗∗ 0.000 -0.0651∗ 0.076
The table presents the β coefficients of equation (rt+1 + ... + rt+k) = α(k) + Θ′(k)zt +β(k)St +ε(k)
t obtained from OLS estimation (columns 1 and 2) and bootstrap simulationsas explained in the Appendix (columns 3 and 4). Results are presented for periods ofk = 1, 4, 8, 13, 26 weeks. The control variables are listed in section 2.2. ∗ ∗ ∗, ∗∗ and ∗denote statistical significance at the 1%, 5% and 10% levels, respectively.
22
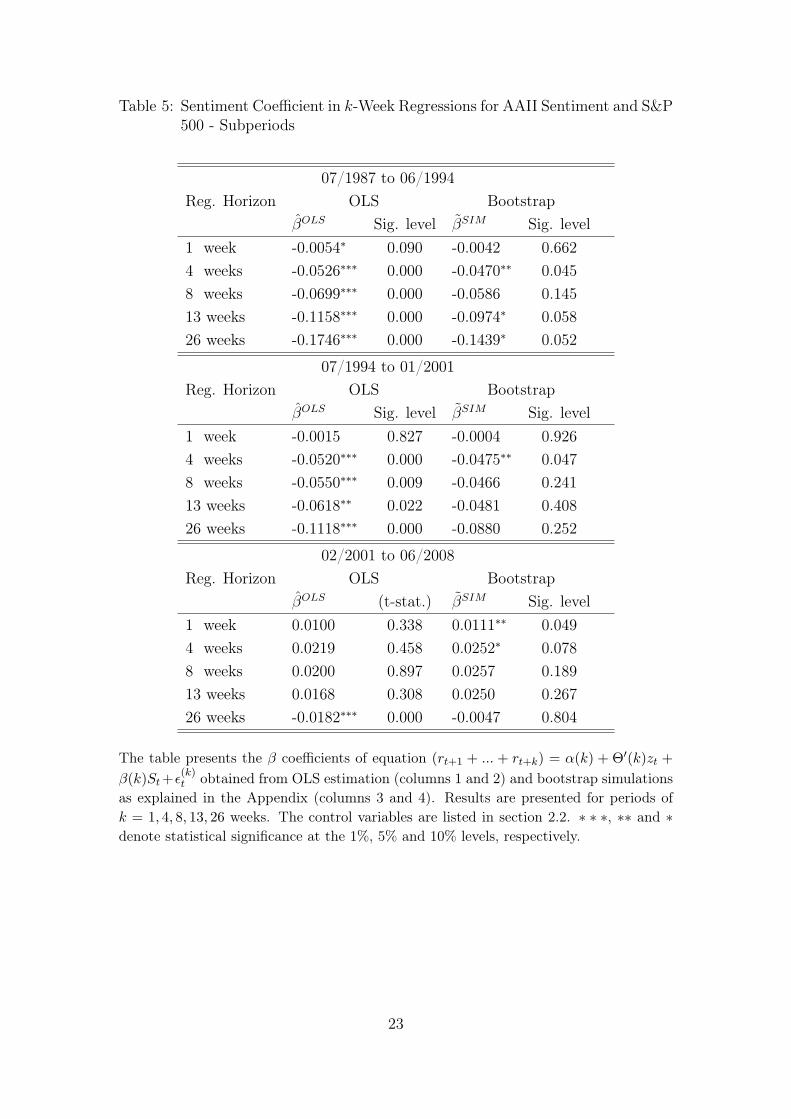
Table 5: Sentiment Coefficient in k-Week Regressions for AAII Sentiment and S&P500 - Subperiods
07/1987 to 06/1994Reg. Horizon OLS Bootstrap
β̂OLS Sig. level β̃SIM Sig. level1 week -0.0054∗ 0.090 -0.0042 0.6624 weeks -0.0526∗∗∗ 0.000 -0.0470∗∗ 0.0458 weeks -0.0699∗∗∗ 0.000 -0.0586 0.14513 weeks -0.1158∗∗∗ 0.000 -0.0974∗ 0.05826 weeks -0.1746∗∗∗ 0.000 -0.1439∗ 0.052
07/1994 to 01/2001Reg. Horizon OLS Bootstrap
β̂OLS Sig. level β̃SIM Sig. level1 week -0.0015 0.827 -0.0004 0.9264 weeks -0.0520∗∗∗ 0.000 -0.0475∗∗ 0.0478 weeks -0.0550∗∗∗ 0.009 -0.0466 0.24113 weeks -0.0618∗∗ 0.022 -0.0481 0.40826 weeks -0.1118∗∗∗ 0.000 -0.0880 0.252
02/2001 to 06/2008Reg. Horizon OLS Bootstrap
β̂OLS (t-stat.) β̃SIM Sig. level1 week 0.0100 0.338 0.0111∗∗ 0.0494 weeks 0.0219 0.458 0.0252∗ 0.0788 weeks 0.0200 0.897 0.0257 0.18913 weeks 0.0168 0.308 0.0250 0.26726 weeks -0.0182∗∗∗ 0.000 -0.0047 0.804
The table presents the β coefficients of equation (rt+1 + ... + rt+k) = α(k) + Θ′(k)zt +β(k)St +ε(k)
t obtained from OLS estimation (columns 1 and 2) and bootstrap simulationsas explained in the Appendix (columns 3 and 4). Results are presented for periods ofk = 1, 4, 8, 13, 26 weeks. The control variables are listed in section 2.2. ∗ ∗ ∗, ∗∗ and ∗denote statistical significance at the 1%, 5% and 10% levels, respectively.
23

Table 6: Estimation Results for Daily DAX Log Returns of Closing Prices
Specification (1) (2) (3)Coef. Coef. Coef.
Variable (|t− stat.|) (|t− stat.|) (|t− stat.|)Sentixt 0.012∗∗
(2.12)∆Sentixt 0.025∗∗
(2.52)InnoSentixt 0.025∗∗
(2.30)rDAXt−2,t−1 -0.166∗∗∗ -0.166∗∗∗ -0.182∗∗∗
(5.98) (5.83) (5.99)rS&P500t−2,t−1 0.285∗∗∗ 0.287∗∗∗ 0.289∗∗∗
(8.91) (8.51) (8.05)1Mondayt -0.001 7e-04 3e-04
(1.27) (1.14) (0.51)Const. 6e-04∗∗ 6e-04∗∗ 7e-04∗∗
(2.33) (2.32) (2.52)Obs. 1,916 1,911 1,695Adj.R2 0.033 0.034 0.035
The table shows the results of a GARCH(1,1) with mean equation rDAXt−1,t = a0 +
a1Sentimentt + a2rDAXt−2,t−1 + a3r
S&P500t−2,t−1 + a41Mondayt + et. rDAX
t−1,t is the return on theDAX index, rS&P500
t−2,t−1 is the return on the S&P 500 index, Sentimentt is equal to oursentiment measure on Mondays and zero else, and 1Mondayt is a dummy variable that isset to one on Mondays. We use three sentiment measures, the level of the Sentix index(column 1), the first difference (column 2) and the residual from a regression of the Sentixindex on its lagged value and the lagged DAX and S&P 500 returns (column 3). ***, **and * denote significance at the 1%, 5%, and 10% level, respectively.
24

Table 7: Estimation Results for Daily S&P 500 Log Returns of Closing Prices
07/1987 to 06/2008 07/1987 to 06/1994Specification (1) (2) (3) (1) (2) (3)
Coef. Coef. Coef. Coef. Coef. Coef.Variable (|t− stat.|) (|t− stat.|) (|t− stat.|) (|t− stat.|) (|t− stat.|) (|t− stat.|)AAIIt 0.000 -0.005∗∗
(0.17) (2.43)∆AAIIt -0.001 -0.003
(0.77) (1.23)InnoAAIIt -0.000 -0.004∗
(0.06) (1.71)rS&P500t−2,t−1 -0.007 -0.007 -0.007 0.006 0.003 0.011
(0.43) (0.48) (0.47) (0.20) (0.10) (0.46)1Mondayt 0.000 0.000 0.000 0.001 0.001 0.001∗∗
(1.15) (1.17) (1.40) (1.22) (1.33) (2.18)Const. 0.000∗∗∗ 0.000∗∗∗ 0.000∗∗∗ 0.000 0.000 0.000
(3.50) (3.63) (3.06) (1.58) (1.28) (0.42)
07/1994 to 01/2001 02/2001 to 06/2008Specification (1) (2) (3) (1) (2) (3)
Coef. Coef. Coef. Coef. Coef. Coef.Variable (|t− stat.|) (|t− stat.|) (|t− stat.|) (|t− stat.|) (|t− stat.|) (|t− stat.|)AAIIt -0.001 0.002
(0.31) (0.86)∆AAIIt 0.002 -0.001
(0.54) (0.49)InnoAAIIt 0.001 0.001
(0.24) (0.30)rS&P500t−2,t−1 0.041 0.041 0.041 -0.061∗∗ -0.061∗∗ -0.061∗∗
(1.53) (1.54) (1.54) (2.40) (2.40) (2.39)1Mondayt -0.000 -0.000 -0.000 0.000 0.000 0.000
(0.62) (0.60) (0.58) (0.58) (0.44) (0.44)Const. 0.001∗∗∗ 0.001∗∗∗ 0.001∗∗∗ 0.000 0.000 0.000
(4.04) (4.32) (4.23) (0.98) (1.28) (1.28)
The table shows the results of a GARCH(1,1) with mean equation rS&P500t−1,t = a0 +
a1Sentimentt + a2rS&P500t−2,t−1 + a31Mondayt + et. rS&P500
t−1,t is the return on the S&P 500index, Sentimentt is equal to our sentiment measure on Thursdays and zero else, and1Mondayt is a dummy variable that is set to one on Mondays. We use three sentimentmeasures, the level of the AAII index (column 1), the first difference (column 2) andthe residual from a regression of the AAII index on its lagged value and the lagged S&P500 return (column 3). ***, ** and * denote significance at the 1%, 5%, and 10% level,respectively.
25

CFR Working Paper Series
Centre for Financial Research Cologne
CFR Working Papers are available for download from www.cfr-cologne.de. Hardcopies can be ordered from: Centre for Financial Research (CFR), Albertus Magnus Platz, 50923 Koeln, Germany. 2011 No. Author(s) Title 11-08 11-07 11-06 11-05 11-04 11-03 11-02 11-01 2010 No.
G. Cici, L.-F. Palacios V. Agarwal, G. D. Gay, L. Ling N. Hautsch, D. Hess, D. Veredas G. Cici S. Jank G.Fellner, E.Theissen S.Jank V. Agarwal, C. Meneghetti Author(s)
On the Use of Options by Mutual Funds: Do They Know What They Are Doing? Window Dressing in Mutual Funds The Impact of Macroeconomic News on Quote Adjustments, Noise, and Informational Volatility The Prevalence of the Disposition Effect in Mutual Funds' Trades Mutual Fund Flows, Expected Returns and the Real Economy Short Sale Constraints, Divergence of Opinion and Asset Value: Evidence from the Laboratory Are There Disadvantaged Clienteles in Mutual Funds? The role of Hedge Funds as Primary Lenders Title
10-20 10-19 10-18 10-17 10-16
G. Cici, S. Gibson, J.J. Merrick Jr. J. Hengelbrock, E. Theissen, Ch. Westheide G. Cici, S. Gibson D. Hess, D. Kreutzmann, O. Pucker S. Jank, M. Wedow
Missing the Marks? Dispersion in Corporate Bond Valuations Across Mutual Funds Market Response to Investor Sentiment The Performance of Corporate-Bond Mutual Funds: Evidence Based on Security-Level Holdings Projected Earnings Accuracy and the Profitability of Stock Recommendations Sturm und Drang in Money Market Funds: When Money Market Funds Cease to Be Narrow
10-15 G. Cici, A. Kempf, A.
Puetz Caught in the Act: How Hedge Funds Manipulate their Equity Positions
10-14 J. Grammig, S. Jank Creative Destruction and Asset Prices

10-13 S. Jank, M. Wedow Purchase and Redemption Decisions of Mutual Fund
Investors and the Role of Fund Families 10-12 S. Artmann, P. Finter,
A. Kempf, S. Koch, E. Theissen
The Cross-Section of German Stock Returns: New Data and New Evidence
10-11 M. Chesney, A. Kempf The Value of Tradeability 10-10 S. Frey, P. Herbst The Influence of Buy-side Analysts on
Mutual Fund Trading 10-09 V. Agarwal, W. Jiang,
Y. Tang, B. Yang Uncovering Hedge Fund Skill from the Portfolio Holdings They Hide
10-08 V. Agarwal, V. Fos,
W. Jiang Inferring Reporting Biases in Hedge Fund Databases from Hedge Fund Equity Holdings
10-07 V. Agarwal, G. Bakshi,
J. Huij Do Higher-Moment Equity Risks Explain Hedge Fund Returns?
10-06 J. Grammig, F. J. Peter Tell-Tale Tails 10-05 K. Drachter, A. Kempf Höhe, Struktur und Determinanten der Managervergütung-
Eine Analyse der Fondsbranche in Deutschland 10-04 J. Fang, A. Kempf,
M. Trapp Fund Manager Allocation
10-03 P. Finter, A. Niessen-
Ruenzi, S. Ruenzi The Impact of Investor Sentiment on the German Stock Market
10-02 D. Hunter, E. Kandel,
S. Kandel, R. Wermers Endogenous Benchmarks
10-01 S. Artmann, P. Finter,
A. Kempf Determinants of Expected Stock Returns: Large Sample Evidence from the German Market
2009 No. Author(s) Title 09-17
E. Theissen
Price Discovery in Spot and Futures Markets: A Reconsideration
09-16 M. Trapp Trading the Bond-CDS Basis – The Role of Credit Risk
and Liquidity 09-14 A. Kempf, O. Korn,
M. Uhrig-Homburg The Term Structure of Illiquidity Premia
09-13 W. Bühler, M. Trapp Time-Varying Credit Risk and Liquidity Premia in Bond and
CDS Markets 09-12 W. Bühler, M. Trapp
Explaining the Bond-CDS Basis – The Role of Credit Risk and Liquidity
09-11 S. J. Taylor, P. K. Yadav,
Y. Zhang
Cross-sectional analysis of risk-neutral skewness
09-10 A. Kempf, C. Merkle,
A. Niessen Low Risk and High Return - How Emotions Shape Expectations on the Stock Market
09-09 V. Fotak, V. Raman,
P. K. Yadav Naked Short Selling: The Emperor`s New Clothes?
09-08 F. Bardong, S.M. Bartram,
P.K. Yadav Informed Trading, Information Asymmetry and Pricing of Information Risk: Empirical Evidence from the NYSE

09-07 S. J. Taylor , P. K. Yadav, Y. Zhang
The information content of implied volatilities and model-free volatility expectations: Evidence from options written on individual stocks
09-06 S. Frey, P. Sandas The Impact of Iceberg Orders in Limit Order Books 09-05 H. Beltran-Lopez, P. Giot,
J. Grammig Commonalities in the Order Book
09-04 J. Fang, S. Ruenzi Rapid Trading bei deutschen Aktienfonds: Evidenz aus einer großen deutschen Fondsgesellschaft
09-03 A. Banegas, B. Gillen,
A. Timmermann, R. Wermers
The Performance of European Equity Mutual Funds
09-02 J. Grammig, A. Schrimpf,
M. Schuppli Long-Horizon Consumption Risk and the Cross-Section of Returns: New Tests and International Evidence
09-01 O. Korn, P. Koziol The Term Structure of Currency Hedge Ratios 2008 No. Author(s) Title 08-12
U. Bonenkamp, C. Homburg, A. Kempf
Fundamental Information in Technical Trading Strategies
08-11 O. Korn Risk Management with Default-risky Forwards 08-10 J. Grammig, F.J. Peter International Price Discovery in the Presence
of Market Microstructure Effects 08-09 C. M. Kuhnen, A. Niessen Public Opinion and Executive Compensation 08-08 A. Pütz, S. Ruenzi Overconfidence among Professional Investors: Evidence from
Mutual Fund Managers 08-07 P. Osthoff What matters to SRI investors? 08-06 08-05 08-04
A. Betzer, E. Theissen P. Linge, E. Theissen N. Hautsch, D. Hess, C. Müller
Sooner Or Later: Delays in Trade Reporting by Corporate Insiders Determinanten der Aktionärspräsenz auf Hauptversammlungen deutscher Aktiengesellschaften Price Adjustment to News with Uncertain Precision
08-03 D. Hess, H. Huang,
A. Niessen How Do Commodity Futures Respond to Macroeconomic News?
08-02 R. Chakrabarti,
W. Megginson, P. Yadav Corporate Governance in India
08-01 C. Andres, E. Theissen Setting a Fox to Keep the Geese - Does the Comply-or-Explain
Principle Work? 2007 No. Author(s) Title 07-16
M. Bär, A. Niessen, S. Ruenzi
The Impact of Work Group Diversity on Performance: Large Sample Evidence from the Mutual Fund Industry

07-15 A. Niessen, S. Ruenzi Political Connectedness and Firm Performance: Evidence From Germany
07-14 O. Korn Hedging Price Risk when Payment Dates are Uncertain 07-13 A. Kempf, P. Osthoff SRI Funds: Nomen est Omen 07-12 J. Grammig, E. Theissen,
O. Wuensche Time and Price Impact of a Trade: A Structural Approach
07-11 V. Agarwal, J. R. Kale On the Relative Performance of Multi-Strategy and Funds of
Hedge Funds 07-10 M. Kasch-Haroutounian,
E. Theissen Competition Between Exchanges: Euronext versus Xetra
07-09 V. Agarwal, N. D. Daniel,
N. Y. Naik Do hedge funds manage their reported returns?
07-08 N. C. Brown, K. D. Wei,
R. Wermers Analyst Recommendations, Mutual Fund Herding, and Overreaction in Stock Prices
07-07 A. Betzer, E. Theissen Insider Trading and Corporate Governance:
The Case of Germany 07-06 V. Agarwal, L. Wang Transaction Costs and Value Premium 07-05 J. Grammig, A. Schrimpf Asset Pricing with a Reference Level of Consumption:
New Evidence from the Cross-Section of Stock Returns 07-04 V. Agarwal, N.M. Boyson,
N.Y. Naik
Hedge Funds for retail investors? An examination of hedged mutual funds
07-03 D. Hess, A. Niessen The Early News Catches the Attention:
On the Relative Price Impact of Similar Economic Indicators 07-02 A. Kempf, S. Ruenzi,
T. Thiele Employment Risk, Compensation Incentives and Managerial Risk Taking - Evidence from the Mutual Fund Industry -
07-01 M. Hagemeister, A. Kempf CAPM und erwartete Renditen: Eine Untersuchung auf Basis
der Erwartung von Marktteilnehmern 2006 No. Author(s) Title 06-13
S. Čeljo-Hörhager, A. Niessen
How do Self-fulfilling Prophecies affect Financial Ratings? - An experimental study
06-12 R. Wermers, Y. Wu,
J. Zechner Portfolio Performance, Discount Dynamics, and the Turnover of Closed-End Fund Managers
06-11 U. v. Lilienfeld-Toal,
S. Ruenzi Why Managers Hold Shares of Their Firm: An Empirical Analysis
06-10 A. Kempf, P. Osthoff The Effect of Socially Responsible Investing on Portfolio Performance
06-09 R. Wermers, T. Yao, J. Zhao
The Investment Value of Mutual Fund Portfolio Disclosure
06-08 M. Hoffmann, B. Kempa The Poole Analysis in the New Open Economy
Macroeconomic Framework
06-07 K. Drachter, A. Kempf, M. Wagner
Decision Processes in German Mutual Fund Companies: Evidence from a Telephone Survey
06-06 J.P. Krahnen, F.A.
Schmid, E. Theissen Investment Performance and Market Share: A Study of the German Mutual Fund Industry
06-05 S. Ber, S. Ruenzi On the Usability of Synthetic Measures of Mutual Fund Net-

Flows 06-04 A. Kempf, D. Mayston Liquidity Commonality Beyond Best Prices
06-03 O. Korn, C. Koziol Bond Portfolio Optimization: A Risk-Return Approach 06-02 O. Scaillet, L. Barras, R.
Wermers False Discoveries in Mutual Fund Performance: Measuring Luck in Estimated Alphas
06-01 A. Niessen, S. Ruenzi Sex Matters: Gender Differences in a Professional Setting 2005
No. Author(s) Title 05-16
E. Theissen
An Analysis of Private Investors´ Stock Market Return Forecasts
05-15 T. Foucault, S. Moinas,
E. Theissen Does Anonymity Matter in Electronic Limit Order Markets
05-14 R. Kosowski,
A. Timmermann, R. Wermers, H. White
Can Mutual Fund „Stars“ Really Pick Stocks? New Evidence from a Bootstrap Analysis
05-13 D. Avramov, R. Wermers Investing in Mutual Funds when Returns are Predictable 05-12 K. Griese, A. Kempf Liquiditätsdynamik am deutschen Aktienmarkt 05-11 S. Ber, A. Kempf,
S. Ruenzi Determinanten der Mittelzuflüsse bei deutschen Aktienfonds
05-10 M. Bär, A. Kempf,
S. Ruenzi Is a Team Different From the Sum of Its Parts? Evidence from Mutual Fund Managers
05-09 M. Hoffmann Saving, Investment and the Net Foreign Asset Position 05-08 S. Ruenzi Mutual Fund Growth in Standard and Specialist Market
Segments 05-07 A. Kempf, S. Ruenzi Status Quo Bias and the Number of Alternatives
- An Empirical Illustration from the Mutual Fund Industry –
05-06 05-05
J. Grammig, E. Theissen H. Beltran, J. Grammig, A.J. Menkveld
Is Best Really Better? Internalization of Orders in an Open Limit Order Book Understanding the Limit Order Book: Conditioning on Trade Informativeness
05-04 M. Hoffmann Compensating Wages under different Exchange rate Regimes 05-03 M. Hoffmann Fixed versus Flexible Exchange Rates: Evidence from
Developing Countries 05-02 A. Kempf, C. Memmel On the Estimation of the Global Minimum Variance Portfolio 05-01 S. Frey, J. Grammig Liquidity supply and adverse selection in a pure limit order
book market 2004 No. Author(s) Title 04-10
N. Hautsch, D. Hess
Bayesian Learning in Financial Markets – Testing for the Relevance of Information Precision in Price Discovery
04-09 A. Kempf, Portfolio Disclosure, Portfolio Selection and Mutual Fund

K. Kreuzberg Performance Evaluation 04-08 N.F. Carline, S.C. Linn,
P.K. Yadav Operating performance changes associated with corporate mergers and the role of corporate governance
04-07 J.J. Merrick, Jr., N.Y.
Naik, P.K. Yadav Strategic Trading Behavior and Price Distortion in a Manipulated Market: Anatomy of a Squeeze
04-06 N.Y. Naik, P.K. Yadav Trading Costs of Public Investors with Obligatory and
Voluntary Market-Making: Evidence from Market Reforms 04-05 A. Kempf, S. Ruenzi Family Matters: Rankings Within Fund Families and
Fund Inflows 04-04 V. Agarwal,
N.D. Daniel, N.Y. Naik Role of Managerial Incentives and Discretion in Hedge Fund Performance
04-03 V. Agarwal, W.H. Fung,
J.C. Loon, N.Y. Naik Risk and Return in Convertible Arbitrage: Evidence from the Convertible Bond Market
04-02 A. Kempf, S. Ruenzi Tournaments in Mutual Fund Families 04-01 I. Chowdhury, M.
Hoffmann, A. Schabert Inflation Dynamics and the Cost Channel of Monetary Transmission

Cfr/University of cologne
Albertus-Magnus-Platz
D-50923 Cologne
Fon +49(0)221-470-6995
Fax +49(0)221-470-3992