Embed Size (px)
Citation preview

Photo (top): An exploration drill rig on Lake Lefroy, south of Kambalda. This photograph is reproduced with the kind permission of BHP Billiton Mineral Exploration, from the Western Mining Corporation Holdings Limited 1990 Annual Report to Shareholders
CET Quarterly News
The Role of Early Formed Structures on the Development of the World Class St Ives Gold Camp, Yilgarn, WA By John Miller, Richard Blewett , Janet Tunjic & Karen Connors
IntroductionDilational and contractional jogs are a key control on the development of major gold systems along the Boulder-Lefroy Fault, with many deposits located on fault jogs that were dilatant during late-stage gold mineralisation (e.g., Weinberg et al., 2004). At St Ives the largest gold deposits are located on major contractional jogs (e.g., Revenge and Repulse Faults; Nguyen et al., 1998; Cox and Ruming, 2004). Extensive industry and academic research has focused on the control these structural features have on the formation of gold deposits. However, what hasn’t been addressed is why these features have developed, and why so many of these structures control the location of the key host dolerite units e.g., the Defiance and Golden Mile dolerites?
The role of early rift architecture on the subsequent development of thrust belts, igneous centres, and the controls on mineralisation, has been recognized for some time (e.g. Lund, 2008). Any structural interpretation of a thrust or strike-slip belt should consider the potential of the earlier rift architecture, as this may have exerted a fundamental control on the evolution of the system. However, identifying these early features in old terranes, such as the Yilgarn Craton, is problematic. This article presents a new structural interpretation that is utilized to assess the link between early extensional fault architecture, ultramafic and mafic rock type distributions and the development of the current fault topography. The research was part of the Predictive Mineral Discovery Cooperative Research Centre Y4 project.
ISSUE 8, JUNE 2009
Figure 1. High-pass filtered gravity with key gravity trends annotated. Image from Gold Fields Pty Ltd
In This Issue...Feature Articles plus more• The Role of Early Formed Structures on the Development of the World
Class St Ives Gold Camp, Yilgarn, WA - Dr John Miller et al 1
• The Exploration Search Space Concept: Key to a Successful Exploration
Strategy - Adj Prof Jon Hronsky 14
• Estimating Historical Probabilities of Discovery in Mineral exploration
Adj Prof Pietro Guj et al 16
Continued on page 4

2www.cet.uwa.edu.auhttp://members.cet.uwa.edu.au
Major Producer
Anglo American Exploration (Aust) Pty Ltd
AngloGold Ashanti Australia Limited
Barrick Gold of Aust Ltd
BHP Billiton
Cameco Australia Pty Ltd
De Beers Australia
Gold Fields Australasia
Newcrest Mining Ltd
Newmont Mining Services Pty Ltd
Norilsk Nickel
OZ Minerals
Rio Tinto Exploration Pty Ltd
Teck Cominco Australia Pty Ltd
Vale Australia
Emerging Producer
Alkane Resources Limited
Consolidated Minerals Limited
Dominion Mining Ltd
Heron Resources Limited
Independence Group NL
Mincor Resources NL
Mineral Deposits Ltd
Mitchell River Group
Portman Iron Ore Limited
Sipa Resources Limited
St Barbara Limited
Troy Resources NL
Junior Explorer
Anglo Australian Resources NL
A1 Minerals Limited
Apex Minerals Limited
Breakaway Resources Limited
Brockman Resources Limited
Cryptodome Pty Ltd
Dragon Mountain Gold Ltd
Emmerson Resources
Encounter Resources Limited
Focus Minerals Limited
Hampton Hill Mining NL
Image Resources NL
Magma Metals Limited
Mr Mark G Creasy
Tanami Gold NL
Transcontinental Investments Pty Ltd
Universal Resources Ltd
In-Kind
Datamine
Digirock
Earth Mapping Resourcing Ltd
Runge Limited
Gemcom Australia Pty Ltd
Geosoft Australia Pty Ltd
Intierra Resources Intelligence
ioGlobal
Maptek Pty Ltd
Micromine Pty Ltd
Zaparo Limited
Corporate Membership 2008/09
• Access to the Corporate Members secure site: http://members.cet.uwa.edu.au
• Corporate Members containing copies of presentations & pre-publication release of research outcomes;
• Attendance at the Annual Corporate Membership Day with presentations of the latest research outcomes applied to Mineral Exploration;
• Receive quarterly CET Newsletters;
• Prominent recognition of Corporate Members;
• Becoming a preferred research partner – as CET staff develop new concepts and tools to apply to mineral exploration, Corporate Members will have the first opportunity to participate;
• Early access to non-proprietary research outcomes and ideas in a user-friendly format;
• Preferred access to CET research staff and distinguished visiting researchers;
• Opportunities to network with students, your future employees, through our seminar series and networking functions for Members;
• Discounts on training courses (20%).
• Use of a CET logo
To register for Corporate Membership, please visit http://www.cet.uwa.edu.au/corporate_memberssponsors
The Benefits of Becoming a Corporate Member of CET include:

3www.cet.uwa.edu.auhttp://members.cet.uwa.edu.au
The last quarter has brought continuing challenges in the wake of the Global Financial Crisis, and many of our Corporate Members have been hit hard by the resultant commodity crisis.
However, several Members have also noted an unexpected benefit from the downturn - that due to the slowdown in drilling that has resulted from budget cuts, their geologists are now having more time to think. This is leading to the identification of key geological problems that remain to be resolved on their projects.
In these difficult times, companies have to continue to innovate and invest in R&D appropriate to the scale of their problems to stay viable. Because of the CET’s strong focus on industry outcomes, industry sees CET as a vehicle through which to achieve this. Evidence of this is that in the same month that Prime Minister Kevin Rudd announced that Australia was in recession, the CET signed on $1.5M in research contracts. The key to this success has been recruiting a top team that is working very hard to help our Corporate Membership identify and solve their problems, and a proactive industry-led Board and External Advisory Group working on behalf of our Members. I hope that as you read the articles on CET research outcomes, training courses on offer and CET activities in this newsletter, CET’s focus on adding value for our collective Corporate Membership is clear.
The focus on industry deliverables does not mean less fundamental research. I am most excited that research in the Centre has produced three papers in Nature (the premier journal in natural sciences) in the past two years, showing that the CET knows how to successfully
marry fundamental and applied research.
There are also signs that the industry may be turning the long-awaited corner to recovery. In the month of April, many contracting and consulting groups noted that they became busy again. With all metal futures up, there are signs that the market is becoming more receptive to resource stocks. Those companies that made the hard decisions of cutbacks within the last 6 months are slowly starting to rebuild and position themselves for the imminent recovery.
A strong Corporate Membership is critical to CET’s viability, and we take the needs of our Members seriously. As the recovery of the resource sector continues to unfold, CET looks forward to engaging with our Corporate Membership on a variety of fronts. As Director, I invite you to engage with our staff and students to identify areas where we can assist your exploration programs through focused research. I further invite our Membership to take advantage of our Corporate Members’ Website, which contains a wealth of information in the form of Powerpoint presentations, pre-publication articles and abstracts. CET also has several popular training programs on offer, including the industry-focused national Mineral Geoscience Masters program. These courses and the website are continually being updated to keep participants abreast of developments in minerals geosciences and exploration targeting technologies.
In summary, CET’s outlook remains positive and focused on our mission of providing the industry with the research outputs and tools it requires to decrease the risk/reward ratio of mineral deposit discovery. I look forward to meeting up
with you at several venues throughout the remainder of the year, including the SGA 2009 conference in Townsville in August, which will be one of the top technical conferences of the year in Australia for the mineral exploration sector.
Prof. T. Campbell McCuaig,Director
From the Director
Awards & PhD Completions• Congratulations are in order to Jon Hronsky
and David Groves, the winners of the 2008 AB Edwards Medal awarded by the SGEG Committee for the best article with an economic geology focus published in volume 55 of the Australian Journal of Earth Sciences. The paper by Jon and David is somewhat a typical and more philosophical than the common ‘hardcore’ science articles. It was chosen by the Committee because it magnificently expresses fundamental exploration and ore genesis concepts that the authors – two world-class scientists and recognised leaders in their field – have developed over the last decade. These ideas have contributed significantly to our current understanding of ore-forming processes and the fundamentals of exploration targeting.
• Congratulations to Mr David Murphy for receiving a “Pass” for his PhD thesis entitled
“Regolith expression of hydrothermal alteration: a study of the Groundrush and Vera Nancy gold deposits of Northern Australia”. Congratulations Dr Murphy! Your achievement is a significant one for the School of Earth and Environment. (Dr Murphy’s thesis was supervised by Prof Steffen Hagemann and Prof Bob Gilkes at UWA, and Prof Cliff Stanley at Acadia University, Nova Scotia, Canada.)
• Congratulations to Mr Nuru Said for receiving a “Pass” for his PhD thesis entitled “Geochemistry of the Neoarchean mafic volcanic and intrusive rocks in the Kalgoorlie Terrane, eastern Yilgarn, Western Australia: implications for geodynamic setting”. Congratulations Dr Said! Your achievement is a significant one for the School of Earth and Environment. (Dr Said’s thesis was supervised by Prof Mark Barley and Prof David Groves at UWA, and Robert Kerrich and Wolfgang Maier externally.)

4www.cet.uwa.edu.auhttp://members.cet.uwa.edu.au
Architecture at St IvesThe world class St Ives goldfield occurs to the west of the regional Boulder-Lefroy fault zone, within the Kalgoorlie Terrane of the Eastern Goldfields Superterrane (EGST) (Cassidy et al., 2006). Within the gold camp a series of WNW-trending features oblique to the main NW to NNW-trending structural grain occur.
The WNW-trending features were initially identified using potential field data sets (in particular gravity data and 3D modelling of this dataset; Fig. 1) and isopach mapping which highlights major thickness variations within a key komatiite rock unit across the inferred WNW-trending structures (Connors, 2002; Fig. 2). The WNW-trending structures also exert an apparent control on the distribution of dolerite units (note distribution of the Defiance Dolerite in Fig. 2). The granophyric zones within these dolerites are the most favourable host rock. These WNW-trending features were termed by Connors, (2002) the Achille, Gamma West and Mt Blanc Faults (Fig. 2).
Neumayr et al. (2008) also inferred the location of WNW-trending structures by the analysis of alteration footprints associated with gold mineralisation. However, published maps of the observed fault geometry associated with these deposits have not depicted these WNW-trending features (e.g. Fig. 5 of Cox and Ruming, 2004). As a result there has been some debate as to the exact nature and significance of these
inferred WNW-trending features.
Revised Interpretation As part of the study a revised 2-D interpretation was done at 1:15000 scale. Existing 3-D and 2-D data sets were also compiled into FracSIS, which were visualized during the interpretation to make sure the third dimension was incorporated into the interpretation. Modelling of drill hole data was also done using Leapfrog. The following Gold Fields Pty Ltd data sets where used during the interpretation;
• Regional Interpretative Geology Map (Gold Fields Pty Ltd, St Ives, unpublished)
• Geophysical data sets - airborne magnetics, ground magnetics, ground gravity (50 metre line spacing), subaudio magnetics (SAM), seismic lines
• Regional gold flitches (grade contours) printed out at an RL that excluded supergene and placer gold
• 2-D structural interpretation and isopachs of komatiite thickness (Connors, 2002)
• A camp-scale 3-D model (Gold Fields Pty Ltd, unpublished)
• The 3-D model of the Greater Revenge Area (Gold Fields Pty Ltd unpublished)
• 3-D model of the Victory area (Gold Fields Pty Ltd unpublished)
• Pit gold flitches
• Underground and open pit geological mapping (in particular from the Mars deposit and Revenge deposits)
• New sectional interpretations
• New field mapping undertaken in critical areas of the study area: Delta and Delta North deposit, Temeraire deposit, Thunderer deposit, A lode (within the Beta-Hunt mine), and the Repulse Shear at the Victory-Defiance open pit.
The interpretation was not intended to be a new set of lines drawn just using potential field data, but instead to be a coherent structural map consistent with existing kinematics and field observations that highlighted potential exploration targets as part of the analysis.
The key structural features that are within the revised structural interpretation (Fig. 3) are; 1) a series of major NNW-trending faults (such as the Playa and Boulder-Lefroy faults); 2) a series of N-trending faults that acted as contractional jogs syn-gold (Nguyen et al., 1998), 3) a series of WNW-trending shears and faults that in places diverge from the NNW-trending faults but are also truncated by these structures and, 4) a major antiformal hinge that runs through the major deposits (the trace of this is marked as a blue line in Figure 3).
The WNW-trending faults on the structural map (Fig. 3) are a marked change from previous structural interpretations. Numerous examples of these features where physically mapped or identified in old pit mapping in the Greater Revenge Area (Fig. 2). In the Greater Revenge Area unfolding and unfaulting (in section) indicate that less than 10% shortening has occurred. This makes the region a key to
Figure. 2. Isopachs of komatiite thickness (from Connors 2002) and distribution of Defiance Dolerite at the top of basement. These have been overlain with the key structural trends marked on the gravity image in Fig. 1. Key WNW-trending structures have been labelled (Achille, Gamma West and Mt Blanc Faults – Connors, 2002). See text for discussion.
Continued from page 1

5www.cet.uwa.edu.auhttp://members.cet.uwa.edu.au
DiscussionThe mapped WNW-trending faults have been interpreted to be early formed rift-related faults in the Greater Revenge Area. These WNW-trending faults are associated with thickness variations in the komatiite, and they also correspond to linear boundaries between basalt and the dolerite units (Fig. 2; Connors, 2002). The stratigraphic thickness variation reflects syn-volcanic growth faulting. Furthermore, a camp-scale trend of grade correlates with these transfer faults (Fig. 4), and they are inferred to be fluid pathways, or barriers, syn-gold. They are intruded by major pre- to syn-gold porphyry dykes and also acted as mineralized transfer faults syn-gold (Fig. 4). Some of the WNW-trending faults, such as the Janus Fault (Fig. 5), are inferred and have been strongly over printed by later deformation.
Recently published Nd model age maps clearly define a major, 3.1 to 3.0 Ga basement boundary trending NNW (Champion and Cassidy, 2007), which is parallel to the Boulder-Lefroy
Fault. The early D1 extensional architecture is interpreted be a rift system with a pre-existing structural boundary oblique to its trend. In this model the NNW-trending Boulder-Lefroy Fault marks the trend of the earlier rift system and the inferred extension direction was NE-SW during rifting (Fig. 5). Analogue modeling of this type of extensional system (Keep and McClay, 1997), produced relay faults with a marked geometrical similarity to the architecture shown in Figure 5. Such relays can produce small half grabens with the accommodation space infilled by syn-rift sediments or
Figure 3. New structural interpretation for the St Ives camp. Pits are in red. Kambalda Dome is at top left. Pit outlines are in red.
Figure 4. The Mount Blanc Transfer Fault Zone in the Greater Revenge Area. Gold grade (isotropic) overlain by structural interpretation. Note large number of WNW-trending faults and WNW-trending gold grade. Lower diagram is a structural/kinematic model for these structures syn-gold with a transfer fault highlighted. Warm colours indicate elevated gold grades, cool colours either lack data, or have an absence of gold..
volcanic rocks, that would have occurred synchronously with rift infill in the hanging wall of the NNW-trending faults. This architecture may have major implications for the development of the komatiite hosted nickel deposits (the possible location of the Lunnon and Hunt troughs are shown on Fig. 5).
The D2 event was a major inversion of the earlier rift architecture with reactivation of older normal faults, and also the formation of new N- to NNE-trending faults (Fig. 6). The N- and NNE-trending structures are bounded by WNW-trending faults (Fig. 3 and 6), suggesting that the WNW-trending faults controlled their distribution. The change in strike of faults linked to major WNW-trending transfers appears to occur at both a camp scale (Fig. 3, 5, 6) and at a regional scale (note
understanding the controls early fault geometries may have had on the currently mapped fault architecture because of the lack of a high strain D2 over print. This is in contrast to areas where contractional jogs occur (such as the greater Victory Area; Fig. 3).
One of the major WNW-trending faults in the Greater Revenge Area (termed the Mt Blanc Transfer; Fig. 4) is intruded by major pre- to syn-gold porphyry dykes and acted as a major mineralized transfer fault syn-gold (Fig. 4). N-trending and NNW-trending faults terminate against this transfer fault, with fault polarity reversals occurring across the WNW-trending

6www.cet.uwa.edu.auhttp://members.cet.uwa.edu.au
Figure 5. Inferred geometry of the early extensional fault system, this controls the dolerite distribution. These faults have dips that match the present day dip of faults in the structural interpretation (Fig. 2). Some of the dolerite contacts are inferred to be controlled by these faults.
Figure 7. D3 extension – deposition of the late basins and emplacement of related intrusions. Note the dykes near the Repulse Shear are interpreted to be utilizing an older fault trend (termed the Janus Fault in Fig. 5).
Figure 8. Main stage D4 gold event (note that this is defined as D3 in the deformation history of Nguyen, 1997).
Figure 6. D2 inversion of the extensional fault system. Development of the Repulse shear occurred at this time, as did the formation of the main antiform. Rev. = Revenge.

7www.cet.uwa.edu.auhttp://members.cet.uwa.edu.au
the strike changes of the Boulder-Lefroy Fault associated with intersecting WNW-trending features in Fig. 1). There is also a strong link between the dolerite geometries at a camp scale and the WNW-trending faults (Fig. 2). This suggests that these WNW-trending features may be a key to identifying regions where the host dolerite units have been emplaced regionally.
The evolution during D2 thrusting is inferred to have involved reactivation of the WNW- and NNW-trending faults (Fig. 6) with the development of newly formed N-trending linking faults that were optimally orientated for slip. These linking thrusts at a later stage became critical contractional jogs during the main stage of gold mineralisation (Revenge and Repulse Faults in Fig. 6).
Late basin sequences developed prior to the main stage of mineralisation at St Ives. This was associated with the emplacement of extensive dykes within the belt and is interpreted to be related to NE-SW extension and some gold mineralisation (Fig. 7). In the deformation scheme of Blewett and Czarnotta (2007) this extensional event was defined as D3 (as in this article; Fig. 7), in the deformation scheme of Nguyen (1997) this event was defined, but not assigned a distinct deformation number. Evidence for D3 extension is preserved on the Repulse Shear and also as steep-dipping normal faults in sections that control intrusive contacts and offset D2 faults. Some of the D3 dykes are interpreted to be utilizing older WNW-trending relay faults e.g., near the Repulse Shear (Fig. 7).
The main stage of mineralisation is interpreted to be a reactivation of the pre-existing D1, and D2 structures (Fig. 8). The shortening direction for this was oriented E-W to WNW-ESE (Nguyen et al., 1998), with compressional and transtensional zones developing within an overall sinistral-slip system. In the deformation scheme of Nguyen (1997) this main stage of mineralisation was defined as D3. The same event was defined by Blewett and Czarnotta (2007) as D4 (as shown in Fig. 8).
The key syn-gold N-trending contractional fault segments (coloured red in Fig. 8) are bounded by WNW-trending transfer faults (marked as solid or dashed lines in Fig. 8). These contractional fault segments host the largest gold deposits and are interpreted to be controlled by the early rift architecture.
Exploration TargetingThe revised structural interpretation has been used for structural targeting within the camp e.g., is it possible to identify other regions where prospective contractional jogs may occur? However, these structural controls are only one component of the gold system. Gold Fields Pty Ltd has been undertaking exploration utilising a mineral systems approach, which integrates structural interpretations with targeting proxies that can define and map the fluids that have been present in the mineral system. The utilisation of the revised St Ives structural interpretation in a mineral systems frame work has recently yielded exploration success. This was reported as a feature article in the August 2008 issue of Preview (newsletter of the Society of Exploration Geophysicists). The implications of the new understanding of the early fault architecture for
the formation of komatiite hosted massive sulphide nickel deposits is an active CET research project.
AcknowledgementsThis work was part of the Predictive Mineral Discovery Cooperative Research Centre Y4 project. The work utilized the data sets of Gold Field Pty Ltd, which represents the work of a large number of current and past geologists from both Gold Field Pty Ltd and also Western Mining Corporation Pty Ltd. The work benefited from discussion with a large number of people, in particular Ned Stolz, Rick Squire, Phung Nguyen, Stephen Cox, Ed Baltis, Scott Halley, John Walshe, Peter Neumayr, Tony Roache and Greg Hall.
ReferencesBlewett R.S, Czarnota K., 2007, A new integrated tectonic framework of the eastern goldfields superterrane. Kalgoorlie 07 conference “Old Ground. New knowledge”. September 2007, Kalgoorlie.
Connors, K.A. 2002. Lake 3D Project Results 2001-2002. St Ives Technical Note, No: TNSIG02-002, 57p.
Cox, S.F., Ruming, K., 2004. The St Ives mesothermal gold system, Western Australia—a case of golden aftershocks? Journal of Structural Geology 26, 1109–1125.
Keep, M., and McClay, K.R. 1997, Analogue modelling of multiphase rift systems, Tectonophysics, 273, 239-270.
Lund K. 2008. Geometry of the Neoproterozoic and Paleozoic rift margin of western Laurentia; implications for mineral deposit settings. Geosphere. 4; 2, 429-444.
Nguyen, T. P. (1997) Structural controls on gold mineralisation of the Revenge deposit and its setting in the Lake Lefroy area, Kambalda, Western Australia. Unpublished PhD thesis. The University of Western Australia.
Nguyen, P.T., Cox, S.F., Harris, L.B., and Powell, C.M., 1998, Fault-valve behaviour in optimally oriented shear zones: An example at the Revenge gold mine, Kambalda, Western Australia: Journal of Structural Geology, 20, 1625–1640.
Neumayr, P., Walshe, J. Hagemann, S., Petersen, K. Roache, A. Frikken, P., Horn, L., Halley, S., 2008. Oxidized and reduced mineral assemblages in greenstone belt rocks of the St. Ives gold camp, Western Australia: vectors to high-grade ore bodies in Archaean gold deposits? Mineralium Deposita, 43:363–371
Weinberg, R.F., Hodkiewicz, P.H., Groves, D.I., 2004. What controls gold distribution in Archean terranes? Geology 32; 545–548.
John Miller - Centre for Exploration Targeting, UWA, 35 Stirling Highway, M006, Crawley 6009 Western Australia
Richard Blewett - Onshore Energy and Minerals Division, Geoscience Australia, GPO Box 378, Canberra, ACT, 2601
Janet Tunjic - St Ives Gold Mining Co , Gold Fields Australia, Kambalda Post Office, WA 6444
Karen Connors - FrOG Tech, 2 King Street, Deakin, ACT 2600
8www.cet.uwa.edu.auhttp://members.cet.uwa.edu.au
Oceanic Nickel Depletion and a Methanogen Famine Before the Great Oxidation Event
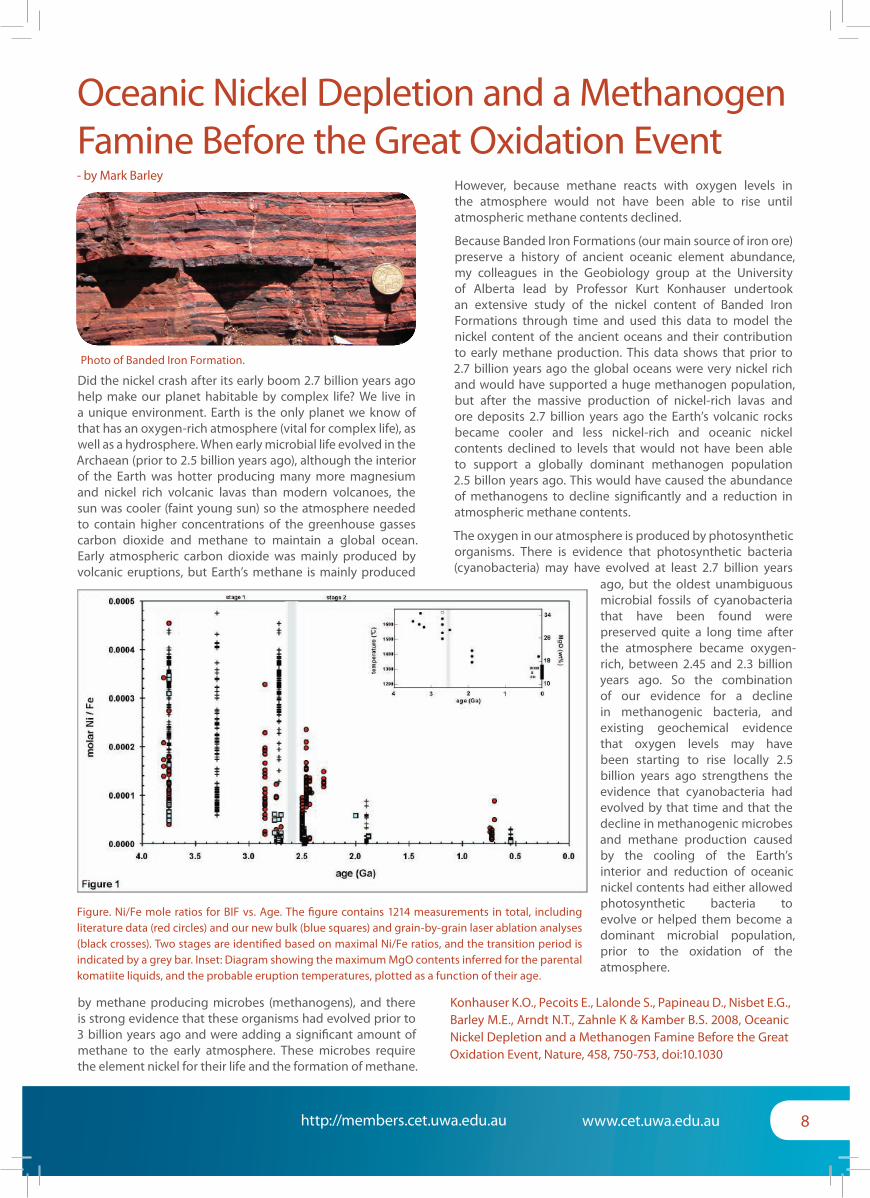
Did the nickel crash after its early boom 2.7 billion years ago help make our planet habitable by complex life? We live in a unique environment. Earth is the only planet we know of that has an oxygen-rich atmosphere (vital for complex life), as well as a hydrosphere. When early microbial life evolved in the Archaean (prior to 2.5 billion years ago), although the interior of the Earth was hotter producing many more magnesium and nickel rich volcanic lavas than modern volcanoes, the sun was cooler (faint young sun) so the atmosphere needed to contain higher concentrations of the greenhouse gasses carbon dioxide and methane to maintain a global ocean. Early atmospheric carbon dioxide was mainly produced by volcanic eruptions, but Earth’s methane is mainly produced
Photo of Banded Iron Formation.
- by Mark Barley
Figure. Ni/Fe mole ratios for BIF vs. Age. The figure contains 1214 measurements in total, including literature data (red circles) and our new bulk (blue squares) and grain-by-grain laser ablation analyses (black crosses). Two stages are identified based on maximal Ni/Fe ratios, and the transition period is indicated by a grey bar. Inset: Diagram showing the maximum MgO contents inferred for the parental komatiite liquids, and the probable eruption temperatures, plotted as a function of their age.
by methane producing microbes (methanogens), and there is strong evidence that these organisms had evolved prior to 3 billion years ago and were adding a significant amount of methane to the early atmosphere. These microbes require the element nickel for their life and the formation of methane.
However, because methane reacts with oxygen levels in the atmosphere would not have been able to rise until atmospheric methane contents declined.
Because Banded Iron Formations (our main source of iron ore) preserve a history of ancient oceanic element abundance, my colleagues in the Geobiology group at the University of Alberta lead by Professor Kurt Konhauser undertook an extensive study of the nickel content of Banded Iron Formations through time and used this data to model the nickel content of the ancient oceans and their contribution to early methane production. This data shows that prior to 2.7 billion years ago the global oceans were very nickel rich and would have supported a huge methanogen population, but after the massive production of nickel-rich lavas and ore deposits 2.7 billion years ago the Earth’s volcanic rocks became cooler and less nickel-rich and oceanic nickel contents declined to levels that would not have been able to support a globally dominant methanogen population 2.5 billon years ago. This would have caused the abundance of methanogens to decline significantly and a reduction in atmospheric methane contents.
The oxygen in our atmosphere is produced by photosynthetic organisms. There is evidence that photosynthetic bacteria (cyanobacteria) may have evolved at least 2.7 billion years
ago, but the oldest unambiguous microbial fossils of cyanobacteria that have been found were preserved quite a long time after the atmosphere became oxygen-rich, between 2.45 and 2.3 billion years ago. So the combination of our evidence for a decline in methanogenic bacteria, and existing geochemical evidence that oxygen levels may have been starting to rise locally 2.5 billion years ago strengthens the evidence that cyanobacteria had evolved by that time and that the decline in methanogenic microbes and methane production caused by the cooling of the Earth’s interior and reduction of oceanic nickel contents had either allowed photosynthetic bacteria to evolve or helped them become a dominant microbial population, prior to the oxidation of the atmosphere.
Konhauser K.O., Pecoits E., Lalonde S., Papineau D., Nisbet E.G., Barley M.E., Arndt N.T., Zahnle K & Kamber B.S. 2008, Oceanic Nickel Depletion and a Methanogen Famine Before the Great Oxidation Event, Nature, 458, 750-753, doi:10.1030

9www.cet.uwa.edu.auhttp://members.cet.uwa.edu.au
Deciphering the Paleo-Craton Margin of the Proto Yilgarn Craton - by Marco Fiorentini
Model age maps of the Yilgarn Craton (Figure 1) generated through the compilation of a large quantity of isotopic data from diverse sources (i.e. pmd*CRC, AMIRA) have contributed to significant scientific advances in the understanding of lithospheric architecture of the Yilgarn Craton (Champion & Cassidy, 2007). The model age map in figure 1 indicates that the Yilgarn Craton comprises terrains that are characterized by radically different isotopic signatures, which notably reflect variable thickness, composition and age lithospheric constraints. Specifically, the data define an isotopic break on the eastern margin of the Youanmi Terrain, which may be interpreted as the paleo-margin of the proto-Yilgarn Craton. Current models of mineral system formation emphasize the critical role of the early geometry and architecture of the craton for the development and localization of ore deposits. The isotopic break mentioned above reflects a major lithospheric discontinuity, which could potentially have played a major role in the formation of key Ni and Au systems. However, the isotopic data set compiled for the south-eastern
Figure 1: Model age map of the Yilgarn Craton (Champion & Cassidy 2007)
Part of the Southern-eastern Youanmi Terrane investigation, from
left to right Sandra Romano and Michael Doublier from GSWA
and Marco Fiorentini and David Mole from the CET. David Mole
is starting a PhD that will oversee the analytical aspect of this
research.
Photo session in the bush from left to right Nicolas
Thébaud (CET), Ivan Zibra (GSWA) and David Mole
(CET)
Youanmi Terrane (Figure 1) clearly indicates sampling gaps. The lack of spatial resolution has so far prevented a clear identification of the overall geometry of the isotopic break (or paleo-margin?) and impeded the comprehension of the structural and tectonostratigraphic controls for Au and Ni mineralisation in the area.
In order to address these issues, a field expedition to the South Eastern Yilgarn Craton was jointly conducted by researchers from the CET and GSWA in March 2009. The main focus of the field investigation was to identify and sample key granitoid outcrops over the
area. Thirty-two samples were collected and are currently being processed to determine geochemical and isotopic composition at the CET and Macquarie University (GEMOC). This newly generated dataset will be completed by analyses of existing material collected during previous sampling campaigns (GSWA, GA, previous PhD’s). This work is part of an ARC Linkage project, led by the CET and co-sponsored by St Barbara, Norilsk, BHP, and GSWA, which aims to unravel the tectonostratigraphic controls of Ni mineralisation in 2.7 and 2.9 Ga komatiite systems.
Dr Nicolas Thebaud, Dr Marco Fiorentini and David Mole, CET

10www.cet.uwa.edu.auhttp://members.cet.uwa.edu.au
CET Projects by Location
Geographic location of research within Western Australia
Geographic location of international research programs in CET

11www.cet.uwa.edu.auhttp://members.cet.uwa.edu.au
Field Trip to the Bangemall, Western Australia: a Study of Geochemical Constraints on the Genesis Templacement of Dolerite Suites and Their Metal Potential - by Ignacio González-Álvarez
The ca. 1076 Ma Warakurna Large Igneous Province (WLIP), one of the largest igneous provinces in the world, is located in the Bangemall region (Western Australia). The WLIP extends from Central to Western Australia (Fig. 1). A ~1.1 Ga mantle plume linked to Rodinia assembly, and coeval with the Umkondo igneous event, in Africa has been proposed to have generated the WLIP (Morris and Pirajno, 2005). These authors suggested that the westward flow from the mantle plume associated with the WLIP resulted in the intrusion of mafic sills and dykes into the Mesoproterozoic siliciclastic-carbonate sedimentary sequences (Edmund and Collier Basins) in the West and East (Earaheedy Basin and Collier Basin) of the Bangemall geological region.
Previous studies on these sill and dyke complexes showed two main periods of dolerite intrusion: (1) at 1,465 Ma and 1,070 Ma (Wingate, 2002; 2003). These two dolerite suites cannot be distinguished based solely on field relationships and mineralogy. However, geochemical fingerprints have proved useful to enable a distinction between the two suites (Morris and Pirajno, 2005 and in press). Furthermore, the chemical differences can be used to assess the diversity of mantle sources and fractionation conditions for the 1,465 and 1,070 Ma dolerite suites.
These dolerite suites intruded the Mesoproterozoic siliciclastic-carbonate sequences that were deposited in intracratonic basins between the Pilbara and the Yilgarn Cratons (Figs. 2 and 3), and deformed by the Capricorn Orogeny (1,830-1,780 Ma). And little formation is available on the geochemistry of the intrusions and the metamorphic & metasomatic effects of these intrusions on the host rocks.
This study is a joint research program between GSWA and the CET and builds up on other research projects (e.g. Morris and Pirajno, 2005) to fill key geochemical gaps on these underexplored dolerite suites, and identify areas of enhanced prospectivity for magmatic Ni-Cu-PGE sulphide deposits based on criteria such
Fig. 1 The Warakurna Large Igneous Province extension (modified from
Wingate et al., 2004).
Fig. 2 General view of a sill intruding the Edmund sedimentary
package at the Ullawara area.
Fig. 3 Detailed view of a sill-sedimentary package contact at the
Ullawara area.
as crustal contamination, indications of potential S-saturation, and magnesium content. Known Ni deposits linked to the ~1.1 Ga Superplume include: (1) the Duluth complex (Keewenawan large igneous province, North America); and (2) Nebo Babel (Musgraves block, Australia).
A preliminary two-week field trip to the Ullawara area (western Bangemall) was conducted last April. Samples collected are being prepared for geochemical analysis and petrographic work. This study will allow us to interpret the extent to which the source of the sills was refractory and melted, the nature and extent of fractionating mineral phases, whether the source or the resulting magma was contaminated, the nature of the contaminant, and to characterize the thermal effects of the sill intrusion on the host sediments by element mobility and petrology. All these factors will provide key information in the assessment of the fertility of these mafic (and possibly ultramafic) rocks for base metals prospectivity. A follow up second field trip is planned to extend the sample collection to the Eastern part of the Bangemall region.
Dr Ignacio González-Álvarez and Adjunct Professor Franco Pirajno, CET - UWA, GSWA.

12www.cet.uwa.edu.auhttp://members.cet.uwa.edu.au
CET established a presence at the annual European Geoscience Union General Assembly held in Vienna from 19-24 April, where CET staff gave 2 oral and 5 poster presentations.
Following an invitation by EGU’s Energy and Environment Division in 2008, Klaus Gessner (CET and CSIRO Exploration and Mining), Alok Porwal (CET) and Peter Sorjonen-Ward (Finnish Geological Survey), advertised a session on ’Quantitative Approaches to Hydrothermal Systems’ earlier this year.
The objective of the session has been to provide a platform for the latest research in quantitative methods as applied to hydrothermal ore deposits and geothermal energy systems. The session attracted 15 papers, six of which were given as oral presentations. Contributions included papers on hydrothermal and geothermal system studies covering topics like coupled numerical models, the visualisation, modelling and spatial analysis of geological data, remote sensing, and GIS-based prospectivity mapping.
CET at EGU 2009 in Vienna
At EGU 2009: (from left) Dr Alok Porwal (CET), Dr Klaus Gessner (CET/CSIRO), and Dr Peter Sorjonen-Ward (GTK)
Advertisement of the session in ‘EGU Today’, the daily conference newsletter.
The Hammond - Nisbet Geoscience FundA fund has been established in memory of Dr Bruce Nisbet and Dr Rod Hammond, two great geoscientists who had known each other both as work colleagues and friends and tragically died within months of each other in 2006. Each had an exceptional grasp of the important connections between economic mineral and geological systems, and how those connections could be applied in exploration targeting. Bruce firmly believed that to have success in future exploration it was critical to perpetuate this learning and research methodology in a world class integrated teaching environment. The fund is aimed at providing an endowed position within the CET that will focus on mentoring the next generation of geoscientists in the integration of fieldwork structural geophysical interpretation and application to understanding mineral systems and exploration targeting. The CET is excited to be a part of this initiative and encourages all members to consider participating.
For more information contact: - Office of Development, M361, 35 Stirling Highway, Crawley WA 6009
Phone: +61 8 6488 1688
Fax: +61 8 6488 1063
Email: [email protected]
Craig, Rod and Bruce (left to right) on the shores of Lake Way near Wiluna, circa 1990
The response of researchers to this new topical session has been encouraging, and we are therefore confident to be able to continue in the following years.
EGU covers all disciplines of the Earth, Planetary and Space Sciences. According to the organisers 9,088 scientists have attended EGU 2009, and the programme included 12,977 oral and poster presentations.
Dr Klaus Gessner, CET/CSIRO

13www.cet.uwa.edu.auhttp://members.cet.uwa.edu.au
The West Qinling belt of China is a significant producer of gold, and holds very high potential for further gold deposit discoveries. Deposits within the belt have been variably classed as ‘orogenic’ style or ‘Carlin’ style gold deposits. Furthermore, the possible timing of these deposits as reported in the literature varies over >100M years of earth history. The CET has established a project with Foundation
Corporate Member Dragon Mountain Gold at their Liba and Jinshan projects in southern Gansu Province. The project is being undertaken by PhD student Zeng Qingtao, supported by the joint China Scholarship Council-UWA SIRF scholarship scheme, and in collaboration with Professor Yanjing Chen at Peking University, and Professor Jianjun Lu at Nanjing University. The aim of the project, which will run for another 2.5 years, is to
characterize the style of mineralisation at Liba, and the timing of mineralisation with respect to intrusions and regional structural and metamorphic events, to aid in clarifying the relationship of the orogenic versus carlin style of deposits and understanding the controls on ore location at the regional to camp scale in the west Qinling fold belt.
Prof. T. Campbell McCuaig, Director
The Centre is aimed squarely at the mineral industry’s need to increase the discovery of new mineral deposits. Its six research themes reflect the belief that more effective targeting, coupled with independent action to reduce the risks of value destruction, will deliver outcomes that can significantly improve the risk : reward ratio.
Each theme has a leader and is responsible for a portfolio of projects. Researchers within the CET are often engaged across several project portfolios. Theme leader contact details are available at: http://www.cet.uwa.edu.au/contacts/staff2
Aiding the Dragon
CET Research Themes & Leaders
Cam & Qingtao at Peking University.
The first row, from left to right, Nuo Li, Dr. Yinghuai Lu, Haoshu Tang. The second row, from left to right, Yun Wang, Prof Lai Yong, Prof Yanjing Chen, Cam, Qingtao, Associate Prof Wenbo Li, Dr. Hancheng Zhang, Xiaohua Deng.
Cam & Qingtao at Dragon Mountian Gold’s Offices in Lixian.
Left to right: Shidong Mao; Terry Moylan, Project Manager Dragon Mountian Gold; Cam; Mr Liu Tianxiang, Chairman of Baiyin No 3 Team of the Gansu Non-ferrous Metals Geological Exploration Bureau; Qingtao.

14www.cet.uwa.edu.auhttp://members.cet.uwa.edu.au
The Exploration Search Space Concept: Key to a Successful Exploration Strategy - by Jon Hronsky
Several studies over the years have used industry-average base-rates of exploration success in an attempt to model the economics of the mineral exploration business. The results of these studies have typically led the authors to question the economic viability of mineral exploration, despite the fact that the value of the global mining industry in 2006 was of the order of $800 Billion US dollars (Goodyear, 2006) and all of these deposits were at one time discovered by mineral exploration. One very important factor that is often overlooked in studies of mineral exploration is that it is a business where the inputs in terms of time, money and blood, sweat and tears do not correlate closely with the output of discovery success. In fact, industry base-rates are not a particularly relevant guide to designing exploration strategy at the scale of individual organizations.
The reason for the last statement is that the distribution of successful outcomes in mineral exploration is strongly bimodal; comprising a small number of organizations (usually at certain times and in certain regions) that are very successful and a large number that have very little success at all. The aggregate of these two distributions produces our observed industry base-rate of success. This bimodal distribution of success-rates has been recognized since at least the 1975 McKinsey study on mineral exploration success in Australian mining companies (McKinsey, 1975). Clearly this leads to the obvious question: what is it that results in an anomalously successful exploration organization? This question has certainly been addressed by industry leaders in the past and the attempts to answer it have usually focused on the intangible, people-related issues of the business (eg Woodall, 2004). The premise of this paper is that although these human issues are absolutely critical, it is also possible to provide a more analytical perspective on the reason for the widely-differing success rates in our industry. The concept of the Exploration Search Space is the key to this analytical perspective and the central concept that relates innovation to commercial success in mineral exploration.
Most economic activity essentially comprises organising input resources of people and/or materials to produce an output of a product or service that can be sold. However, mineral exploration is quite unusual in that it essentially involves a search through a defined parameter-space to identify economically-significant outcomes. This parameter space is referred to here as the Exploration Search Space and represents the given set of conditions which constrain economically-effective outcomes of the search process. The parameters which define the search space typically relate to one or more of the following categories: the nature of the target ore-type, cover conditions, available detection technology and the prevailing political/commercial environment (including factors such as tax regimes, metal prices and available infrastructure). The primary feature of mineral exploration that sets it aside from most other businesses is that, for any given exploration search space, the potential for success has already been preordained at the time exploration
commences. This is because of the obvious point that all the mineral deposits that will ever be found in a particular search space have already been formed. In addition, once we have found a deposit it means that there is one less deposit to be found in that search space. As the statisticians would describe it, we are “sampling without replacement”. The only other major business that has the same characteristics as mineral (including petroleum) exploration is pharmaceutical research. They explore the parameter space of possible combinations of chemicals but there are not an infinite number of these that are likely to have therapeutic properties.
There are three very important business implications that arise from the Exploration Search Space concept.
The first is that any given search space will progressively become exhausted over time, resulting in smaller and higher cost discoveries. It is common that organizations, when they discover a new district, focus exploration resources there and often deliver a string of discoveries. However, unless they somehow expand the search space (see below) over time it will get harder and harder for them to sustain success. This dynamic is a major part of the explanation for why organizations commonly have “golden periods” of success followed by period of poorer performance.
The second implication of this concept is that the largest deposits in any particular search space are usually found early because they generally have the most obvious signatures. The discovery of Olympic Dam in 1975 is a good illustration of this. It was the first concealed IOCG deposit found on the Gawler Craton and today remains the largest known by a wide margin. This is not surprising – the gravity anomaly that initially focused WMC on this target was large enough to be seen in continental-scale gravity data sets.
In combination, the above two points tell us that the key to exploration success is being the first, or very early, into a new exploration search space. The first movers will get a very disproportionate share of the metal there to be discovered. Figure 1 illustrates the discovery success record for a well –constrained and documented search-space: NiS exploration in the Yilgarn since the discovery of Kambalda and demonstrates clearly both of the above two points.
The third critical business implication arises from the above: the most important discontinuities in our business are those which create a significant new search space! These discontinuities may be linked to new exploration technology (eg the development of airborne EM in Canada in the 1950s), new mining and processing technology (eg the impact of CIP technology on the global gold industry in the 1980s), new geological concepts in old areas (eg the discovery of nickel at Kambalda in 1966), new geographies (usually related to a change in political situation; eg opening up of Central Asia in the 1990s) and new markets (eg development of market for higher-phosphorous iron ores in recent years). In many cases, it is a combination of several of the above developments that drives the opening of a new search space. Interestingly,

15www.cet.uwa.edu.auhttp://members.cet.uwa.edu.au
Figure 1: Discovery history within the exploration search space for NiS deposits in Western Australia. All deposit extensional resource growth
assigned to the original time of discovery. Note the classic pattern of the major discoveries and most of the metal being found early, with
successive smaller discoveries over time. From Hronsky and Schodde (2006)
Figure 2: Porphyry exploration in Chile: An example of the role of technical innovation in expanding the exploration search space and leading to
new waves of discovery. From Hronsky and Groves (2008), based on original WMC data compiled by John Black.
although it might be assumed that higher metal prices on their own may open up a new search space, history suggests that this rarely happens and some other development also seems to be required for a new wave of discoveries to be made. Figure 2 illustrates how new concepts and technology have expanded the search space for copper exploration in Chile.
The well-established concept of “exploration maturity” relates to the exploration search space idea but there is an important, if subtle distinction. The term “maturity” is typically applied to a particular geographical area (eg mineral province or mining camp). However, even in a mature camp it is possible that innovation can open up a new search space that leads to new discoveries that may be even larger than those previously known in the area. The discoveries of the Resolution Cu-Au deposit in Arizona and the Talnakh Ni-Cu-PGE deposit in Siberia are good examples of the latter outcome.
There is a very important message here for investment in exploration technology development. If a new technology only helps sample existing search spaces more effectively, it will provide very little economic benefit to the industry. If however it assists in opening up new search spaces, the pay-off can be large and will probably be delivered soon after the
technology is first deployed. The first application of magnetic surveying to exploration in the Witwatersrand, leading to the discovery of the West Witwatersrand in the 1930s is a great example of this.
In summary, exploration strategy should be focussed around the development and exploitation of new exploration search spaces. This analytical perspective in no way diminishes the importance of the focus on creativity and the human dimension advocated by former industry leaders such as Woodall (2004) because it is exactly that creativity that is required to recognize a new search space.
References:
Goodyear C.W., 2006. How does exploration add value? Abstract Volume – SEG Conference Keystone, Colorado
McKinsey Company, 1975. Successful management of minerals exploration in Australia: Report to survey participants. Unpublished report.
Woodall R., 2004. The challenge of discovering mineral deposits under cover – what can we learn from the past? Keynote address to the SEG 2004 Conference, Perth WA.
Adjunct Professor J.M.A. Hronsky, CET - UWA & Western Mining Services.

16www.cet.uwa.edu.auhttp://members.cet.uwa.edu.au
Estimating Historical Probabilities of Discovery in Mineral Exploration AbstractThe expected value of greenfield, brownfield and minesite mineral exploration is a function of the expected sizes/values of relevant targets given a discovery, the related probabilities of economic discovery and the cost of the exploration programs. Recent empirical studies on the business of mineral exploration provide the basis to generate estimates of the average historical probability of an economic discovery for these types of exploration programs as a valuable complement to geological considerations for better informed and financially sound, exploration targeting decisions.
IntroductionThe expected value of an investment in mineral exploration is a function of three main parameters: the expected size/value of the target, the related probability of discovering it and the cost of the relevant exploration program. Investors are sensitive to trade-offs between the magnitude of the expected target value and the associated risk, and lack of this type of quantification in mineral exploration leads to it being the only investment conducted on an unquantified
‘best endeavors’ basis and to minimal market value being attributed to an exploration portfolio other than in boom periods.
In most instances there is a minimal expectation of success not only at the single project level but even at the portfolio level and poorly-funded junior explorers are generally doomed to failure other than in periods of buoyant market sentiment, when equity funds are relatively easy to raise. Yet exploration is considered a ‘necessary’ investment by many larger and better-funded resources companies as it is recognized as possibly the most effective long-term strategy to secure replenishment of their depleting resources inventory and organic growth. As such exploration is and will continue to be an integral part of being a ‘resource’ company, even though some large companies have recently avoided unquatified exploration risk by seeking to grow primarily through acquisitions by bearing a price premium.
It could be argued that both the size distribution of various types of exploration targets (Jaireth et al, 2008) and the typical cost of exploration programs are reasonably well known and that the bulk of the uncertainty rests with the relevant probability of discovering them and with their potential value. In recent years, however, a number of seminal empirical studies have provided some basic quantitative information on business aspects of mineral exploration. A review of these papers, and in particular of the mineral discoveries database assembled by Schodde and Hronsky (2006) and Schodde (2004), in combination with information on global exploration expenditure compiled by the Metals Economics Group (MEG), have created the basis for the current estimate
of the average historical probability of an economic discovery for various categories of exploration, such as greenfield, brownfield and minesite exploration. This categorization of exploration expenditure is preferred to that proposed by the Metals Economics Group (2008), i.e. grassroot, late stage and feasibility and minesite, which does not recognizes the special characteristics of brownfield exploration in terranes where prospectivity has been enhanced by previous discoveries and potential financial viability by established infrastructure.
Categorization of exploration expenditureIn terms of probability of discovery, Hogan et al (2002) maintain that it increases with the level of geological information, which is:
• poor in greenfield exploration
• reasonably known in brownfield exploration and
• well known in minesite exploration and in Secondary Project evaluation of previously mothballed deposits
By contrast the expected size of a potential discovery is greatest in a virgin terrane and decreases gradually as the terrane matures. As the larger deposits, with more obvious footprints, tend to be found first, the probability of “major” or “world-class” discoveries is greatest in greenfield programs directed to poorly explored terranes, recently opened up to exploration or to previously neglected parts of the geological sequence following re-interpretation or development of new detection technology (Whiting and Schodde, 2006). By contrast increased density and depth of previous drilling places significant constraints on the expected size of targets in brownfield and even more so in minesite exploration. This does not mean that “major” or “world-class” discoveries are impossible in brownfield exploration, just that they are less likely.
On the other hand, the return per dollar invested in the hands of a discoverer is also a function of the proximity of the discovery to existing infrastructure such as an under-utilised processing plant, ranging from:
• close to a currently owned plant and within trucking distance in minesite exploration to
• situations where development of a plant may be necessary following a discovery, although third-party plants may exist in the area in brownfield exploration to
• no available plant and possible need for considerable infrastructural development in greenfield exploration
Sometimes an already known project, which was mothballed indefinitely at the time of its original discovery, because deemed marginal or sub-economic, is subsequently resurrected and re-assessed by either the discoverer or by a different acquiring company. In these circumstances we will use the term secondary project discovery.
- by Stephen B. Bartrop & Pietro Guj

17www.cet.uwa.edu.auhttp://members.cet.uwa.edu.au
Table 1. Generalised targets, risk, returns and exploration costs for various exploration expenditure categories.
Another relevant aspect is the cost of exploration which is likely to increase on average by at least a factor of 2 from modest in a minesite project to medium in a brownfield project, becoming very significant (say US$ 0.500 million or more) in a large-scale greenfield project given the generally more challenging logistics and the style and breadth of the exploration activities involved. This increase in financial commitment placed at risk and in target values compounds with the general decrease in probability of discovery to create vastly different risk profiles which can be attributed to each exploration expenditure category, as summarized in Table 1, which also includes an acquisition category for comparison offering the lowest risk but potentially lowest returns given the overriding influence of the acquisition price.
The need to compensate for various levels of risk must be taken into account by companies in setting their minimum targets when formulating their exploration strategies and allocating their exploration budgets.
Quantifying Exploration Risk and ReturnThe earliest attempts to quantify the expected value of mineral discoveries were those by McKenzie and Woodall (1987), who estimated the average, after-tax Internal Rate of Return (IRR) on exploration discoveries in Australia over the period 1955-78 at 12% and in Canada over the period 1946-1977 at 22% and a study by Palenthorpe and Bain (1986) which assessed the return on BHP’s Australian mineral discoveries (excluding petroleum) over the period 1961-84 at 9%.
Both studies noted the critical importance of greenfield “world-class” discoveries that underpin the average return and the considerable variation in exploration expertise and therefore success across the resources sector.
Probability of greenfield discoveriesTo quantify the probability of discovery and the expected
return from greenfield exploration we refer to the seminal research by Schodde and Hronsky (2006) and Schodde (2004) who propose an economic definition for “major” and “world-class” projects for gold, diamond, and base metals discoveries over the period 1985 to 2003. In terms of size, they classify a
“major” deposit as containing more than one million ounces (Moz) of gold or three million carats (Mcrt) of diamonds or half million tonne (Mt) of base metals expressed as copper-equivalents.
During this period a total of 254 major greenfield discoveries were made throughout the world, including 87 base metals deposits, 160 gold deposits and 7 diamond deposits. The discovery database shows that only 148 (53 base metals, 89 gold and 6 diamond deposits) returned positive NPVs at the development decision point (based on a 7 percent after-tax real rate of discount and rather conservative commodity prices assumptions). The NPV values are best fitted by a lognormal distribution with a mean or expected value of $212 million and a standard deviation of $456 million. Their distribution also shows a discontinuity at around US$(2004) 250 million. This value, which was exceeded by 33 deposits, was adopted by Schodde and Hronsky (2006) as the minimum for a “world-class” deposit. World-class deposits generally contain at least 6 Moz of gold or 5 Mt of copper-equivalent metal. While larger deposits tend to be the most valuable, this is by no means a general rule.
In addition, it must be kept in mind that Schodde and Hronsky (2006) excluded from their analysis all smaller economic discoveries (containing less than one Moz of gold, or three Mcrt of diamond or 0.5 Mt of copper-equivalent metal), because of its primary focus on targeting by major global explorers and for the sake of computational simplicity. For each major discovery there would have been two or three smaller discoveries, which, while of no interest to Majors and relatively subordinate in terms of their contribution to aggregate metal supply, are still capable of adding substantial value to Juniors

18www.cet.uwa.edu.auhttp://members.cet.uwa.edu.au
Table 2 – Matrix of probabilities of a greenfield discovery for various combinations of budget allocations and costs of exploration
and Mid-cap explorers for which they constitute legitimate and in some cases company-making targets.
If, for instance, the size threshold for gold discoveries were to be lowered to a “moderate” size of 0.1 Moz of gold, the total number of gold discoveries exceeds 1000 of which 354 are greenfield ones (Schodde, 2004), i.e. more than double the 160 major discoveries. Similarly the number of base metals discoveries unrelated to existing mining operations exceeding a “moderate” threshold of 0.1 Mt of copper equivalent also more than doubles from 87 (at a threshold of 0.5 Mt of copper) to 186 (Goodyear, 2006). It is realistic to expect that the number of economic greenfield discoveries irrespective of their size, i.e. also including discoveries smaller than 0.1 Moz of gold and 0.1 Mt of copper, will be even larger, may be of the order of 3 times that of major discoveries.
In summary, over the 19-year period of the analysis (1985 – 2003) there were around 444 economic greenfield discoveries irrespective of minimum size, including 148 major and 33 world-class discoveries for an average annual rate of 23.37, 7.79 and 1.74 respectively.
To convert the average number of annual discoveries into their related average historical probability of discovery, one must divide them by the average annual number of greenfield exploration programs.
An accurate estimate of the average annual number of greenfield exploration programs could only be derived from the MEG survey data, if one knew what proportion of the exploration budget of Majors, Intermediates and Juniors companies is directed to greenfield exploration and what the average cost of a greenfield exploration program is. This critical information is unfortunately lacking and at this stage we can only rely on subjective assumptions. The authors’ preferred subjective scenario is that, as an average across the industry, Majors, Intermediates and Juniors companies spend 70%, 30% and 10% of their exploration budget respectively on greenfield exploration with an average cost per program of US$(2004) 0.5 million.
Under these assumptions, the average annual exploration expenditure in greenfield projects derived from the MEG
survey data across the 7-year period from 1998 to 2004 in constant 2004 values is US$1.334 billion. This period was selected because it covers a full economic cycle between two lows. This level of expenditure corresponds to an average 2669 greenfield exploration programs carried out each year (i.e. $1334 million divided by $ 0.5 million).
Thus the probability of discovering an economic orebody in a greenfield exploration program is:
• irrespective of its size 0.9% (i.e. 23.37 discoveries in 2669 trials)
• for a major orebody around 0.3% (i.e. 7.79 discoveries in 2669 trials) or about 1 in 333, which is consistent with unpublished estimates by Schodde (2009, personal communication) of one in two hundred to one in three hundred, and
• for a world-class orebody 0.07% (i.e. 1.74 discoveries in 2669 trials) or just under 1 in 1000. The latter figure is of the same order-of-magnitude as 0.03% as estimated by Rio Tinto’s Head of Exploration (Finlayson, 2008), which is slightly lower because it probably relates to a more ambitious definition of what constitutes a world-class exploration target.
It must be emphasized that, in the greenfield category, the 0.9% probability of an economic discovery independent of size incorporates possible “major” discoveries and that these in turn incorporate possible “world-class ones. In effect the incremental probability of an economic discovery is inversely proportional to increments in setting a company’s minimum acceptable target, which, in turn, to a large extent is a function of the size distribution of potential discoveries in any particular mineralisation style and terrane. If the potential deposit size distribution for a mineralisation style or terrane is known or can be estimated, then, given its lognormal properties, the probability of a possible discovery exceeding any given size or value threshold can be estimated with a degree of confidence. Clearly Majors, with relatively high minimum target, may not embark into an exploration campaign which, while characterized by a relatively high probability of economic discovery, has a relatively low probability that, given a
19www.cet.uwa.edu.auhttp://members.cet.uwa.edu.au
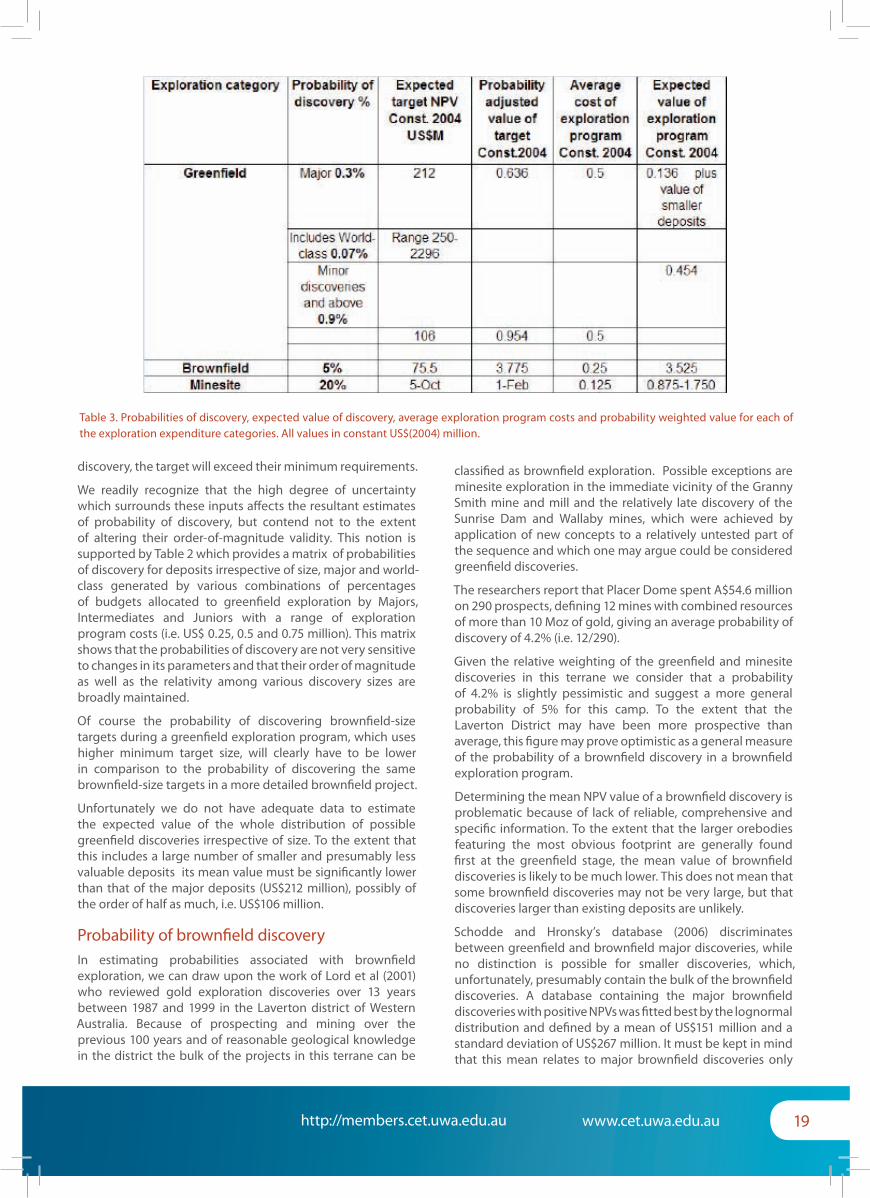
Table 3. Probabilities of discovery, expected value of discovery, average exploration program costs and probability weighted value for each of the exploration expenditure categories. All values in constant US$(2004) million.
discovery, the target will exceed their minimum requirements.
We readily recognize that the high degree of uncertainty which surrounds these inputs affects the resultant estimates of probability of discovery, but contend not to the extent of altering their order-of-magnitude validity. This notion is supported by Table 2 which provides a matrix of probabilities of discovery for deposits irrespective of size, major and world-class generated by various combinations of percentages of budgets allocated to greenfield exploration by Majors, Intermediates and Juniors with a range of exploration program costs (i.e. US$ 0.25, 0.5 and 0.75 million). This matrix shows that the probabilities of discovery are not very sensitive to changes in its parameters and that their order of magnitude as well as the relativity among various discovery sizes are broadly maintained.
Of course the probability of discovering brownfield-size targets during a greenfield exploration program, which uses higher minimum target size, will clearly have to be lower in comparison to the probability of discovering the same brownfield-size targets in a more detailed brownfield project.
Unfortunately we do not have adequate data to estimate the expected value of the whole distribution of possible greenfield discoveries irrespective of size. To the extent that this includes a large number of smaller and presumably less valuable deposits its mean value must be significantly lower than that of the major deposits (US$212 million), possibly of the order of half as much, i.e. US$106 million.
Probability of brownfield discoveryIn estimating probabilities associated with brownfield exploration, we can draw upon the work of Lord et al (2001) who reviewed gold exploration discoveries over 13 years between 1987 and 1999 in the Laverton district of Western Australia. Because of prospecting and mining over the previous 100 years and of reasonable geological knowledge in the district the bulk of the projects in this terrane can be
classified as brownfield exploration. Possible exceptions are minesite exploration in the immediate vicinity of the Granny Smith mine and mill and the relatively late discovery of the Sunrise Dam and Wallaby mines, which were achieved by application of new concepts to a relatively untested part of the sequence and which one may argue could be considered greenfield discoveries.
The researchers report that Placer Dome spent A$54.6 million on 290 prospects, defining 12 mines with combined resources of more than 10 Moz of gold, giving an average probability of discovery of 4.2% (i.e. 12/290).
Given the relative weighting of the greenfield and minesite discoveries in this terrane we consider that a probability of 4.2% is slightly pessimistic and suggest a more general probability of 5% for this camp. To the extent that the Laverton District may have been more prospective than average, this figure may prove optimistic as a general measure of the probability of a brownfield discovery in a brownfield exploration program.
Determining the mean NPV value of a brownfield discovery is problematic because of lack of reliable, comprehensive and specific information. To the extent that the larger orebodies featuring the most obvious footprint are generally found first at the greenfield stage, the mean value of brownfield discoveries is likely to be much lower. This does not mean that some brownfield discoveries may not be very large, but that discoveries larger than existing deposits are unlikely.
Schodde and Hronsky’s database (2006) discriminates between greenfield and brownfield major discoveries, while no distinction is possible for smaller discoveries, which, unfortunately, presumably contain the bulk of the brownfield discoveries. A database containing the major brownfield discoveries with positive NPVs was fitted best by the lognormal distribution and defined by a mean of US$151 million and a standard deviation of US$267 million. It must be kept in mind that this mean relates to major brownfield discoveries only

20www.cet.uwa.edu.auhttp://members.cet.uwa.edu.au
and that for every major discovery there would have been a number of small discoveries that may significantly lower the mean value. While the lack of detailed information prevents an accurate estimate, to maintain the relativity to the value of greenfield discoveries, half of the above expected value, i.e. US$75.5 million, is considered a realistic order of magnitude. This is consistent with the Australian stock market which over many years, typically valued single-operation companies with a brownfield discovery at a minimum of US$50 million.
Probability of minesite discoveryGuj and Fallon (2009), using a methodology similar to that adopted by Lord et al (2001), highlighted a higher probability of discovery in the Plutonic Marymia Gold Belt, also in Western Australia at 18.2%. Contrary to the Laverton goldfields, where exploration and mining had taken place for over 100 years, the Plutonic belt escaped the attention of the old prospectors, with the first gold discovery only occurring in 1987. This first greenfield discovery was the Plutonic gold mine itself, which is still the largest orebody in this belt. The early establishment of the Plutonic mill polarized minesite exploration for feed in its vicinity where a large number of relatively small but collectively significant and cheap-to-discover satellite orebodies where located. These represent by far the largest proportion of the gold discovered to date. Meanwhile better understanding of the geology also led to vigorous brownfield exploration further away from the minesite resulting in a number of less significant economic discoveries. To the extent that the largest proportion of the discoveries were within the Plutonic leases, the 18.2% probability of discovery relates primarily to minesite rather than brownfield exploration, but may be slightly conservative because of the latter. In this light we suggest a generalized 20% probability of minesite discovery.
Estimating the expected value of minesite targets is problematic given the lack of specific information and the variation in type and scale of mining operations. In general the expected value of a minesite discovery is weighted down by the much smaller target size necessary for a discovery to be economic at the margin of an existing operation and within a short distance of a mill. For the purpose of this paper and until more detailed information about actual values can be generated, a low expected NPV of between US$5 and 10 million is considered an acceptable order of magnitude.
Table 3 summarises the three exploration categories, their estimated probability of discovery and expected return, based on an assumption that typical exploration program costs under each classification differ by a factor of 2, i.e. that a greenfield program cost on average twice as much as a brownfield and 4 time a minesite one. While once again there is a lack of relevant cost information, we consider that the comparison of the expected value of various exploration programs is broadly valid.
Interestingly, based on the above assumptions, brownfield exploration programs offer the most attractive return reflecting the combination of a reasonably-sized expected target with a good probability of discovery. Hronsky et al (2009), however, question for how long the dominance of investment in brownfield relative to greenfield exploration can be sustained. They argue that following the recent
rapid increases in brownfield exploration budgets the average probability of discovery and with it the efficiency of exploration will fall. This, combined with the lower contribution that brownfield discoveries make to the supply of metals, may eventually lead to a “greenfield renaissance”.
We would also argue that with the spate of acquisitions and mergers over the recent resources boom, there are fewer opportunities available and the premium required for the remaining few creates significant risk in delivering shareholder value. As a consequence companies with operating cash flows will be encouraged to re-focus on increased exploration activity in general and greenfield in particular.
Potential uses & limitations of current estimatesIt is hoped that the estimates of probability of economic discovery presented in this paper may prove valuable inputs in the strategic planning and evaluation of investment in mineral exploration, particularly in marrying the geological merit of a program with consideration of its risk-reward characteristics.
They could be of particular use in determining the cumulative investment that would be necessary to achieve a desired level of confidence that the exploration program will be successful and culminate in at least one economic discovery. This type of analysis is generally conducted by modeling the exploration business in terms of probability distributions such as the discrete binomial or the continuous Poisson distributions, which provide the cumulative effect of possible successes and failures over a repeated number of independent trials with a constant probability of success in each trial.
This is consistent with exploration being naively viewed as sampling from a population of as-yet-undiscovered mineral deposits so large as to make the effect of depletion essentially insignificant, i.e. disregarding the fact that successive discoveries will inevitably decrease future chances of discovery. Research does, not surprisingly, indicate that discovery success is waning over time on a per-exploration-dollar basis (Goodyear, 2006; Mercer 2006, Leveille and Doggett, 2006; Palethorpe and Blain, 1986). This does not mean that estimates of historical probabilities of discovery as presented in Table 2 should not be used to guide future mineral exploration targeting decisions but that, if used with distribution implying independent trial and sampling with no replacement, they should be recognized as providing relatively optimistic results.
A more realistic, albeit impractical, approach would be to use a hyper-geometric distribution (Newendorp and Schuyler, 2000), which does not presume the independence of each trial and caters for progressively decreasing probabilities of discovery in successive trials as a terrane matures. However estimating the rate of decrease in probability of discovery over time, making allowance for depletion effects but also for the counter-balancing learning effect of successive discoveries and of future technological and conceptual advances in the science and practice of mineral exploration, is extremely difficult and computations based on this distribution can be complex. In addition one must keep in mind that our estimates of probability of discovery are average and do not differentiate among different exploration environments which may display vastly different probabilities of success and

21www.cet.uwa.edu.auhttp://members.cet.uwa.edu.au
expected target values.
The other major limitation of this study relates to the robustness of the estimates of the distribution of the value of possible deposits in any given exploration terrane. Although we have a reasonable idea of the distribution of deposit sizes in various terranes our knowledge of corresponding values is very scanty. This is due to the fact that only large deposits have received real modeling attention and that the relevant valuations are highly sensitive to a number of critical input factors, some of which, such as commodity prices and exchange rates are extremely volatile and hard to forecast realistically. As a results most available valuations have tended to use conservative price forecasts and as a consequence to underestimate the value of mineral discoveries, classifying many as marginal or sub-economic.
In spite of these limitations the frameworks provided in Table 3 provide robust relative expected value comparison and guidelines for participants in the financial markets to broadly discriminate and assess, at least qualitatively, the risk-return characteristics of various components of an exploration portfolio and to assign their individual contributions to the valuation of the company holding the portfolio.
ReferencesFinlayson, E., 2008, Rio Tinto, Exploration Business Review 2007
Goodyear, C.W. 2006 How does Exploration Add Value? Abstracts of Oral and Poster Presentations SEG 2006 Conference May 14-16 2006, Keystone, Colorado, USA.
Goulden, J. 2009 Exploration record. Mining Journal Special Publication - PDAC, Metals Economics Group, Halifax, Nova Scotia, Canada.
Goulden, J. 2007 World Exploration Trends, A Special Report from Metals Economic Group for the PDAC 2006 International Convention, Metals Economics Group, Halifax, Nova Scotia, Canada.
Guj ,P. and Fallon, M. 2009, An Empirical Analysis of Progressive Value and Risk of Exploration in the Plutonic Marymia Gold Belt, Western Australia. Proceedings of the AusIMM’s ’Project Evaluation” Conference, Melbourne April 2009
Hogan, L., Harman, J., Maritz, A., Thorpe, S., Simms, A., Berry, P. and Copeland, A. 2002, Mineral Exploration in Australia: Trends, Economic Impacts and Policy Issues, ABARE eReport 02.1, Canberra, December.
Hronsky, J.M.A., Suchomel, B.J. and Welborn, J.F., 2009, The Case for a Greenfield Renaissance, GSA, TAG Newsletter n. 150, March 2009
Jaireth, S., Huston, D. and Jaques, L., 2008, Metallogenic Endowment of Cratons, Belts and Districts: Do Bull Elephans Roam in Herds, Proceedings of the Australian Earth convention hosted by AIG and GSA, Perth, WA, 20 – 24 July, 2008.
Leveille, R. A & Doggett, M. D., 2006, Costs, Risks, and Returns of Copper Exploration: Assessing Trends in Discovery and Maturity with Particular Reference to Chile. Society of Economic Geologists Special Publication 12, 2006 pp 91-107.
Lord, D., Etheridge, M., Willson, M., Hall, G. & Uttley, P. ,2001, Measuring Exploration Success: An Alternative to the Discovery-Cost-Per-Ounce Method of Quantifying Exploration Effectiveness. SEG Newsletter No. 45 April 2001 Society of Economic Geologists.
Mackenzie, B. & Woodall, R., 1987, Mineral Exploration Economics; The Search for Base Metals in Australia and Canada. Centre for Resource Studies, Working Paper No. 40 September 1987. Queen’s University, Canada pp112.
Mercer, W. and Schafer, R. W., 2006, Business Strategies and Relationships within the Major and Junior Mineral Exploration Sectors. Abstracts of Oral and Poster Presentations SEG 2006 Conference May 14-16 2006, Keystone, Colorado, USA.
Metals Economic Group, 2008, World Exploration Trends: A Special Report from Metals Economics Group for the PDAC International Convention 2008
Metals Economic Group, 2007, World Exploration Trends: A Special Report from Metals Economics Group for the PDAC International Convention 2007
Newendorp, P. and Schuyler, J., 2000, Decision Analysis for Petroleum Exploration, Second edition, Planning Press, Aurora, Colorado
Palethorpe, C. E. and Blain C. F., 1986, Corporate Growth by Exploration – the BHP example. 13th CMMI Congress Ed. Scott, T. R & Seguit E. R. Vol. 5. 11 – 16 May 1986 Singapore.
Regent, A., 2006, Presentation for Mineral Exploration Roundup 2006 conference, Falconbridge Limited January 24, 2006 Vancouver, British Columbia
Schodde, R.C., 2004, Discovery Performance of the Western World Gold Industry over the Period 1985 – 2003, Proceedings of the AusIMM PACRIM 2004 Congress, Adelaide, 19-22 September, 2004
Schodde, R. C. & Hronsky, J. M. A., 2006, The Role of World-Class Mines in Wealth Creation. Society of Economic Geologists Special Publication 12, 2006, pp. 71-90.
Sims, D. A. & Bartrop, S. B., 1993, Exploration in the Mature Mine – The Mount Isa Mine Strategy. International Mining Geology Conference, AusIMM, Kalgoorlie WA, 5-8 July 1993.
Whiting, T.H. and Schodde, R.C., 2006, Why do brownfield exploration? Proceedings of the Mine Management Conference, Melbourne, Vic.. 16 – 18 October 2006
Stephen, B. Bartrop and Pietro Guj *– Centre for Exploration Targeting - Western Australian School of Mines, Curtin University of Technology, GPO Box U1987, Perth, Western Australia, 6845

22www.cet.uwa.edu.auhttp://members.cet.uwa.edu.au
WHAT A SUCCESS! These are the few words that come to mind when I watched our national geology honours students come to UWA to undertake coursework with Prof. T. Campbell McCuaig in April 2009. The MGH program is only in its second year and the number of attendees to the UWA unit has nearly doubled over this time. In 2008, 26 MGH students from across 8 Australian Universities (Monash, Curtin University of Technology, ANU, University of Melbourne, University of Tasmania (CODES), James Cook University, UWA, University of Adelaide) attended the 4-day workshop, whereas 39 students attended in April this year in addition to a few UWA postgraduates. The strength of this unit lies in the quality of the presenter, Prof, T. Campbell McCuaig. His ability to convey the basic principles of structural geology and apply it to mineral exploration and mining problems, whilst employing a more hands-on approach, permitted an understanding of these concepts to all students
that attended. According to the feedback, not only was Cam engaging but most importantly all agreed that the course gave them an understanding on structural geology that they can now apply to their own work. Research Fellows Nicolas Thebaud and Aurore Joly also provided valuable assistance in guiding the students through the practical exercises in the course.In addition to the hard work we managed a social get together with the MGH students and UWA/CET staff to encourage networking among the students. We would also like to sincerely thank Trevor Beardsmore and Robbie Rowe of Barrick Gold of Australia for attending this function and presenting an overview of their company’s Graduate Program to the prospective employees. We look forward to next year’s course!
Cindi Mispagel, CET Training Coordinator
Minerals Geoscience Honours Program 2009, Applied Structural Geology in Mining & Exploration-UWA

23www.cet.uwa.edu.auhttp://members.cet.uwa.edu.au
Craig, Rod and Bruce (left to right) on the shores of Lake Way near Wiluna, circa 1990
DAY
1 RI
SK A
NA
LYSI
S A
ND
ATTIT
UDES
TO R
ISK
REV
IEW
OF
DIS
CO
UNTE
D C
ASH
FLO
W (D
CF)
AN
ALY
SIS
•C
onst
ruct
ing
a b
asic
DC
F m
odel
of a
min
ing
pro
ject
INTR
OD
UCTI
ON
TO U
NC
ERTA
INTY
AN
D R
ISK
•Fu
nda
men
tals
of p
rob
ab
ility,
unc
erta
inty
and
risk
RISK
-NEU
TRA
L D
ECIS
ION
S
•Ex
pec
ted
valu
e (E
V),
bin
omia
l pro
ba
bilit
y d
istrib
utio
ns a
nd ri
sk o
f ga
mb
ler’s
ruin
DEC
ISIO
N T
REES
AN
D C
ON
DIT
ION
AL
(BAY
ESIA
N)
PRO
BABI
LITI
ES
•EV
of a
n ex
plo
ratio
n p
rog
ram
, and
•M
easu
ring
the
cont
ribut
ion
of a
n ex
plo
ratio
n su
rvey
to
imp
rovi
ng th
e p
rob
ab
ility
of d
iscov
ery
RISK
-AV
ERSE
DEC
ISIO
NS
•Riskattitudesand
profiles
•Fr
om E
V to
the
rela
ted
certa
inty
eq
uiva
lent
(CE)
a
nd th
e p
rice
of ri
sky
pro
ject
s, a
nd
•Ri
sk-s
pre
ad
ing
and
risk
ma
nag
emen
t by
join
t ve
ntur
ing
RISK
AN
ALY
SIS
•Se
nsiti
vity
and
scen
ario
ana
lyse
s, sp
ider
and
to
rna
do
dia
gra
ms
MO
NTE
CA
RLO
SIM
ULA
TIO
N
•Th
e “e
xpec
ted
” b
ase
ca
se
•Pr
oba
bilit
y d
istrib
utio
ns o
f inp
uts,
and
•Re
sulta
nt d
istrib
utio
n of
pos
sible
out
put
va
lues
and
th
eir i
nter
pre
tatio
n
DAY
2 RI
SK M
AN
AGEM
ENT A
ND
REA
L OPT
ION
VA
LUAT
ION
REC
ENT D
EVEL
OPM
ENTS
IN P
ROJE
CT E
VALU
ATI
ON
•O
verc
omin
g th
e lim
itatio
ns a
nd b
ias o
f disc
ount
ed
cashflow
(DCF)ana
lysis,a
nd
•Anintro
duc
tiontore
aloptionsvaluations(R
OV)
MODERNASSETPRICING(M
AP)
•Hed
gingco
mmod
itypricerisk
•Con
structingaMAPmod
elofa
miningproject,a
nd
•Com
paringaMAPand
acorrespon
dingDCF
mod
eldeterminingthe
relatedtim
e-an-risk-adjusted
ra
te o
f disc
ount
REALOPTIONSVA
LUATION(R
OV)M
ETHODS
•G
ener
al p
rinci
ple
s
•C
lose
d-fo
rm e
qua
tions
•Bino
mialla
ttices,riskneu
tralisation,and
•Sing
le,m
ultip
le,seq
uentialand
com
pou
ndoptions
APPLICATIONOFTHEBLACKANDSCHOLES(B-S)
FORM
ULA
•Ev
alu
atin
g a
gol
d fu
ture
•Ev
alu
atin
g a
ma
rgin
al m
inin
g p
roje
ct
•Li
mita
tions
of t
he a
pp
licat
ion
of th
e B-
S fo
rmul
a to
re
al o
ptio
ns
APPLICATIONOFTHEBINOMIALLATTICEMETHOD
•Va
luingariskyassetund
ervario
uspossib
lefuture
stat
es o
f nat
ure
•“Risk-neu
tral”probabilitiesa
ndth
eroll-backproce
ss
to v
alu
e a
rea
l opt
ion
in th
e p
rese
nt
•Ev
alu
atin
g a
min
e ex
pa
nsio
n p
roje
ct
MO
RE C
OM
PLEX
RO
V A
PPLI
CA
TIO
NS
•Con
siderationofth
eversatilityand
easeofuseof
the
bin
omia
l latt
ice
met
hod
in e
valu
atin
g m
ultip
le
and
seq
uent
ial /
com
pou
nd re
al o
ptio
ns
Fina
ncia
l Risk
Ana
lysis
and
Rea
l Opt
ion
Valu
atio
n of
Min
ing
Proj
ects
CET
Res
ourc
e Ro
om -
7-8
Jul
y 20
09
Pres
ente
r - A
/Pro
fess
or P
ietro
Guj
A
two
-da
y,
hand
s-on
, Ex
cel-b
ase
d co
urse
fo
cuse
d on
th
e p
rinci
ple
s of R
isk a
nd D
ecisi
on a
naly
ses a
nd R
eal O
ptio
n Va
luat
ion
(RO
V)
as
ap
plie
d to
inv
estm
ents
in
min
ing
pro
ject
s fro
m t
he
exp
lora
tion
to t
he f
easib
ility
sta
ge.
Idea
l for
pro
fess
iona
ls in
the
m
iner
al e
xplo
ratio
n, m
inin
g a
nd se
curit
ies i
ndus
trie
s.

24www.cet.uwa.edu.auhttp://members.cet.uwa.edu.au
This unit focuses on identifying the challenges in predicting the location of mineralization at a variety of scales using both empirical and conceptual techniques; how to translate an understanding of mineral systems into exploration targeting models; and how to collate and visualize available geoscience datasets to generate and rank targets from mine to regional scale using computer-based methods. Topics include the business of exploration targeting; remote and proximal sensing; mapping of primary, alteration and regolith mineralogy with remote (HyMap and ASTER) and proximal (PIMA, HyLogger) spectral sensors; applied geophysics in exploration targeting; an introduction to Geographic Information Systems (GIS); creation of derived GIS layers to represent exploration criteria; spatial data analysis to quantitatively test exploration criteria; methods to combine data sets into mineral prospectivity maps (e.g. weights of evidence, fuzzy logic and neural networks); creation of 3D models from the integration of numerous geoscience datasets; numerical modelling to simulate physical and chemical processes in tectonics and ore deposition, and case studies showing examples of best practice in exploration targeting in 3D. This course is NOT a how-to-use software instruction. All industry (not for award) participants receive a Certificate of Participation.
Cam McCuaig, John Miller, Arianne Ford, Alok Porwal, Klaus Gessner, Tom Cudahy, Stephen Gardoll, Ian Neilson, John Beeson, Ned Stolz, Robert Hewson, Carsten Laukamp, Ian Lau, Owen Herod. Presenters may change without notice.
The Centre for Exploration Targeting (CET) has been established by The University of Western Australia (UWA), Curtin University of Technology (Curtin) and the exploration industry, with key funding support from the Government of Western Australia, through the Centres of Excellence in Science and Innovation Program.
The Centre is aimed squarely at the mineral industry’s need to increase the discovery of new mineral deposits. Its six research themes reflect the belief that more effective targeting, coupled with independent action to reduce the risks of value destruction, will deliver outcomes that can significantly improve the risk : reward ratio.
Each theme has a leader and is responsible for a portfolio of projects. Researchers within the CET are often engaged across several project portfolios.
General Purpose Building 2, CET Resource Room (G03 – ground level)
CORPORATE MEMBERS RATE Full Course $ 4840.00 Day Rate $ 484.00 GST Included
NON CORPORATE MEMBERS Full Course $ 5445.00 Day Rate $ 605.00 GST Included
Each participant receives a handbook of detailed notes and presentations. Registration for each module commences at 8.30am. Presentations commence at 9.00am. This course is catered. Desk top computers are supplied with relevant software installed.
No refunds for cancellations made within 2 weeks of the course or for ‘no shows’. Participants can be substituted. If the minimum number of participants is not achieved participants will be notified 2 weeks prior to course start date and fees will be refunded. For more information please contact Cindi Mispagel at [email protected] or phone (08) 64882640.
SPEAKERS
LOCATION
COST
REFUND POLICY
CENTRE FOR EXPLORATION TARGETING
COMPUTER-AIDED EXPLORATION TECHNIQUES - 13 - 24 JULY 2009
25www.cet.uwa.edu.auhttp://members.cet.uwa.edu.au
PROGRAMENROL NOW !!!!M
odul
e O
NE
Mod
ule
TWO
Mod
ule
THRE
EM
odul
e FO
UR
Mod
ule
FIVE
EXPLORATION TARGETING IN A BUSINESS SENSE
13
14
Professor T. Campbell McCuaig - CET Director : This 2-day course provides an overview of exploration targeting from a business perspective, as well as building the confidence of participants in how to approach the technical challenges of targeting. This course is aimed at project geologist and exploration managers from junior through to major companies, who are making technical decisions about ground selection, target generation, target ranking and target evaluation.
APPLIED GEOPHYSICS IN EXPLORATION TARGETING
15Ned Stolz - Geoscience Australia : This one day course will concentrate on geophysical techniques available highlighting the pros and cons of each. Participants will be shown the latest in advances in fusing, visualizing and interpreting data sets from regional to deposit scale.
HYPERSPECTRAL SENSING FOR MINERAL EXPLORATION
16
17
Dr Tom Cudahy, Dr Ian Lau & Dr Carsten Laukamp - CET /CSIRO: This two-day course is aimed at showing geoscientists how a range of spectral sensing technologies, from drill core logging to satellite imaging sensors, can be used to provide information about the composition of geological materials, especially its mineralogy and mineral physicochemistry. Recognition of geochemical gradients and hydrothermal alteration patterns and determination of pathways for ore forming fluids are just a few of the many capabilities of these techniques, which become increasingly important in economic geology.
GIS-BASED MINERAL PROSPECTIVITY MAPPING
20
21
Dr Stephen Gardoll, Dr Alok Porwal , Dr Arianne Ford - CET: This two day course will introduce participants to GIS functionalities and show model-based mineral prospectivity mapping in GIS. Presenters will show how to implement knowledge-driven (fuzzy) models and data-driven (weights-of-evidence) models for mineral prospectivity mapping.
INTERACTIVE 3D TARGETING
22 Ian Neilson & John Beeson - Jigsaw Geoscience & Owen Herod - SRK Consulting : This one day will show participants the application of GoCad and GeoModeller. This day will highlight the pros and cons of each and their use in mineral exploration.
NUMERICAL PROCESS MODELS AS A TOOL FOR TARGETING
23Dr Klaus Gessner, Dr John Miller , Peter Schaub & Jamie Robinson - CET/CSIRO Exploration Mining : This day will focus on how results from coupled process models can be used to understand which processes control mineralisation and alteration at in mine to regional scale. Examples will focus on hydrothermal Au and U systems however the fundamentals that are covered are applicable to other mineral systems.
CASE STUDIES
24Various Presenters from above.
Case studies where multiple geoscience datasets have been integrated to target mineral resources at the camp and regional scales.

26www.cet.uwa.edu.auhttp://members.cet.uwa.edu.au
Dr. Eun-Jung Holden is working within the image analysis group at CET and specialises in the design and implementation of image processing and data visualisation methods. In 2006, she joined CET to fill a perceived research niche in the use of computer-vision technologies for mining industry applications.
CET Staff ProfilesPrior to 2006, she worked in the areas of computer vision and graphics for specific projects on automatic human motion understanding and motion visualisation with Professor Robyn Owens within the School of Computer Science & Software Engineering. One of the research outcomes was public domain software called the Auslan Tuition System that helps people learn Australian sign language using an effective real-time graphics. It was released on the Internet in 2004 and currently has more than 2200 registered users around the world. This system won a Commendation in the Innovation Category of the 14th WA Information Technology
and Telecommunications Awards (WAITTA) in 2004.
At CET, Dr Holden has been working with Professor Mike Dentith in developing algorithms to enhance and detect geological features from geophysical, remote sensing and other geoscientific datasets. They developed techniques: to enhance and detect discontinuities within magnetic and gravity data; to identify planar fractures or clasts from televiewer images; to detect size distribution of olivines from optical polished kimberlite slab images; and to locate copper-gold rich porphyry deposits or kimberlite pipes within magnetic data.
All of these projects were the outcomes of multi-disciplinary collaborations across the schools at UWA and other international universities such as University of British Columbia in Canada as well as industry partners such as Barrick Gold of Australia.
Dr Holden has been active in transferring technology being developed at CET to the mining industry through invited seminars and consulting to the mining industry, and is currently working on the commercialisation of the algorithms developed by the image analysis group.
Dr Eun-Jung Holden
Dr Luis Gallardo has a PhD in Environmental Science from Lancaster University UK and a MSc in Applied Geophysics from CICESE, Mexico. Before joining UWA, he held a Research Scientist position at CICESE where he acquired 11 years experience on conducting basic and applied research on geophysics. As part of the Postgraduate Program in Earth Sciences at CICESE he delivered postgraduate courses on Applied Geophysics, Electrical Methods, Potential Methods and Geophysical Data Analysis, as well as supervised three research dissertations. He has 2 years experience working for the Mexican Institute of Petroleum where he processed
gravity and seismic data for the major oil fields in the Gulf of Mexico; he also chaired the Geodesy Department in the Mexican Institute of Statistics, Geography and Informatics for 4 years. His fields of expertise are integrative geophysics and geophysical inverse theory and he is currently interested on the development and application of algorithms for the joint inversion of multiple geophysical data.
Luis embraces the philosophy that the key to an accurate quantification, classification and characterization of the mineral resources and fluid reservoirs embedded in highly heterogeneous geological settings is the integration of every single piece of information available. The novel aspect of his approach is that he seeks for an active interaction of the multiple geophysical data underpinned only by objective links rather than by subjective preconceptions. Following this viewpoint, Luis has been proposing innovative measures to quantify some commonly believed qualitative features
such as geological structure, lithology or integral model to produce more “intelligent” computer programs that merge these features to the multiple geophysical data. The widely proven success of these concepts on geophysics is now encouraging their spreading to other applications such as remote sensing and medical imagery.
During his MSc studies Luis developed an algorithm for joint 3D inversion of gravity and magnetic data and, during his PhD, he developed the first quantitative methodology for the joint inversion of electromagnetic and seismic data derived from fundamentally different physical phenomena-. He has designed and produced a wide range of software to jointly invert any combination of gravity, magnetic, electromagnetic, magnetotelluric, GPR and seismic data on fully heterogeneous materials on two-dimensions, as well as software for the joint inversion of gravity, magnetic and seismic refraction data on
fully heterogeneous three-dimensional settings. This software has been applied to near surface targets such as: hydrocarbon spills, landslide facilitators and water reservoirs. It has also been applied to larger scale targets such as quarry sites, sedimentary basins and deep (up to 50 km depth) crustal studies.
Luis is an active member of the American Geophysical Union and the Society of Exploration Geophysicist and, since his graduation as PhD, has published 11 papers in scientific journals and regularly serves as reviewer in most geophysical journals.
Luis has been recently appointed Goodeve Lecturer in Geophysics in the School of Earth and Environment in UWA and joined the CET in March 2009. His expertise on integrative geophysics and joint inversion aims to strengthen the geophysical support already provided by the Centre for Exploration Targeting to his members.
Dr Luis Gallardo

27www.cet.uwa.edu.auhttp://members.cet.uwa.edu.au
Jane Collins is a PhD student at CET supported by a UPA scholarship and project funding through Western Areas NL. Jane completed her Bachelor of Science (majoring in Geology) at the University of Western Australia in 1998. Further studies included undertaking Honours in 1999 which focused on the geochemical signatures of trace elements related to gold mineralisation at Sunrise Dam. Jane later returned to UWA in 2006 to
CET - PhD Students
Geoff Heggie is a PhD candidate at CET supported by IPRS-UPA scholarship of Australia. Before coming to CET in September, 2006, Geoff was self-employed as a contract project exploration geologist with a number of junior exploration companies. Prior to this Geoff obtained his MSc. (2005) at Lakehead University (Thunder Bay, Canada) and B.Sc. Hons. (2002) at the University of Saskatchewan
(Saskatoon, Canada).
Geoff is current working within the AMIRA P710A project: Controls on Platinum Group Element variations in mafic and ultramafic magmatic systems, a joint collaboration between industry sponsors BHP-Billiton, Independence Group and Norilsk Nickel and the research institutions of University of Western Australia, Australia National Univeristy, Macquarie University, CSIRO, and MERIWA.
Geoff’s project co-supervised by Dr. Marco Fiorentini (CET), Prof. Mark Barley (CET), and Dr. Steve Barnes (CSIRO), examines the application of chalcophile elements (Ni, Cu, Pt, Pd, Ru, Rh, Ir) as lithogeochemical vectors to orthomagmatic nickel mineralisation hosted in komatiite systems. The project is divided into two components 1) known
deposit case studies, and 2) application of understanding. Case study deposits utilized were the Long-Victor Ni-mine in Kambalda (Independence Group) and the Maggie Hays Ni-mine in the Lake Johnston Greenstone Belt (Norilsk Nickel). The two deposits provide excellent 3D distribution of samples and data in a mine setting. The two deposits are similar in that they are derived from high MgO magmas and both contain massive sulfide, yet contrast each other in age (2.7 vs. 2.9 Ga), komatiite type (Munro vs. Barberton) and emplacement style (extrusive vs. intrusive). The understanding of chalcophile element abundances and variations obtained from these two Ni-mineralizing systems was then applied to examine the Ni-prospectivity of the Karasjok-type komatiites (Ti-
enriched) in Northern Finland and Norway.
Geoff Heggie
commence a PhD project.
The current project that Jane is working on involves the Flying Fox komatiite-hosted nickel sulfide deposit located in the Forrestania greenstone belt of Western Australia. The main focus of the study is to determine the significance of structural, metamorphic, magmatic, and hydrothermal controls on the location and styles of mineralisation that are currently observed. This project is overseen by Western Areas NL and Newexco Services Pty Ltd, and is supervised by Professors Steffen Hagemann and Campbell McCuaig in the CET.
The Flying Fox deposit is atypical of the komatiite-associated class of high-
grade nickel deposits in that the ore, metamorphosed to amphibolites facies, is commonly sited in non-ultramafic rocks, particularly in either felsic metasedimentary rocks or against the contact with a late-stage granitic intrusive rock. Typical primary ores including massive and disseminated sulfides are observed (albeit deformed), however the relocation of massive sulfides has created secondary stringer/vein and breccia ores via injection and smearing of primary massive sulfides during deformation.
Although most previous studies on nickel deposits in Western Australia recognize post-volcanic deformation, few structural studies have been undertaken. The volcanic ore
genesis model is based on the premise that primary volcanic and stratigraphic relationships can be constructed with confidence. However, in the case of this study, the Flying Fox ore bodies have been structurally deformed and remobilized, and primary controls on ore localities is secondary to the structural offsets and magmatic influences. Therefore, this PhD project will highlight the importance of secondary processes and the need for them to be included in the models used in exploration for komatiite-hosted nickel sulfide deposits.
Jane Collins

28www.cet.uwa.edu.auhttp://members.cet.uwa.edu.au
The coursework Masters program is designed for geoscientists who want to gain up to date knowledge and skills in economic geology and mineral exploration. The course at UWA is part of the national Minerals Geoscience Masters program and is supported by the Minerals Council of Australia. The program is run jointly between the Centre for Exploration Targeting (UWA), CODES (UTAS), EGRU (JCU) and Curtin University of Technolgy (CUT).
The Masters course can be completed in three ways:
Option 1 - (8 coursework units) Eight units of course work: at least two of which must be undertaken at UWA. The other units are done at UWA or at the other participating universities.
Option 2 - (6 coursework units + dissertation) Six units of course work and a dissertation (25% of overall assessment). Two of the units must be completed at UWA.
Option 3 - (3 coursework units + thesis) Three coursework units and a thesis which accounts for 62.5% of the overall assessment. The thesis is similar to an honours project in scope.
Courses offered by the CET:
• Computer-AidedExplorationTechniques,Jul2009
• Ore Deposit Conceptual Models, Nov 2009
• Applied Structural & Field Geology, Jul 2010
• South African Ore Deposits Field Excursion, Nov 2010
MSc Ore Deposit Geology & Evaluation
Contact Information
If you would like to find out more about the CET, its Corporate Membership program, Applied Research opportunities or Training possibilities, please contact:
Centre for Exploration Targeting
The University of Western Australia
35 Stirling Highway
CRAWLEY WA 6009
Phone: +61 8 6488 2667
Fax: +61 8 6488 1178
Email: [email protected]
Website: www.cet.uwa.edu.au
CRICOS Provider Code : 00126G
CET Training ScheduleJul 7 - 8, 2009
Jul 13 - 24, 2009
Financial Risk Analysis and Real Option Valuation of Mining Projects 2-days - Pietro Guj
Computer-Aided Exploration Techniques (MGM course) 10-days - Cam McCuaig, John Miller,
Arianne Ford, Alok Porwal, Klaus Gessner, Stephen Gardoll, Tom Cudahy (CSIRO-C3DMM) & more TBA
Aug 11 - 14, 2009 Pre - SGA Conference Field Trip to Kalgoorlie - Kambalda Region, Stephen Beresford, John Miller, Nicolas
Thebaud & more CET staff TBA
Nov 2 - 13, 2009 Ore Deposits Conceptual Models (MGM course) 10-days - Cam McCuaig, John Miller, Stephen Beresford,
Steffen Hagemann & more TBA
Dec 14, 2009 End of Year CET Presentations to Corporate Members / Stakeholders 1-day - CET Staff