Embed Size (px)
Citation preview

CEPSTRAL METHODS FOR IMAGE FEATURE
EXTRACTION
a thesis
submitted to the department of electrical and
electronics engineering
and the institute of engineering and science
of bilkent university
in partial fulfillment of the requirements
for the degree of
master of science
By
Serdar Cakır
August 2010

I certify that I have read this thesis and that in my opinion it is fully adequate,
in scope and in quality, as a thesis for the degree of Master of Science.
Prof. Dr. A. Enis Cetin(Supervisor)
I certify that I have read this thesis and that in my opinion it is fully adequate,
in scope and in quality, as a thesis for the degree of Master of Science.
Assoc. Prof. Dr. Ugur Gudukbay
I certify that I have read this thesis and that in my opinion it is fully adequate,
in scope and in quality, as a thesis for the degree of Master of Science.
Assist. Prof. Dr. Sinan Gezici
Approved for the Institute of Engineering and Sciences:
Prof. Dr. Levent OnuralDirector of Institute of Engineering and Sciences
ii
ABSTRACT
CEPSTRAL METHODS FOR IMAGE FEATURE
EXTRACTION
Serdar Cakır
M.S. in Electrical and Electronics Engineering
Supervisor: Prof. Dr. A. Enis Cetin
August 2010
Image feature extraction is one of the most vital tasks in computer vision and
pattern recognition applications due to its importance in the preparation of data
extracted from images.
In this thesis, 2D cepstrum based methods (2D mel- and Mellin-cepstrum) are
proposed for image feature extraction. The proposed feature extraction schemes
are used in face recognition and target detection applications. The cepstral
features are invariant to amplitude and translation changes. In addition, the
features extracted using 2D Mellin-cepstrum method are rotation invariant. Due
to these merits, the proposed techniques can be used in various feature extraction
problems.
The feature matrices extracted using the cepstral methods are classified by
Common Matrix Approach (CMA) and multi-class Support Vector Machine
(SVM). Experimental results show that the success rates obtained using cepstral
feature extraction algorithms are higher than the rates obtained using standard
baselines (PCA, Fourier-Mellin Transform, Fourier LDA approach). Moreover, it
iii

is observed that the features extracted by cepstral methods are computationally
more efficient than the standard baselines.
In target detection task, the proposed feature extraction methods are used in
the detection and discrimination stages of a typical Automatic Target Recogni-
tion (ATR) system. The feature matrices obtained from the cepstral techniques
are applied to the SVM classifier. The simulation results show that 2D cepstral
feature extraction techniques can be used in the target detection in SAR images.
Keywords: Image Feature Extraction, 2D cepstrum, 2D mel-cepstrum, 2D
Mellin-cepstrum, Fourier-Mellin Transform, Face Recognition, Target Detection,
SAR images
iv
OZET
IMGE OZNITELIK CIKARIMI ICIN KEPSTRAL
YONTEMLER
Serdar Cakır
Elektrik ve Elektronik Muhendisligi Bolumu Yuksek Lisans
Tez Yoneticisi: Prof. Dr. A. Enis Cetin
Agustos 2010
Imgelerden cıkarılan bilgilerin hazırlanmasındaki oneminden dolayı, imge
oznitelik cıkarımı, bilgisayarla gorme ve oruntu tanıma alanlarındaki en onemli
calısma alanlarından biridir.
Bu tezde, imgelerden oznitelik cıkarımı icin, iki boyutlu (2B) kepstrum
tabanlı yontemler (2B mel- ve Mellin-kepstrum) sunulmaktadır. Onerilen
oznitelik cıkarım teknikleri, yuz tanıma ve hedef tespit uygulamalarında
kullanılmıstır. Kepstral oznitelikler, genlik ve oteleme degisimlerine karsı
degisimsizdir. Buna ek olarak, 2B Mellin-kepstrum kullanılarak cıkarılan
oznitelikler, donme degisimsizdir. Sagladıgı bu faydalardan dolayı, onerilen
yontemler cesitli oznitelik cıkarım problemlerinde kullanılabilir.
Kepstral yontemler kullanılarak cıkarılan oznitelik matrisleri, Ortak Ma-
tris Yaklasımı (CMA) ve cok sınıflı Destek Vektor Makinası (SVM) kulla-
narak sınıflandırılmıstır. Deneysel sonuclar, kepstral oznitelik cıkarım algorit-
maları kullanılarak elde edilen basarı oranlarının standart temel yontemlerle
(Temel Bilesen Analizi, Fourier-Mellin Donusumu, Dogrusal Ayırtac Analizi)
elde edilen basarı oranlarından yuksek oldugunu gostermistir. Dahası, kepstral
iv

yontemlerce cıkarılan ozniteliklerin, hesaplama yuku bakımından daha verimli
oldugu gozlemlenmistir.
Hedef tespiti gorevinde, onerilen oznitelik cıkarım yontemleri, tipik Otomatik
Hedef Tanıma (ATR) sisteminin, tespit ve ayrımsama asamalarında kul-
lanılmaktadır. Kepstral yontemlerden elde edilen oznitelik matrisleri SVM
sınıflandırıcısına uygulanmıstır. Benzetim sonucları, 2B kepstral oznitelik
cıkarım yontemlerinin SAR imgelerinde hedef tespitinde kullanılabilecegini
gostermistir.
Anahtar Kelimeler: Imge Oznitelik Cıkarımı, Iki Boyutlu (2B) Kepstrum, 2B
mel-kepstrum, 2B Mellin-kepstrum, Fourier-Mellin Donusumu, Yuz Tanıma,
Hedef Tespiti, SAR imgeleri
v

ACKNOWLEDGMENTS
I would like to express my gratitude to Prof. Dr. A. Enis Cetın for his supervi-
sion, guidance and suggestions throughout the development of this thesis.
I would also like to thank Assoc. Prof. Dr. Ugur Gudukbay and Assist.
Prof. Dr. Sinan Gezici for reading, reviewing and making suggestions on this
thesis.
I wish to extend my thanks to all colleagues who have helped me in the
development of this thesis. Special thanks to Osman Gunay and Kıvanc Kose.
I would also like to thank TUBITAK for providing financial support through-
out my graduate study.
I would like to express my special thanks to my parents. Thank you for your
love, support and encouragement.
And last, but certainly not the least, I would like to thank my girlfriend,
Tugba Leblebici, for her love, patience and continuous support.
v
Contents
1 Introduction 1
2 Facial Image Feature Extraction using Cepstral Methods 4
2.1 Related Work on Facial Image Feature Extraction . . . . . . . . . 5
2.1.1 2D cepstrum . . . . . . . . . . . . . . . . . . . . . . . . . . 6
2.1.2 Fourier-Mellin Transform . . . . . . . . . . . . . . . . . . . 7
2.1.3 Rotation, Scale and Translation Invariance . . . . . . . . . 7
2.2 2D Mel-cepstrum Method . . . . . . . . . . . . . . . . . . . . . . 9
2.3 2D Mellin-cepstrum Method . . . . . . . . . . . . . . . . . . . . . 13
2.4 Face Databases . . . . . . . . . . . . . . . . . . . . . . . . . . . . 16
2.4.1 AR Face Database . . . . . . . . . . . . . . . . . . . . . . 16
2.4.2 ORL Face Database . . . . . . . . . . . . . . . . . . . . . 17
2.4.3 Yale Face Database . . . . . . . . . . . . . . . . . . . . . . 18
2.4.4 FRGC Version 2 Face Database . . . . . . . . . . . . . . . 18
2.5 Face Recognition Strategy . . . . . . . . . . . . . . . . . . . . . . 19
vi

2.5.1 Classifier . . . . . . . . . . . . . . . . . . . . . . . . . . . . 19
2.5.2 Procedure . . . . . . . . . . . . . . . . . . . . . . . . . . . 21
2.6 Experimental Results . . . . . . . . . . . . . . . . . . . . . . . . . 24
2.7 Summary . . . . . . . . . . . . . . . . . . . . . . . . . . . . . . . 29
3 Feature Extraction from SAR Images using Cepstral Methods 31
3.1 Related Work on SAR Image Feature Extraction . . . . . . . . . . 32
3.2 SAR Image Feature Extraction Using Cepstral Methods . . . . . . 33
3.3 SAR Image Database . . . . . . . . . . . . . . . . . . . . . . . . . 34
3.4 Target Detection Strategy . . . . . . . . . . . . . . . . . . . . . . 36
3.4.1 Classifier . . . . . . . . . . . . . . . . . . . . . . . . . . . . 37
3.5 Experimental Results . . . . . . . . . . . . . . . . . . . . . . . . . 37
3.6 Summary . . . . . . . . . . . . . . . . . . . . . . . . . . . . . . . 40
4 Conclusion 41
APPENDIX 44
A Non-uniform grids used in Cepstral Computations 44
Bibliography 48
vii
List of Figures
2.1 2D cepstrum calculation steps. . . . . . . . . . . . . . . . . . . . . 6
2.2 2D FMT calculation steps. . . . . . . . . . . . . . . . . . . . . . . 7
2.3 2D mel-cepstrum based feature extraction algorithm. . . . . . . . 11
2.4 A representative 2D mel-cepstrum grid in the DTFT domain. Cell
sizes are smaller at low frequencies compared to high frequencies. 11
2.5 35× 35 normalized weights for emphasizing high frequencies. . . . 12
2.6 Magnitude of 35× 35 2D mel-cepstrum of a face image matrix. . . 13
2.7 2D Mellin-cepstrum feature extraction algorithm. . . . . . . . . . 14
2.8 35× 35 2D Mellin-cepstrum of the face image matrix. . . . . . . . 16
2.9 Sample images from AR face database. . . . . . . . . . . . . . . . 17
2.10 Sample images from ORL face database. . . . . . . . . . . . . . . 17
2.11 Sample images from Yale face database. . . . . . . . . . . . . . . 18
2.12 Sample images from “Experiment 1 subset” of FRGC version 2
database. . . . . . . . . . . . . . . . . . . . . . . . . . . . . . . . 19
viii
2.13 Illumination compensated sample images for randomly selected
subjects from AR face database. . . . . . . . . . . . . . . . . . . . 22
2.14 Illumination compensated sample images for randomly selected
subjects from ORL face database. . . . . . . . . . . . . . . . . . . 23
2.15 Illumination compensated sample images for randomly selected
subjects from Yale face database. . . . . . . . . . . . . . . . . . . 23
2.16 Illumination compensated sample images for randomly selected
subjects from FRGC version 2 face database. . . . . . . . . . . . . 24
3.1 Stages of a typical SAR ATR system (Reprinted from [1]). . . . . 31
3.2 DH-6 Twin Otter Aircraft (Reprinted from [2]). . . . . . . . . . . 34
3.3 Sample target & clutter images. . . . . . . . . . . . . . . . . . . . 35
3.4 The flow diagram of the target detection strategy. . . . . . . . . . 36
A.1 49 × 49 non-uniform grid used in the cepstral feature extraction
techniques. The DFT size is 255× 255. . . . . . . . . . . . . . . . 45
A.2 39 × 39 non-uniform grid used in the cepstral feature extraction
techniques. The DFT size is 255× 255. . . . . . . . . . . . . . . . 46
A.3 35 × 35 non-uniform grid used in the cepstral feature extraction
techniques. The DFT size is 255× 255. . . . . . . . . . . . . . . . 47
A.4 29 × 29 non-uniform grid used in the cepstral feature extraction
techniques. The DFT size is 255× 255. . . . . . . . . . . . . . . . 48
ix

List of Tables
2.1 Recognition Rates (RR) that are obtained when cepstral features
extracted using different Non-uniform Grids (NGs) are applied to
CMA classifier. . . . . . . . . . . . . . . . . . . . . . . . . . . . . 25
2.2 Recognition Rates (RR) that are obtained when cepstral features
extracted using different Non-uniform Grids (NGs) are applied to
multi-class SVM classifier. . . . . . . . . . . . . . . . . . . . . . . 26
2.3 Recognition Rates (RR) of CMA classifier with different databases
and feature sets. IC stands for Illumination Compensation. . . . . 27
2.4 Recognition Rates (RR) of multi-class SVM classifier with differ-
ent databases and feature sets. IC stands for Illumination Com-
pensation. . . . . . . . . . . . . . . . . . . . . . . . . . . . . . . . 28
3.1 The target detection accuracies and false alarm rates obtained
with different Non-uniform Grids used in the calculation of 2D
mel- and Mellin-cepstrum features. NG: Non-uniform Grid. . . . . 38
3.2 The target detection accuracies and false alarm rates obtained
using region covariance and region codifference methods with SVM
classifier. The results are adopted from [1]. . . . . . . . . . . . . . 39
x

Dedicated to my grandfather . . .

Chapter 1
Introduction
Rapid advances in computer technology encouraged scientist and researchers to
perform tremendous amount of research in the fields of computer vision and
pattern recognition. Extracting meaningful and important information from an
image is one of the most important tasks in these fields [3]. The first step in
many image and video processing methods is feature extraction. The features are
used to represent patterns and objects in various applications such as detection,
recognition and registration. Feature extraction process not only provides better
pattern representation but also lowers the computational complexity. Many tech-
niques have been developed to extract various features [4]. Feature extraction
techniques can be grouped into two main categories as low-level and high-level
methods. The low-level features can be extracted directly from input image and
high-level features are based on low-level features. The high-level features are ex-
tracted from low-level features by performing various techniques [5]. Modalities
(low-level features) and classifiers are used in a data-fusion framework in order to
extract high level features [6]. The features can be grouped more systematically
as general features and domain-specific features [7].
1
General features include pixel-level, local and global features. Pixel-level
features can be calculated in each pixel using color, intensity and first/second
derivative information. Pixel-level features are used successfully in computer
vision applications [8, 9].
The local features are based on the appearance of the objects at particular
interest points. These features are ideally invariant to illumination, amplitude
variations as well as rotational and scale changes. The calculation of local features
is based on extracting special information in the Region of Interest (ROI) [1].
The local features can be calculated over the outputs of image segmentation [10]
and edge detection [11] algorithms. An example to a such feature is object shape.
Global features include calculation of statistical properties such as histogram,
mean and moment over the whole or part of the image [12, 13, 14, 15]. The part or
ROI of the image is represented with a single histogram, mean or moment value.
Therefore histogram, mean and moment methods provide additional dimensional
reduction by combining the values in the ROI.
Domain-specific features are application dependent. Depending on the char-
acteristics of the pattern used in a certain application, appropriate feature types
and extraction techniques are determined. The feature extraction techniques can
be used individually as well as cascaded one after another.
The goal of this thesis is to propose a feature extraction technique to repre-
sent images better and to use this technique in various image feature extraction
problems. The main objective of the thesis is to develop a feature extraction
method that provides translation, illumination and rotation invariant features
which can eliminate variations and changes in various images including facial
and SAR images.
In this thesis, 2D mel-cepstrum based feature extraction techniques are pro-
posed for image feature extraction. Mel-cepstral analysis is one of the most
2
popular feature extraction techniques in speech processing applications includ-
ing speech and sound recognition and speaker identification [16]-[20]. Two-
dimensional (2D) cepstrum, 2D extension of the 1D frequency cepstrum, is also
used in image registration and filtering applications [21, 22, 23, 24]. To the best
of our knowledge 2D mel-cepstrum which is a variant of 2D cepstrum is not used
in image feature extraction, classification and recognition problems. In this work,
proposed cepstral methods are used in both face recognition and SAR image tar-
get detection applications. Common Matrix Approach (CMA) and multi-class
Support Vector Machine (SVM) are used as classification engines.
The computation of proposed cepstral features includes the logarithm opera-
tor. Due to the logarithm operator, the cepstral features are invariant to ampli-
tude changes. Since the cepstral features are based on Fourier transform, they
are independent of translational shifts. Moreover, the cepstral method described
in Section 2.3 produces rotation invariant features resulting from the log-polar
conversion. The cepstral feature calculation steps also include non-uniform grid
and weighting operations. The Fourier transform of the input image is applied
to the non-uniform grid. The non-uniform grid includes bins that are smaller
at low frequencies compared to high-frequencies. The DFT values are grouped
in each cell of the logarithmic grid by computing the mean value. In this way,
the dimensions of the 2D mel-cepstrum based features become smaller than the
dimensions of the original image.
The rest of the thesis is organized as follows. In Chapter 2, 2D mel- and
Mellin-cepstrum feature extraction methods are proposed and used in the face
recognition problem. The procedure, classifiers, dataset and simulation results
are presented in the same chapter. In Chapter 3, the proposed cepstral features
are used in feature extraction from SAR images in target detection application.
Conclusions are made and the contributions are stated in the last chapter.
3

Chapter 2
Facial Image Feature Extraction
using Cepstral Methods
In this chapter, 2D mel-cepstrum and 2D Mellin-cepstrum are proposed for fea-
ture extraction from images. These features are applied to the face recognition
problem and used for extracting facial features. The cepstral feature matrices are
applied to the Common Matrix Approach (CMA) classifier [25] and multi-class
Support Vector Machine (SVM) [26].
The performance of the proposed cepstral features are compared with the
original pixel value based features and the features extracted by using standard
baseline methods such as 2D PCA, 2D PCA with illumination compensation
algorithm [27], Fourier LDA [28] and Fourier-Mellin transform [29].
The rest of the chapter is organized as follows. In Section 2.1, related work in
facial image feature extraction is presented. 2D mel- and Mellin-cepstrum feature
extraction methods are proposed and explained in Sections 2.2 and 2.3, respec-
tively. AR face database [30], ORL face database [31], Yale face database [32]
and FRGC version 2 database [33] are used in the experimental studies for facial
feature extraction. These face databases are briefly introduced in Sections 2.4.1,
4
2.4.2, 2.4.3 and 2.4.4 respectively. In Section 2.5, the face recognition strategy
and the classifiers used in the experiments are described. Finally, experimental
results and observations are presented in Section 2.6. The experimental studies
and simulations are carried out using MATLAB� R2009b computational envi-
ronment.
2.1 Related Work on Facial Image Feature Ex-
traction
Facial image feature extraction is the most important step in face recogni-
tion [34, 35] that is still an active and popular area of research due to its various
practical applications such as security, surveillance and identification systems.
Significant variations in the images of same faces and similarities between the
images of different faces make it difficult to recognize human faces. Principal
Component Analysis (PCA) and Linear Discriminant Analysis (LDA) are well
known techniques that were used in face recognition [36, 37, 38]. Although PCA
is used as a successful dimensional reduction technique in face recognition, direct
LDA based methods cannot provide good performance when there are large vari-
ations and illumination changes in the face images. LDA with some extensions
such as quadratic LDA [39], Fisher’s LDA [40], and direct, exact LDA [41] were
proposed. PCA is known as a popular linear feature extraction method that is
used in one of the most famous techniques called eigenfaces. In the eigenface
method, image space is simply projected to a low dimensional feature space [42].
That is how the dimensional reduction is achieved.
In order to extract better representative features from facial images, re-
searchers have performed frequency domain analysis techniques. Jing et al.
select appropriate frequency bands for image representation using separability
judgment [28]. In another work, Jing et al. use fractional Fourier transform
5
developed from conventional Fourier transform to extract discriminative Fourier
transform based features [43]. Lai et al. use holistic Fourier invariant features to
represent face images [44]. These features provide translation, scale and on-plane
rotation invariance by combining wavelet and Fourier transforms. 2D cepstrum
and Fourier-Mellin transform are also used in image processing applications.
In Subsections 2.1.1 and 2.1.2, two important works (2D cepstrum and
Fourier-Mellin transform) regarding the proposed cepstral feature extraction
methods are briefly explained.
2.1.1 2D cepstrum
Mel-cepstral analysis is a commonly used method in speech processing applica-
tions including speech and sound recognition and speaker identification [16]-[20].
Two-dimensional (2D) cepstrum, 2D extension of the 1D frequency cepstrum,
is proposed for image registration and filtering applications [21, 22, 23, 24]. The
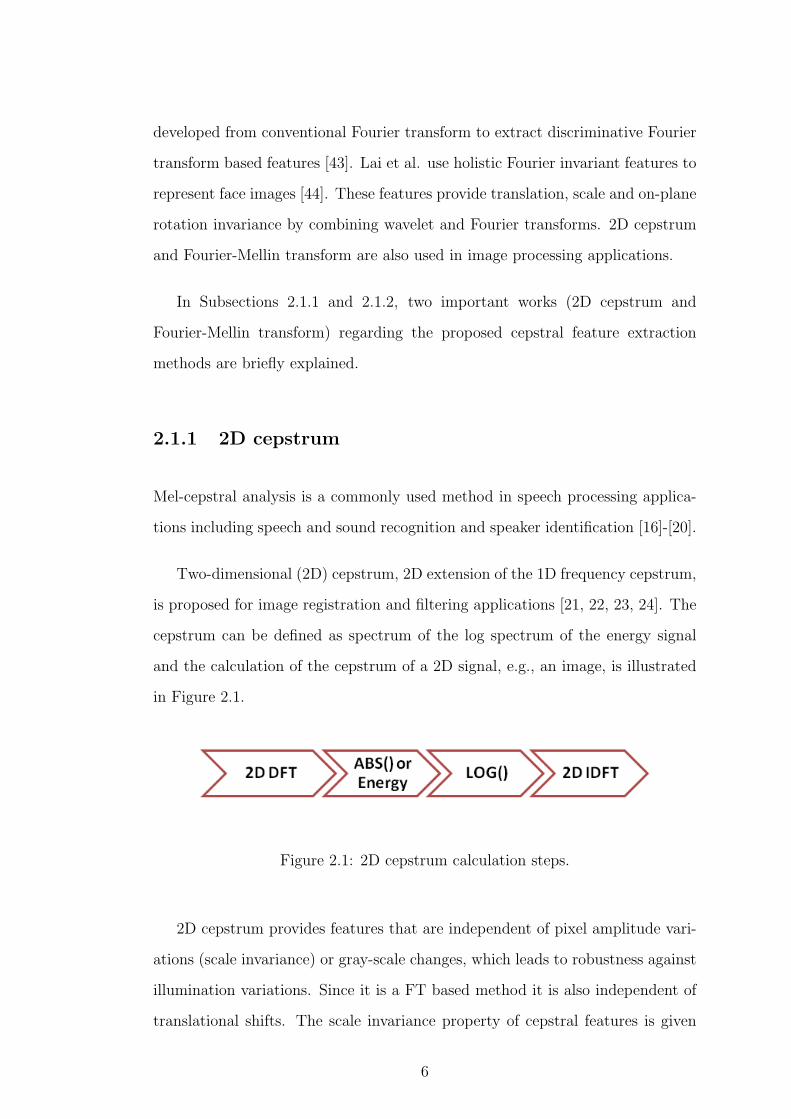
cepstrum can be defined as spectrum of the log spectrum of the energy signal
and the calculation of the cepstrum of a 2D signal, e.g., an image, is illustrated
in Figure 2.1.
Figure 2.1: 2D cepstrum calculation steps.
2D cepstrum provides features that are independent of pixel amplitude vari-
ations (scale invariance) or gray-scale changes, which leads to robustness against
illumination variations. Since it is a FT based method it is also independent of
translational shifts. The scale invariance property of cepstral features is given
6
in Equations 2.10 and 2.11 and translation invariance property of a 2D signal is
explained in Section 2.1.3.
2.1.2 Fourier-Mellin Transform
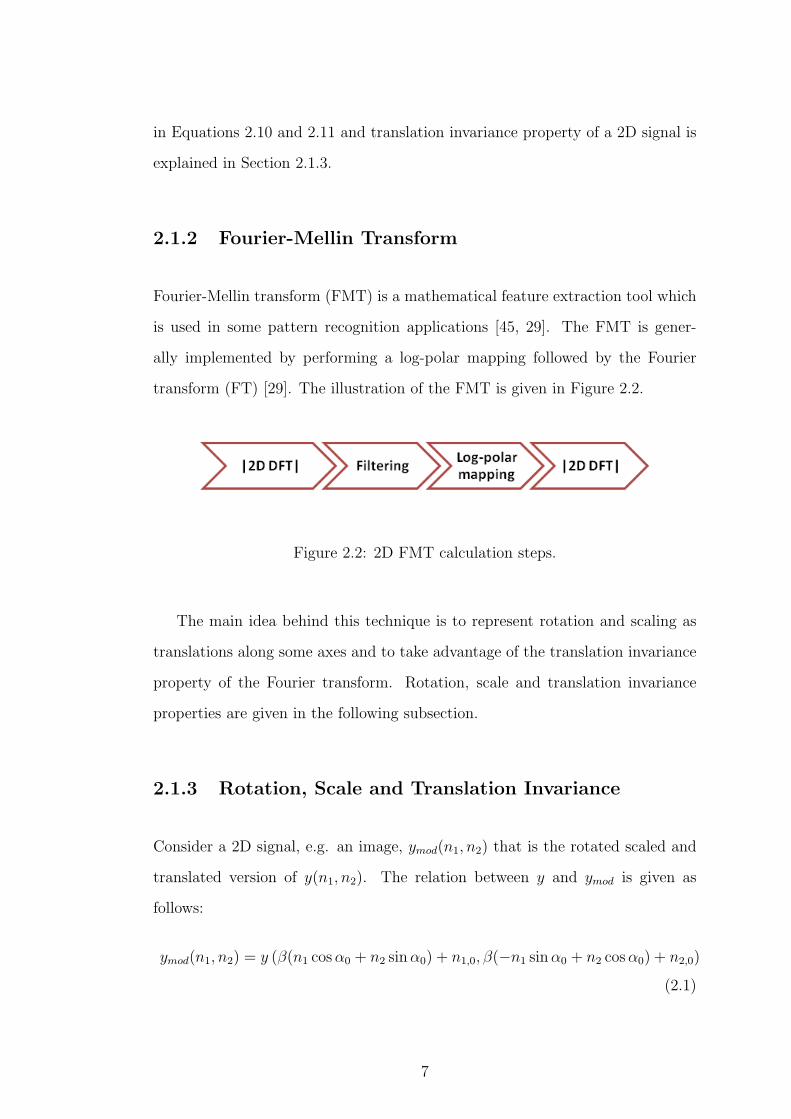
Fourier-Mellin transform (FMT) is a mathematical feature extraction tool which
is used in some pattern recognition applications [45, 29]. The FMT is gener-
ally implemented by performing a log-polar mapping followed by the Fourier
transform (FT) [29]. The illustration of the FMT is given in Figure 2.2.
Figure 2.2: 2D FMT calculation steps.
The main idea behind this technique is to represent rotation and scaling as
translations along some axes and to take advantage of the translation invariance
property of the Fourier transform. Rotation, scale and translation invariance
properties are given in the following subsection.
2.1.3 Rotation, Scale and Translation Invariance
Consider a 2D signal, e.g. an image, ymod(n1, n2) that is the rotated scaled and
translated version of y(n1, n2). The relation between y and ymod is given as
follows:
ymod(n1, n2) = y (β(n1 cos α0 + n2 sin α0) + n1,0, β(−n1 sin α0 + n2 cos α0) + n2,0)
(2.1)
7

where α0, β and (n10, n20) are rotation, scale and translation parameters, respec-
tively.
Let Y and Ymod be the Fourier transforms of y and ymod. The relation between
Y and Ymod is given as follows:
Y mod (u, v) =1
β2e−j2π(n10u+n20v)Y (
u cos α0 + v sin α0
β,−u sin α0 + v cos α0
β)
(2.2)
If one calculates the magnitude of the expression in Equation 2.2, the following
equation is obtained:
|Y mod (u, v)| = 1
β2
∣∣∣∣Y (u cos α0 + v sin α0
β,−u sin α0 + v cos α0
β)
∣∣∣∣ (2.3)
which is translation invariant. Log-polar conversion is performed by considering
the coordinates such that:
u = eρ cos θ
v = eρ sin θ(2.4)
By substituting u and v in Equation 2.3, the following equation is obtained:
|Y mod (eρ cos θ, eρ sin θ)| = 1β2
∣∣∣Y ( eρ cos(θ−α0)β
, eρ sin(θ−α0)β
)∣∣∣
= 1β2
∣∣Y (eρ−log β cos(θ − α0), eρ−log β sin(θ − α0))
∣∣(2.5)
Let YLP and Ymod,LP denote log-polar mappings of Y and Ymod, respectively.
Then, Equation 2.5 can be rewritten as:
Y mod , LP (ρ, θ) =1
β2YLP (ρ− log β, θ − α0) (2.6)
whereYLP (ρ, θ) = |Y (eρ cos θ, eρ sin θ)|
Y mod , LP (ρ, θ) = |Y mod (eρ cos θ, eρ sin θ)|
According to Equation 2.6, the rotation and scale changes appear in the calcu-
lations as translational shifts after performing log-polar conversion. These trans-
lational shifts can be eliminated by taking the absolute value of Equation 2.6.
At the end, extracted features become invariant to rotation and translation. The
scaling factor ( 1β2 ) in Equation 2.6 can be removed by using the scale invariance
property (Equations 2.10 and 2.11) of the proposed cepstral features.
8
2.2 2D Mel-cepstrum Method
In this section, 2D mel-cepstrum feature extraction technique that is based on the
cepstrum of a 2D signal is proposed. In the literature, the 2D cepstrum was used
for shadow detection, echo removal, automatic intensity control, enhancement of
repetitive features and cepstral filtering [21, 22, 23].
2D mel-cepstrum is based on the classical 2D cepstrum y(p, q) of a 2D image
y(n1, n2), which is given by:
y(p, q) = F−12 (log(|Y (u, v)|2)), (2.7)
where (p, q) denote the 2D cepstral quefrency coordinates, F−12 denotes 2D In-
verse Discrete-Time Fourier Transform (IDTFT) and Y (u, v) is the 2D Discrete-
Time Fourier Transform (DTFT) of the image y(n1, n2). The cepstral feature
domain is neither frequency domain, nor time domain. Therefore, Bogert et al.
chose to refer this special domain as “quefrency domain” [46]. In the calculation
of DTFT of a given signal, Fast Fourier Transform (FFT) algorithm is used in
practice.
Because of the logarithm operation in Equation 2.7, the 2D cepstrum is in-
dependent of pixel amplitude variations or gray-scale changes. This leads to
robustness against illumination variations. Since it is an FT based method it
is also independent of translational shifts. Similarly, 2D mel-cepstrum which is
based on both logarithmic spectrum and logarithmic decomposition of frequency
domain grid also has the same shift and amplitude invariance properties as the
2D cepstrum.
In 2D mel-cepstrum, the DTFT domain data is divided into non-uniform bins
in a logarithmic manner as shown in Figure 2.4 and the energy |G(m,n)|2 of each
bin is computed as follows:
|G(m,n)|2 =∑
k,l∈B(m,n)
|Y (k, l)|2 (2.8)
9
where Y (k, l) is the Discrete Fourier Transform (DFT) of y(n1, n2), and B(m,n)
is the (m,n) − th cell of the logarithmic grid. Cell or bin sizes are smaller at
low frequencies compared to high-frequencies. This approach is similar to the
mel-cepstrum computation in speech processing. Similar to speech signals most
natural images, including face images, are low-pass in nature. Therefore, there is
more signal energy at low-frequencies compared to high frequencies. Logarithmic
division of the DFT grid emphasizes high frequencies which may have more
discriminative power. After this step, 2D mel-frequency cepstral coefficients,
ym(p, q), are computed using either inverse DFT or DCT as follows:
ym(p, q) = F−12 (log(|G(m,n)|2)) (2.9)
The size of the Inverse DFT (IDFT) is smaller than the size of the forward DFT
used to compute Y (k, l) because of the logarithmic grid shown in Figure 2.4.
Since several DFT values are grouped together in each cell, the resulting 2D
mel-cepstrum sequence computed using the IDFT has smaller dimensions than
the original image. It is also possible to apply different weights to different bins
(cells) to emphasize certain bands as in speech processing. The steps of the 2D
mel-cepstrum based feature extraction scheme is summarized below.
� N × N 2D DFTs of input images are calculated. The DFT size N
should be larger than the image size. It is better to select N = 2r >
dimension(y(n1, n2)) to take advantage of the FFT algorithm during DFT
computation.
� The non-uniform DTFT grid is applied to the resultant DFT matrix and
the energy |G(m,n)|2 of each cell is computed. Each cell of the grid can
be also weighted with a coefficient. The new data size is M × M where
M ≤ N
� Logarithm of cell energies |G(m,n)|2 are computed.
10

� 2D IDFT or 2D IDCT of the M ×M data is computed to get the M ×M
mel-cepstrum sequence.
The flow diagram of the 2D mel-Cepstrum feature extraction technique is
given in Figure 2.3.
Figure 2.3: 2D mel-cepstrum based feature extraction algorithm.
Figure 2.4: A representative 2D mel-cepstrum grid in the DTFT domain. Cell
sizes are smaller at low frequencies compared to high frequencies.
In a face image, edges and important facial features generally contribute to
high frequencies. In order to extract better representative features, high fre-
quency component cells of the 2D DFT grid are multiplied with higher weights
11

compared to low frequency component cells in the grid. As a result, high fre-
quency components are further emphasized. In order to emphasize the high
frequency component cells of the 2D DFT grid further, the normalized weights
are organized as in Figure 2.5. White values corresponds to 1 and black values
corresponds to 0 in Figure 2.5. The smallest value used in Figure 2.5 is 0.005.
Figure 2.5: 35× 35 normalized weights for emphasizing high frequencies.
Invariance of cepstrum to pixel amplitude changes is an important feature.
In this way, it is possible to achieve robustness to illumination invariance. Let
Y (u, v) denote the 2D DTFT of a given image matrix y(n1, n2), then cy(n1, n2)
has a DTFT cY (u, V ) for any real constant c. The log spectrum of cY (u, V ) is
given as follows:
log(|cY (u, v)|) = log(|c|) + log(|Y (u, v)|) (2.10)
and the corresponding cepstrum is given as follows:
ψ(p, q) = aδ(p, q) + y(p, q)
where δ(p, q) =
1 p = q = 0
0 otherwise
(2.11)
Therefore, the cepstrum values, except at (0, 0) location (DC Term), do not vary
with the amplitude changes. Since the Fourier Transform magnitudes of y(n1, n2)
12
and y(n1−k1, n2−k2) are the same, the 2D cepstrum and mel-cepstrum are shift
invariant features.
Another important characteristic of 2D cepstrum is symmetry with respect
to y[n1, n2] = y[−n1,−n2]. As a result only half of the 2-D cepstrum or MxM
2D mel-cepstrum coefficients are enough when IDFT is used.
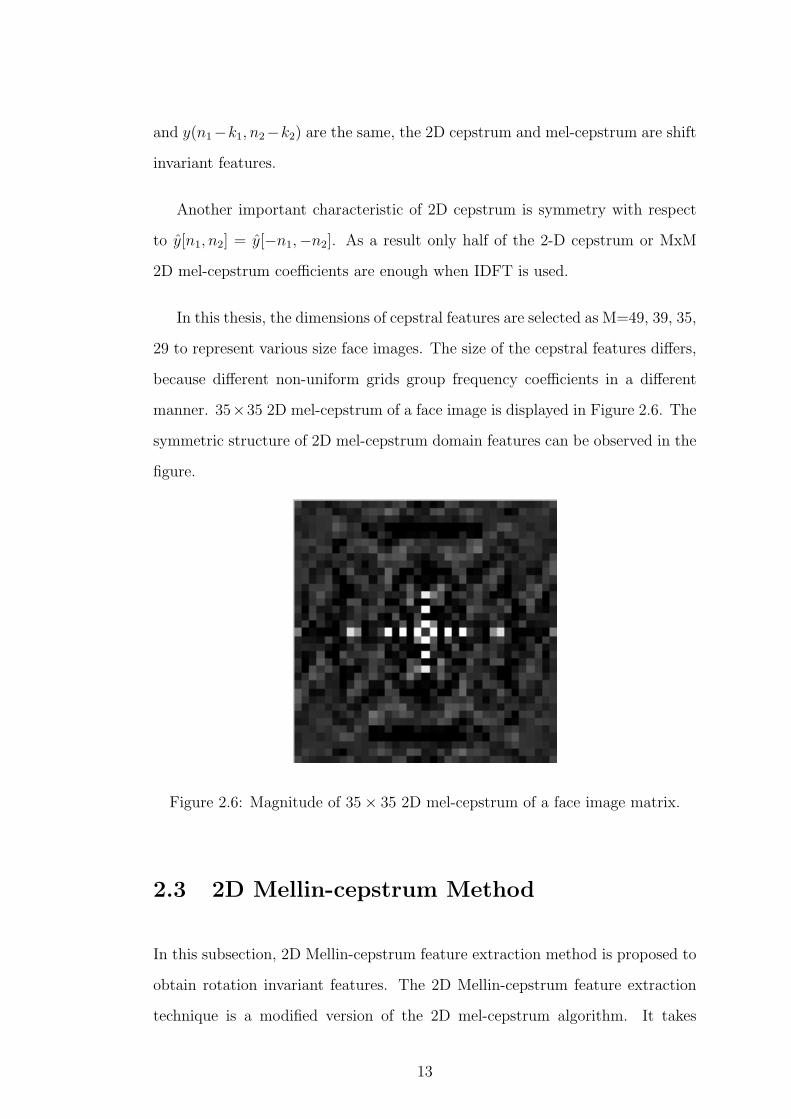
In this thesis, the dimensions of cepstral features are selected as M=49, 39, 35,
29 to represent various size face images. The size of the cepstral features differs,
because different non-uniform grids group frequency coefficients in a different
manner. 35×35 2D mel-cepstrum of a face image is displayed in Figure 2.6. The
symmetric structure of 2D mel-cepstrum domain features can be observed in the
figure.
Figure 2.6: Magnitude of 35× 35 2D mel-cepstrum of a face image matrix.
2.3 2D Mellin-cepstrum Method
In this subsection, 2D Mellin-cepstrum feature extraction method is proposed to
obtain rotation invariant features. The 2D Mellin-cepstrum feature extraction
technique is a modified version of the 2D mel-cepstrum algorithm. It takes
13
advantage of the Mellin transform and provides rotation, scale and illumination
invariant features. Fourier-Mellin transform based features are rotation, scale
and translation invariant [29].
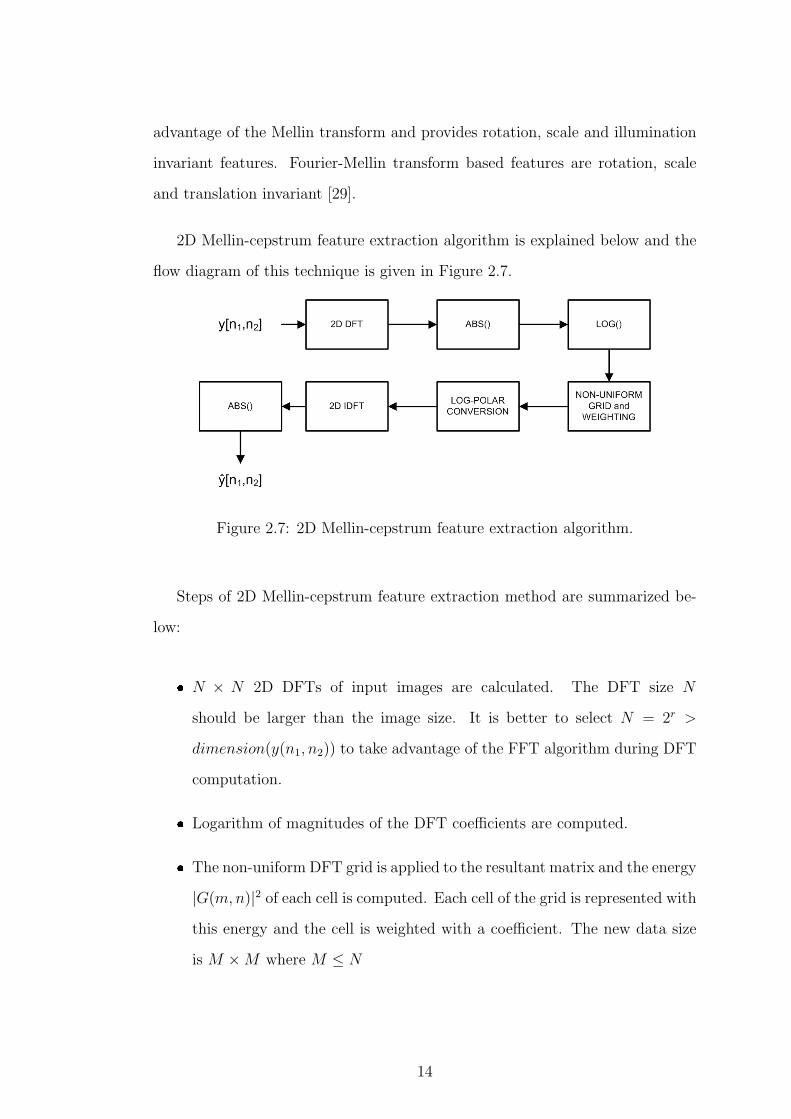
2D Mellin-cepstrum feature extraction algorithm is explained below and the
flow diagram of this technique is given in Figure 2.7.
Figure 2.7: 2D Mellin-cepstrum feature extraction algorithm.
Steps of 2D Mellin-cepstrum feature extraction method are summarized be-
low:
� N × N 2D DFTs of input images are calculated. The DFT size N
should be larger than the image size. It is better to select N = 2r >
dimension(y(n1, n2)) to take advantage of the FFT algorithm during DFT
computation.
� Logarithm of magnitudes of the DFT coefficients are computed.
� The non-uniform DFT grid is applied to the resultant matrix and the energy
|G(m,n)|2 of each cell is computed. Each cell of the grid is represented with
this energy and the cell is weighted with a coefficient. The new data size
is M ×M where M ≤ N
14

� Cartesian to Log-polar conversion is performed using bilinear interpolation.
This is the key step of the Fourier-Mellin transform providing rotation and
scale invariance.
� 2D IDFT of the M ×M data is computed.
� Absolute values or energies of the IDFT coefficients are calculated to get
the M ×M Mellin-cepstrum sequence.
Since 2D Mellin-cepstrum features are Fourier transform based features, they
are independent of translational shifts. They are also invariant to pixel amplitude
changes due to the logarithm operator. In addition, 2D Mellin-cepstrum has
rotation and scale invariance properties.
Since there exists a log-polar conversion step in the calculation of 2D Mellin-
cepstrum features, these features are not symmetric with respect to y[n1, n2] =
y[−n1,−n2]. Therefore, one half of the 2D Mellin-Cepstrum features is not suf-
ficient to represent the image. As a result, the size of the 2D Mellin-Cepstrum
features is twice size of the 2D mel-cepstrum based features.
Different sized 2D Mellin-cepstrum features are calculated using different non-
uniform grids and weights given in Section 2.2. As an example, 35 × 35 2D
Mellin-cepstrum of a face image is displayed in Figure 2.8.
15
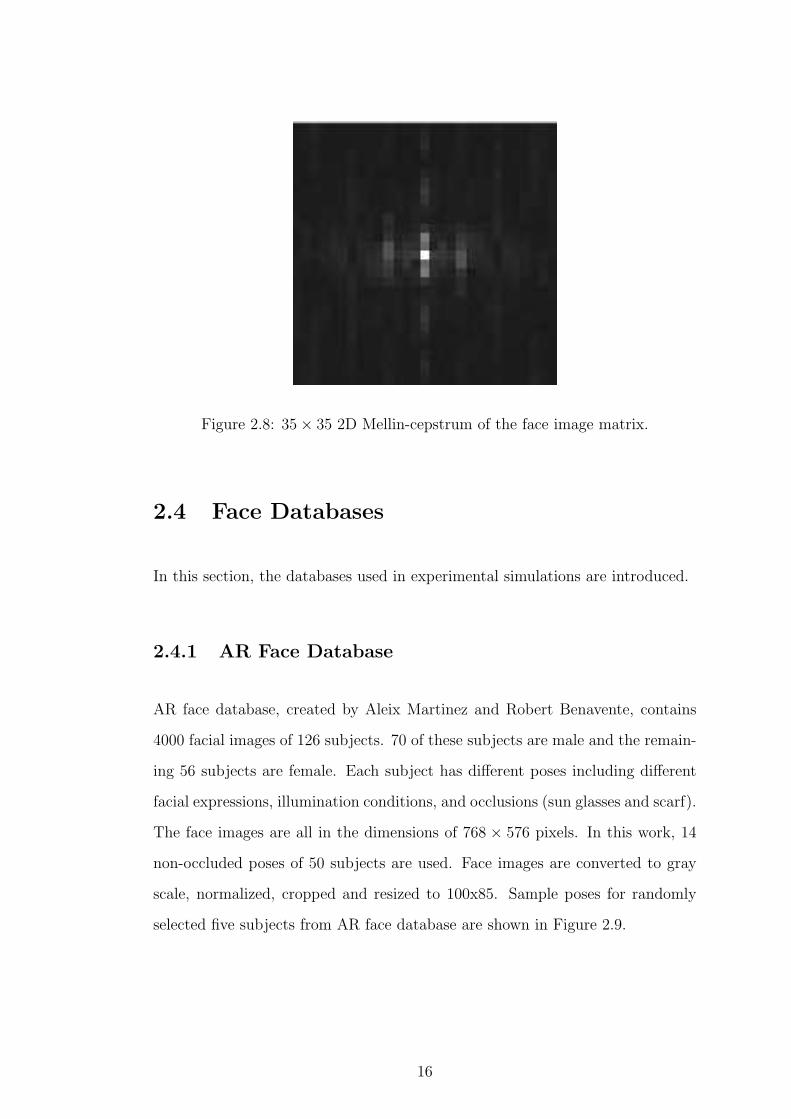
Figure 2.8: 35× 35 2D Mellin-cepstrum of the face image matrix.
2.4 Face Databases
In this section, the databases used in experimental simulations are introduced.
2.4.1 AR Face Database
AR face database, created by Aleix Martinez and Robert Benavente, contains
4000 facial images of 126 subjects. 70 of these subjects are male and the remain-
ing 56 subjects are female. Each subject has different poses including different
facial expressions, illumination conditions, and occlusions (sun glasses and scarf).
The face images are all in the dimensions of 768 × 576 pixels. In this work, 14
non-occluded poses of 50 subjects are used. Face images are converted to gray
scale, normalized, cropped and resized to 100x85. Sample poses for randomly
selected five subjects from AR face database are shown in Figure 2.9.
16
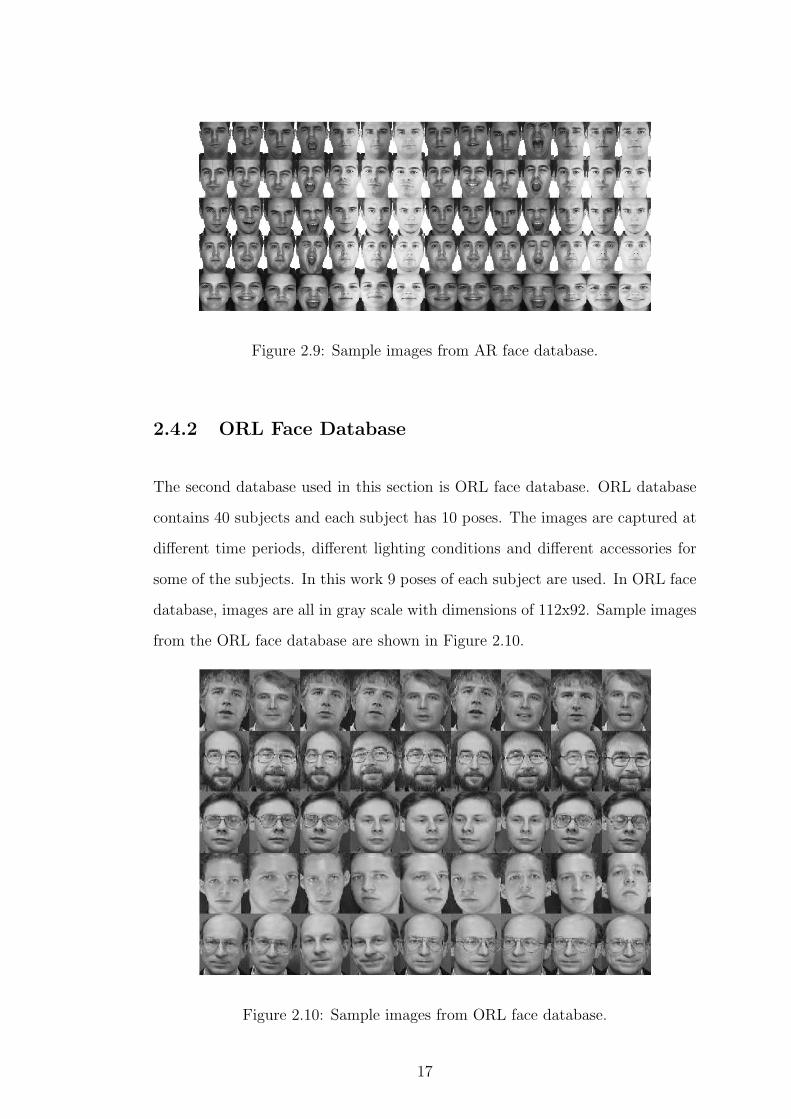
Figure 2.9: Sample images from AR face database.
2.4.2 ORL Face Database
The second database used in this section is ORL face database. ORL database
contains 40 subjects and each subject has 10 poses. The images are captured at
different time periods, different lighting conditions and different accessories for
some of the subjects. In this work 9 poses of each subject are used. In ORL face
database, images are all in gray scale with dimensions of 112x92. Sample images
from the ORL face database are shown in Figure 2.10.
Figure 2.10: Sample images from ORL face database.
17

2.4.3 Yale Face Database
The third database used in this section is the Yale face database. Yale database
contains gray scale facial images with sizes of 152x126. The database contains 165
facial images belonging to 15 subjects. Each pose of the subjects has different
facial expressions and illuminations. Sample images from Yale database are
shown in Figure 2.11.
Figure 2.11: Sample images from Yale face database.
2.4.4 FRGC Version 2 Face Database
The FRGC version 2 database [33] contains 12776 images belonging to 222 sub-
jects. In our experiments, the image set previously used in the experiment 1 [33]
is used. The experiment 1 subset images are taken in a controlled environment
under different illumination and facial expressions. The dataset contains 16028
images of 225 subjects and the number of poses for each person varies between 32
and 88. In order to have a dataset with equal number of poses for each subject,
32 poses of each subject are randomly selected. At the end, we have a subset
including 7200 facial images. The images are cropped and resized to 50× 50 by
18
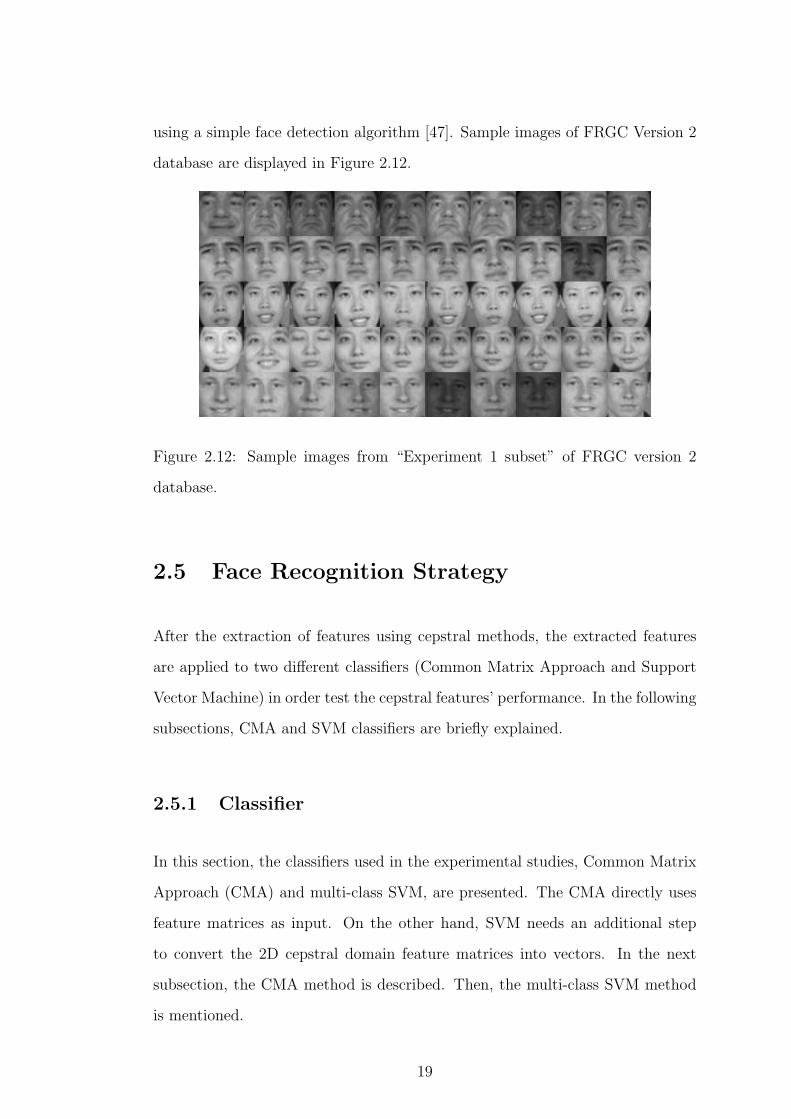
using a simple face detection algorithm [47]. Sample images of FRGC Version 2
database are displayed in Figure 2.12.
Figure 2.12: Sample images from “Experiment 1 subset” of FRGC version 2
database.
2.5 Face Recognition Strategy
After the extraction of features using cepstral methods, the extracted features
are applied to two different classifiers (Common Matrix Approach and Support
Vector Machine) in order test the cepstral features’ performance. In the following
subsections, CMA and SVM classifiers are briefly explained.
2.5.1 Classifier
In this section, the classifiers used in the experimental studies, Common Matrix
Approach (CMA) and multi-class SVM, are presented. The CMA directly uses
feature matrices as input. On the other hand, SVM needs an additional step
to convert the 2D cepstral domain feature matrices into vectors. In the next
subsection, the CMA method is described. Then, the multi-class SVM method
is mentioned.
19
Common Matrix Approach (CMA)
The Common Matrix Approach (CMA) is a 2D extension of Common Vector
Approach (CVA), which is a subspace based pattern recognition method [48].
The CVA was successfully used in finite vocabulary speech recognition [49]. The
CMA is used as a classification engine in this article. In order to train the CMA,
common matrices belonging to each subject (class) are computed. In an image
dataset, there are C classes that contain K face images. Let yci denote the ith
image matrix belonging to the class c. The common matrix calculation process
starts with selecting a reference image for each class. Then, the reference im-
ages are subtracted from the remaining K − 1 images of each subject. After the
subtraction, the remaining matrices of each class are orthogonalized by using
Gram-Schmidt Orthogonalization. The orthogonalized matrices are orthonor-
malized by dividing each matrix to its frobenius norm. These orthonormalized
matrices span the difference subspace of the corresponding class. Let Bci denote
the orthonormal basis matrices belonging to class c where i = 1, 2, ..., K − 1 and
c = 1, 2, ..., C. Any image matrix yci belonging to class c can be projected onto
the corresponding different subspaces in order to calculate difference matrices.
The difference matrices are determined as follows:
ycdiff,i =
K−1∑s=1
〈yci , B
cs〉Bc
s (2.12)
Next, common matrices are calculated for each image class:
yccom = yc
i − ycdiff,i (2.13)
In the test part of the CMA algorithm, test image T is projected onto the dif-
ference subspaces of each class then the projection is subtracted from the test
20

image matrix.
D1 = T −K−1∑s=1
〈T, B1s 〉B1
s
D2 = T −K−1∑s=1
〈T, B2s 〉B2
s
.
.
DC = T −K−1∑s=1
⟨T, BC
s
⟩BC
s
(2.14)
The test image T is assigned to class c for which the distance ‖Dc − yccom‖2 is
minimum.
Multi-Class Support Vector Machine (SVM)
SVM, developed by Vladimir Vapnik, is a supervised machine learning method
based on the statistical learning theory [50]. The method constructs a hyper-
plane or a set of hyperplanes in a high dimensional space that can be used in
classification tasks. In this work, SVM with a multi-class classification sup-
port, namely C-SVC [26] with RBF kernel is used. The multi-class SVM uses
“one-against-one” strategy [51]. In the experiments, SVM parameters are set as
“cost = 1000, gamma = 0.008”, after performing a cross validation process.
2D cepstral domain feature matrices are converted to vectors in a raster scan
approach before training and classification. The raster scan starts with ym(0, 0).
If there are pixel intensity variations, ym(0, 0) is ignored and the scan starts from
ym(0, 1).
2.5.2 Procedure
In order to compare performances of various features, original image pixel ma-
trices, 2D PCA based features, 2D PCA of illumination compensated images,
21
Fourier LDA, Fourier-Mellin transform and proposed cepstrum based features
are applied to CMA and multi-class SVM as inputs.
For the purpose of achieving robustness in recognition results, leave-one-out
procedure is used. Recall that, K denotes number of poses for each person in a
database. In the test part of the classifier, one pose of each person is used for
testing. Remaining K − 1 poses for each person are used in the training part of
the classifier. In the leave-one-out procedure, the test pose is changed in each
turn and the algorithm is trained with the new K−1 images. At the end, a final
recognition rate is obtained by averaging the recognition rates for each selection
of the test pose.
Due to the invariance of 2D mel-cepstral features to pixel amplitude changes,
the 2D mel-cepstrum can cope with large illumination changes in a dataset. In
order to observe the mel-cepstral feature’s robustness to illumination variations,
a second experiment was carried out. An illumination compensation algorithm
(LogAbout method [27]) is implemented and used as a preprocessing step before
extracting features using 2D PCA. The illumination compensated image samples
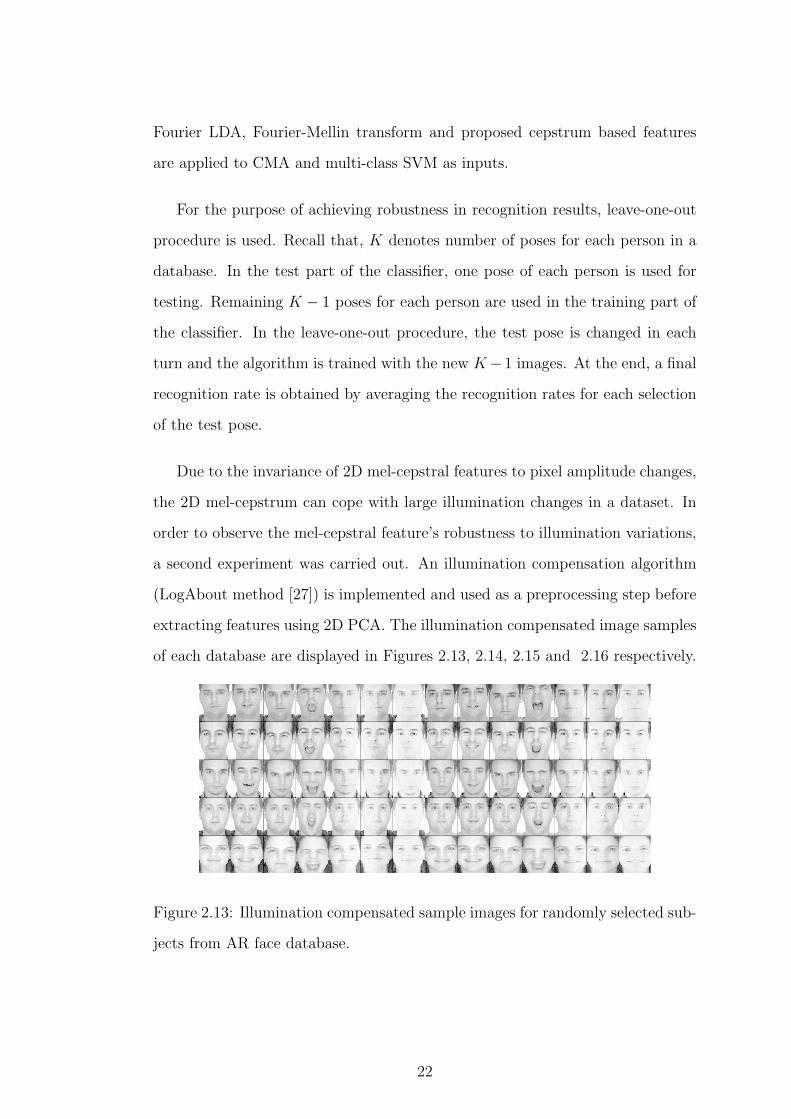
of each database are displayed in Figures 2.13, 2.14, 2.15 and 2.16 respectively.
Figure 2.13: Illumination compensated sample images for randomly selected sub-
jects from AR face database.
22
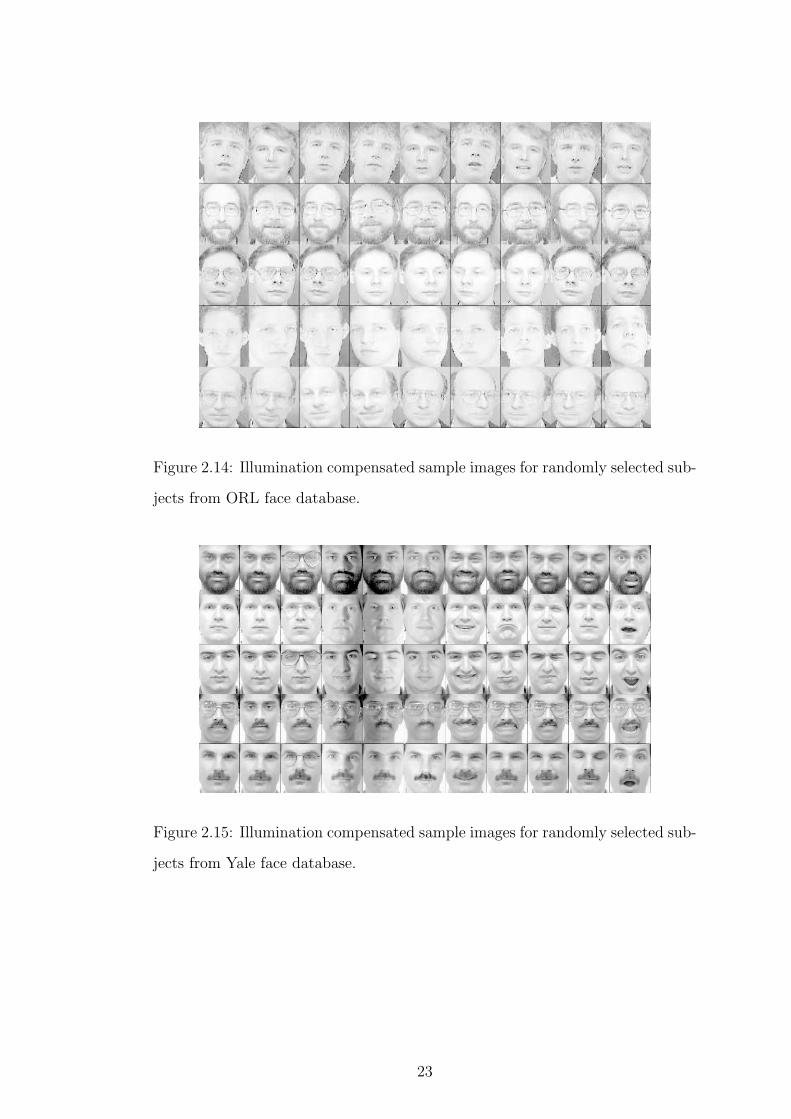
Figure 2.14: Illumination compensated sample images for randomly selected sub-
jects from ORL face database.
Figure 2.15: Illumination compensated sample images for randomly selected sub-
jects from Yale face database.
23
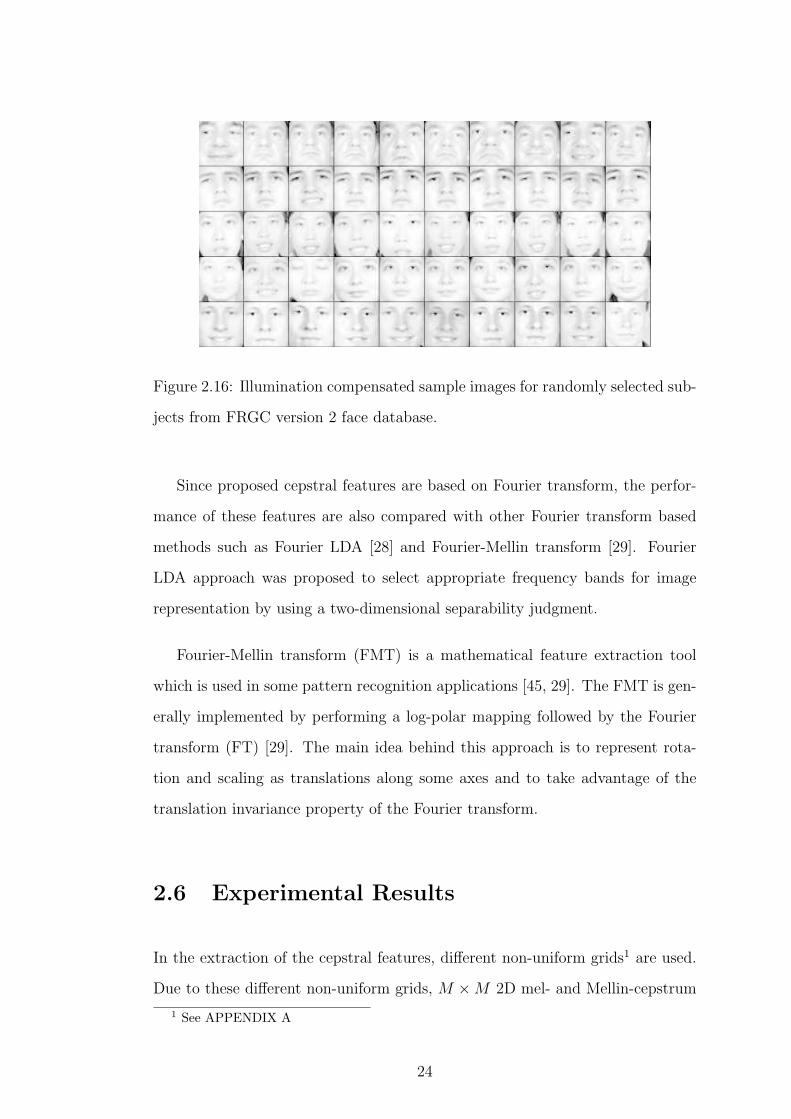
Figure 2.16: Illumination compensated sample images for randomly selected sub-
jects from FRGC version 2 face database.
Since proposed cepstral features are based on Fourier transform, the perfor-
mance of these features are also compared with other Fourier transform based
methods such as Fourier LDA [28] and Fourier-Mellin transform [29]. Fourier
LDA approach was proposed to select appropriate frequency bands for image
representation by using a two-dimensional separability judgment.
Fourier-Mellin transform (FMT) is a mathematical feature extraction tool
which is used in some pattern recognition applications [45, 29]. The FMT is gen-
erally implemented by performing a log-polar mapping followed by the Fourier
transform (FT) [29]. The main idea behind this approach is to represent rota-
tion and scaling as translations along some axes and to take advantage of the
translation invariance property of the Fourier transform.
2.6 Experimental Results
In the extraction of the cepstral features, different non-uniform grids1 are used.
Due to these different non-uniform grids, M ×M 2D mel- and Mellin-cepstrum
1 See APPENDIX A
24
features are generated in different dimensions (M=49, 39, 35, 29). These cepstral
features are applied to CMA and SVM classifiers to obtain the non-uniform grid
providing the best recognition results. The non-uniform grid and corresponding
cepstral features giving the highest recognition rate are used in the comparison
with actual image matrices, 2D PCA based features, 2D PCA of illumination
compensated images, Fourier LDA and Fourier-Mellin transform based features.
The cepstral features giving the best performance are stated with bold characters
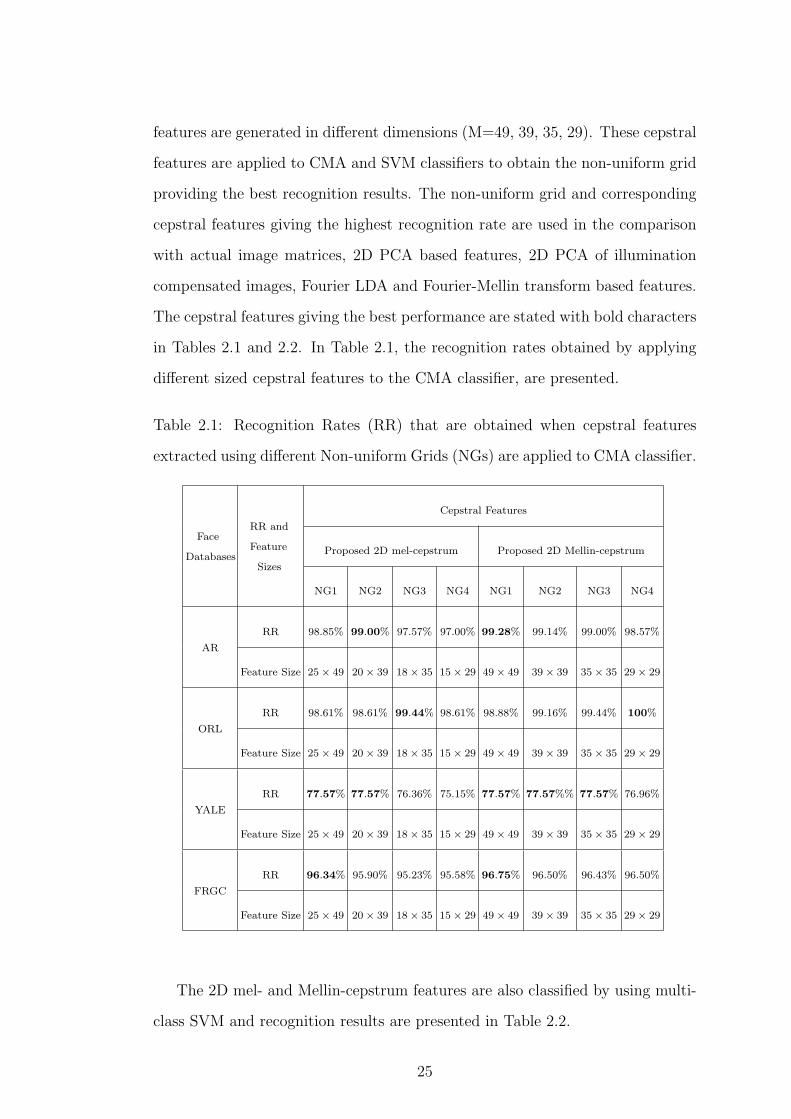
in Tables 2.1 and 2.2. In Table 2.1, the recognition rates obtained by applying
different sized cepstral features to the CMA classifier, are presented.
Table 2.1: Recognition Rates (RR) that are obtained when cepstral features
extracted using different Non-uniform Grids (NGs) are applied to CMA classifier.
Face
Databases
RR and
Feature
Sizes
Cepstral Features
Proposed 2D mel-cepstrum Proposed 2D Mellin-cepstrum
NG1 NG2 NG3 NG4 NG1 NG2 NG3 NG4
AR
RR 98.85% 99.00% 97.57% 97.00% 99.28% 99.14% 99.00% 98.57%
Feature Size 25× 49 20× 39 18× 35 15× 29 49× 49 39× 39 35× 35 29× 29
ORL
RR 98.61% 98.61% 99.44% 98.61% 98.88% 99.16% 99.44% 100%
Feature Size 25× 49 20× 39 18× 35 15× 29 49× 49 39× 39 35× 35 29× 29
YALE
RR 77.57% 77.57% 76.36% 75.15% 77.57% 77.57%% 77.57% 76.96%
Feature Size 25× 49 20× 39 18× 35 15× 29 49× 49 39× 39 35× 35 29× 29
FRGC
RR 96.34% 95.90% 95.23% 95.58% 96.75% 96.50% 96.43% 96.50%
Feature Size 25× 49 20× 39 18× 35 15× 29 49× 49 39× 39 35× 35 29× 29
The 2D mel- and Mellin-cepstrum features are also classified by using multi-
class SVM and recognition results are presented in Table 2.2.
25
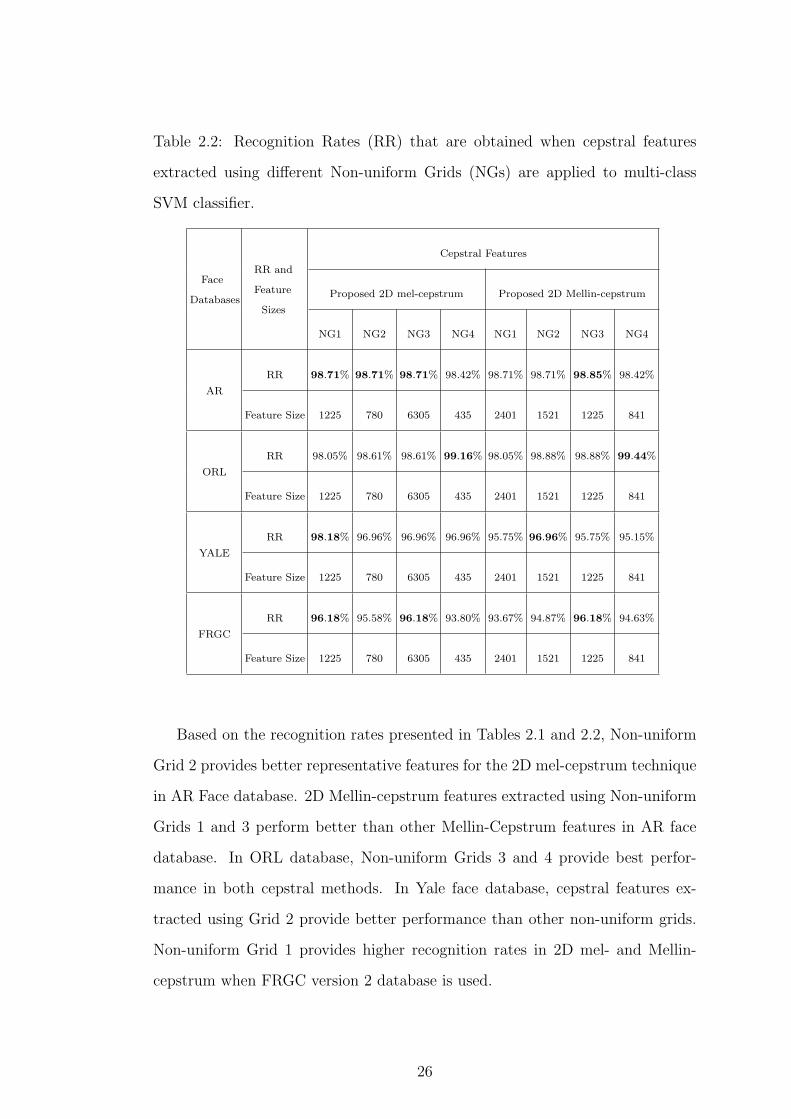
Table 2.2: Recognition Rates (RR) that are obtained when cepstral features
extracted using different Non-uniform Grids (NGs) are applied to multi-class
SVM classifier.
Face
Databases
RR and
Feature
Sizes
Cepstral Features
Proposed 2D mel-cepstrum Proposed 2D Mellin-cepstrum
NG1 NG2 NG3 NG4 NG1 NG2 NG3 NG4
AR
RR 98.71% 98.71% 98.71% 98.42% 98.71% 98.71% 98.85% 98.42%
Feature Size 1225 780 6305 435 2401 1521 1225 841
ORL
RR 98.05% 98.61% 98.61% 99.16% 98.05% 98.88% 98.88% 99.44%
Feature Size 1225 780 6305 435 2401 1521 1225 841
YALE
RR 98.18% 96.96% 96.96% 96.96% 95.75% 96.96% 95.75% 95.15%
Feature Size 1225 780 6305 435 2401 1521 1225 841
FRGC
RR 96.18% 95.58% 96.18% 93.80% 93.67% 94.87% 96.18% 94.63%
Feature Size 1225 780 6305 435 2401 1521 1225 841
Based on the recognition rates presented in Tables 2.1 and 2.2, Non-uniform
Grid 2 provides better representative features for the 2D mel-cepstrum technique
in AR Face database. 2D Mellin-cepstrum features extracted using Non-uniform
Grids 1 and 3 perform better than other Mellin-Cepstrum features in AR face
database. In ORL database, Non-uniform Grids 3 and 4 provide best perfor-
mance in both cepstral methods. In Yale face database, cepstral features ex-
tracted using Grid 2 provide better performance than other non-uniform grids.
Non-uniform Grid 1 provides higher recognition rates in 2D mel- and Mellin-
cepstrum when FRGC version 2 database is used.
26
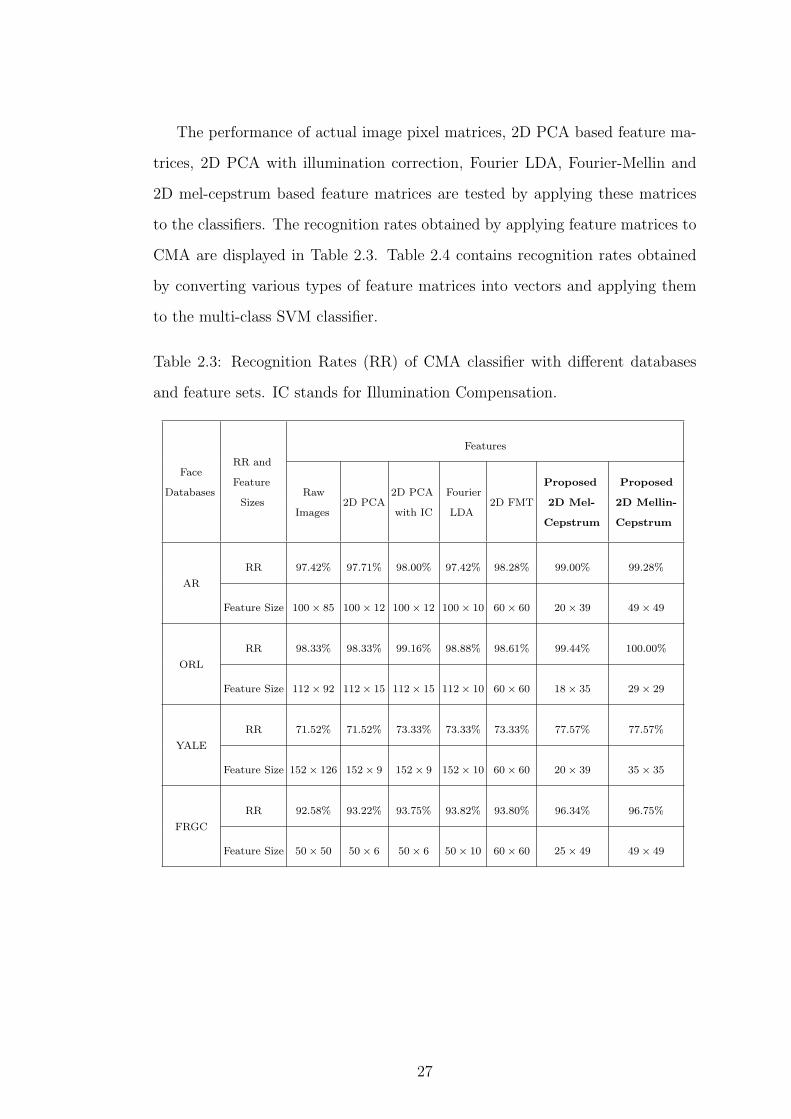
The performance of actual image pixel matrices, 2D PCA based feature ma-
trices, 2D PCA with illumination correction, Fourier LDA, Fourier-Mellin and
2D mel-cepstrum based feature matrices are tested by applying these matrices
to the classifiers. The recognition rates obtained by applying feature matrices to
CMA are displayed in Table 2.3. Table 2.4 contains recognition rates obtained
by converting various types of feature matrices into vectors and applying them
to the multi-class SVM classifier.
Table 2.3: Recognition Rates (RR) of CMA classifier with different databases
and feature sets. IC stands for Illumination Compensation.
Face
Databases
RR and
Feature
Sizes
Features
Raw
Images2D PCA
2D PCA
with IC
Fourier
LDA2D FMT
Proposed
2D Mel-
Cepstrum
Proposed
2D Mellin-
Cepstrum
AR
RR 97.42% 97.71% 98.00% 97.42% 98.28% 99.00% 99.28%
Feature Size 100× 85 100× 12 100× 12 100× 10 60× 60 20× 39 49× 49
ORL
RR 98.33% 98.33% 99.16% 98.88% 98.61% 99.44% 100.00%
Feature Size 112× 92 112× 15 112× 15 112× 10 60× 60 18× 35 29× 29
YALE
RR 71.52% 71.52% 73.33% 73.33% 73.33% 77.57% 77.57%
Feature Size 152× 126 152× 9 152× 9 152× 10 60× 60 20× 39 35× 35
FRGC
RR 92.58% 93.22% 93.75% 93.82% 93.80% 96.34% 96.75%
Feature Size 50× 50 50× 6 50× 6 50× 10 60× 60 25× 49 49× 49
27
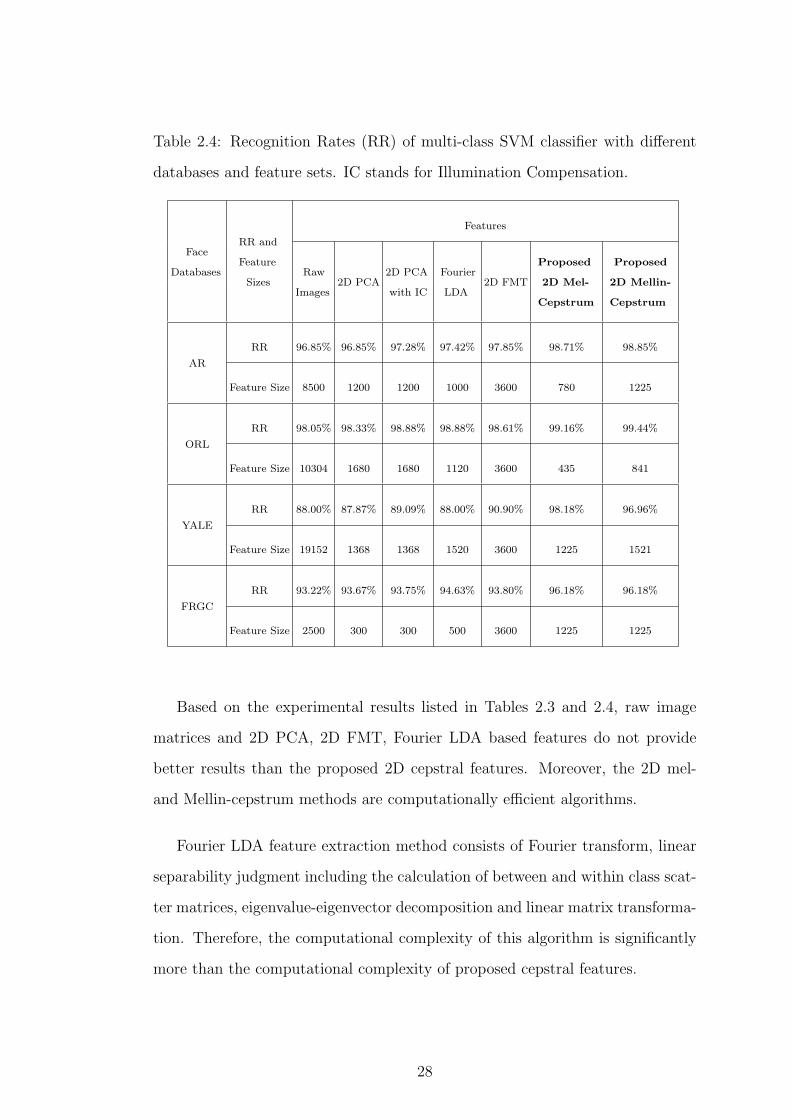
Table 2.4: Recognition Rates (RR) of multi-class SVM classifier with different
databases and feature sets. IC stands for Illumination Compensation.
Face
Databases
RR and
Feature
Sizes
Features
Raw
Images2D PCA
2D PCA
with IC
Fourier
LDA2D FMT
Proposed
2D Mel-
Cepstrum
Proposed
2D Mellin-
Cepstrum
AR
RR 96.85% 96.85% 97.28% 97.42% 97.85% 98.71% 98.85%
Feature Size 8500 1200 1200 1000 3600 780 1225
ORL
RR 98.05% 98.33% 98.88% 98.88% 98.61% 99.16% 99.44%
Feature Size 10304 1680 1680 1120 3600 435 841
YALE
RR 88.00% 87.87% 89.09% 88.00% 90.90% 98.18% 96.96%
Feature Size 19152 1368 1368 1520 3600 1225 1521
FRGC
RR 93.22% 93.67% 93.75% 94.63% 93.80% 96.18% 96.18%
Feature Size 2500 300 300 500 3600 1225 1225
Based on the experimental results listed in Tables 2.3 and 2.4, raw image
matrices and 2D PCA, 2D FMT, Fourier LDA based features do not provide
better results than the proposed 2D cepstral features. Moreover, the 2D mel-
and Mellin-cepstrum methods are computationally efficient algorithms.
Fourier LDA feature extraction method consists of Fourier transform, linear
separability judgment including the calculation of between and within class scat-
ter matrices, eigenvalue-eigenvector decomposition and linear matrix transforma-
tion. Therefore, the computational complexity of this algorithm is significantly
more than the computational complexity of proposed cepstral features.
28

The cost of computing a 2D mel-cepstrum sequence for an N × N image
is O(N2log(N) + M2log(M)) and an additional M2/2 logarithm computations
which can be implemented using a look-up table.
Recall that, K denotes the number of poses for each person in a database.
The computational cost of 2D PCA for a P × Q image (N > (P,Q) > M) is
(P 2Q)K+P 3+SP 2 where S denotes the number of eigenvectors that correspond
to largest eigenvalues in order to construct linear transformation matrix. It can
be observed from the computations that the cost of 2DPCA is clearly much more
than 2D mel-cepstral features.
Another advantage of 2D cepstral features is their invariance to illumina-
tion variations. Even 2DPCA of illumination compensated (LogAbout method)
images cannot perform better than the proposed 2D cepstral features in image
representation and elimination of illumination changes.
In the literature, Liao et. al proposed a technique based on salient region
extraction and gradient orientation [52]. It is reported that a face verification
rate of 97.63% is obtained when “Experiment 1” image set of FRGC version 2
database is used [52]. This recognition rate is comparable to the recognition
rates obtained in this thesis, but it is achieved at the expense of very high com-
putational cost.
2.7 Summary
In this section, 2D cepstral feature extraction algorithms are proposed and used
in facial feature extraction. The proposed cepstral features are compared with
standard baseline feature extraction methods (2D PCA, Fourier LDA, Fourier-
Mellin Transform) by classifying these features using CMA and multi-class SVM.
29

Experimental results point out that, 2D cepstral features outperform other clas-
sical features both in recognition rate and computational complexity.
2D mel- and Mellin-cepstral features provide illumination invariant features
due to logarithm operator in their calculations. Also, they are independent of
translational shifts since these features are Fourier transform based features.
Moreover, 2D mel-cepstrum features have symmetry property with respect to
y[n1, n2] = y[−n1,−n2]. In addition to these, 2D Mellin-cepstrum method takes
the advantage of Mellin Transform and provides rotational invariant features.
The work presented in this chapter is published in [53, 54, 55].
30
Chapter 3
Feature Extraction from SAR
Images using Cepstral Methods
In this chapter, 2D mel- and Mellin-cepstrum are used for feature extraction from
SAR images for target detection. The extracted features are classified by using
an SVM classifier described.
In the literature, many SAR Automatic Target Recognition (ATR) algorithms
have been developed [56, 57, 58, 59]. A general ATR system consists of five stages
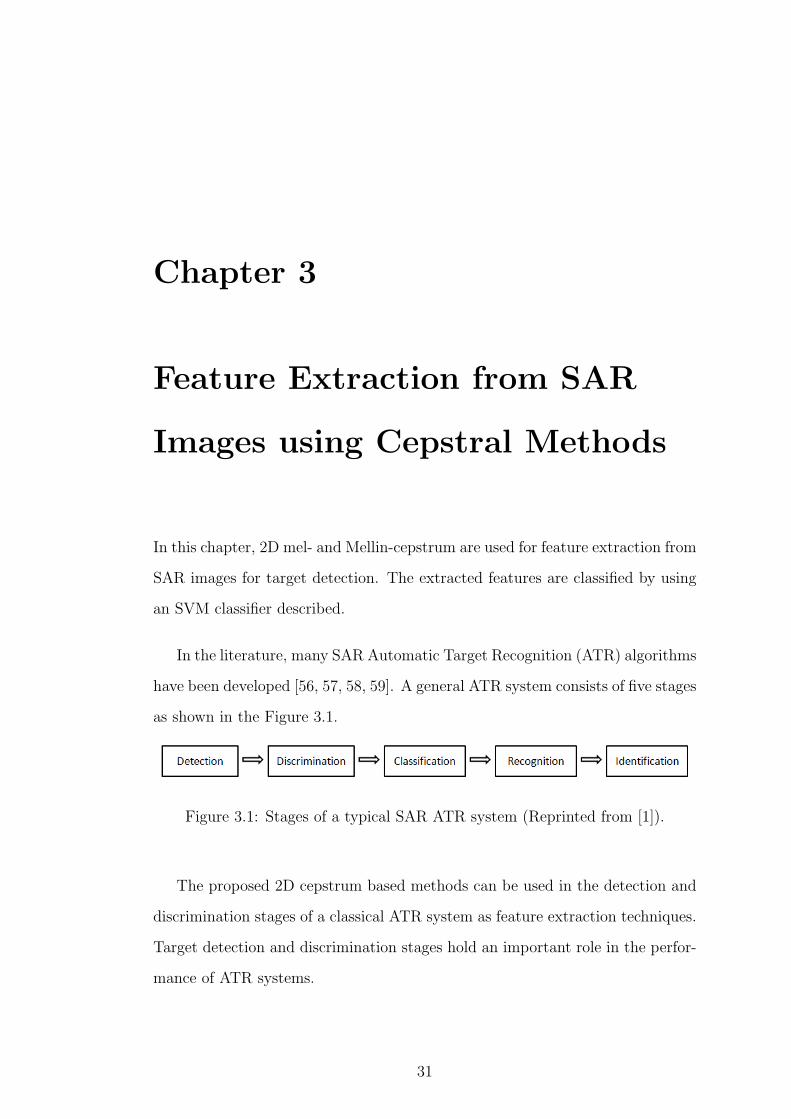
as shown in the Figure 3.1.
Figure 3.1: Stages of a typical SAR ATR system (Reprinted from [1]).
The proposed 2D cepstrum based methods can be used in the detection and
discrimination stages of a classical ATR system as feature extraction techniques.
Target detection and discrimination stages hold an important role in the perfor-
mance of ATR systems.
31
SAR images used in this chapter are obtained from MSTAR (Moving and
Stationary Target Recognition) database which is the only publicly available
SAR image database. The images obtained from MSTAR database are divided
into training and test subsets. The system matches the test feature to target
or clutter by using SVM classifier with RBF kernel. The simulation results of
cepstral features are compared with a regional covariance and codifference based
methods that are used in target detection problem [1].
The proposed cepstral feature extraction methods provide illumination, trans-
lation and rotation invariant features. Due to these properties cepstral features
can be used in various applications including target detection. Promising tar-
get detection accuracies and false alarm rates are obtained using the proposed
cepstral features in experimental simulations. The experimental simulations are
carried out in MATLAB� R2009b computational environment.
The following sections of this chapter are organized as follows. In Section 3.1,
related works on SAR image feature extraction are presented. The cepstral fea-
ture extraction algorithms defined in Sections 2.2 and 2.3 are revisited in Sec-
tion 3.2. The MSTAR SAR image database and its contents are briefly explained
in Section 3.3. Target detection strategy and the classifier used in detection task
are described in Section 3.4. Finally, experimental results are presented at the
end of this chapter.
3.1 Related Work on SAR Image Feature Ex-
traction
SAR image feature extraction is the most important part of the target detection
and discrimination stages of a classical ATR system due to its importance in
increasing the ATR system’s performance.
32
Many feature extraction algorithms have been developed in order to extract
features from SAR images [60, 61, 62, 63]. Qiu et al. compare the performance
of PCA and 2D-PCA in target classification in SAR images [61]. Lu et al. pro-
pose a mixed PCA/ICA method that forms a mixed subspace in order to extract
features from SAR images [64]. The proposed mixed method achieves slightly
better recognition results compared to the results obtained by PCA and ICA.
Sun et al. extract linear features by modifying ROA (Ratio-Of-Averages) al-
gorithm with improved Hough transform [65]. The modified ROA algorithm
detects majority of the linear features successfully and eliminates the noise and
fake edges. Fu and Lv propose invariant moment based SAR image feature ex-
traction technique [15]. The wavelet transform and fractal features are combined
in order to be used in target detection in SAR images [66, 67]. Yuan et al. inves-
tigate the multiresolution framework for target detection in wavelet domain [68].
Matzner et al. propose a feature extraction scheme for SAR images in frequency
domain [69]. Amein et al. develop a new version of the Chirp Scaling Algo-
rithm (CSA) using fractional Fourier transform [70]. Fourier-Mellin invariant
(FMI) descriptor, a Fourier transform based method, is also used in SAR image
registration [71]. Due to the rotation and translation invariance properties of
Fourier-Mellin transform, the FMI descriptors produce more exact and precise
registration than classical techniques.
3.2 SAR Image Feature Extraction Using Cep-
stral Methods
In this chapter, feature extraction from SAR images is performed by using pro-
posed 2D mel- and Mellin-cepstrum methods described in Sections 2.2 and 2.3.
The extracted feature matrices are converted into vectors and applied to the
SVM classifier.
33
The 2D mel-cepstrum based features are illumination invariant due to the
logarithm term in their computation. They are also symmetric features because
of the IDFT. Since the 2D mel-cepstrum is Fourier Transform based method, it
is also independent of translational shifts.
The 2D Mellin-cepstrum based features are also invariant to illumination and
translation. In addition, these features are rotational invariant due to the log-
polar conversion in their calculation. Rotation invariant 2D Mellin-cepstrum
method can be successfully used in the feature extraction from SAR images,
since SAR images include significant rotational differences.
3.3 SAR Image Database
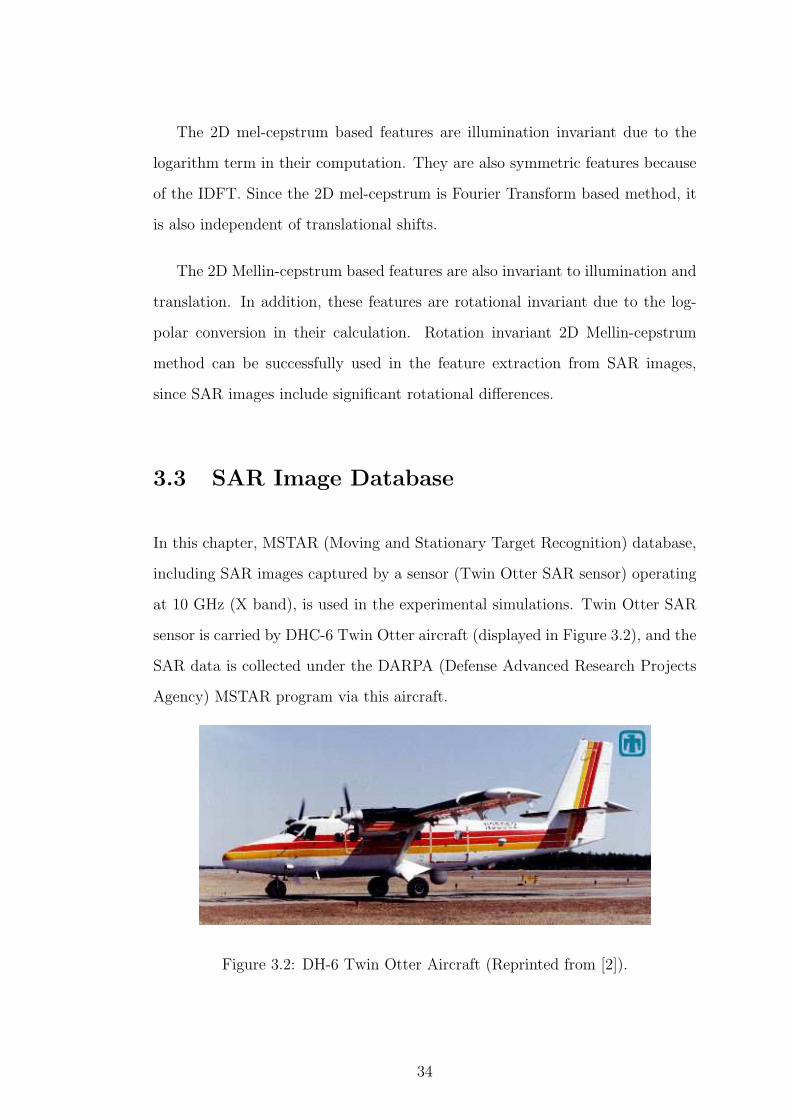
In this chapter, MSTAR (Moving and Stationary Target Recognition) database,
including SAR images captured by a sensor (Twin Otter SAR sensor) operating
at 10 GHz (X band), is used in the experimental simulations. Twin Otter SAR
sensor is carried by DHC-6 Twin Otter aircraft (displayed in Figure 3.2), and the
SAR data is collected under the DARPA (Defense Advanced Research Projects
Agency) MSTAR program via this aircraft.
Figure 3.2: DH-6 Twin Otter Aircraft (Reprinted from [2]).
34
The images have 0.3m x 0.3m resolution. All SAR images are acquired at
angle of depressions of 15◦ and 17◦. Besides, target images are available in all
orientations in the database, i.e., the shots are made over 360◦ target aspect. In
this thesis, all images are treated in an equal manner and all target and clutter
images are divided into training and test datasets.
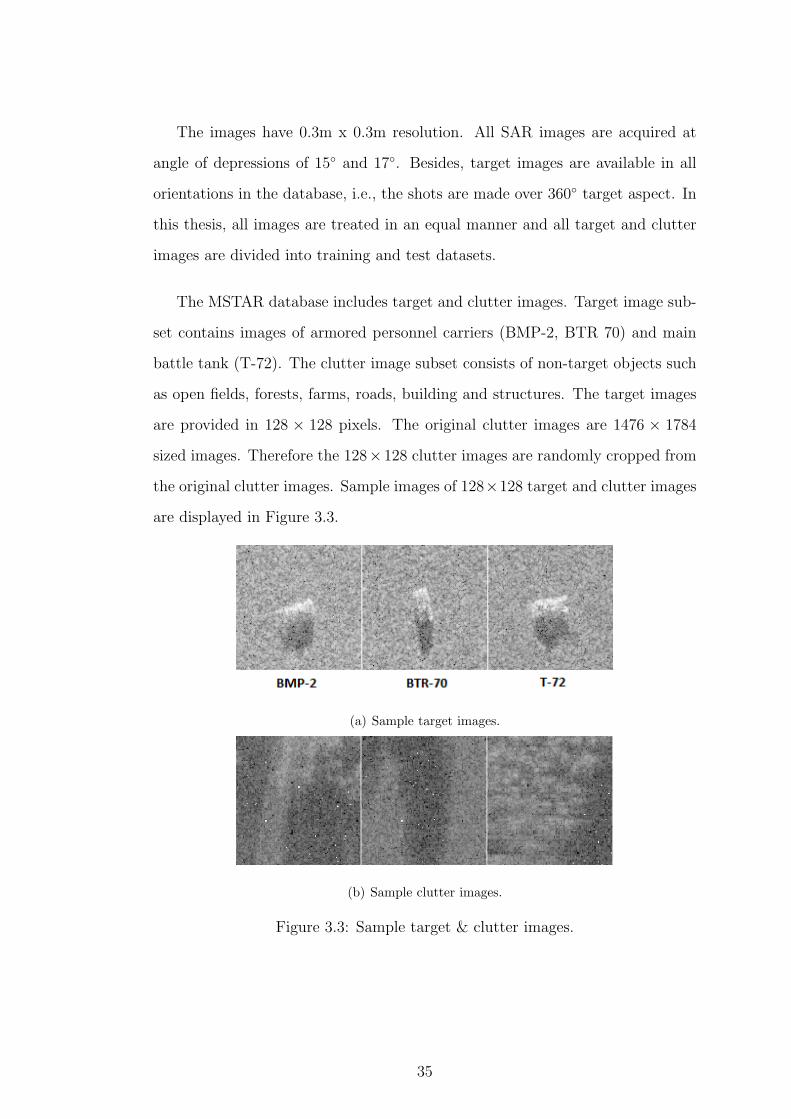
The MSTAR database includes target and clutter images. Target image sub-
set contains images of armored personnel carriers (BMP-2, BTR 70) and main
battle tank (T-72). The clutter image subset consists of non-target objects such
as open fields, forests, farms, roads, building and structures. The target images
are provided in 128 × 128 pixels. The original clutter images are 1476 × 1784
sized images. Therefore the 128×128 clutter images are randomly cropped from
the original clutter images. Sample images of 128×128 target and clutter images
are displayed in Figure 3.3.
(a) Sample target images.
(b) Sample clutter images.
Figure 3.3: Sample target & clutter images.
35
3.4 Target Detection Strategy
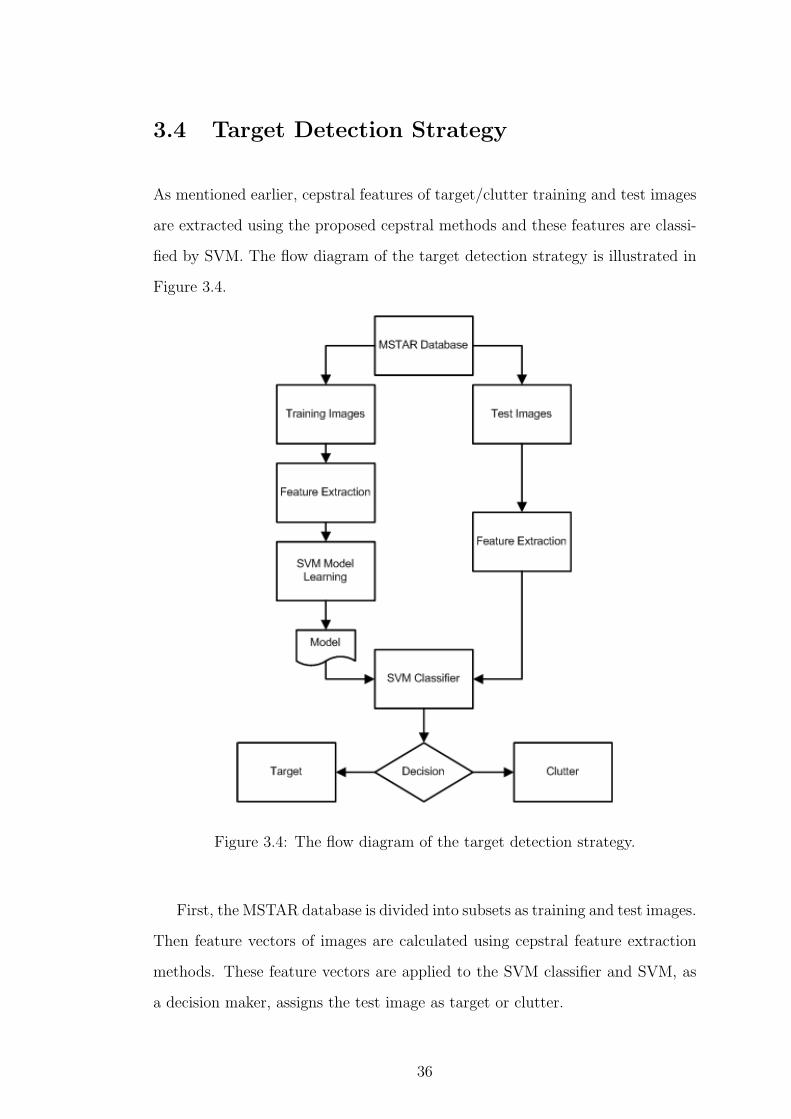
As mentioned earlier, cepstral features of target/clutter training and test images
are extracted using the proposed cepstral methods and these features are classi-
fied by SVM. The flow diagram of the target detection strategy is illustrated in
Figure 3.4.
Figure 3.4: The flow diagram of the target detection strategy.
First, the MSTAR database is divided into subsets as training and test images.
Then feature vectors of images are calculated using cepstral feature extraction
methods. These feature vectors are applied to the SVM classifier and SVM, as
a decision maker, assigns the test image as target or clutter.
36
As mentioned in Section 2.2, 2D mel-cepstrum features matrices have sym-
metry property. Therefore, there is no need to use the entire 2D mel-cepstrum
feature matrix. Instead, one half of the feature matrix is used.
3.4.1 Classifier
In the experimental work of this chapter, SVM classifier described in Section 2.5.1
is used. The SVM parameters are selected after a cross validation process. The
cepstral features are also applied to SVM with a polynomial kernel, but poly-
nomial kernel performs inferior to RBF kernel. False alarm rate of the system
significantly increases if SVM with polynomial kernel is used. Therefore, the
simulation results belonging to polynomial kernel is not included in Section 3.5.
The MSTAR database is divided into two main sub-categories as training and
test. SAR images belonging to training set are used in order to train the SVM
and extract the SVM model. Once the SVM model is obtained, there is no need
to re-train the SVM unless new training images are added to the training subset.
The SVM model is the decision mechanism which decides whether the test image
is target or clutter.
3.5 Experimental Results
MSTAR SAR image database is used in experimental studies and image feature
extraction is carried out using the proposed cepstral methods. The features
extracted from the cepstral methods are converted into vectors and applied to
the SVM with RBF kernel. Simulations are repeated with SVM with Polynomial
kernel but the false alarm rate dramatically increases. Therefore, the results
obtained using SVM with polynomial kernel are not presented in this section.
37
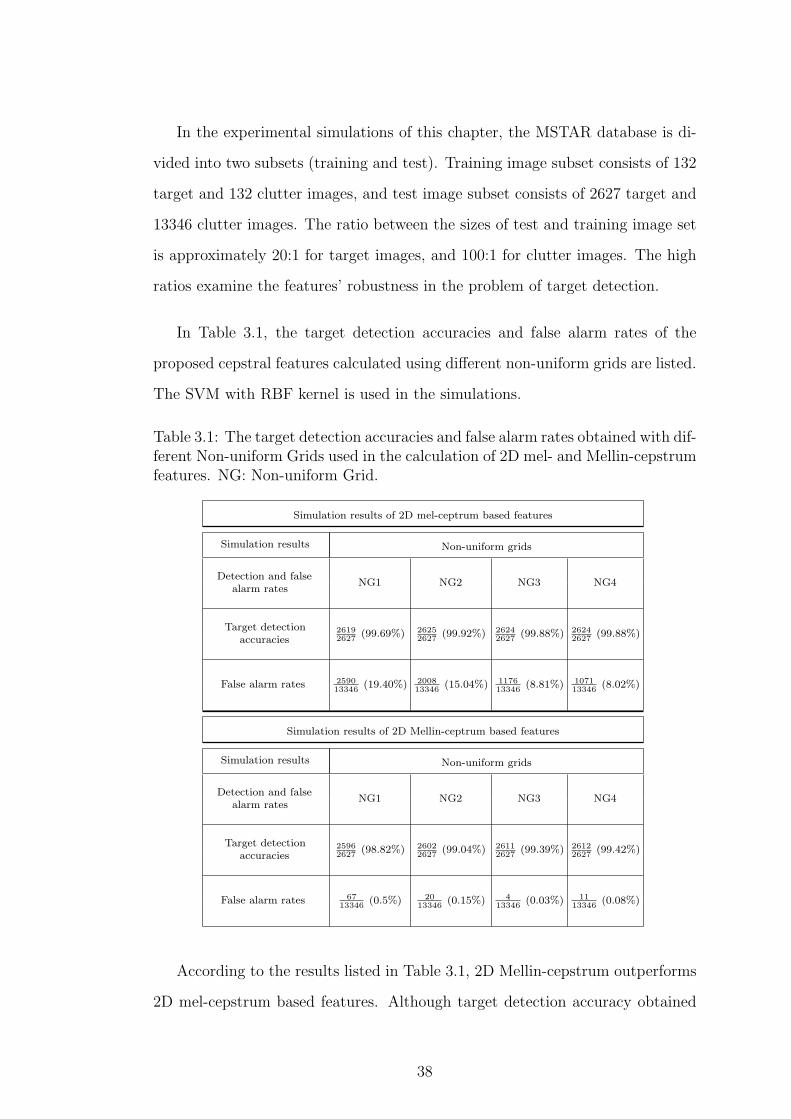
In the experimental simulations of this chapter, the MSTAR database is di-
vided into two subsets (training and test). Training image subset consists of 132
target and 132 clutter images, and test image subset consists of 2627 target and
13346 clutter images. The ratio between the sizes of test and training image set
is approximately 20:1 for target images, and 100:1 for clutter images. The high
ratios examine the features’ robustness in the problem of target detection.
In Table 3.1, the target detection accuracies and false alarm rates of the
proposed cepstral features calculated using different non-uniform grids are listed.
The SVM with RBF kernel is used in the simulations.
Table 3.1: The target detection accuracies and false alarm rates obtained with dif-ferent Non-uniform Grids used in the calculation of 2D mel- and Mellin-cepstrumfeatures. NG: Non-uniform Grid.
Simulation results of 2D mel-ceptrum based features
Simulation results Non-uniform grids
Detection and falsealarm rates
NG1 NG2 NG3 NG4
Target detectionaccuracies
26192627
(99.69%) 26252627
(99.92%) 26242627
(99.88%) 26242627
(99.88%)
False alarm rates 259013346
(19.40%) 200813346
(15.04%) 117613346
(8.81%) 107113346
(8.02%)
Simulation results of 2D Mellin-ceptrum based features
Simulation results Non-uniform grids
Detection and falsealarm rates
NG1 NG2 NG3 NG4
Target detectionaccuracies
25962627
(98.82%) 26022627
(99.04%) 26112627
(99.39%) 26122627
(99.42%)
False alarm rates 6713346
(0.5%) 2013346
(0.15%) 413346
(0.03%) 1113346
(0.08%)
According to the results listed in Table 3.1, 2D Mellin-cepstrum outperforms
2D mel-cepstrum based features. Although target detection accuracy obtained
38

using 2D mel-cepstrum is slightly higher than the detection accuracy obtained
using 2D Mellin-cepstrum, mel-cepstrum method has far too many false alarms.
Since MSTAR database includes SAR images having rotational variations,
2D mel-cepstrum features cannot cope with these rotational changes and this
causes too many false alarms. 2D Mellin-cepstrum features, including log-polar
conversion in their calculation, can cope with such rotational changes. Therefore
2D Mellin-cepstrum method can be used in target recognition tasks.
The detection results of cepstral features are compared with region covariance
and codifference matrix based methods presented in [1]. The results obtained
using region covariance matrix, codifference matrix and SVM classifier are given
in Table 3.2.
Table 3.2: The target detection accuracies and false alarm rates obtained using
region covariance and region codifference methods with SVM classifier. The
results are adopted from [1].
Simulation results of Region Covariance and Codifference based features
Simulation results Region Covariance Method Region Codifference Method
Target detection
accuracies
26172627
(99.62%) 26262627
(99.96%)
False alarm rates 613346
(0.05%) 113346
(0.007%)
Based on the simulation results presented above, 2D Mellin-cepstral features
can be used in feature extraction from SAR images for target detection. Al-
though covariance based methods are quite successful in these tasks, an alter-
native solution to SAR image feature extraction is provided by using cepstral
39
methods. Moreover, proposed cepstral features can cope with large illumination
changes due to the logarithm operator in their structures. Therefore, the pro-
posed cepstral features may outperform covariance based methods, if the SAR
image dataset includes large illumination variations.
3.6 Summary
In this chapter, the proposed 2D mel- and Mellin-cepstrum methods are used
in the feature extraction from SAR images for target detection task. The fea-
ture matrices obtained from these techniques are converted into feature vectors
and applied to the well-known SVM classification engine. The SVM used in
experimental simulations has RBF kernel and its parameters are set using a
cross-validation process.
MSTAR database, the only publicly available dataset, is used in the experi-
mental studies. The SAR data in MSTAR database is divided into two subsets
as training and test. Training subset is used in the learning of SVM model and
the test images are assigned to the target or clutter classes by using this trained
model.
Experimental results indicate that, proposed 2D Mellin cepstrum feature ex-
traction algorithms can also be used in target detection using SAR images. The
2D Mellin-cepstrum feature extraction technique provides illumination, transla-
tion and rotation invariant features. Due to these merits, it eliminates amplitude
and rotational variations in SAR images. Therefore 2D Mellin-cepstrum feature
extraction method can be used in such target detection tasks. Since 2D mel-
cepstrum cannot cope with rotational variations in a dataset, it produces too
many false alarms and is not appropriate for feature extraction from SAR im-
ages.
40

Chapter 4
Conclusion
In this thesis, cepstral feature extraction techniques are proposed and these tech-
niques are used to extract features from images in face recognition and target
detection tasks in SAR images.
Cepstral methods include non-uniform grid and weighting operations in the
Fourier domain. The non-uniform grids consist of bins that are larger in high fre-
quencies compared to low frequencies. In the calculation of the cepstral features,
energy of each bin is calculated. In this way, the coefficients in each bin are com-
bined to represent each bin with a single value. That is how the dimensionality
reduction is achieved.
The proposed feature extraction techniques are based on Fourier transform.
Therefore, the features extracted using these techniques are independent of trans-
lational shifts. The cepstral methods also include the logarithm operator in their
calculations. Due to the fundamental properties of the logarithm operator, the
features extracted using the cepstral methods are invariant to amplitude (gray-
scale) changes. In addition, 2D mel-cepstrum method generates symmetric fea-
tures. Therefore, only half of these feature matrices are sufficient to represent an
image. The symmetric structure of the 2D mel-cepstrum based features enables
41

further dimensionality reduction. Different from the 2D mel-cepstrum method,
the 2D Mellin-cepstrum feature extraction technique contains log-polar conver-
sion process. The log-polar conversion process introduces rotational invariance
to the feature extraction scheme. Thus, the features extracted using 2D Mellin-
cepstrum are rotation invariant.
In the thesis, the cepstral methods are first used in the feature extraction
of facial images for face recognition. The features extracted using the proposed
techniques are classified by CMA and multi-class SVM. The experimental simu-
lations are carried out using AR, ORL, Yale and FRGC version 2 face databases.
In the experiments, a cross validation algorithm, “leave-one-out” procedure, is
performed to obtain robust results. The recognition rates obtained using the
proposed cepstral techniques are compared with the rates obtained using well-
known standard baseline methods such as PCA, Fourier LDA and FMT. The
simulation results show that, the proposed feature extraction techniques out-
perform these standard baselines. A second experiment is carried out in order
to test the performance of the cepstral features in illumination invariance. In
this experiment, the performances of the cepstral techniques are compared with
illumination compensation process followed by PCA. The illumination compen-
sation is performed by implementing LogAbout method [27] as a preprocessing
stage before PCA. Experimental results show that, the recognition rates obtained
using cepstral methods are still higher than the rates obtained using PCA with
illumination compensation. The illumination invariance of the cepstral features
are observed with this experiment.
The proposed cepstral feature extraction methods are also used in target
detection task in SAR images. The feature matrices extracted from the cep-
stral techniques are converted into vectors and applied to the SVM classifier.
In the experimental simulations, MSTAR SAR image database is used. The
42

SAR images in MSTAR database contain rotational variations. Since 2D mel-
cepstrum features are not rotation invariant features, the system using the 2D
mel-cepstrum technique produces too many false alarms. The problem is solved
using 2D Mellin-cepstrum technique in SAR image feature extraction. The 2D
Mellin-cepstrum method eliminates rotational variations and produces satisfac-
tory results. Experimental results point out that the cepstral feature extraction
techniques can also be used in SAR image feature extraction. Although region
covariance based techniques [1] are quite successful in SAR image feature extrac-
tion, an alternative solution to this problem is provided.
In this thesis, 2D cepstrum based feature extraction techniques are proposed
for facial and SAR image feature extraction. Experimental results indicate that
the cepstral features may be used in various feature extraction problem including
face recognition and target detection.
43
APPENDIX A
Non-uniform grids used in
Cepstral Computations
The 2D DFT of the image is rearranged (fftshift) to have low-frequency compo-
nents at center and inner bins of the non-uniform grid. High-frequency coeffi-
cients are located at the outer part of the DFT matrix. As can be observed from
the Figures A.1, A.2, A.3 and A.4, cell sizes are smaller at low frequencies com-
pared to high frequencies. In the following figures, the center of each non-uniform
grid represents zero frequency and each line is located at a certain distance to
the zero frequency. The locations of these lines are given as real numbers in each
figure.
44
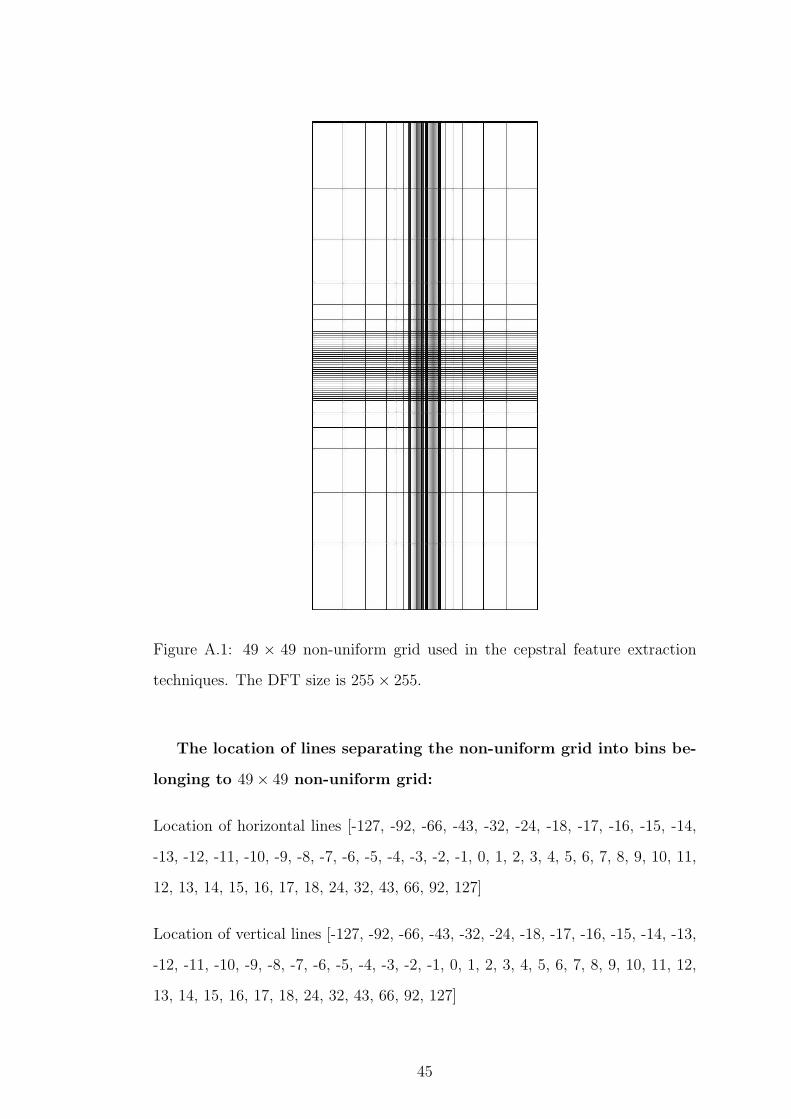
Figure A.1: 49 × 49 non-uniform grid used in the cepstral feature extraction
techniques. The DFT size is 255× 255.
The location of lines separating the non-uniform grid into bins be-
longing to 49× 49 non-uniform grid:
Location of horizontal lines [-127, -92, -66, -43, -32, -24, -18, -17, -16, -15, -14,
-13, -12, -11, -10, -9, -8, -7, -6, -5, -4, -3, -2, -1, 0, 1, 2, 3, 4, 5, 6, 7, 8, 9, 10, 11,
12, 13, 14, 15, 16, 17, 18, 24, 32, 43, 66, 92, 127]
Location of vertical lines [-127, -92, -66, -43, -32, -24, -18, -17, -16, -15, -14, -13,
-12, -11, -10, -9, -8, -7, -6, -5, -4, -3, -2, -1, 0, 1, 2, 3, 4, 5, 6, 7, 8, 9, 10, 11, 12,
13, 14, 15, 16, 17, 18, 24, 32, 43, 66, 92, 127]
45
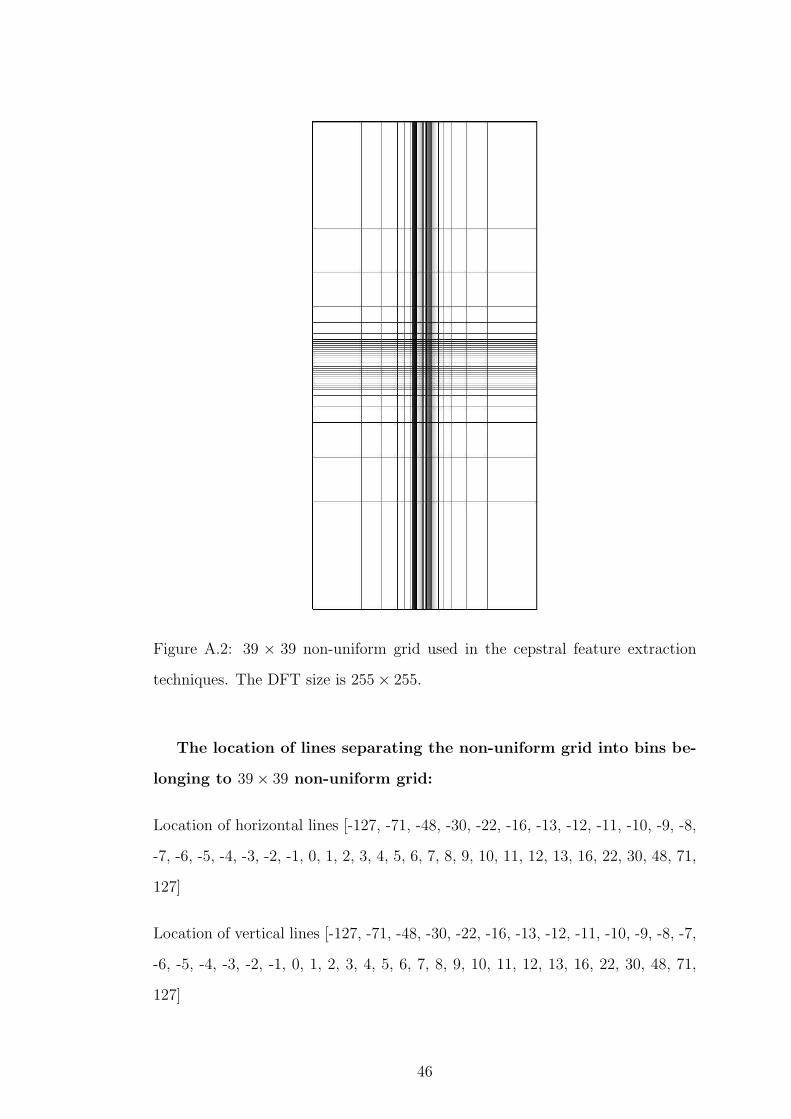
Figure A.2: 39 × 39 non-uniform grid used in the cepstral feature extraction
techniques. The DFT size is 255× 255.
The location of lines separating the non-uniform grid into bins be-
longing to 39× 39 non-uniform grid:
Location of horizontal lines [-127, -71, -48, -30, -22, -16, -13, -12, -11, -10, -9, -8,
-7, -6, -5, -4, -3, -2, -1, 0, 1, 2, 3, 4, 5, 6, 7, 8, 9, 10, 11, 12, 13, 16, 22, 30, 48, 71,
127]
Location of vertical lines [-127, -71, -48, -30, -22, -16, -13, -12, -11, -10, -9, -8, -7,
-6, -5, -4, -3, -2, -1, 0, 1, 2, 3, 4, 5, 6, 7, 8, 9, 10, 11, 12, 13, 16, 22, 30, 48, 71,
127]
46
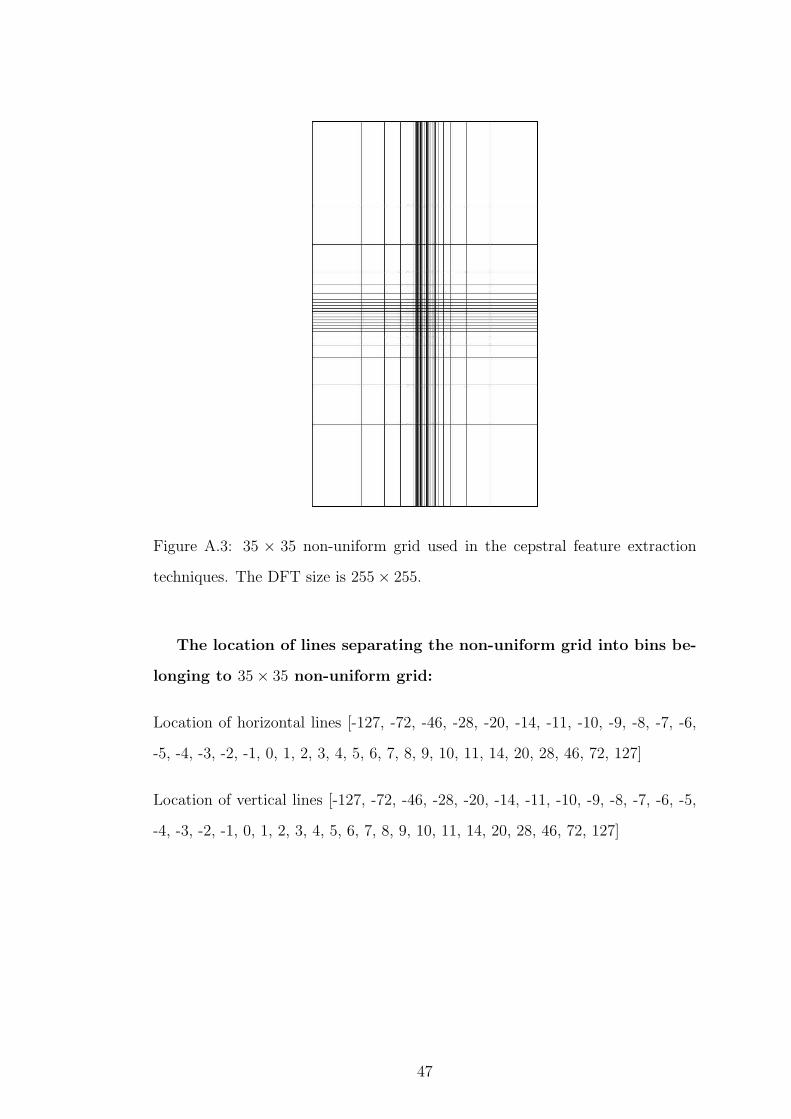
Figure A.3: 35 × 35 non-uniform grid used in the cepstral feature extraction
techniques. The DFT size is 255× 255.
The location of lines separating the non-uniform grid into bins be-
longing to 35× 35 non-uniform grid:
Location of horizontal lines [-127, -72, -46, -28, -20, -14, -11, -10, -9, -8, -7, -6,
-5, -4, -3, -2, -1, 0, 1, 2, 3, 4, 5, 6, 7, 8, 9, 10, 11, 14, 20, 28, 46, 72, 127]
Location of vertical lines [-127, -72, -46, -28, -20, -14, -11, -10, -9, -8, -7, -6, -5,
-4, -3, -2, -1, 0, 1, 2, 3, 4, 5, 6, 7, 8, 9, 10, 11, 14, 20, 28, 46, 72, 127]
47

Figure A.4: 29 × 29 non-uniform grid used in the cepstral feature extraction
techniques. The DFT size is 255× 255.
The location of lines separating the non-uniform grid into bins be-
longing to 29× 29 non-uniform grid:
Location of horizontal lines [-127, -82, -53, -30, -19, -11, -8, -7, -6, -5, -4, -3, -2,
-1, 0, 1, 2, 3, 4, 5, 6, 7, 8, 11, 19, 30, 53, 82, 127]
Location of vertical lines [-127, -82, -53, -30, -19, -11, -8, -7, -6, -5, -4, -3, -2, -1,
0, 1, 2, 3, 4, 5, 6, 7, 8, 11, 19, 30, 53, 82, 127]
48
Bibliography
[1] K. Duman, “Methods for target detection in SAR images.,” Master’s thesis,
Bilkent University, Department of Electrical and Electronics Engineering,
Ankara, Turkey, 2009.
[2] Sandia National Laboratories, “Synthetic Aperture Radar Homepage.”
http://www.sandia.gov/radar/imageryx.html.
[3] “(MUSCLE: Multimedia Understanding Through Semantics, Computation
and Learning, European Commission Seventh Framework Program with EU
Grant:507752 .”
[4] M. Nixon and A. S. Aguado, Feature Extraction & Image Processing. Aca-
demic Press, 2 ed., January 2008.
[5] H. Liu and H. Motoda, Feature Extraction, Construction and Selection: A
Data Mining Perspective. Norwell, MA, USA: Kluwer Academic Publishers,
1998.
[6] T. Mei, X.-S. Hua, W. Lai, L. Yang, Z.-J. Zha, Y. Liu, Z. Gu, G.-J. Qi,
M. Wang, J. Tang, X. Yuan, Z. Lu, and J. Liu, “Msra-Ustc-Sjtu At Trecvid
2007: High-level Feature Extraction and Search.,” in TRECVID (P. Over,
G. Awad, W. Kraaij, and A. F. Smeaton, eds.), National Institute of Stan-
dards and Technology (NIST), 2007.
[7] B. Lei, E. Hendriks, and M. Reinders, “On feature extraction from images,”
Technical report, 1999.
49

[8] D. Aldavert, A. Ramisa, R. Toledo, and R. Lopez De Mantaras, “Efficient
object pixel-level categorization using bag of features,” in Proceedings of the
5th International Symposium on Advances in Visual Computing (ISVC),
(Berlin, Heidelberg), pp. 44–54, Springer-Verlag, 2009.
[9] K. Duman and A. E. Cetin, “Target detection in sar images using codiffer-
ence and directional filters,” in Proceedings of SPIE (E. G. Zelnio and F. D.
Garber, eds.), vol. 7699, p. 76990S, 2010.
[10] D. A. Forsyth and J. Ponce, Computer Vision: A Modern Approach. Pren-
tice Hall, us ed., August 2002.
[11] J. Canny, “A computational approach to edge detection,” IEEE Transac-
tions on Pattern Analysis and Machine Intelligence, vol. PAMI-8, pp. 679
–698, November 1986.
[12] N. Dalal and B. Triggs, “Histograms of oriented gradients for human de-
tection,” in Proceedings of the IEEE Conference on Computer Vision and
Pattern Recognition (CVPR), (Washington, DC, USA), pp. 886–893, IEEE
Computer Society, 2005.
[13] P.-F. Hsieh, D.-S. Wang, and C.-W. Hsu, “A linear feature extraction for
multiclass classification problems based on class mean and covariance dis-
criminant information,” IEEE Transactions on Pattern Analysis and Ma-
chine Intelligence, vol. 28, pp. 223 –235, February 2006.
[14] R. Lenz and M. Osterberg, “A new method for unsupervised linear feature
extraction, using fourth order moments,” in Proceedings of the 11th IAPR
International Conference on Pattern Recognition, pp. 71 –74, 30 1992.
[15] Y. Fu and J. Lv, “Recognition of sar image based on svm and new invariant
moment feature extraction,” in Second International Symposium on Knowl-
edge Acquisition and Modeling (KAM), vol. 1, pp. 15 –18, November 2009.
50
[16] B.-W. Kim, D.-L. Choi, and Y.-J. Lee, “Speech/music discrimination us-
ing mel-cepstrum modulation energy,” in Proceedings of the 10th Interna-
tional Conference on Text, Speech and Dialogue (TSD), (Berlin, Heidelberg),
pp. 406–414, Springer-Verlag, 2007.
[17] S. Davis and P. Mermelstein, “Comparison of parametric representations
for monosyllabic word recognition in continuously spoken sentences,” IEEE
Transactions on Acoustics, Speech, and Signal Processing, vol. 28, no. 4,
pp. 357–366, 1980.
[18] H. Yang, D. Huang, and L. Cai, “Perceptually weighted mel-cepstrum anal-
ysis of speech based on psychoacoustic model,” IEICE Transactions on In-
formation and Systems, vol. E89-D, no. 12, pp. 2998–3001, 2006.
[19] V. Tyagi and C. Wellekens, “On desensitizing the mel-cepstrum to spuri-
ous spectral components for robust speech recognition,” in Proceedings of
IEEE International Conference on Acoustics, Speech, and Signal Processing
(ICASSP), vol. 1, pp. 529 – 532, March 2005.
[20] T. Kitamura and S. Takei, “Speaker recognition model using two-
dimensional mel-cepstrum and predictive neural network,” in Proceedings
of Fourth International Conference on Spoken Language (ICSLP), vol. 3,
pp. 1772 –1775 vol.3, March 1996.
[21] B. U. Toreyin and A. E. Cetin, “Shadow detection using 2D cepstrum,”
in Society of Photo-Optical Instrumentation Engineers (SPIE) Conference
Series, vol. 7338, May 2009.
[22] Y. Yeshurun and E. Schwartz, “Cepstral filtering on a columnar image archi-
tecture: a fast algorithm for binocular stereo segmentation,” IEEE Trans-
actions on Pattern Analysis and Machine Intelligence, vol. 11, pp. 759–767,
July 1989.
51
[23] J. K. Lee, M. Kabrisky, M. E. Oxley, S. K. Rogers, and D. W. Ruck, “The
complex cepstrum applied to two-dimensional images,” Pattern Recognition,
vol. 26, no. 10, pp. 1579 – 1592, 1993.
[24] A. E. Cetin and R. Ansari, “Convolution-based framework for signal recov-
ery and applications,” Journal of the Optical Society of America A-optics
Image Science and Vision, vol. 5, no. 8, pp. 1193–1200, 1988.
[25] U. Cigdem Turhal, M. B. Gulmezoglu, and A. Barkana, “Face recognition
using common matrix approach,” in Proceedings of the 13th European Signal
Processing Conference, 2005.
[26] C. C. Chang and C. J. Lin, LIBSVM: A Library for Support Vector Ma-
chines, 2001.
[27] H. Liu, W. Gao, J. Miao, D. Zhao, G. Deng, and J. Li, “Illumination com-
pensation and feedback of illumination feature in face detection,” in Pro-
ceedings of the IEEE International Conferences on Info-tech and Info-net
(ICII), vol. 3, pp. 444 –449, 2001.
[28] X.-Y. Jing, Y.-Y. Tang, and D. Zhang, “A Fourier-LDA approach for image
recognition,” Pattern Recognition, vol. 38, no. 3, pp. 453 – 457, 2005.
[29] M. Gueham, A. Bouridane, D. Crookes, and O. Nibouche, “Automatic recog-
nition of shoeprints using fourier-mellin transform,” in NASA/ESA Confer-
ence on Adaptive Hardware and Systems (AHS), pp. 487 –491, June 2008.
[30] A. Martinez and R. Benavente, “The AR face database,” CVC Technical
Report # 24, 1998.
[31] F. S. Samaria and A. C. Harter, “Parameterization of a stochastic model for
human face identification,” in Proceedings of the Second IEEE Workshop on
Applications of Computer Vision, pp. 138 –142, May 1994.
52
[32] Yale, “Yale Face Database.” http://cvc.yale.edu/projects/yalefaces/
yalefaces.html, 1997.
[33] P. J. Phillips, P. J. Flynn, T. Scruggs, K. W. Bowyer, J. Chang, K. Hoff-
man, J. Marques, J. Min, and W. Worek, “Overview of the face recognition
grand challenge,” in Proceedings of the IEEE Computer Society Conference
on Computer Vision and Pattern Recognition (CVPR), (Washington, DC,
USA), pp. 947–954, IEEE Computer Society, 2005.
[34] W. Zhao, R. Chellappa, A. Rosenfeld, and P. J. Phillips, “Face recognition:
A literature survey,” ACM Computing Surveys, pp. 399–458, 2003.
[35] R. Brunelli and T. Poggio, “Face recognition: features versus templates,”
IEEE Transactions on Pattern Analysis and Machine Intelligence, vol. 15,
no. 10, pp. 1042–1052, 1993.
[36] K. Etemad and R. Chellappa, “Discriminant analysis for recognition of hu-
man face images,” Journal of the Optical Society of America A-optics Image
Science and Vision, vol. 14, pp. 1724–1733, 1997.
[37] L.-F. Chen, H.-Y. M. Liao, M.-T. Ko, J.-C. Lin, and G.-J. Yu, “A new
LDA-based face recognition system which can solve the small sample size
problem,” Pattern Recognition, vol. 33, no. 10, pp. 1713 – 1726, 2000.
[38] A. Martinez and A. Kak, “PCA versus LDA,” IEEE Transactions on Pattern
Analysis and Machine Intelligence, vol. 23, pp. 228–233, February 2001.
[39] J. Lu, K. N. Plataniotis, and A. N. Venetsanopoulos, “Regularized discrimi-
nant analysis for the small sample size problem in face recognition,” Pattern
Recognition Letters, vol. 24, no. 16, pp. 3079–3087, 2003.
[40] P. N. Belhumeur, J. P. Hespanha, and D. J. Kriegman, “Eigenfaces vs.
fisherfaces: Recognition using class specific linear projection,” IEEE Trans-
actions on Pattern Analysis and Machine Intelligence, vol. 19, pp. 711–720,
August 1997.
53
[41] H. Yu, “A direct LDA algorithm for high-dimensional data - with application
to face recognition,” Pattern Recognition, vol. 34, pp. 2067–2070, October
2001.
[42] M. Turk and A. Pentland, “Eigenfaces for recognition,” Journal of Cognitive
Neuroscience, vol. 3, pp. 71–86, January 1991.
[43] X.-Y. Jing, H.-S. Wong, and D. Zhang, “Face recognition based on dis-
criminant fractional fourier feature extraction,” Pattern Recognition Letters,
vol. 27, no. 13, pp. 1465 – 1471, 2006.
[44] J. H. Lai, P. C. Yuen, and G. C. Feng, “Face recognition using holistic
fourier invariant features,” Pattern Recognition, vol. 34, no. 1, pp. 95 – 109,
2001.
[45] J. Bertrand, P. Bertrand, and J. Ovarlez, “Discrete mellin transform for
signal analysis,” in IEEE International Conference on Acoustics, Speech,
and Signal Processing (ICASSP), vol. 3, pp. 1603 –1606, April 1990.
[46] B. Bogert, M. Healy, and J. Tukey, “The quefrency alanysis of time series for
echoes: Cepstrum, pseudo-autocovariance, cross-cepstrum and saphe crack-
ing,” in Proceedings of the Symposium on Time Series Analysis, pp. 209–243,
1963.
[47] M. Nilsson, J. Nordberg, and I. Claesson, “Face detection using local smqt
features and split up snow classifier,” in IEEE International Conference on
Acoustics, Speech and Signal Processing (ICASSP), vol. 2, pp. II–589 –II–
592, 15-20 2007.
[48] M. Gulmezoglu, V. Dzhafarov, and A. Barkana, “The common vector ap-
proach and its relation to principal component analysis,” IEEE Transactions
on Speech and Audio Processing, vol. 9, pp. 655–662, September 2001.
54
[49] M. Bilginer Gulmezoglu, V. Dzhafarov, M. Keskin, and A. Barkana, “A
novel approach to isolated word recognition,” IEEE Transactions on Speech
and Audio Processing, vol. 7, pp. 620–628, November 1999.
[50] B. E. Boser, I. M. Guyon, and V. N. Vapnik, “A training algorithm for
optimal margin classifiers,” in Proceedings of Fifth Annual Workshop on
Computer Learning Theory (COLT), (New York, NY, USA), pp. 144–152,
ACM, 1992.
[51] S. Knerr, L. Personnaz, and G. Dreyfus, “Single-layer learning revisited: a
stepwise procedure for building and training a neural network,” in Neuro-
computing: Algorithms, Architectures and Applications (J. Fogelman, ed.),
Springer-Verlag, 1990.
[52] S. Liao and A. Chung, “Face recognition with salient local gradient orien-
tation binary patterns,” in 16th IEEE International Conference on Image
Processing (ICIP), pp. 3317 –3320, 7-10 2009.
[53] S. Cakir and A. E. Cetin, “Mel-Cepstral methods for image feature extrac-
tion.” IEEE International Conference on Image Processing (ICIP), Septem-
ber 2010.
[54] S. Cakir and A. E. Cetin, “Image feature extraction using 2D mel-cepstrum.”
27th International Conference on Pattern Recognition (ICPR), August 2010.
[55] S. Cakir and A. E. Cetin, “Two-dimensional Mellin- and mel-cepstrum for
image feature extraction.” 25th International Symposium on Computer and
Information Sciences (ISCIS), September 2010.
[56] C. Nilubol, Q. H. Pham, R. M. Mersereau, M. J. T. Smith, and M. A.
Clements, “Hidden markov modelling for SAR automatic target recogni-
tion,” in Proceedings of the IEEE International Conference on Acoustics,
Speech and Signal Processing (ICASSP), vol. 2, pp. 1061–1064, May 1998.
55
[57] H.-C. Chiang, R. L. Moses, and L. C. Potter, “Model-based classification of
radar images,” IEEE Transactions on Information Theory, vol. 46, pp. 1842–
1854, August 2000.
[58] L. M. Novak, G. J. Owirka, and A. L. Weaver, “Automatic target recognition
using enhanced resolution SAR data,” IEEE Transactions on Aerospace and
Electronic Systems, vol. 35, pp. 157–175, January 1999.
[59] L. M. Novak, “State-of-the-art of SAR automatic target recognition,” in
Proceedings of the IEEE International Radar Conference, pp. 836–843, May
2000.
[60] J. Xu, L. Lu, Z. Feng, and Y. Peng, “SAR image feature extraction and clas-
sification with fractal-based description,” in 6th International Conference on
Signal Processing, vol. 2, pp. 1392 – 1395 vol.2, 26-30 2002.
[61] C. Qiu, H. Ren, H. Zou, and S. Zhou, “Performance comparison of target
classification in SAR images based on PCA and 2D-PCA features,” in 2nd
Asian-Pacific Conference on Synthetic Aperture Radar (APSAR), pp. 868
–871, 26-30 2009.
[62] H. Cheng, S. Zheng, Q. Yu, J. Tian, and J. Liu, “Matching of sar images
and optical images based on edge feature extracted via svm,” in Proceedings
of the 7th International Conference on Signal Processing (ICSP), vol. 2,
pp. 930 – 933 vol.2, 31 2004.
[63] H.-n. Li, B.-z. Yu, W. Xi, and K.-b. Wang, “A fractional fourier approach
sar imaging method,” in Congress on Image and Signal Processing (CISP),
vol. 5, pp. 215 –218, 27-30 2008.
[64] X. Lu, P. Han, and R. Wu, “Research on mixed PCA/ICA for SAR image
feature extraction,” in 9th International Conference on Signal Processing
(ICSP), pp. 2465 –2468, 26-29 2008.
56
[65] H. Sun, F. Su, and Y. Zhang, “Modified roa algorithm applied to extract
linear features in sar images,” in 1st International Symposium on Systems
and Control in Aerospace and Astronautics (ISSCAA), pp. 5 pp. –1213,
19-21 2006.
[66] D. Chen and X. Li, “Target Detection in SAR Image Based-on Wavelet
Transform and Fractal Feature,” in 2nd International Congress on Image
and Signal Processing (CISP), pp. 1–4, 17-19 2009.
[67] A. Betti, M. Barni, and A. Mecocci, “Using a wavelet-based fractal fea-
ture to improve texture discrimination on sar images,” in Proceedings of the
International Conference on Image Processing, vol. 1, pp. 251 –254 vol.1,
26-29 1997.
[68] X.-H. Yuan, Z.-D. Zhu, and G. Zhang, “Multiresolution target detection
in wavelet domain for sar imagery,” in Fifth International Conference on
Information Assurance and Security (IAS), vol. 1, pp. 609 –613, 18-20 2009.
[69] S. Matzner and L. Zurk, “Frequency domain feature extraction from syn-
thetic aperture radar data,” in IEEE International Symposium on Antennas
and Propagation, pp. 1489 –1492, 9-15 2007.
[70] A. Amein and J. Soraghan, “The fractional fourier transform and its appli-
cation to high resolution sar imaging,” in IEEE International Symposium
on Geoscience and Remote Sensing (IGARSS), pp. 5174 –5177, 23-28 2007.
[71] R. Abdelfattah, J. Nicolas, and F. Tupin, “Interferometric sar image coreg-
istration based on the fourier-mellin invariant descriptor,” in IEEE Inter-
national Symposium on Geoscience and Remote Sensing (IGARSS), vol. 3,
pp. 1334 – 1336 vol.3, 24-28 2002.
57