Embed Size (px)
Citation preview
CEO Power and Board Dynamics*
John R. Graham†
Hyunseob Kim‡
Mark Leary§
April 2017
Abstract
We examine bargaining dynamics between the CEO and the board of directors from 1918 to 2011 using a newly constructed panel dataset. In the year that a new CEO is hired, board independence increases significantly, consistent with new CEOs having less bargaining power initially. We find that as the CEO’s tenure (and thus power) increases, an additional year on the job is associated with a significant decline in board independence, an increase in the probability that the CEO holds the board chairman title, and an increase in compensation. The tenure-board independence relation is weaker when there is more uncertainty about the CEO’s ability and after events that reduce CEO power, such as targeting by activist investors. We also find that powerful CEOs are less likely to be replaced conditional on poor firm performance and that board structure is highly persistent. Finally, event studies document a positive market reaction when powerful CEO’s die in office, in contrast to no market reaction to typical CEO deaths, consistent with powerful CEOs becoming entrenched.
* We appreciate comments from Ofer Eldar, Byoung-Hyoun Hwang, Andrew Karolyi, Peter Limbach, Roni Michaely and seminar and conference participants at Binghamton University, Cornell University, Duke University, IDC Summer Finance Conference, Tuck, University of Kentucky, University of Utah, Washington University in St. Louis, and the WSJ CEO Forum, excellent research assistance from Penghao Chen, Hyungjin Choi, David Hong, Dawoon Kim, Jason Lee, Boyao Li, Song Ma, Youngjun Song, Curtis Wang, Hyun Gu Yeo, Gang Zhang, and data support from the librarians at Cornell, Duke, Harvard, and MIT. We thank William Goetzmann for sharing data on historical stock prices and Charlie Hadlock and Timothy Quigley for sharing data on CEO deaths. † Fuqua School of Business, Duke University, and NBER; Email; [email protected]; Phone: (919) 660-7857. ‡ Samuel Curtis Johnson Graduate School of Management, Cornell University; Email: [email protected]; Phone: (607) 255-8335. § Olin School of Business, Washington University in St. Louis, and NBER; Email: [email protected]; Phone: (314) 935-6394.
USC FBE FINANCE SEMINARpresented by John GrahamFRIDAY, April 14, 201710:30 am - 12:00 pm, Room: HOH-2
1
1. Introduction
In recent years, regulators and investors have shown increasing interest in the composition
of boards of directors.1 The premise is that the structure of a board determines the effectiveness of
its interactions with management and the CEO. However, as previous research points out, the CEO
herself is often influential in the process of selecting board members (e.g., Hermalin and Weisbach,
1998; Shivdasani and Yermack, 1999) and boards may be captured by management (Jensen, 1993;
Shleifer and Vishny, 1997; Coles et al., 2014), which raises several questions. How do CEOs and
their boards interact dynamically, and is this interaction influenced by the bargaining power of the
CEO? What determines the relative bargaining power of the board versus the CEO? We use a
unique dataset to address these and related questions by studying the dynamics of board structure
through a CEO’s tenure, how CEO power affects these dynamics, and the resulting impact on
board decisions and firm value.
One view of corporate governance is that boards are optimally chosen, given the constraints
that firms face (e.g., Hermalin and Weisbach, 1998; Almazan and Suarez, 2003; Coles, Daniel,
and Naveen, 2007; Adams et al., 2010). In this framework, the distinction between “weak” and
“strong” corporate governance is nuanced. A “weak” governance structure (e.g., boards dominated
by corporate insiders, CEOs holding board chairman titles) can optimally arise when the CEO is
deemed to possess high ability or well-matched skills to manage the firm. On the other hand, a
“strong” governance structure with strict monitoring may be optimal when the board faces
uncertainty about the ability or match quality of the current CEO.
1 For example, NYSE/NASDAQ listing rules require that the majority of directors are independent. As another example, hedge fund activism often focuses on board structure. (See “United CEO Munoz to Draw on His Past as He Fights for Control,” The Wall Street Journal, March 6, 2016 for a recent example of hedge fund activists demanding board seats.)
2
While promising, this class of theories is challenging to test empirically. An important
premise is that each firm faces a unique constrained optimization problem of dynamically
determining governance structures (e.g., board independence, compensation), conditional on the
evolution of CEO power. Thus, the ideal test would focus on within-firm variation in board
characteristics and the CEO’s bargaining power, which is partly driven by her perceived ability.2
To date, commonly-used director databases have information on directors (but usually not officers
other than the CEO) for large, public firms and span 10 to 20 years at most,3 leaving only a modest
history of dynamics between boards and CEOs, perhaps explaining the dearth of within-firm
empirical tests. Further, during much of the time spanned by modern director databases,
regulations related to the Sarbanes-Oxley Act has influenced the composition of boards. Cleanly
estimating the bargaining dynamics between boards and CEOs therefore requires panel data
extending further back in time.
We address these shortcomings by constructing a new database of officers and directors of
nearly 7,000 unique firms listed on major U.S. stock exchanges from 1918 to 2011. We draw these
data from Moody’s Industrial Manual, Mergent, Compact Disclosure, and Board Analyst. These
data allow us to examine whether the bargaining power of the CEO vis-à-vis the board of directors
influences within-firm dynamics of board structure, such as board independence and whether the
chairman title is held by the CEO (potentially leading to CEO entrenchment).
To focus our exposition, we organize our empirical analysis and discussion around the
model of Hermalin and Weisbach (1998; HW), referencing other theories when appropriate for
2 The above-mentioned papers define the bargaining power of the CEO as her ability to influence the selection of board members and compensation. See e.g., Finkelstein (1992) and Adams, Almeida, and Ferreira (2005) for another, related definition of powerful CEOs: those who can consistently influence key decisions in the firm despite potential opposition from the other executives. 3 RiskMetrics (1996-present); Board Analyst (2001-present); and BoardEx (2001-present) cover at most 20 years of data on directors for the largest 1,500-3,000 U.S. public firms, but data on officers are limited to the identities of the CEOs.
3
interpretation and supplemental issues. HW argue that board structure and CEO tenure are joint
outcomes of a bargaining process between the board and CEO, conditional on firm performance
and the CEO’s perceived ability. In their framework, good performance improves the CEO’s
perceived ability relative to potential replacements, increasing her bargaining power. When viewed
as a “rare commodity,” the CEO is more likely to be retained and better able to bargain for a
weaker (e.g., less independent) board, reducing the intensity of monitoring.
We explore several of the model’s broad predictions. First, assuming that CEOs prefer less
monitoring, they bargain to reduce board independence, as well as for higher compensation and to
become the chair of the board. We explore many dimensions of these central predictions, most for
the first time in the literature. Our tenure analysis can be summarized as follows:
1. We find that an additional year of CEO tenure is associated with a 0.15 percentage-point decline in the ratio of independent directors to total directors on the board. The negative relation between CEO tenure and board independence is a within-firm prediction, though almost all previous tests have been cross-sectional. Our long panel of data allows us to test this time-series prediction within-firm, with more power, and out-of-sample relative to previous research.
2. The magnitude of the reduction in board independence associated with CEO tenure varies across CEOs, firms, and time in the manner that theory says it should:
a. The CEO tenure-board independence relation increases with performance (and thus perceived CEO ability), such as among firms for which the CEO was initially successful (high ROA, high stock return), consistent with early-success-CEO’s gaining bargaining power. The results are even stronger when, consistent with the HW model, we instrument CEO tenure with firm performance (ROA).
b. The CEO tenure-board independence relation is also stronger when there is less uncertainty about the CEO’s ability, such as for the first CEO at the firm (e.g., the founder), and as the CEO’s career progresses. Conversely, the tenure result is weaker when there is more uncertainty about the CEO’s ability, such as upon CEO turnover (Pan et al., 2015), especially when turnover results from death of the incumbent CEO.
c. The CEO tenure-board independence relation is weaker when there are external shocks to CEO power. The relation disappears after hedge fund activists target a firm, and it becomes weaker during recessions when theory predicts board monitoring is tougher (Song and Thakor, 2006).
d. Regulation can constrain the influence of CEO tenure but any benefits may be muted. We find that the influence of CEO tenure on board independence disappears after implementation of the 2002 Sarbanes-Oxley and 2003 stock exchange regulations. However, the propensity of long-tenure CEOs to be promoted to board chair increases

4
post-2002, consistent with dual chairmanship substituting for the CEO’s loss of her influence on board independence.
e. By contrast, when the advising role of the board is important, it may offset the CEO tenure effect. We find that when the newly appointed CEO is external to the firm (i.e., not previously an employee), board independence initially falls and is largely unaffected by CEO tenure, consistent with theory that external CEOs are likely to need more board advising relative to monitoring (Adams and Ferreira, 2007).
3. Powerful (long-tenure) CEOs also are more likely to become dual board chair, as well as earn more compensation. An additional year of CEO tenure is associated with a 2.2% increase in the probability that the CEO is also board chairman and a 2.4% increase in annual compensation. A second broad prediction of Hermalin and Weisbach (1998) is that more powerful CEOs
are less likely to be replaced conditional on poor firm performance. Our long panel allows us to
test this prediction within-firm, with more power, and mostly out-of-sample relative to previous
research. We document that poorly performing CEOs (low ROA, stock returns, or both) are more
likely to be replaced. More importantly, we test and confirm the HW prediction that CEO power
attenuates the performance-turnover relation using four measures of power: CEOs with longer
tenure, dual chairman title, superior past performance, and less independent boards.
Third, HW predict that board structure should be persistent due to hysteresis: a strong CEO
will bargain to achieve a weaker board, which will be inherited by the next CEO. Hence the next
CEO will be relatively strong and the weaker board structure is likely to continue. Our long panel
is particularly useful in testing this prediction. We find that firms that initially have an independent
(or dependent) board on average will still have a more independent (dependent) board 30 years
later. In regressions, we find that initial board independence is economically and statistically strong
in explaining current board independence.
Finally, the evidence so far suggests that powerful CEOs receive many advantages,
including higher pay, longer tenure, and greater job security. We explore market reactions to the
departure of powerful CEOs. On the one hand, if a CEO’s power were to emanate from perceived
5
superior ability (or match quality) and expected performance relative to a replacement, her
departure could lead to a negative market reaction. On the other hand, powerful CEOs may become
entrenched (in that they may be shielded from being fired even if performance deteriorates) and
thus their departures may increase shareholder value (e.g., Taylor, 2010). Because of endogeneity
concerns with a broad sample of departures, we focus on CEO turnover due to the CEO’s death or
serious health issues. 4 Consistent with powerful CEOs becoming entrenched, announcement
returns to exogenous CEO departures are increasing in measures of CEO power (relatively long
job tenure, board chairman, or founder of the firm). In particular, the announcement of a powerful
CEO’s departure is associated with 2.5% to 4.0% higher abnormal cumulative return over a [-2, 2]
day window, relative to departures of a less powerful CEO.
2. Data and Variable Construction
2.1. Corporate Boards of Directors and Officers
We construct a comprehensive database of corporate officers and directors, such as the
Chief Executive Officer (CEO), Chief Financial Officer (CFO),5 various corporate vice presidents,
and others, at public U.S. companies from 1918 to 2011. We combine information from a number
of sources. First, we hand-collect names of corporate officers and directors, as well as firm-level
financial data on their firms, from Moody’s Industrial Manuals (‘Moody’s’) from 1918 to 1988,
and also the year 1998.6 Like most corporate finance research, we do not include firms in the
4 See also Fee, Hadlock, and Pierce (2013), Quigley, Crossland, and Campbell (2016), and Jenter, Matveyev, and Roth (2016). 5 The ‘CEO’ includes corporate officers with various titles depending on the era, including ‘President’ and ‘Chief Executive Officer’. The ‘CFO’ is the finance chief and includes corporate officers in various titles depending on the era, including ‘Treasurer’ and ‘Chief Financial Officer’. 6 See Graham, Leary, and Roberts (2015) for a description of coverage and available financial statement information in Moody’s. Other papers that analyze small samples of Moody’s financial and board information include Lehn, Patro, and Zhao (2009), Frydman, Hilt, and Zhou (2015), and Avedian, Cronqvist, and Weidenmier (2015).

6
financial (SIC 6000-6999), transportation (4000-4599), and utility (4900-4999) sectors. Second,
we collect names of corporate directors and officers from Compact Disclosure during 1985-2005.
Compact Disclosure derives information from firms’ public disclosure such as 10-Ks, 10-Qs, and
Proxy Statements.7 Third, we supplement these two primary board and officer databases using
Mergent (which took over the Industrial Manual from Moody’s; 2002-2009) and Board Analyst
(2002-2011) for more recent years. We gather stock return data from CRSP and financial statement
data from Compustat (for firm-years not covered by Moody’s).
To maintain comparability across the various databases and years, we focus on firms listed
on the NYSE or AMEX.8 Figure 1 shows the number of firms for which we can identify the CEO
and at least one director. The blue vertical bars show the number of firms in the database for which
we have CEO and board information. Comparing this series to the number of CRSP firms (green
line) indicates that we have CEO and board information for the majority of the NYSE/AMEX
firms in the CRSP database over the 1918-2011 period. All total, our database contains more than
90,000 firm-year observations and more than 11,000 CEO turnover events.
2.2. Descriptive Statistics
Table 1 presents descriptive statistics on firm-year observations in the full database and by
decade. There are 93,249 total observations from 1918 to 2011, with the sample size changing
with the number of publicly listed firms. CEO turnover averages 12.1% per year for the full sample,
increasing from the first to the second half of the sample. The average CEO, CFO, and board
chairman tenures are 6.2, 5.0, and 5.8 years, respectively. The CEO holds the title of board
chairman (‘CEO-Chairman duality’) for 40.7% of observations, with substantial time-series
7 See Fahlenbrach, Low, and Stulz (2010) for an example of research using Compact Disclosure in a corporate board context. 8 Our main results are similar if we include NASDAQ firms, or use NYSE firms only.
7
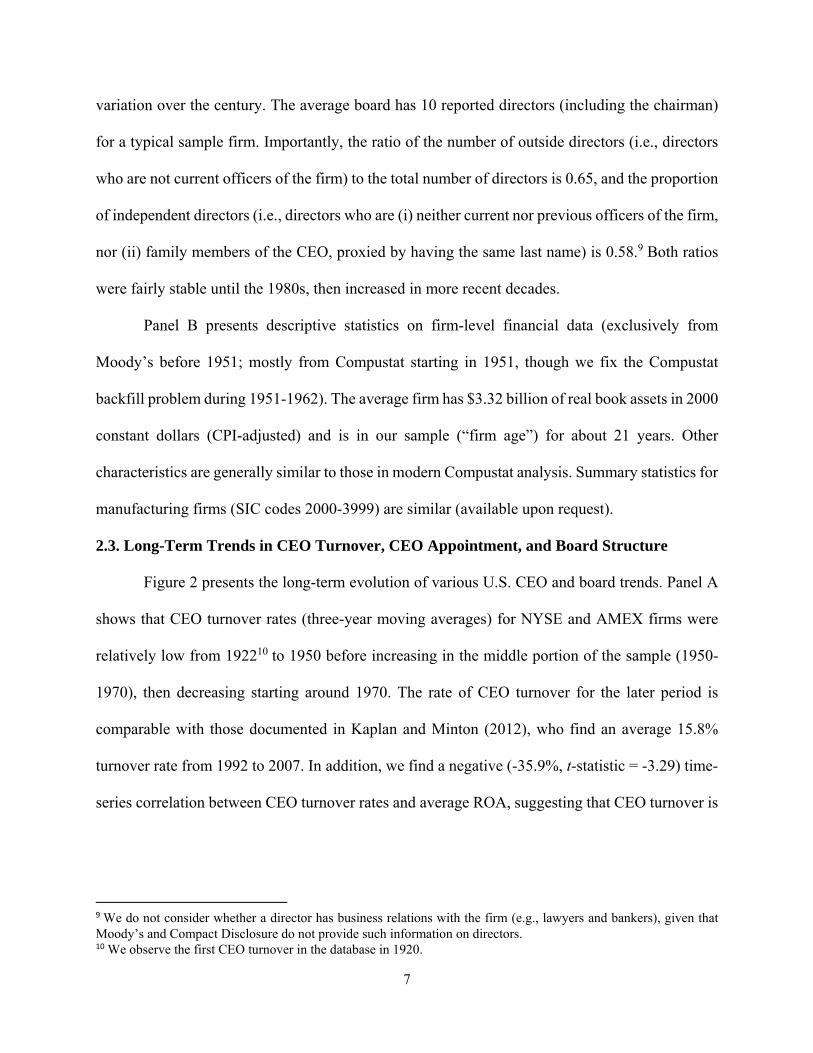
variation over the century. The average board has 10 reported directors (including the chairman)
for a typical sample firm. Importantly, the ratio of the number of outside directors (i.e., directors
who are not current officers of the firm) to the total number of directors is 0.65, and the proportion
of independent directors (i.e., directors who are (i) neither current nor previous officers of the firm,
nor (ii) family members of the CEO, proxied by having the same last name) is 0.58.9 Both ratios
were fairly stable until the 1980s, then increased in more recent decades.
Panel B presents descriptive statistics on firm-level financial data (exclusively from
Moody’s before 1951; mostly from Compustat starting in 1951, though we fix the Compustat
backfill problem during 1951-1962). The average firm has $3.32 billion of real book assets in 2000
constant dollars (CPI-adjusted) and is in our sample (“firm age”) for about 21 years. Other
characteristics are generally similar to those in modern Compustat analysis. Summary statistics for
manufacturing firms (SIC codes 2000-3999) are similar (available upon request).
2.3. Long-Term Trends in CEO Turnover, CEO Appointment, and Board Structure
Figure 2 presents the long-term evolution of various U.S. CEO and board trends. Panel A
shows that CEO turnover rates (three-year moving averages) for NYSE and AMEX firms were
relatively low from 192210 to 1950 before increasing in the middle portion of the sample (1950-
1970), then decreasing starting around 1970. The rate of CEO turnover for the later period is
comparable with those documented in Kaplan and Minton (2012), who find an average 15.8%
turnover rate from 1992 to 2007. In addition, we find a negative (-35.9%, t-statistic = -3.29) time-
series correlation between CEO turnover rates and average ROA, suggesting that CEO turnover is
9 We do not consider whether a director has business relations with the firm (e.g., lawyers and bankers), given that Moody’s and Compact Disclosure do not provide such information on directors. 10 We observe the first CEO turnover in the database in 1920.
8
counter-cyclical. This pattern is consistent with CEO turnover following poor corporate
performance (e.g., Warner and Watts, 1988).
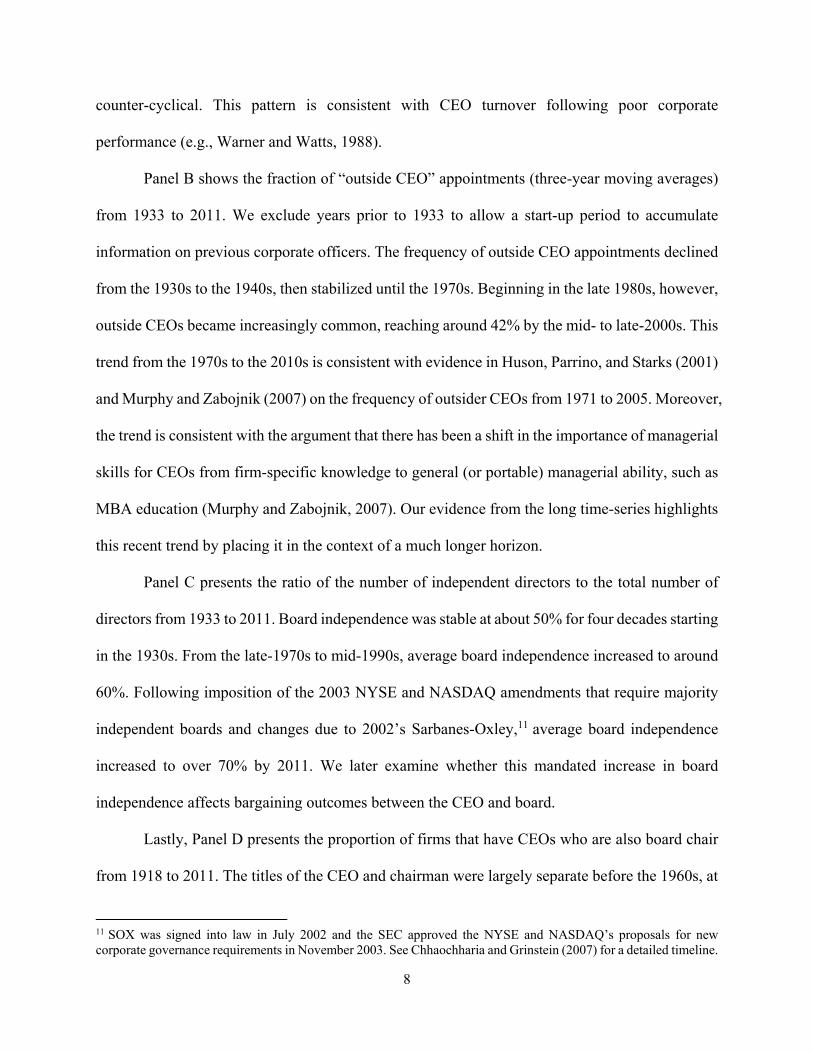
Panel B shows the fraction of “outside CEO” appointments (three-year moving averages)
from 1933 to 2011. We exclude years prior to 1933 to allow a start-up period to accumulate
information on previous corporate officers. The frequency of outside CEO appointments declined
from the 1930s to the 1940s, then stabilized until the 1970s. Beginning in the late 1980s, however,
outside CEOs became increasingly common, reaching around 42% by the mid- to late-2000s. This
trend from the 1970s to the 2010s is consistent with evidence in Huson, Parrino, and Starks (2001)
and Murphy and Zabojnik (2007) on the frequency of outsider CEOs from 1971 to 2005. Moreover,
the trend is consistent with the argument that there has been a shift in the importance of managerial
skills for CEOs from firm-specific knowledge to general (or portable) managerial ability, such as
MBA education (Murphy and Zabojnik, 2007). Our evidence from the long time-series highlights
this recent trend by placing it in the context of a much longer horizon.
Panel C presents the ratio of the number of independent directors to the total number of
directors from 1933 to 2011. Board independence was stable at about 50% for four decades starting
in the 1930s. From the late-1970s to mid-1990s, average board independence increased to around
60%. Following imposition of the 2003 NYSE and NASDAQ amendments that require majority
independent boards and changes due to 2002’s Sarbanes-Oxley,11 average board independence
increased to over 70% by 2011. We later examine whether this mandated increase in board
independence affects bargaining outcomes between the CEO and board.
Lastly, Panel D presents the proportion of firms that have CEOs who are also board chair
from 1918 to 2011. The titles of the CEO and chairman were largely separate before the 1960s, at
11 SOX was signed into law in July 2002 and the SEC approved the NYSE and NASDAQ’s proposals for new corporate governance requirements in November 2003. See Chhaochharia and Grinstein (2007) for a detailed timeline.

9
which time the frequency of the dual title increased to a peak of 73% in the mid-1980s. Shortly
thereafter, duality began to decrease, possibly due to “governance activists” such as the National
Association of Corporate Directors (NACD) which supported separating these two roles (see e.g.,
Wangler, 1994; NACD, 1996). The downward trend is also consistent with Dahya, McConnell,
and Travlos (2002) who show that the duality of the titles began to disappear in the U.K. in 1992
when the Cadbury Committee recommended separation of chairman and CEO titles.
3. Bargaining Power, CEO Tenure, and Board Structure
3.1. Conceptual Links between CEO Tenure, Power, and Board Structure
Hermalin and Weisbach (1998) argue that board structure and CEO tenure are outcomes
of a bargaining process between the board and the CEO, conditional on firm performance and
underlying CEO ability. In this framework, CEOs become more powerful when their firms perform
well (which is more likely when CEOs are of high ability) and as a result, their tenures increase.
This power in turn helps the CEO in the negotiating process, allowing her to influence board
structure such as chairman duality and the proportion of outsider representation. Assuming that
CEOs prefer less monitoring (e.g., Shivdasani and Yermack, 1999; Coles, Daniel, and Naveen,
2014), a powerful CEO is likely to use her power to attain fewer independent directors on the
board and/or to become its chairman, in addition to more compensation. Offsetting this effect,
board monitoring of the CEO (and hence board independence) is greater when there is more
uncertainty about CEO ability.
Therefore, theory predicts within-firm, (1) a negative relation between CEO tenure and
board independence (including that board independence increases at the time of CEO turnover);
(2) the reduction in board independence over the CEO’s tenure primarily occurs among CEOs who
10
initially perform well, (3) this relation should become more pronounced when there is less
uncertainty about CEO ability, (4) negative external shocks to CEO power reduce the negative
tenure-independence relation, (5) positive relations between tenure and chairman duality and
compensation, (6) regulations of the ‘symptoms’ of CEO power that do not affect the bargaining
process may little affect overall board-CEO relations, (7) board structure is persistent, and (8) CEO
turnover is less sensitive to performance when the CEO is powerful. Note that these are dynamic,
within-firm predictions, although in the past they have almost exclusively been tested in the cross-
section (see Adams, Hermalin, and Weisbach, 2010 for a review). Thanks to our long panel of data,
we are able to conduct powerful within-firm tests of these predictions.
3.2. Empirical Analysis of CEO Power, Tenure, and Board Structure
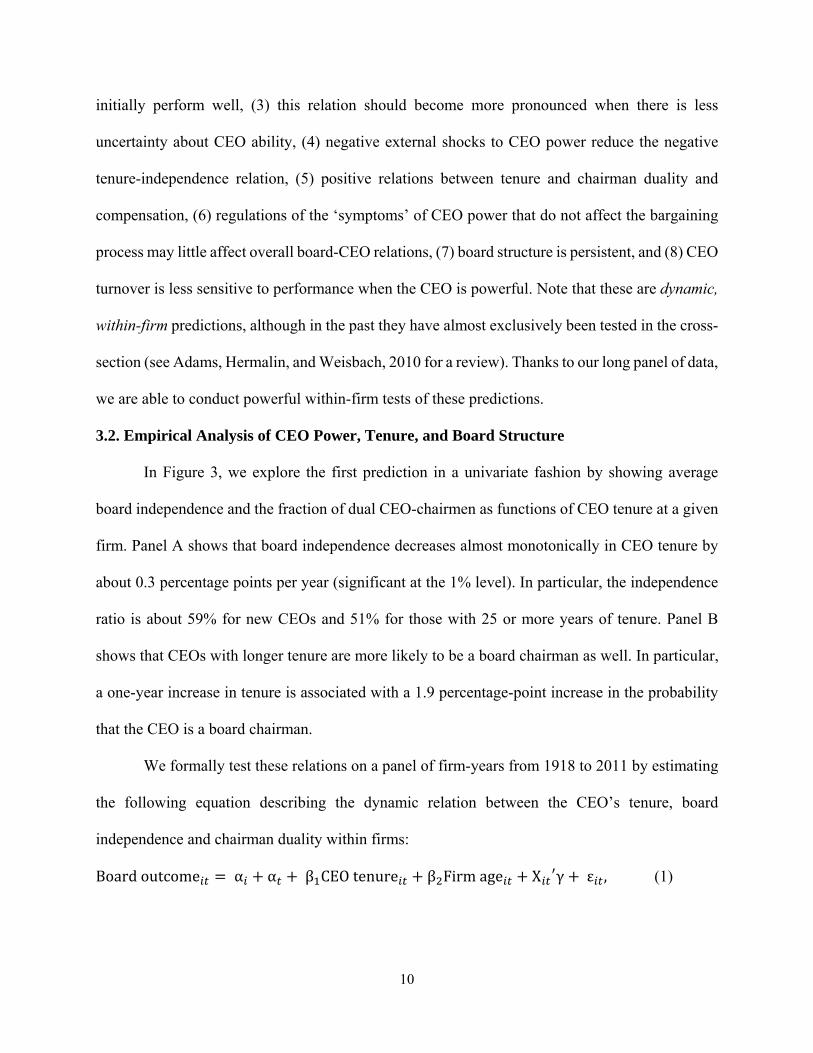
In Figure 3, we explore the first prediction in a univariate fashion by showing average
board independence and the fraction of dual CEO-chairmen as functions of CEO tenure at a given
firm. Panel A shows that board independence decreases almost monotonically in CEO tenure by
about 0.3 percentage points per year (significant at the 1% level). In particular, the independence
ratio is about 59% for new CEOs and 51% for those with 25 or more years of tenure. Panel B
shows that CEOs with longer tenure are more likely to be a board chairman as well. In particular,
a one-year increase in tenure is associated with a 1.9 percentage-point increase in the probability
that the CEO is a board chairman.
We formally test these relations on a panel of firm-years from 1918 to 2011 by estimating
the following equation describing the dynamic relation between the CEO’s tenure, board
independence and chairman duality within firms:
Boardoutcome α α β CEOtenure β Firmage X γ ε , (1)

11
where Board outcomeit is either board independence, defined as the ratio of the number of
independent directors to total directors; CEO-chairman duality or compensation (defined below);
αi and αt represent firm- and year-fixed effects; CEO tenureit is the number of years for which the
CEO has been chief executive in firm i as of year t; Firm ageit represents the number of years since
firm i first appears in our database; Xit represents a vector of firm-level control variables including
log board size, log number of officers, log book assets, Tobin’s q, return on assets, and asset
tangibility; and εit represents random errors. Standard errors are clustered at the firm level. By
including firm fixed effects, our identification comes from within-firm variation in CEO tenure,
board independence, and chairman duality.
Column 1 of Table 2, Panel A shows the basic relation between CEO tenure and board
independence within firms, including firm fixed effects and firm age12 but without firm-level
controls or year fixed effects. We find that board independence decreases by 0.15 percentage points
per additional year of CEO tenure. The effect is statistically significant at the 1% level, and is the
first robust evidence of within-firm, dynamic relation between CEO tenure and board independence
as opposed to pure across-firm relations (see Baker and Gompers (2003) and Boone et al. (2007)
for evidence in the cross-section).13 The economic magnitude indicates that ten years of CEO
tenure would lead to a 1.5 percentage-point (= 0.15 × 10) decrease in the independence ratio, which
is about 12% of within-firm standard deviation of board independence (12.9 percentage points).
Given that 10 years represents a two standard deviation change in CEO tenure, this average effect
is modest. However, as we highlight below, the overall effect masks considerable heterogeneity
12 Without year fixed effects, the positive coefficient on “Firm age” could also be interpreted as a positive time trend in board independence (Hermalin and Weisbach, 1998). 13 Using a sample of 142 firms from 1971-1983, Hermalin and Weisbach (1988) employ specifications both with and without firm fixed effects to examine the relation between CEO tenure and additions/departures of insider and outsider directors. However, their results with fixed effects are generally weaker than or inconsistent with those without, which the authors attribute to limited within-firm variation in their sample.

12
across firms and time in the relation between CEO tenure and board independence, heterogeneity
that is consistent with theoretical predictions.
Column 2 controls for board size and number of officers, and column 3 includes additional
firm characteristics such as log assets Tobin’s q, and industry-adjusted ROA, which little affect
the coefficient on CEO tenure and its significance level. The positive, significant coefficients on
firm age, assets and board size are consistent with the cross-sectional findings in Boone et al. (2007)
that board independence is positively associated with firm size and age. Importantly, the
significantly negative coefficient on industry-adjusted ROA suggests that CEOs who perform well
(relative to industry peers) are more likely to have a less independent board. In terms of economic
magnitude, a one-standard-deviation (SD) increase in ROA is associated with a 0.267 percentage-
point (= 0.089 × -2.991) reduction in the independence ratio. This finding is consistent with the
bargaining framework in which the CEO becomes more powerful as she performs well (which the
board uses to infer her high ability), which in turn leads to a weaker board.
Column 4 adds year-fixed effects to control for year-specific variation (including any time
trends) in board independence (and as a result, firm age drops out of the equation). We find that
the coefficient on CEO tenure remains essentially the same with year-fixed effects. Column 5
estimates equation (1) without firm-fixed effects, which gives an idea of potential bias in such
estimates. For example, compared to the coefficient in the other columns, the coefficient in column
5 (-0.242) suggests that not confining to within-firm variation may lead to an estimate that is
inflated by two-thirds. This significant difference in economic magnitude illustrates another
important reason for testing the theory within firms.14 In summary, across the specifications we
14 In the Appendix, we show that there is no within-firm effect of CEO tenure on board independence in a sample of modern (1996-2011) data that are dominated by the post-Sarbanes-Oxley era. Yet, as the appendix shows, there is a cross-sectional tenure effect in the modern data if one were to drop firm fixed-effects from the specification. Thus, it

13
find that corporate boards become less independent as CEO tenure increases, which is consistent
with the prediction of Hermalin and Weisbach (1998) that the bargaining power of a retained CEO
increases with tenure, which the CEO uses to reduce the proportion of independent directors
(implying less monitoring).
Figure 4, Panel A visually summarizes the estimated relation between CEO tenure and
board independence from column 3 of Table 2, Panel A; the overlaid dashed line is a time trend
that represents the increase in board independence with firm age. Panel B of Figure 4 shows that
after removing these time trends, board independence for a typical firm (with sample average
characteristics) follows a saw-tooth pattern, increasing when a new CEO is hired but then on
average steadily decreasing during the tenure of a given CEO.
Dual Chairs and CEO Compensation: Panel B of Table 2 examines whether CEO tenure
influences CEO-chairman duality and CEO compensation, important outcomes of bargaining
between the CEO and board. Column 1 shows results from estimating equation (1) in which the
dependent variable is a dummy equal to one if the CEO also holds the title of the board chairman,
and zero otherwise. The positive estimate for CEO tenure is consistent with CEOs with long tenure
negotiating to receive the dual chairman role. In terms of economic magnitude, an additional year
of CEO tenure in the same firm is associated with an increase of 2.2 percentage points (significant
at the 1% level) in the probability that the CEO becomes a board chairman.
Column 2 shows results from estimating equation (1) with the dependent variable being
the log of the CEO’s total current compensation including salary and bonus. The sample consists
of 3,330 firm-years from the combined database of corporate officers and directors merged with
CEO compensation data drawn from Frydman and Saks (2009) from 1935 to 1991 and
is important to test the HW predictions within-firm. The appendix also shows that effect of tenure on board independence is not driven by changing sample composition as CEO tenure increases.
14
ExecuComp from 1992 to 2011.15 The significantly positive coefficient on CEO tenure indicates
that CEOs are rewarded with higher compensation as their tenures increase. In terms of economic
magnitude, each additional year of CEO tenure leads to 2.4% higher pay (significant at the 1%
level), beyond that associated with profitability, other controls, and firm and year fixed effects.
This result is consistent with the bargaining framework of Hermalin and Weisbach (1998) in which
powerful CEOs negotiate for both high compensation and a less independent board.
3.3. Dynamics of Board Independence and Variation in the CEO Tenure Effect
The previous section provides the first robust within-firm evidence that board
independence declines throughout a CEO’s tenure. While the relation between CEO tenure and
board independence is modest over the full sample, in this section we document that the tenure
effect varies in the manner theory suggests, and at times is much larger in magnitude. To the extent
that board composition results from bargaining between the CEO and board, the board is more
likely to cede a weaker monitoring structure when the marginal benefit of monitoring the CEO is
lower. As emphasized by Hermalin and Weisbach (1998), monitoring becomes less valuable as
the board’s assessment of the CEO’s ability increases and as the uncertainty about that ability
decreases. Uncertainty about the CEO’s ability is likely to vary through her tenure, peaking when
the CEO is brand new to the job and declining after the board has had some time to evaluate her
performance. We therefore examine how board independence changes upon CEO turnover and
how it evolves thereafter. Because the level of the CEO’s perceived ability should depend on her
performance (Hermalin and Weisbach, 1998), we also study how the dynamics of board
15 We thank Carola Frydman for making the dataset of executive compensation from 1935 to 1991 available. For consistency across the sample, we only keep firms that appear in the Frydman and Saks database at least once during the 1992-2011 period.

15
independence vary with firm performance at the start of a CEO’s tenure. We explore these issues
by estimating the following equation:
Independence α α ∑ βFirmage X δ ε . (2)
The key independent variables in equation (2) are a set of dummy variables, d[0],…, d[12],
corresponding to the firm-year observations from the year of CEO turnover to 12 years after the
turnover. “Year -1” observations are also included in this analysis, serving as the baseline level.
As before, this specification includes firm fixed effects, and thus examines within-firm dynamics
following CEO turnover. We exclude CEO changes after 2002 from the sample because the
analysis examines a relatively long post-turnover period. We also require that the previous CEO
had at least two years of tenure, and that we have data on the firm in year 1.
3.3.1. New Internal CEOs, Performance, and Board Dynamics
The analysis in this section explores how perceived CEO ability and uncertainty about the
CEO affect interactions between tenure and board independence. We examine the dynamics of
board independence post-CEO turnover using a sample of 4,264 turnovers from 1920 to 2002 for
which the new CEO is a corporate insider.16 We focus on new insider CEOs because appointment
of outsider CEOs could affect board structure for different reasons than those related to CEO
bargaining power or the board’s monitoring, which are our primary focus. Later, we separately
examine the effect of CEO turnover on board independence when the new CEO is an outsider.
Figure 5 presents coefficients estimated from Equation (2). Panel A presents the percentage
of board members that are independent, relative to the firm-level average and after controlling for
year-fixed effects and firm characteristics. In year 0, the y-intercept means that among firms
appointing an insider CEO following the departure of the previous chief executive, board
16 Table 1, Panel A (and Figure 2, Panel B) shows that about twice as many insider CEOs than outsider CEOs are appointed over the 1918-2011 period.
16
independence jumps in the year of turnover by about 0.74 percentage points (red dashed line).17
The increase is statistically significant at the 1% level and is about five times the average annual
change estimated in Table 2 (Panel A).18 This is consistent with greater value of board monitoring
following a discrete jump in uncertainty about CEO ability or a decrease in perceived ability.
After the initial jump, board independence stays relatively flat for the next four years until
it begins to decrease slightly in year t+5. 19 The decline accelerates from year t+9. Board
independence decreases by about 0.4 percentage points per year of additional tenure after year 8.
This result is consistent with board independence declining only after enough time has passed to
reduce uncertainty about CEO ability.
The blue solid line in Panel A presents the same data for the subset of new internal CEOs
who are ultimately employed by the firm for at least 12 years. Hence, this analysis avoids possible
changes in sample composition that might affect the average patterns in the red dashed line. The
blue solid line shows that board independence increases in the year of turnover (insignificant) and
decreases monotonically afterward. The decreases from year t to years t+9 and t+12 are -1.17 (t-
statistic = 1.28) and -2.18 (t-statistic = 1.99). Although the blue line is an ex-post measure,
assuming that CEOs with longer ultimate tenure are more powerful, comparison to the red dashed
line suggests that when new CEOs are more powerful, the initial jump in board independence is
smaller and independence decreases sooner in a CEO’s tenure.
In Panel B, we compare less successful CEOs (those with below-median industry-adjusted
ROA averaged over the first three years in office) in the red dashed line to more successful CEOs
17 In equation (2) and Figure 5 only, we start our analysis of a given firm at t-1 in order to observe the jump in board independence that occurs at CEO turnover. 18 Dikolli, Mayew, and Nanda (2014) document an increase in board independence following CEO turnover among ExecuComp firms during 1996-2005. 19 The initial flatness of board independence holds whether the board is or is not staggered (unreported).
17
(above median) in the blue solid line. To the extent that perceived CEO ability is correlated with
operating performance (ROA), the panel shows that while both lines jump in the year of turnover,
board independence decreases faster for CEOs with high perceived ability (i.e., with good initial
performance). This is consistent with the implication of Hermalin and Weisbach (1998) that the
value of monitoring declines as the perceived ability of the CEO increases. By contrast, there is
little, if any, reduction in board independence for CEOs who fail to send a positive signal through
good initial performance. Panel C splits the sample of CEO turnovers at the median of the industry-
adjusted stock returns during the first three years of tenure, and shows a similar pattern.
Instrumenting tenure with ROA. In Table 3, we further explore the role of early success
in driving the negative CEO tenure-board independence relation. Specifically, we re-estimate
equation (1), but instrument CEO tenure using operating performance of firms measured by
industry-adjusted ROA (which HW argue is a reflection of CEO ability and thus her bargaining
power). We measure corporate performance using two versions of ROA in the IV estimation:
average ROA over the past three years and current-year ROA.20 This approach also helps to
address concerns over possible reverse causality in equation (1) – i.e., less independent boards
monitor less, leading to longer CEO tenure.
Panel A of Table 3 presents the first-stage results. Both columns 1 and 2 show that ROA
has a significantly positive effect (at the 1% significance level) on CEO tenure within firms,
conditional on the same firm-level controls as in Table 2. Panel B presents the second-stage
estimates of the relation between board independence and the component of tenure driven by
performance. Consistent with our previous estimates, both columns 1 and 2 show that CEO tenure,
20 Hermalin and Weisbach’s (1998) model consists of two periods: the first one for observing firm performance, and the second for bargaining on new director appointees. Given the ambiguity of the length of the first period during which the board observes performance, we implement IV estimates using these two proxies of firm performance.

18
instrumented by current or past firm performance, has a significantly negative effect on board
independence. Moreover, the economic magnitude of the effect in Table 3 is much larger than that
in Table 2.21 For example, relative to the baseline coefficient of about -0.15 in Table 2, Panel A,
the coefficient of -1.32 in column 1 of Table 3 is nine times larger, indicating that CEO tenure has
a larger (negative) impact on independence of the board when the variation in tenure is driven by
performance. Note that if we were to instead instrument CEO tenure using industry-level average
ROA (rather than industry-adjusted firm-specific ROA), which Bertrand and Mullainathan (2001a)
do as a measure of performance affected by “luck”, we do not find that tenure affects board
structure or CEO compensation. These findings are consistent with the bargaining power channel
a lá Hermalin and Weisbach (1998) in which firm performance that reflects underlying ability (and
does not reflect “luck”) increases bargaining power of the CEO.
3.3.2. Death- and Health-Related CEO Turnover and Board Dynamics
Assigning a causal interpretation to the dynamics of board structure documented in the
previous section is difficult because unobserved changes at the firm (e.g., variation in investment
opportunities or strategies) may drive both CEO turnover and board independence (e.g., Casamatta
and Guembel, 2010). To address this challenge, we study a subsample of CEOs for which turnover
occurs for plausibly exogenous reasons, namely due to death or serious health issues of the
previous CEO.22 This analysis also highlights how the CEO tenure effect on board independence
21 In unreported analysis, we also find that the Table 2 increasing effects of tenure on dual chairmanship and compensation are stronger when we instrument tenure using ROA. 22 We thank Charlie Hadlock and Timothy Quigley for sharing their datasets of CEO turnovers from 1989 to 2006 and from 1950 to 2011, respectively. We supplement their samples with our own data collection. Specifically, we use the following sources to ascertain whether the previous CEO died or had serious health problems (such as cancer or a heart attack) which forced her to step down. First, we collect names of CEOs who died and the dates of death from the obituary section of Standard and Poor’s Register of Corporations, Directors, and Executives (‘S&P Register’) from 1950 to 2011 (Quigley, Crossland, and Campbell, 2016 also use this source). Second, we follow Fee, Hadlock, and Pierce (2013) and use news searches to collect additional CEO changes due to death or health reasons at public firms from 1968 to 2011. Third, we supplement this set of death and health events by examining all CEO turnovers in our database from 1973 to 2011 that are not identified above, and determine whether they are due to death or serious
19
varies with perceived CEO ability and related uncertainty. First, CEOs appointed in sudden
death/health transitions are likely to have less power than their predecessors, relative to new CEOs
in the typical insider transition depicted in Panel A of Figure 5. (Consistent with this conjecture,
we find that the CEOs who died in office had longer tenure, and were much more likely to have
been board chair, relative to typical CEOs who leave office.) Additionally, these firms will have
had less opportunity for succession planning and grooming the new CEO, increasing uncertainty
about her ability in the job.
We estimate equation (2) using the 94 death and health CEO turnover events that we are
able to match to our CEO and board database in which the new CEO is an insider. Estimates in
Panel D of Figure 5 generally support the conclusion from Panel A: These CEO turnovers lead to
an immediate increase in board independence of about 2 percentage points in the year of turnover
(significant at the 5% level). After the initial sharp increase in board independence, a gradual
decrease begins in year t+6, and the decrease sharply accelerates after year 10. These patterns are
consistent with bargaining model predictions: A new CEO who presumably has weaker bargaining
power and is subject to greater uncertainty about her ability would initially face a relatively strong
board but is able to eventually bargain for a weaker board over time as she accumulates tenure and
uncertainty about her ability declines.
3.3.3. New External CEOs and Board Dynamics
Next, we examine board dynamics when a new, external CEO is appointed (i.e., not a
previous officer of the firm). Given that a new outsider CEO likely has less experience or expertise
with the firm than does an insider, hiring an outsider may increase the importance of the board’s
advisory role, which might best be provided by insider directors (e.g., Mace, 1986; Song and
health issues of the CEO by searching for news articles using Factiva. (News articles from Factiva are sparse prior to the mid-1970s.)
20
Thakor, 2006; Adams and Ferreira, 2007). In Panel E of Figure 5, the patterns are different. Board
independence decreases by 2.6 percentage points in the turnover year when the new CEO is an
external hire, in stark contrast with results for new internal CEOs above. The decrease is significant
at the 1% level. Thus, the negative relation between CEO tenure and board independence
documented above is offset when (advisory role of the board) theory suggests that it might be.
Board independence increases rapidly in the first few years of an outsider CEO’s tenure,
offsetting most of the initial decline by year t+7. The increase from years t to t+7 is significant at
the 5% level. This pattern is consistent with the new external CEO gaining more experience within
the firm, which would reduce the need for internal advisor-directors on the board. Board
independence eventually shows the familiar decrease after year t+8, though the decrease is
statistically insignificant. Overall, the dynamics of board structure for external CEO appointments
seem consistent with the advisory role of the board playing a dominant role, at least initially, in
contrast to the bargaining power and monitoring effects that appear to dominate for internal CEO
appointments.
3.3.4. Uncertainty about CEO Ability and the Tenure-Board Independence Relation
In Hermalin and Weisbach’s (1998) framework, the board monitors the CEO more
intensely when her ability is known less precisely because the marginal benefit of monitoring (i.e.,
collecting more information) is greater. Above we presented evidence consistent with greater
board monitoring when uncertainty is high (when a new CEO is hired) and less monitoring (i.e., a
reduction in board independence) as this uncertainty is resolved over the CEO’s tenure. To explore
this issue in more detail, we now examine how board structure varies across CEOs about whom
the board likely has the most uncertainty (CEOs who were ‘external’ to the firm when hired; Pan,

21
Wang, and Weisbach, 2015) and the least uncertainty (the ‘first’ CEO of the firm, such as the
founder).
Table 4 shows results from an augmented version of equation (1) that includes interaction
terms to capture uncertainty about CEO ability. The negative effect of tenure on board
independence is most pronounced for first CEOs (-0.360) and least pronounced for external CEOs
(-0.068), with internally promoted CEOs in the middle. This finding is consistent with the
prediction that the effect of CEO power and tenure on board independence decreases in the amount
of uncertainty about CEO ability. The differences in the tenure-independence relation between the
first CEOs and internal or external CEOs are sizeable (-0.268 = -0.360 – (-0.092) or -0.292 = -
0.360 – (-0.068)) and significant at the 1% level.
3.3.5. Shocks to CEO Power: Hedge Fund Activism and Recessions
External shocks to CEO power can potentially limit the ability of CEOs to bargain for
reduced board independence as their tenures increase. We examine two external forces that can
affect CEO power relative to the board: activist investors and economic recessions.
First, we investigate how hedge fund activists affect the CEO tenure-board independence
relation (see e.g., Brav et al., 2008). For example, large active shareholders can limit the influence
of CEOs (and management in general) on operations and governance of the firm, including
selecting directors, with the ultimate goal of maximizing shareholder value (Shleifer and Vishny,
1986). We draw events of activist hedge funds targeting public firms from an extended version of
the sample used in Brav, Jiang, and Kim (2009) from 1994-2008, and match them with our
database of directors and officers. We estimate the following equation to measure the effect of
hedge fund activists affecting the relation between CEO tenure and board independence within
firms:
22
Independence α α β CEOtenure β CEOtenure Target
β CEOtenure Target After X γ ε , (3)
where a dummy variable Target is equal to one for firm-years that are targeted by an activist hedge
fund23 plus or minus 10 years of the targeting date, and zero otherwise; and After is equal to one
for the 10 firm-years after the targeting date, and zero otherwise. In addition to these targeted firms,
we include non-targeted firms from 1984 to 2011, resulting in a sample of 37,685 firm-years.
Column 1 of Table 5 shows estimation results for equation (3). A significantly negative
coefficient on CEO tenure confirms that long-tenure CEOs face less independent boards in this
subsample, consistent with the baseline result. The negative coefficient on CEO tenure × Target
(-0.077) suggests that prior to actual targeting, the ultimately targeted firms exhibited a stronger
effect of tenure on board independence, although this effect is insignificant. The key coefficient of
interest, CEO tenure × Target × After (0.302, t-stat = 1.80), shows that relative to years before
activism, the effect of CEO tenure on board independence is significantly reduced after targeting.
As a result, the effect of CEO tenure on board independence turns positive (0.135 = -0.090 - 0.077
+ 0.302) and statistically insignificant (t-stat = 0.96). Thus, we document that activists place more
outside directors on boards, and in the context of Hermalin and Weisbach, we also highlight the
attenuated effects of CEO tenure on boards after the shock to CEO power. Our evidence is
consistent with hedge funds disrupting the influence of powerful CEO’s on boards; that is, a
negative shock to CEO power undoes the association between long-tenured CEOs and dependent
boards.
23 We follow Brav et al. (2009) and define activist investor targeting as when the fund files Schedule 13D filings indicating that it owns at least 5% of any class of a company’s shares and intends to influence corporate control. They supplement this sample using news searches to identify activism events at larger companies, in which the activist holds an ownership stake between 2% and 5%.

23
Next, we examine whether business cycles influence CEO power and board dynamics.
Song and Thakor (2006) theoretically show that a firm’s internal governance (such as the board’s
monitoring) tends to be weaker in “good times” relative to “bad times.” The intuition is that due
to the CEO’s career concerns, she is more willing to disclose high-precision information and to
select the most talented directors (and thus strong monitors) during economic downturns.
We test this implication in column 2 by including CEO tenure × Recession (which equals
one for years during NBER recessions, and zero otherwise) in equation (1). The coefficient on the
interaction term is 0.031 and significant at the 10% level, consistent with the idea that CEO power
is weaker in downturns. Thus, both of these external shocks temper the effects of CEO tenure on
board structure in ways consistent with bargaining between a somewhat weaker CEO and the board.
3.3.6. CEO Tenure and Governance Outcomes Following 2002-2003 Regulations
Table 6 examines the effect of CEO tenure on corporate governance outcomes (board
independence, chairman duality, and CEO compensation) separately for years before and after
2002. During 2002-2003, various new regulations and laws (e.g., imposed by SOX, NYSE, and
NASDAQ) began to require firms to increase board independence up to certain levels (see
Chhaochharia and Grinstein, 2007; Duchin et al., 2010). These regulations therefore might reduce
the ability of powerful CEOs to increase board independence. Consistent with this conjecture,
column 1 shows that the coefficient on “Firm age × Post 2002,” which captures an increased time
trend of board independence post-2002, is 0.056 and significant at the 1% level. More importantly,
the coefficient on “CEO tenure × Post 2002” is 0.110, suggesting that after 2002, CEO tenure has
essentially no impact on board independence (-0.151 + 0.110 = -0.041; t-statistic = -0.80). This
result is consistent with the new regulations ending the effect of CEO tenure on board
independence.

24
While the regulations increased board independence as intended, Hermalin and Weisbach
(p. 111) argue that “As long as the bargaining process [between the CEO and board] itself is
unaffected by reforms, the equilibrium will be little affected.” Thus, we might expect to find
powerful CEOs bargaining for greater rewards in other dimensions, to offset their reduced
influence on board independence. Consistent with this conjecture, the coefficients on “CEO tenure”
and “CEO tenure × Post 2002” are 0.022 (t-stat = 24.66) and 0.005 (t-stat = 3.03) in column 2,
indicate that the years after the 2002 regulations saw increased chairman duality for long-tenured
CEOs. This result is consistent with firms substituting a dual chairman role for low board
independence in response to Sarbanes-Oxley and related regulations. Column 3 explores whether
the regulations affected compensation. The coefficient on “CEO tenure × Post 2002” is 0.013,
suggesting somewhat higher compensation post-2002, although this finding is insignificant.
4. Persistence of Board Independence
Hermalin and Weisbach (1998) argue that board independence should exhibit persistence
or path-dependence over time: “Strong, independent boards will beget stronger, more independent
boards than will weak boards” (p.107). Thus, we expect (i) persistence in board independence, and
that (ii) initial board independence will explain subsequent independence within firms.
We examine the persistence prediction in Figure 6. In each calendar year from 1918 to
1992, we sort all firms into four equal-sized groups based on their board independence ratio, and
compute the groups’ average independence ratios for the next 30 years. We repeat this process for
all calendar years from 1918 to 1992 and then average across the calendar years. Figure 6 shows
that consistent with Hermalin and Weisbach (1998), board independence ratios are persistent over
30 years. While there is an amount of “convergence” over time, it is still the case that firms with
25
an initially low level of board independence exhibit lower independence on average, relative to
those with an initially high level of independence even after 30 years, and vice versa.
Second, we follow Lemmon, Roberts, and Zender’s (2008) capital structure analysis and
formally test the prediction that initial board independence is a significant determinant of future
independence, by including the initial board independence ratio for each firm in equation (1), and
excluding firm fixed effects. Table 7, Panels A and B use the full sample and subsamples consisting
of the cross-section of firms that survives five, 10, and 20 years, respectively. In both panels, the
coefficient on initial independence is positive and highly significant (at a less than 1% level). In
terms of economic magnitude, column 3 of Panel B, which controls for firm-level characteristics,
shows that a one-SD increase in the initial independence (20 percentage points) leads to a 6.5
percentage point increase in board independence 20 years after observing the initial independence.
This high degree of persistence helps explain the more modest effect of CEO tenure on
independence within firms (e.g., 0.15 percentage points for an additional year of tenure in column
3 of Panel B).
Third, persistence is also evident in Table 7, Panel C, which shows the probability of
transition from one quartile of board independence to another. In each year, we sort firms into
quartiles based on board independence and follow them for the 10 years. The panel shows that
board independence is particularly persistent in the two extreme quartiles. For example, 81.7% of
firms in the lowest quartile in year 0 are still in the quartile the following year; and the probability
of remaining in the same quartile is 57.9% 10 years after the initial sorting. (Unreported analysis
shows that many of the 18.3% that left quartile 1 by year 1 were near the quartile border; that is,
initially in the 21st to 25th percentiles.) Similarly, 76.7% (45.4%) of firms in the highest quartile in
year 0 remain in the same quartile one year (10 years) later.

26
5. Effect of CEO Power on CEO Turnover-Performance Sensitivity
The evidence above is largely consistent with CEOs gaining power over time and
bargaining for less independent boards that monitor them less intensely. To the extent this is true,
are the jobs of powerful CEOs relatively protected, and if so, do long-tenure, powerful CEOs
eventually become entrenched and adversely affect firm value? To investigate these questions, we
start by examining CEO replacement conditional on her performance.24 Bargaining models in
which the board learns about CEO ability from realized performance (e.g., Hermalin and Weisbach,
1998) predict that powerful CEOs, who presumably have high perceived ability, would be
optimally fired less often conditional on poor performance. A similar prediction comes from
models with potential CEO entrenchment (e.g., Taylor, 2010): performance-CEO turnover
sensitivity is lower when the CEO has more power. (In Section 6 we use a natural experiment that
attempts to distinguish between these differing long-run implications of the effects of powerful
CEOs on firm value.)
We begin by estimating a linear probability model to predict CEO turnover conditional on
firm performance using our full sample of firm-years from 1918 to 2011 (see Weisbach, 1988;
Warner and Watts, 1988; Jenter and Lewellen, 2014). Specifically, we estimate the following
equation using Ordinary Least Squares:
CEOturnover α α β1ΔROA β2Excessreturn X δ ε , (4)
where CEO turnoverit is a dummy variable equal to one if the current CEO is different from the
previous year’s CEO, and zero otherwise; ΔROAit is the change in return on assets; Excess returnit
is the stock return minus value-weighted market return from CRSP; Xit is a vector of firm-level
24 We proxy for the decision to fire the CEO using a CEO turnover dummy which is equal to one if the current CEO is different from the previous year’s CEO, and zero otherwise (e.g., Jenter and Lewellen, 2014).
27
controls including CEO tenure, log book assets, and Tobin’s q for firm i in year t; and standard
errors are clustered at the firm level.25 Note that while the specification generally follows those in
Weisbach (1988) and Warner and Watts (1988), we include firm fixed effects to account for
unobserved firm-level heterogeneity in the propensity to replace the CEO. When stock returns are
included in the equation, we confine the estimation to the years after 1925 to align with the
availability of CRSP data.
Table 8, Panel A presents baseline turnover estimates using more than 71,000 firm-year
observations and 11,000 CEO turnover events. Column 1 documents that a decrease in profitability
leads to a significantly higher probability of CEO turnover for both contemporaneous and lagged
operating performance. Similarly, column 2 shows that lower excess stock returns (both
contemporaneous and lagged) predict a significantly higher probability of CEO turnover (Warner,
Watts, and Wruck, 1988). Column 3 confirms that changes in ROA and excess stock returns are
significant predictors of CEO turnover when both are included in the regression. Relative to
previous research focusing on one type of performance measure (e.g., Warner and Watts (1988);
Jenter and Lewellen (2014) using stock returns), or finding a stronger effect of operating
performance than stock returns on CEO turnover (e.g., Weisbach (1988); Murphy and Zimmerman
(1993)), our analysis finds that both affect CEO turnover in a significant fashion, which is likely
due to greater power from having more data. Columns 4 to 6 include only contemporaneous ROA
and excess stock returns, and show quantitatively similar results with columns 1 to 3.
Our focus is on the effects of CEO power on CEO turnover-performance sensitivity. We
measure power with four proxies: Board independence, CEO-chairman duality, past performance,
and CEO tenure (Adams, Almeida, and Ferreira, 2005; Morse, Nanda, and Seru, 2011). We start
25 CEO age is not available for firm-years obtained from Moody’s and Mergent. Thus, we do not include it as a control variable.
28
with the classic proxy for monitoring intensity of the board: the board independence ratio. Column
1 of Table 8, Panel B shows that less independent boards are associated with significantly lower
operating performance sensitivity of CEO turnover. Our result is based on within-firm variation
and is consistent with Weisbach’s (1988) cross-sectional finding.26 Column 2 uses a dummy
variable for CEO-chairman dual title as a proxy for CEO power and shows that dual chairman-
CEOs face a significantly lower sensitivity of turnover to performance measured by either changes
in ROA or excess stock returns.
Next, we directly examine whether CEOs who have performed well in the past three years
face different turnover decisions conditional on current performance. Columns 3 (4) examines the
subset of firms with higher ROA (stock returns) than the median firm in the past three years.
Consistent with good past performance making the CEO powerful, we find that current
performance (proxied either by changes in ROA or excess stock returns) has little effect on her
turnover when the CEO’s performance in the past three years is better than the median. Lastly,
column 5 measures CEO power with a “High tenure” dummy which is equal to one if CEO tenure
is larger than or equal to its third quartile (nine years) and shows that powerful CEOs face only
half the stock return-turnover sensitivity of less powerful CEOs. Overall, results in this section are
consistent with powerful CEOs being somewhat shielded from board monitoring and in particular,
the risk of being fired due to poor firm performance.27
6. Do Powerful CEOs Affect Long-Term Shareholder Value? CEO Power and
Abnormal Returns around Death- and Health-Related CEO Turnover
26 Weisbach’s (1988) results are based on logit regressions without accounting for firm-level heterogeneity in turnover intensity. 27 Dikolli et al. (2014) show that performance-related CEO turnover declines in CEO tenure for Execucomp firms.
29
The results in the previous sections are consistent with CEO bargaining power affecting
board structure and chief executive replacement decisions. These findings beg an important
question: Do powerful CEOs add value to the firm (consistent with them having “high ability”),
or do they eventually become entrenched and potentially reduce value in the long run? To address
this question, we examine market reactions to CEO turnover, conditional on the power of the
departing CEO.28 We use three proxies for CEO power: tenure, chairman duality, and founder
status. To examine plausibly exogenous CEO turnover, we use events of death and health-related
CEO turnover to estimate the effect of the CEO on firm value (see e.g., Bennedsen, Perez-
Gonzalez, and Wolfenzon, 2010; Jager, 2016). We first estimate excess daily stock returns using
a market model
ε R R (5)
from day -2 to day +2, where Rit is the rate of stock return for firm i on day t, and Rmt is the rate of
return for the market portfolio (proxied by “vwretd” from CRSP). We compute cumulative excess
returns during the [-2, +2] window around the announcement of CEO turnover by compounding
the daily excess returns from days -2 to +2.29
Section 3.3.2 describes how we identify death and health events. To determine the
announcement date of the event, we first obtain dates (or often year-months) of CEO deaths from
the obituary section of S&P Register, and CEO death and health-related events from Hadlock, Fee,
and Pierce (2013) and Quigley, Crossland, and Campbell (2016) for the 1950 to 2011 period.
Second, we search news articles for these CEO death and health events using Factiva and other
sources, to identify the exact announcement date of death or health-related events. If there are
28 Previous research finds generally weak average announcement returns around CEO turnover due to death of the CEO (e.g., Johnson et al., 1985; Jenter et al., 2016).
29 The results are robust to alternative event windows such as [-3, +3], [-2, +3], and [-1, +2].
30
multiple news articles, we use the first publication date available as the event date. We also collect
founder status from the news articles. Lastly, we match each of these events with our officer and
director database using firm identifiers, names, and event dates. To increase sample size, in this
analysis only we include NASDAQ firms in addition to NYSE/AMEX firms. This sample
selection process results in 319 events with matched information on directors and officers. The
average cumulative abnormal return for death and health events is 0.78%, which is similar to the
0.66% average buy-and-hold-abnormal return during the month of announcement of death
documented by Jenter, Matveyev, and Roth (2016).
Table 9 shows the results of regressing cumulative excess return in response to plausibly
exogenous CEO turnover on various proxies for CEO power: (1) A dummy for CEO tenure in the
upper quartile (at least ten years), (2) a dummy for whether the CEO also holds a board chairman
title, and (3) a dummy for whether the departing CEO is the founder of the firm. Across the
columns of Panel A, death-related CEO turnover is associated with 2.5% to 4.0% higher
announcement returns when the departing CEO was more powerful (i.e., longer tenure, held the
chairman title, or a founder), and the differences are significant at the 1% to 10% levels. In contrast,
exogenous departures of CEOs who had relatively little power before stepping down entail
insignificant announcement returns ranging -1.4% to -0.1%, as captured by the regression
constant.30 Panel B uses data on both death and health-related events and provides similar evidence.
These findings are consistent with the argument that powerful CEOs can become entrenched, and
thus removing CEOs (which presumably would have been costly without a death occurrence)
30 In a contemporaneous paper, Jenter et al. (2016) find a negative market reaction to the deaths of founder CEOs, which they interpret as reflecting the value of CEO-firm matching. They find positive market reactions to the deaths of old founders and in some specifications, long-tenure CEOs. Salas (2010) finds that market reactions to deaths of older, longer tenured, and founder CEOs are significantly positive only when their firms performed poorly in the years prior to the death. Our analysis in this section complements these findings by documenting how the market reacts to the death of a CEO conditional on several measures of CEO power in the context of the Hermalin and Weisbach (1998) bargaining model.

31
would increase shareholder value. Note that the economic magnitudes of our estimates in Table 9
are approximately equal to those in Taylor (2010), who uses a structural model to estimate that
shareholder value would increase by 3% if the perceived cost of removing (entrenched) CEOs was
eliminated.
7. Conclusion
We construct a new database of more than 90,000 firm-year observations over 94 years to
explore dynamic interactions between the CEO and board of directors. Given our long panel of
data, we are able to provide robust within-firm empirical evidence largely consistent with the rich
and nuanced within-firm predictions of governance models such as Hermalin and Weisbach (1998).
Consistent with successful CEOs gaining power that is reflected in their longevity at their firms,
we find that board independence decreases with CEO tenure. These long-tenure (powerful) CEOs
also are more successful at becoming board chair and earning higher compensation. The CEO
tenure-board independence relation is attenuated in circumstances that plausibly reduce relative
CEO power, such as recessions and being targeted by activist investors. The relation strengthens
when board incentives to monitor weaken, such as following strong CEO performance or a decline
in uncertainty about the CEO’s ability. We also find that board structure is persistent in that board
independence lagged 20 or 30 years is by far the strongest predictor of board independence today,
suggesting that a board once weakened may remain weak far into the future (or vice versa). Future
research should attempt to uncover the frictions or other forces that lead to strong board persistence.
We explore CEO turnover events in detail. There is a jump in board independence when a
new internal CEO is appointed, consistent with a prediction that new CEOs are relatively less
powerful or subject to more uncertainty about their abilities. In contrast, boards become less

32
independent when an external CEO is hired, consistent with external CEOs benefiting more from
the advisory role of the board (Adams and Ferreira, 2007) than from monitoring. We also find that
powerful CEOs are less likely to be replaced conditional on poor performance. Given this greater
job security of powerful CEOs, we investigate whether powerful CEOs might become entrenched
in the sense that replacing the CEO would increase firm value. To achieve some degree of
exogeneity, we study market reactions when turnover occurs because a CEO dies in office. We
find no market reaction to the typical CEO death, but we find a positive reaction when powerful
(long-tenure, dual board chair, founder) CEOs die in office. This is consistent with powerful CEOs
becoming entrenched.
Broadly speaking, our results are consistent with multidimensional bargaining between
CEOs and the board. We find evidence that regulation succeeded in reducing one outcome from
these negotiations (less board dependence following new stock exchange listing requirements) but
not necessarily preventing other outcomes, such as the CEO being appointed board chair, perhaps
in substitution for reduced post-regulation board independence. Thus, not finding evidence of a
negative relation between board independence and CEO tenure post-2002 does not necessarily
mean that CEO-board bargaining dynamics do not occur – they might still occur at a different
negotiating point.
Overall, our evidence is consistent with the life-cycle of powerful CEOs being that (on
average) they are successful early in their careers and hence gain power, they use this power to
achieve job security, dual chair roles and greater pay, and eventually on average powerful CEOs
become entrenched. Given that these are likely to be equilibrium outcomes of a dynamic
bargaining process, our tests do not always allow us to prove causality of these results, but they do
suggest interesting avenues for future research.

33
References:
Adams, Renee B., Heitor Almeida, and Daniel Ferreira, 2005, Powerful CEOs and Their Impact on
Corporate Performance, Review of Financial Studies 18, 1430-1432.
Adams, Renee B. and Daniel Ferreira, 2007, A theory of friendly boards, Journal of Finance 62, 217-250.
Adams, Renee B., Hermalin, Benjamin E., and Michael S. Weisbach, 2010, The role of boards of directors
in corporate governance: A conceptual framework and survey, Journal of Economic Literature 48, 58-
107.
Almazan, Andres, and Javier Suarez, 2003, Entrenchment and Severance Pay in Optimal Governance
Structures, Journal of Finance 58, 519-547.
Avedian, Arevik, Henrik Cronqvist, and Marc Weidenmier, 2015, Corporate governance and the creation
of the SEC, Working paper, Harvard University, University of Miami, and Claremont Colleges.
Baldenius, Tim, Nahum Melumad, and Xiaojing Meng, 2014. Board composition and CEO power. Journal
of Financial Economics 112, 53-68.
Baker, Malcolm and Paul Gompers, 2003, The determinants of board structure at the initial public offering,
Journal of Law and Economics 42, 569-598.
Bennedsen, Morten, Francisco Perez-Gonzalez, and Daniel Wolfenzon, 2010, Do CEOs matter? Working
paper, INSEAD, Stanford, and Columbia.
Bertrand, Marianne, and Sendhil Mullainathan, 2001, Are CEOs rewarded for luck? The ones without
principals are, Quarterly Journal of Economics 116, 901-932.
Boone, Audra L., Laura Casares Field, Jonathan M. Karpoff, Charu G. Raheja, 2007, The determinants of
corporate board size and composition: An empirical analysis, Journal of Financial Economics 85,
66–101.
Brav, Alon, Wei Jiang, Frank Partnoy, and Randall Thomas, 2008, Hedge fund activism, corporate
governance, and firm performance, Journal of Finance 63, 1729–75.
Brav, Alon, Wei Jiang, and Hyunseob Kim, 2009, Hedge fund activism: A review, Foundations and Trends
in Finance 4, 185-246.
Casamatta, Catherine and Alexander Guembel, 2010, Managerial legacies, entrenchment, and strategic
inertia, Journal of Finance 65, 2403-2436.
Chhaochharia, Vidhi and and Yaniv Grinstein, 2007, Corporate governance and firm value: The impact of
the 2002 governance rules, Journal of Finance 62, 1789-1825.
Coles, Jeffrey L., Naveen D. Daniel, Lalitha Naveen, 2008, Boards: Does one size fit all?, Journal of
Financial Economics 87, 329-356.
Coles, Jeffrey L., Naveen D. Daniel, Lalitha Naveen, 2014, Co-opted Boards, Review of Financial Studies
27, 1751-1796.
34
Dahya, Jay, John J. McConnell, and Nickolaos G. Travlos, 2002, The Cadbury Committee, corporate
performance, and top management turnover, Journal of Finance 57, 461-483.
Dikolli, Shane S., William J. Mayew, and Dhananjay Nanda, 2014, CEO tenure and the performance-
turnover relation, Review of Accounting Studies 19, 281–327.
Duchin, Ran, John G. Matsusaka, and Oguzhan Ozbas, 2010, When are outside directors effective? Journal
of Financial Economics 96, 195-214.
Fahlenbrach, Rudiger, Angie Low, and Rene Stulz, 2010, Why do firms appoint CEOs as outside directors?,
Journal of Financial Economics 97, 12-32.
Fee, C. Edward, Charles J. Hadlock, and Joshua R. Piece, 2013, Managers with and without style: Evidence
using exogenous variation, Review of Financial Studies 26, 567-601.
Frydman, Carola, Eric Hilt, and Lily Y. Zhou, 2015, Economic effects of early ‘shadow banks’: Trust
companies and the panic of 1907, Journal of Political Economy 123, 902-940.
Graham, John R., Mark Leary, and Michael Roberts, 2015, A century of capital structure: The leveraging
of corporate America, Journal of Financial Economics 118, 658-683.
Hermalin, Benjamin E. and Michael S. Weisbach, 1998, Endogenously chosen boards of directors and their
monitoring of the CEO, American Economic Review 88, 96-118.
Huson, Mark R., Robert Parrino, and Laura T. Starks, 2001, Internal monitoring mechanisms and CEO
turnover: A long-term perspective, Journal of Finance 56, 2265-2296.
Huson, Mark R., Paul H. Malatesta, and Robert Parrino, 2004, Managerial succession and firm performance,
Journal of Financial Economics 74, 237-275.
Jäger, Simon, 2016, How substitutable are workers? Evidence from worker deaths, Working paper, Harvard
University.
Jayaraman, Narayanan, Vikram Nanda, and Harley E. Ryan, Jr., 2015, Does combining the CEO and chair
roles cause poor firm performance?, Working paper, Georgia Tech.
Jenter, Dirk and Katharina Lewellen, 2014, Performance-induces CEO turnover, Working paper, Stanford
and Dartmouth.
Jenter, Dirk, Egor Matveyev, and Lukas Roth, 2016, Good and Bad CEOs, Working paper, LSE and
University of Alberta.
Johnson, W. Bruce, Robert P. Magee, Nandu J. Nagarajan, and Harry A. Newman, 1985, An analysis of
the stock price reaction to sudden executive deaths: Implications for the managerial labor market,
Journal of Accounting and Economics 7, 151-174.
Kaplan, Steven N. and Bernadette A. Minton, 2012, How has CEO turnover changed?, International Review
of Finance 12, 57-87.

35
Lehn, Kenneth M., Sukesh Patro, and Mengxin Zhao, 2009, Determinants of the size and composition of
US corporate boards, Financial Management 38, 747-780.
Lemmon, Michael L., Michael R. Roberts, and Jamie Zender, 2008, Back to the beginning: Persistence and
the cross-section of corporate capital structure, Journal of Finance 63, 1575-1608.
Morse, Adair, Vikram Nanda, and Amit Seru, 2011, Are incentive contracts rigged by powerful CEOs?,
Journal of Finance 66, 1779-1821.
Murphy, Kevin J. and Jerold L. Zimmerman, 1993, Financial performance surrounding CEO turnover,
Journal of Accounting and Economics 16, 273-315.
Murphy, Kevin J. and Jan Zabojnik, 2007, Managerial capital and the market for CEOs, Working paper,
University of Southern California.
National Association of Corporate Directors, 1996, NACD Blue Ribbon Commission on Director
Professionalism.
Pan, Yihui, Tracy Yue Wang, and Michael S. Weisbach, 2015, Learning about CEO ability and stock return
volatility, Review of Financial Studies 28, 1623-1666.
Quigley, Timothy J., Craig Crossland, and Robert J. Campbell, 2016, Shareholder perceptions of the
changing impact of CEOs: Market reactions to unexpected CEO deaths, 1950 – 2009, Strategic
Management Review forthcoming.
Salas, Jesus M., 2010, Entrenchment, governance, and the stock price reaction to sudden executive deaths,
Journal of Banking and Finance 34, 656-666.
Shivdasani, Anil and David Yermack, 1999, CEO involvement in the selection of new board members: An
empirical analysis, Journal of Finance 54, 1829–1853.
Shleifer, Andrei, and Robert W. Vishny, 1986, Large shareholders and corporate control, Journal of
Political Economy 94, 461-488.
Shleifer, Andrei, and Robert W. Vishny, 1997, A survey of corporate governance, Journal of Finance 52,
737-783.
Song, Fenghua, and Anjan V. Thakor, 2006, Information control, career concerns, and corporate
governance, Journal of Finance 61, 1845-1896.
Taylor, Lucian A., 2010, Why are CEOs rarely fired? Evidence from structural estimation, Journal of
Finance 65, 2051-2087.
Wangler, Lawrence A., 1994, The real world of separate chairmen.
Warner, Jerold B and Ross L. Watts, 1988, Stock prices and top management changes, Journal of Financial
Economics 20, 461-492.
Weisbach, Michael S., 1988, Outsider directors and CEO turnover, Journal of Financial Economics 20,
431-460.
36
Appendix - Robustness Tests for Subsamples and Firm Survival
In this appendix, we describe two robustness tests. First, we split the full sample into
subsamples by time period to examine whether the effect of CEO tenure on board independence
is robust in various sub-periods. Second, we repeat our estimation using subsamples consisting of
firms that survive for more than T years, where T=2, 5, 10, or 15.
The appendix table presents results for these tests. Columns 1 to 3 of Panel A split the full
sample into three non-overlapping time periods (1918-1947, 1948-1977, and 1978-2011) and find
that the board independence-CEO tenure effect generally decreases over the century. Column 4
uses a subsample consisting of firm-years from 1996 to 2011, which mimics potential samples
from modern databases of corporate directors, such as Institutional Shareholder Service’s Risk
Metrics. We find that the coefficient on CEO tenure is -0.022 and insignificant for the subsample,
which is not surprising given that a substantial fraction of firm-years in that sample are affected
by post-2002 regulations on board independence (see Section 3.3.6). This insignificant result for
the modern sample suggests that employing a long panel data that starts well before 2002 is
important when testing board independence implications from dynamic bargaining models
between the CEO and board. Even though column 4 finds no evidence in the modern era for the
within-firm prediction from the HW model, column 5 shows that without firm fixed effects, the
modern sample produces a strong negative relation between CEO tenure and board independence
in the cross section. This again highlights the importance of studying these issues using a long
sample that permits within-firm tests.
In Panel B, we estimate equation (1) for subsamples consisting of firms that exist in the
database more than 15 years (or more than 10 years, etc.). Subsetting in this manner allows us to
examine whether our within-firm results hold for firms with a long history and therefore are not
driven by sample composition effects (new or short-lived firms entering the full sample). Column
1 shows the baseline estimate from column 4 of Table 2, Panel A as a basis for comparison. Across
the columns, the coefficients on CEO tenure are very similar, suggesting that our results are in fact
driven by (long) within-firm dynamics.
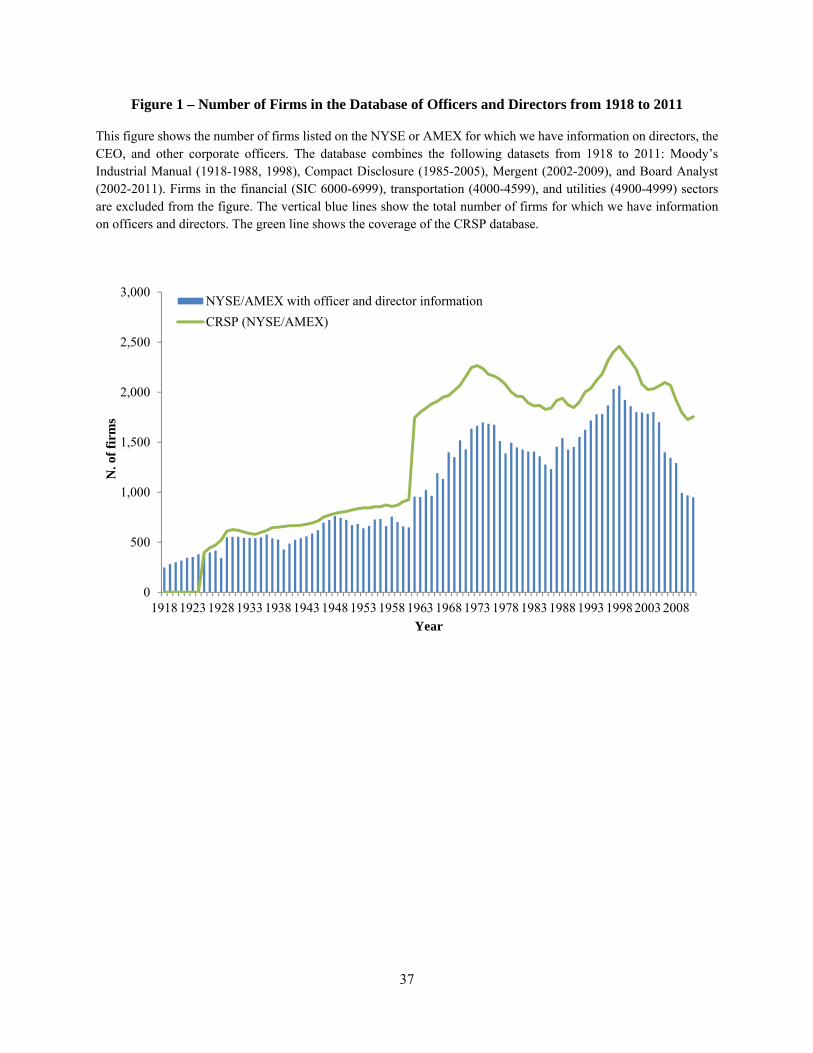
37
Figure 1 – Number of Firms in the Database of Officers and Directors from 1918 to 2011
This figure shows the number of firms listed on the NYSE or AMEX for which we have information on directors, the CEO, and other corporate officers. The database combines the following datasets from 1918 to 2011: Moody’s Industrial Manual (1918-1988, 1998), Compact Disclosure (1985-2005), Mergent (2002-2009), and Board Analyst (2002-2011). Firms in the financial (SIC 6000-6999), transportation (4000-4599), and utilities (4900-4999) sectors are excluded from the figure. The vertical blue lines show the total number of firms for which we have information on officers and directors. The green line shows the coverage of the CRSP database.
0
500
1,000
1,500
2,000
2,500
3,000
1918 1923 1928 1933 1938 1943 1948 1953 1958 1963 1968 1973 1978 1983 1988 1993 1998 2003 2008
N. o
f fi
rms
Year
NYSE/AMEX with officer and director information
CRSP (NYSE/AMEX)
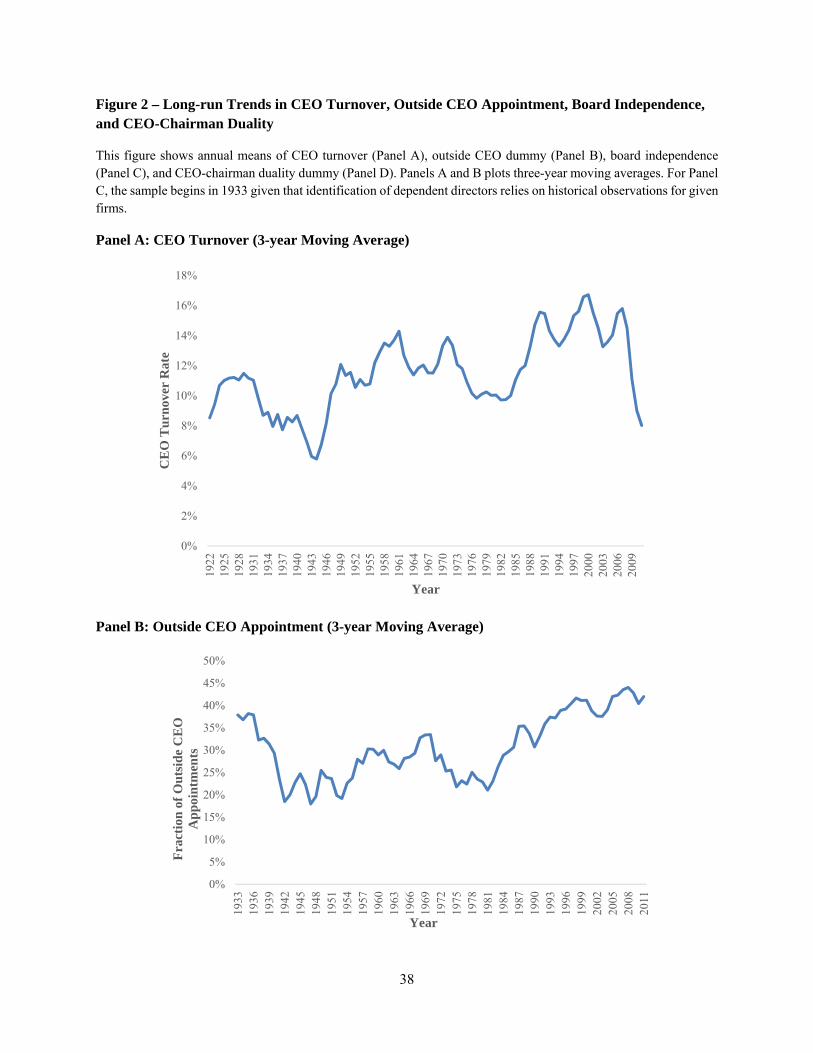
38
Figure 2 – Long-run Trends in CEO Turnover, Outside CEO Appointment, Board Independence, and CEO-Chairman Duality
This figure shows annual means of CEO turnover (Panel A), outside CEO dummy (Panel B), board independence (Panel C), and CEO-chairman duality dummy (Panel D). Panels A and B plots three-year moving averages. For Panel C, the sample begins in 1933 given that identification of dependent directors relies on historical observations for given firms.
Panel A: CEO Turnover (3-year Moving Average)
Panel B: Outside CEO Appointment (3-year Moving Average)
0%
2%
4%
6%
8%
10%
12%
14%
16%
18%
1922
1925
1928
1931
1934
1937
1940
1943
1946
1949
1952
1955
1958
1961
1964
1967
1970
1973
1976
1979
1982
1985
1988
1991
1994
1997
2000
2003
2006
2009
CE
O T
urn
over
Rat
e
Year
0%
5%
10%
15%
20%
25%
30%
35%
40%
45%
50%
1933
1936
1939
1942
1945
1948
1951
1954
1957
1960
1963
1966
1969
1972
1975
1978
1981
1984
1987
1990
1993
1996
1999
2002
2005
2008
2011
Fra
ctio
n o
f O
uts
ide
CE
O
Ap
poi
ntm
ents
Year

39
Panel C: Board Independence
Panel D: CEO-Chairman Duality
0%
10%
20%
30%
40%
50%
60%
70%
80%
1933
1936
1939
1942
1945
1948
1951
1954
1957
1960
1963
1966
1969
1972
1975
1978
1981
1984
1987
1990
1993
1996
1999
2002
2005
2008
2011
Boa
rd I
nd
epen
den
ce R
atio
Year
0%
10%
20%
30%
40%
50%
60%
70%
80%
1918
1921
1924
1927
1930
1933
1936
1939
1942
1945
1948
1951
1954
1957
1960
1963
1966
1969
1972
1975
1978
1981
1984
1987
1990
1993
1996
1999
2002
2005
2008
2011
Ch
airm
an D
ual
ity
Year
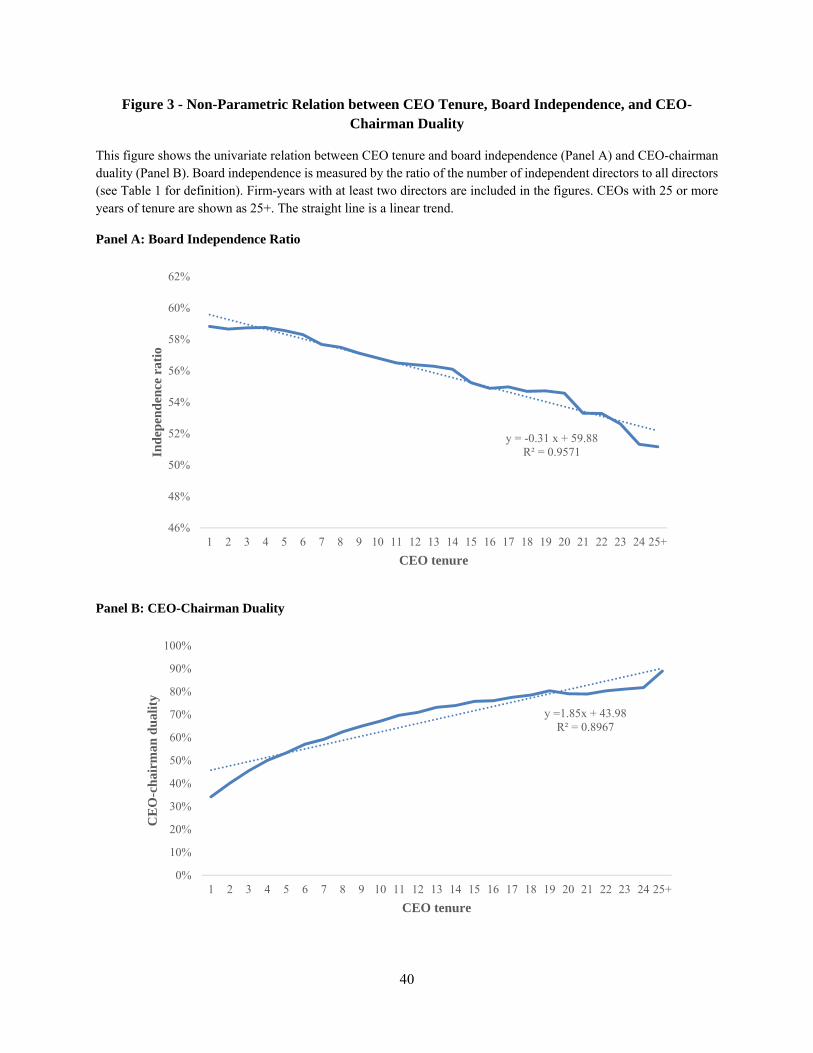
40
Figure 3 - Non-Parametric Relation between CEO Tenure, Board Independence, and CEO-Chairman Duality
This figure shows the univariate relation between CEO tenure and board independence (Panel A) and CEO-chairman duality (Panel B). Board independence is measured by the ratio of the number of independent directors to all directors (see Table 1 for definition). Firm-years with at least two directors are included in the figures. CEOs with 25 or more years of tenure are shown as 25+. The straight line is a linear trend.
Panel A: Board Independence Ratio
Panel B: CEO-Chairman Duality
y = -0.31 x + 59.88R² = 0.9571
46%
48%
50%
52%
54%
56%
58%
60%
62%
1 2 3 4 5 6 7 8 9 10 11 12 13 14 15 16 17 18 19 20 21 22 23 24 25+
Ind
epen
den
ce r
atio
CEO tenure
y =1.85x + 43.98R² = 0.8967
0%
10%
20%
30%
40%
50%
60%
70%
80%
90%
100%
1 2 3 4 5 6 7 8 9 10 11 12 13 14 15 16 17 18 19 20 21 22 23 24 25+
CE
O-c
hai
rman
du
alit
y
CEO tenure

41
Figure 4 – Firm Age, CEO Tenure and Board Independence
This figure plots the relation between board independence and CEO tenure based on regression coefficients in Column 5 of Table 2, Panel A (full sample with a full set of firm-level controls). Board independence generally increases as a firm ages (dotted line). After controlling for firm age, and other determinants of board structure and firm characteristics (e.g., asset size, board size, q, profitability), board independence decreases during a CEO’s tenure relative to the trend line (e.g., from year 1 to year 6 in the graph) and then jumps when a new CEO is appointed (e.g., in year 7). Panel B shows the same patterns of board independence after removing the linear time trend in independence.
Panel A: Board Independence Overlaid on Firm Age
Panel B: Board Independence through Three CEO Cycles after Removing Time Trend
49
50
51
52
53
54
55
1 2 3 4 5 6 7 8 9 10 11 12 13 14 15 16 17 18
Ind
epen
den
ce r
atio
(%
)
Firm age
Independence ratio
Linear (Independence ratio)
49.0
49.2
49.4
49.6
49.8
50.0
50.2
50.4
50.6
1 2 3 4 5 6 7 8 9 10 11 12 13 14 15 16 17 18
Ind
epen
den
ce r
atio
(%
)
Firm age
Independence ratio after subtracting time trend
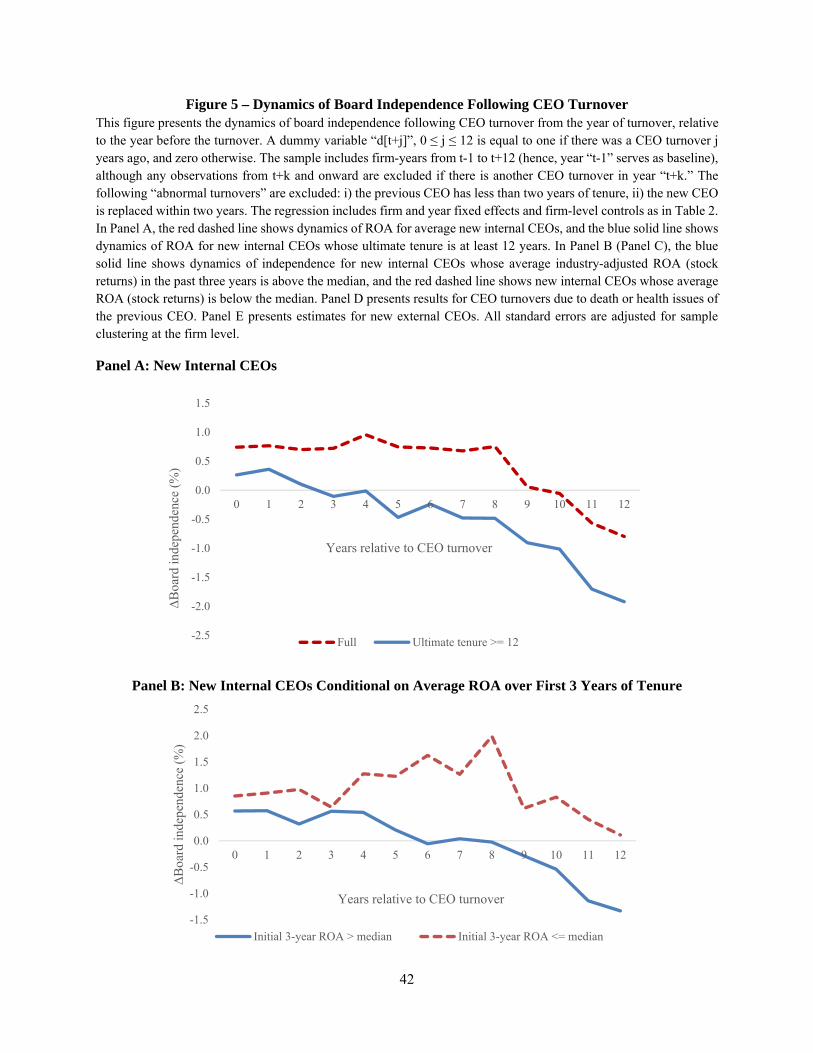
42
Figure 5 – Dynamics of Board Independence Following CEO Turnover This figure presents the dynamics of board independence following CEO turnover from the year of turnover, relative to the year before the turnover. A dummy variable “d[t+j]”, 0 ≤ j ≤ 12 is equal to one if there was a CEO turnover j years ago, and zero otherwise. The sample includes firm-years from t-1 to t+12 (hence, year “t-1” serves as baseline), although any observations from t+k and onward are excluded if there is another CEO turnover in year “t+k.” The following “abnormal turnovers” are excluded: i) the previous CEO has less than two years of tenure, ii) the new CEO is replaced within two years. The regression includes firm and year fixed effects and firm-level controls as in Table 2. In Panel A, the red dashed line shows dynamics of ROA for average new internal CEOs, and the blue solid line shows dynamics of ROA for new internal CEOs whose ultimate tenure is at least 12 years. In Panel B (Panel C), the blue solid line shows dynamics of independence for new internal CEOs whose average industry-adjusted ROA (stock returns) in the past three years is above the median, and the red dashed line shows new internal CEOs whose average ROA (stock returns) is below the median. Panel D presents results for CEO turnovers due to death or health issues of the previous CEO. Panel E presents estimates for new external CEOs. All standard errors are adjusted for sample clustering at the firm level.
Panel A: New Internal CEOs
Panel B: New Internal CEOs Conditional on Average ROA over First 3 Years of Tenure
-2.5
-2.0
-1.5
-1.0
-0.5
0.0
0.5
1.0
1.5
0 1 2 3 4 5 6 7 8 9 10 11 12
∆B
oard
inde
pend
ence
(%
)
Years relative to CEO turnover
Full Ultimate tenure >= 12
-1.5
-1.0
-0.5
0.0
0.5
1.0
1.5
2.0
2.5
0 1 2 3 4 5 6 7 8 9 10 11 12
∆B
oard
inde
pend
ence
(%
)
Years relative to CEO turnover
Initial 3-year ROA > median Initial 3-year ROA <= median

43
Panel C: New Internal CEOs Conditional on Average Stock Return over First 3 Years of Tenure
Panel D: CEO Turnovers due to Health Issues and Death of Previous CEO
Panel E: New External CEOs
-2.0
-1.5
-1.0
-0.5
0.0
0.5
1.0
1.5
2.0
2.5
0 1 2 3 4 5 6 7 8 9 10 11 12
∆B
oard
inde
pend
ence
(%
)
Years relative to CEO turnover
Initial 3-year Stock ret > median Initial 3-year Stock ret <= median
-8.0
-6.0
-4.0
-2.0
0.0
2.0
4.0
6.0
0 1 2 3 4 5 6 7 8 9 10 11 12
∆B
oard
inde
pend
ence
(%
)
Years relative to CEO turnover
-3.0
-2.5
-2.0
-1.5
-1.0
-0.5
0.00 1 2 3 4 5 6 7 8 9 10 11 12
∆In
depe
nden
ce r
atio
(%
)
Years relative to CEO turnover
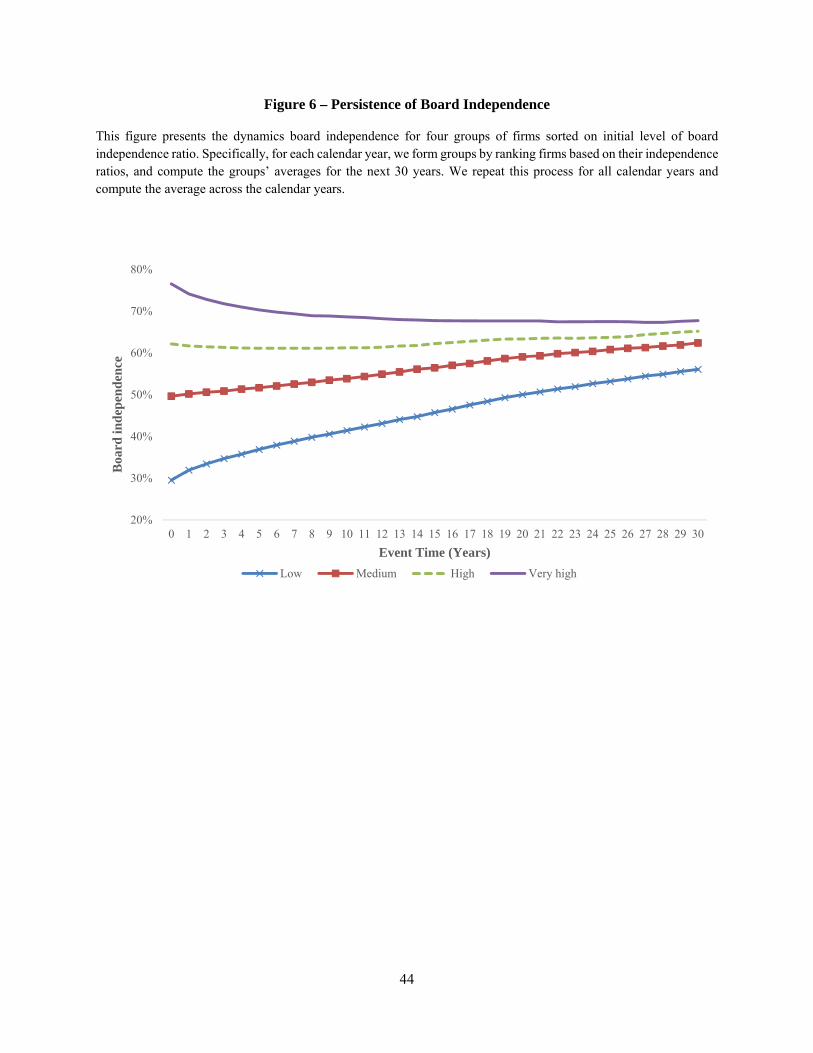
44
Figure 6 – Persistence of Board Independence
This figure presents the dynamics board independence for four groups of firms sorted on initial level of board independence ratio. Specifically, for each calendar year, we form groups by ranking firms based on their independence ratios, and compute the groups’ averages for the next 30 years. We repeat this process for all calendar years and compute the average across the calendar years.
20%
30%
40%
50%
60%
70%
80%
0 1 2 3 4 5 6 7 8 9 10 11 12 13 14 15 16 17 18 19 20 21 22 23 24 25 26 27 28 29 30
Boa
rd in
dep
end
ence
Event Time (Years)
Low Medium High Very high

45
Table 1 - Descriptive Statistics on CEOs and Corporate Boards of Directors from 1918 to 2011
This table presents summary statistics on corporate boards and the CEO for firm-year observations in a combined database described in Figure 1 from 1918 to 2011. Panels A and B show the statistics for board/officer characteristics and firm characteristics. “CEO turnover” equals one if the name of the CEO changes relative to the previous year; “CEO (CFO) [Chairman] tenure” is the total number of years during which an individual serves as CEO (CFO) [Chairman] of a given firm; “CEO-Chairman duality” is a dummy equal to one if the CEO and Chairman of the board are the same person; “Board size” is the number of directors; “Outsider ratio” is the number of outsider directors scaled by the total number of directors, where outsider directors are defined as all directors other than current officers of the firm. “Indept. ratio” is the number of independent directors scaled by the total number of directors, where independent directors are defined as directors who are neither current nor previous officers of the firm nor family members of the CEO (identified using last names); “Outside CEO” is a dummy variable equal to one if the new CEO is not a previous officer of the firm, and zero otherwise. “Total assets” is book assets; “Firm age” is 1+ number of years since a firm appears in our database for the first time; “ROA (IB)” and “ROA (EBIT)” represent return on assets defined as “Income Before taxes” and “EBIT” scaled by lagged assets; “Tangibility” is PP&E scaled by assets; “Tobin’s q” is book assets minus book equity plus market equity scaled by assets; “Cash/assets” is cash and equivalents scaled by total assets. 1920s* include 1918-1919, and 2000s* include 2010 and 2011.
Panel A: Board and Officer Characteristics
Variable
N (firm-years)
CEO turnover
CEO tenure
CFO tenure
Chairman tenure
CEO-Chairman
duality
Board size Outsider ratio
Indept. ratio
Outside CEO
(new appt)
Panel A: Full Sample (1918-2011) Mean 93,249 0.121 6.196 5.029 5.824 0.407 10.02 0.65 0.58 0.33Median - 0.000 4.000 3.000 4.000 0.000 9.00 0.67 0.60 0.00STD - 0.326 5.557 4.666 5.280 0.491 3.60 0.20 0.19 0.47
Panel B: By-decade Mean
1920s* 4,074 0.095 4.074 3.899 3.491 0.046 11.13 0.59 0.56 0.431930s 5,205 0.088 6.609 6.351 5.296 0.084 10.84 0.57 0.52 0.371940s 6,212 0.091 7.997 7.564 6.777 0.091 10.51 0.54 0.49 0.221950s 6,874 0.119 7.141 6.986 6.369 0.113 11.16 0.57 0.50 0.261960s 10,094 0.121 5.409 4.814 4.769 0.229 10.88 0.59 0.52 0.301970s 15,567 0.112 5.839 4.704 5.361 0.455 10.09 0.60 0.53 0.251980s 12,584 0.116 7.363 5.017 6.715 0.618 9.89 0.67 0.60 0.291990s 16,084 0.149 5.757 3.960 5.761 0.610 9.03 0.70 0.63 0.39
2000s* 16,555 0.133 5.877 4.296 6.076 0.546 9.31 0.81 0.69 0.41
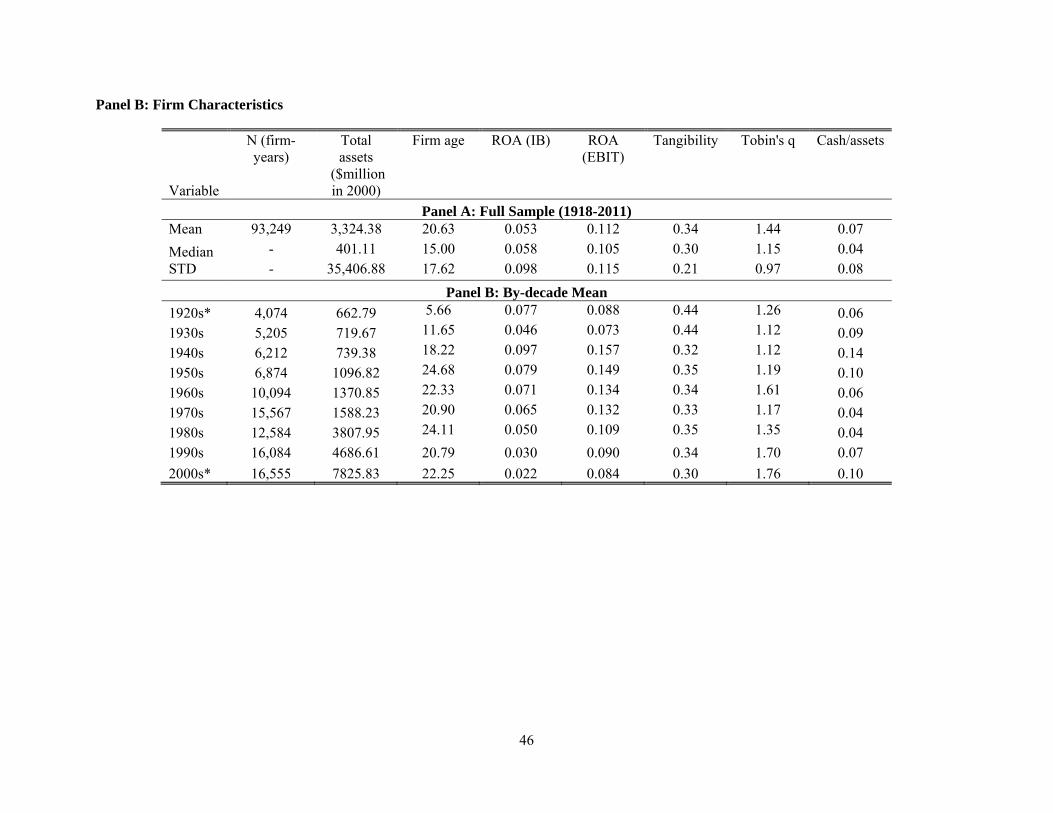
46
Panel B: Firm Characteristics
Variable
N (firm-years)
Total assets
($million in 2000)
Firm age ROA (IB) ROA (EBIT)
Tangibility Tobin's q Cash/assets
Panel A: Full Sample (1918-2011) Mean 93,249 3,324.38 20.63 0.053 0.112 0.34 1.44 0.07
Median - 401.11 15.00 0.058 0.105 0.30 1.15 0.04 STD - 35,406.88 17.62 0.098 0.115 0.21 0.97 0.08
Panel B: By-decade Mean
1920s* 4,074 662.79 5.66 0.077 0.088 0.44 1.26 0.06 1930s 5,205 719.67 11.65 0.046 0.073 0.44 1.12 0.09 1940s 6,212 739.38 18.22 0.097 0.157 0.32 1.12 0.14 1950s 6,874 1096.82 24.68 0.079 0.149 0.35 1.19 0.10 1960s 10,094 1370.85 22.33 0.071 0.134 0.34 1.61 0.06 1970s 15,567 1588.23 20.90 0.065 0.132 0.33 1.17 0.04 1980s 12,584 3807.95 24.11 0.050 0.109 0.35 1.35 0.04 1990s 16,084 4686.61 20.79 0.030 0.090 0.34 1.70 0.07
2000s* 16,555 7825.83 22.25 0.022 0.084 0.30 1.76 0.10
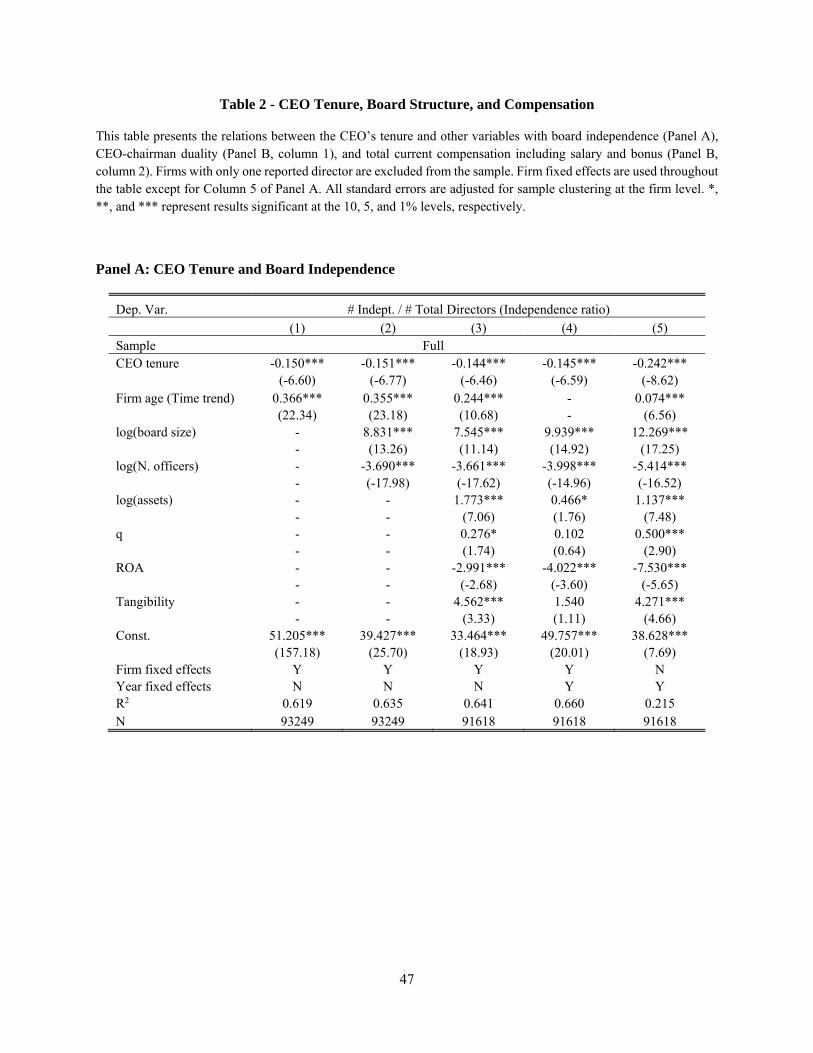
47
Table 2 - CEO Tenure, Board Structure, and Compensation
This table presents the relations between the CEO’s tenure and other variables with board independence (Panel A), CEO-chairman duality (Panel B, column 1), and total current compensation including salary and bonus (Panel B, column 2). Firms with only one reported director are excluded from the sample. Firm fixed effects are used throughout the table except for Column 5 of Panel A. All standard errors are adjusted for sample clustering at the firm level. *, **, and *** represent results significant at the 10, 5, and 1% levels, respectively.
Panel A: CEO Tenure and Board Independence
Dep. Var. # Indept. / # Total Directors (Independence ratio)
(1) (2) (3) (4) (5) Sample Full CEO tenure -0.150*** -0.151*** -0.144*** -0.145*** -0.242***
(-6.60) (-6.77) (-6.46) (-6.59) (-8.62) Firm age (Time trend) 0.366*** 0.355*** 0.244*** - 0.074***
(22.34) (23.18) (10.68) - (6.56) log(board size) - 8.831*** 7.545*** 9.939*** 12.269***
- (13.26) (11.14) (14.92) (17.25) log(N. officers) - -3.690*** -3.661*** -3.998*** -5.414***
- (-17.98) (-17.62) (-14.96) (-16.52) log(assets) - - 1.773*** 0.466* 1.137***
- - (7.06) (1.76) (7.48) q - - 0.276* 0.102 0.500***
- - (1.74) (0.64) (2.90) ROA - - -2.991*** -4.022*** -7.530***
- - (-2.68) (-3.60) (-5.65) Tangibility - - 4.562*** 1.540 4.271***
- - (3.33) (1.11) (4.66) Const. 51.205*** 39.427*** 33.464*** 49.757*** 38.628***
(157.18) (25.70) (18.93) (20.01) (7.69) Firm fixed effects Y Y Y Y N Year fixed effects N N N Y Y R2 0.619 0.635 0.641 0.660 0.215 N 93249 93249 91618 91618 91618

48
Panel B: CEO Tenure, Chairman Duality and Compensation
Dep. Var. 1 (CEO-Chairman Duality) Log (CEO compensation) (1) (2) CEO tenure 0.022*** 0.024***
(26.47) (5.86) log(board size) -0.092*** 0.066
(-6.57) (0.72) log(# officers) -0.048*** -0.072*
(-7.38) (-1.80) log(assets) 0.033*** 0.289***
(5.17) (7.33) q 0.008* 0.018
(1.77) (0.50) ROA 0.008 1.653***
(0.25) (4.68) Tangibility 0.040 -0.098
(1.11) (-0.59) Const. 0.308*** 4.279***
(4.97) (10.00) Firm fixed effects Y Y Year fixed effects Y Y R2 0.541 0.880 N 71872 3330

49
Table 3 – Instrumental Variable Estimates of CEO Tenure using ROA
This table provides an instrumental-variable estimate for the effect of the CEO’s tenure on board independence. Panel A shows the first-stage regression estimates and Panel B shows the second-stage estimates. Column 1 (2) of each panel uses ROA over the last three years (in the current year) as an instrument. Firms with only one reported director are excluded from the sample. Firm fixed effects are used throughout the table. All standard errors are adjusted for sample clustering at the firm level. *, **, and *** represent results significant at the 10, 5, and 1% levels, respectively.
(1) (2)
Instrumental var.: ROA (3yr) ROA (current)
Panel A: First-stage Estimates
Dep. Var.: Tenure
ROA 4.805*** 2.538***
(8.69) (6.62)
log(board size) -0.179 -0.178
(-0.97) (-0.96)
log(N. officers) 0.210** 0.211**
(2.63) (2.64)
log(assets) 0.362*** 0.400***
(4.34) (4.81)
q -0.0250 0.0165
(-0.45) (0.29)
Tangibility 0.326 0.279
(0.73) (0.62)
Panel B: 2SLS Estimates
Dep. Var.: Independence ratio
CEO tenure -1.322*** -1.576***
(-3.81) (-3.22)
log(board size) 9.763*** 9.721***
(14.01) (13.54)
log(N. officers) -3.653*** -3.601***
(-12.85) (-11.99)
log(assets) 0.926*** 1.035***
(2.82) (2.81)
q 0.068 0.091
(0.40) (0.50)
Tangibility 2.033 2.068
(1.38) (1.36)
Firm fixed effects Y Y
Year fixed effects Y Y
N 88195 88195
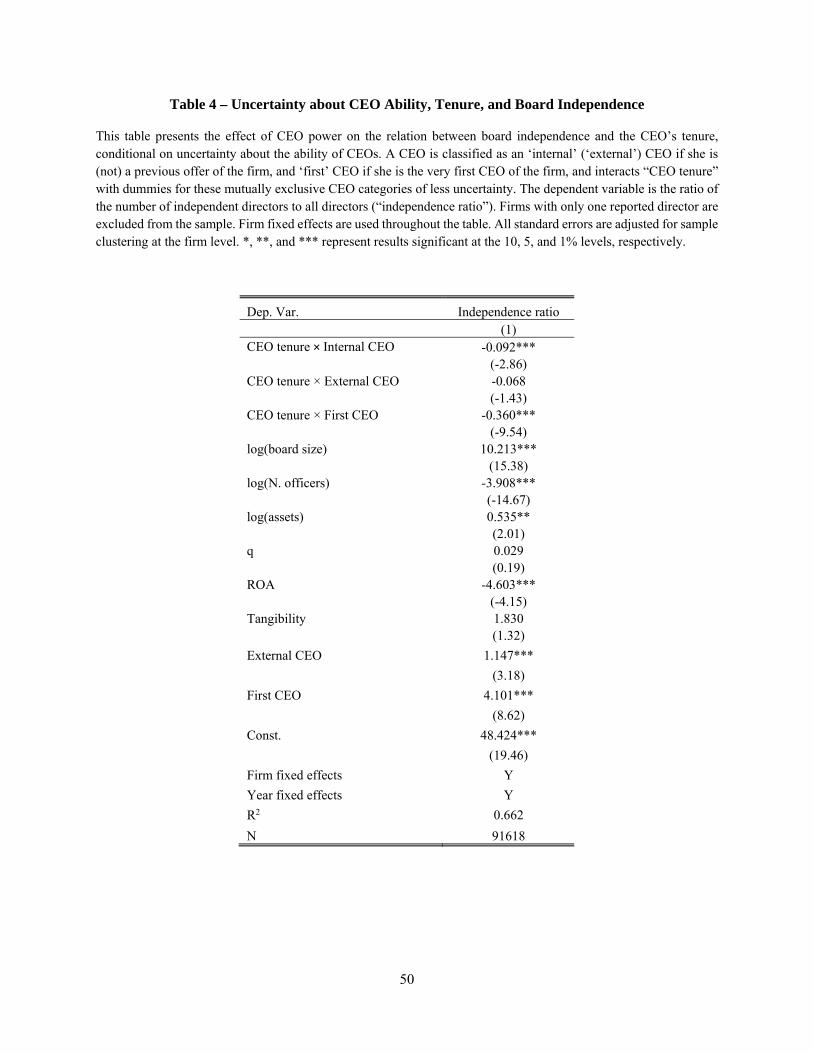
50
Table 4 – Uncertainty about CEO Ability, Tenure, and Board Independence
This table presents the effect of CEO power on the relation between board independence and the CEO’s tenure, conditional on uncertainty about the ability of CEOs. A CEO is classified as an ‘internal’ (‘external’) CEO if she is (not) a previous offer of the firm, and ‘first’ CEO if she is the very first CEO of the firm, and interacts “CEO tenure” with dummies for these mutually exclusive CEO categories of less uncertainty. The dependent variable is the ratio of the number of independent directors to all directors (“independence ratio”). Firms with only one reported director are excluded from the sample. Firm fixed effects are used throughout the table. All standard errors are adjusted for sample clustering at the firm level. *, **, and *** represent results significant at the 10, 5, and 1% levels, respectively.
Dep. Var. Independence ratio (1) CEO tenure × Internal CEO -0.092***
(-2.86) CEO tenure × External CEO -0.068
(-1.43) CEO tenure × First CEO -0.360***
(-9.54) log(board size) 10.213***
(15.38) log(N. officers) -3.908***
(-14.67) log(assets) 0.535**
(2.01) q 0.029
(0.19) ROA -4.603***
(-4.15) Tangibility 1.830
(1.32)
External CEO 1.147***
(3.18)
First CEO 4.101***
(8.62)
Const. 48.424***
(19.46)
Firm fixed effects Y
Year fixed effects Y
R2 0.662
N 91618
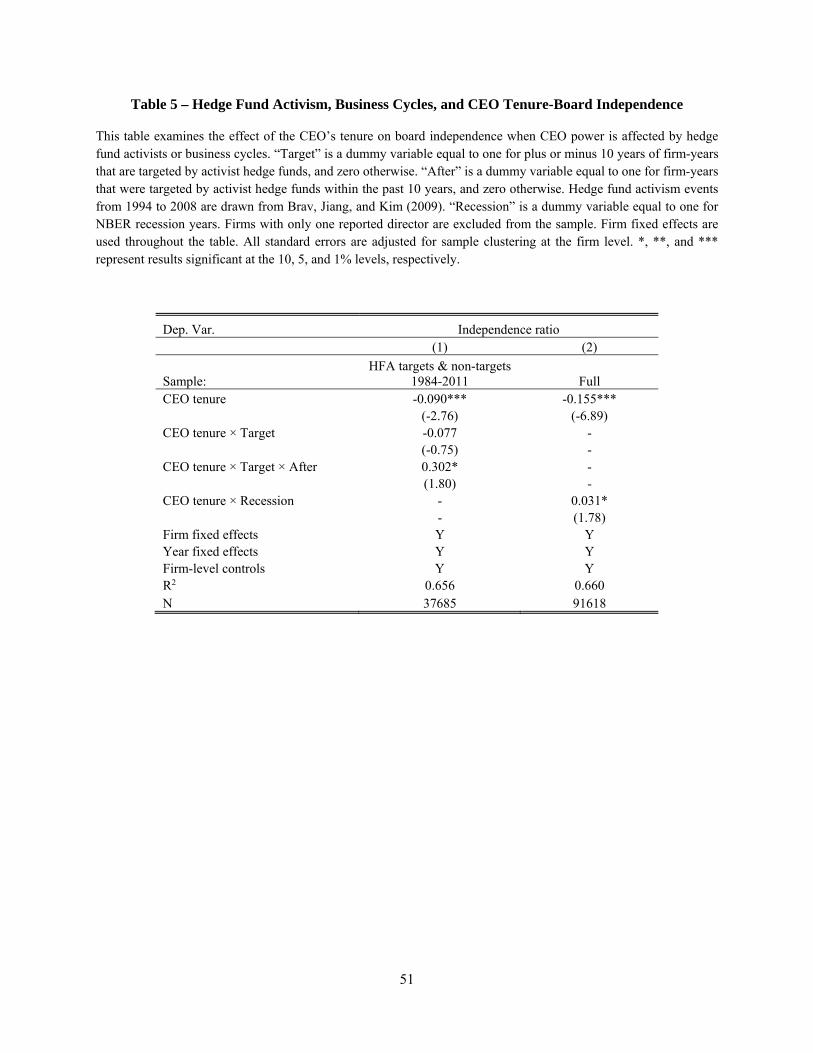
51
Table 5 – Hedge Fund Activism, Business Cycles, and CEO Tenure-Board Independence
This table examines the effect of the CEO’s tenure on board independence when CEO power is affected by hedge fund activists or business cycles. “Target” is a dummy variable equal to one for plus or minus 10 years of firm-years that are targeted by activist hedge funds, and zero otherwise. “After” is a dummy variable equal to one for firm-years that were targeted by activist hedge funds within the past 10 years, and zero otherwise. Hedge fund activism events from 1994 to 2008 are drawn from Brav, Jiang, and Kim (2009). “Recession” is a dummy variable equal to one for NBER recession years. Firms with only one reported director are excluded from the sample. Firm fixed effects are used throughout the table. All standard errors are adjusted for sample clustering at the firm level. *, **, and *** represent results significant at the 10, 5, and 1% levels, respectively.
Dep. Var. Independence ratio (1) (2)
Sample: HFA targets & non-targets
1984-2011 Full CEO tenure -0.090*** -0.155***
(-2.76) (-6.89) CEO tenure × Target -0.077 -
(-0.75) - CEO tenure × Target × After 0.302* -
(1.80) - CEO tenure × Recession - 0.031*
- (1.78) Firm fixed effects Y Y Year fixed effects Y Y Firm-level controls Y Y R2 0.656 0.660 N 37685 91618

52
Table 6 – Regulations, CEO Tenure, and Governance Outcomes
This table examines the effect of the CEO’s tenure on board independence, CEO-chairman duality, and compensation separately for years before and after 2002 when various new regulations and laws began to require firms to increase board independence up to certain levels. “Post 2002” is a dummy variable equal to one for years equal to or after 2002, and zero for years before 2002. The dependent variables are independence ratio, a dummy for CEO-chairman duality, and the log of the CEO’s current compensation in columns 1, 2, and 3. Firms with only one reported director are excluded from the sample. Firm fixed effects are used throughout the table. All standard errors are adjusted for sample clustering at the firm level. *, **, and *** represent results significant at the 10, 5, and 1% levels, respectively.
Dep. Var. Independence ratio 1 (Chairman Duality) Log (Compensation) (1) (2) (3) CEO tenure -0.151*** 0.022*** 0.023***
(-6.68) (24.66) (5.58) CEO tenure × Post 2002 0.110** 0.005*** 0.013
(2.08) (3.03) (0.43) Firm age × Post 2002 0.056*** 0.003*** 0.006
(2.85) (7.52) (0.83) log(board size) 10.008*** -0.087*** 0.062
(15.06) (-6.18) (0.68) log(N. officers) -3.966*** -0.046*** -0.072*
(-14.85) (-7.04) (-1.78) log(assets) 0.476* 0.034*** 0.294***
(1.79) (5.42) (7.77) q 0.084 0.006 0.016
(0.53) (1.52) (0.45) ROA -4.217*** -0.004 1.628***
(-3.79) (-0.12) (5.30) Tangibility 1.611 0.048 -0.064
(1.16) (1.35) (-0.39) Const. 46.274*** 0.101 3.697***
(17.24) (1.48) (4.99) Firm fixed effects Y Y Y Year fixed effects Y Y Y R2 0.661 0.542 0.880 N 91618 71872 3330

53
Table 7 – Persistence of Board Independence This table examines persistence of board independence. ‘Initial independence ratio’ is the board independence ratio for the first available observation of each firm. Panel A uses all firm-years (except for the very first year for each firm), and Panel B uses the cross-section of firms T years after observing the initial board independence (T = 5, 10, or 20). Panel C sorts firms into board independence ratio quartiles in a given year, and follows them over the next 10 years. *, **, and *** represent results significant at the 10, 5, and 1% levels, respectively.
Dep. Var. Independence ratio (1) (2) (3)
Panel A: Full Sample Initial independence ratio 47.327*** 42.903*** 40.295***
(40.15) (38.20) (36.62) CEO tenure -0.241*** -0.214*** -0.164***
(-8.31) (-7.82) (-6.33) Firm age 0.224*** 0.201*** 0.145***
(17.95) (16.99) (12.13) log(board size) - - 9.344***
- - (15.28) log(N. officers) - - -4.307***
- - (-14.92) log(assets) - - 0.797***
- - (5.97) q - - 0.248
- - (1.57) ROA - - -5.722***
- - (-4.68) Tangibility - - 1.688**
- - (2.09) Year fixed effects N Y Y R2 0.268 0.345 0.376 N 85216 85216 85216
Panel B: Cross-Section Timing relative to initial year: t+5 t+10 t+20 Initial independence ratio 55.256*** 42.603*** 32.571***
(38.05) (24.69) (13.51)
CEO tenure -0.050 -0.218*** -0.153**
(-0.71) (-3.20) (-2.36) log(board size) 8.789*** 10.149*** 10.857***
(7.71) (7.62) (5.55) log(N. officers) -4.703*** -3.381*** -5.057***
(-8.33) (-5.46) (-4.68) log(assets) 0.761*** 0.487* 0.968**
(3.49) (1.71) (2.28) q 0.770*** 0.460 0.657
(3.35) (1.24) (0.76) ROA -2.619 -7.596** -15.952*
(-1.02) (-2.14) (-1.81) Tangibility 2.293** 2.838* 2.493
(2.03) (1.87) (0.98) Year fixed effects Y Y Y
R2 0.481 0.404 0.318 N 3921 2767 1414
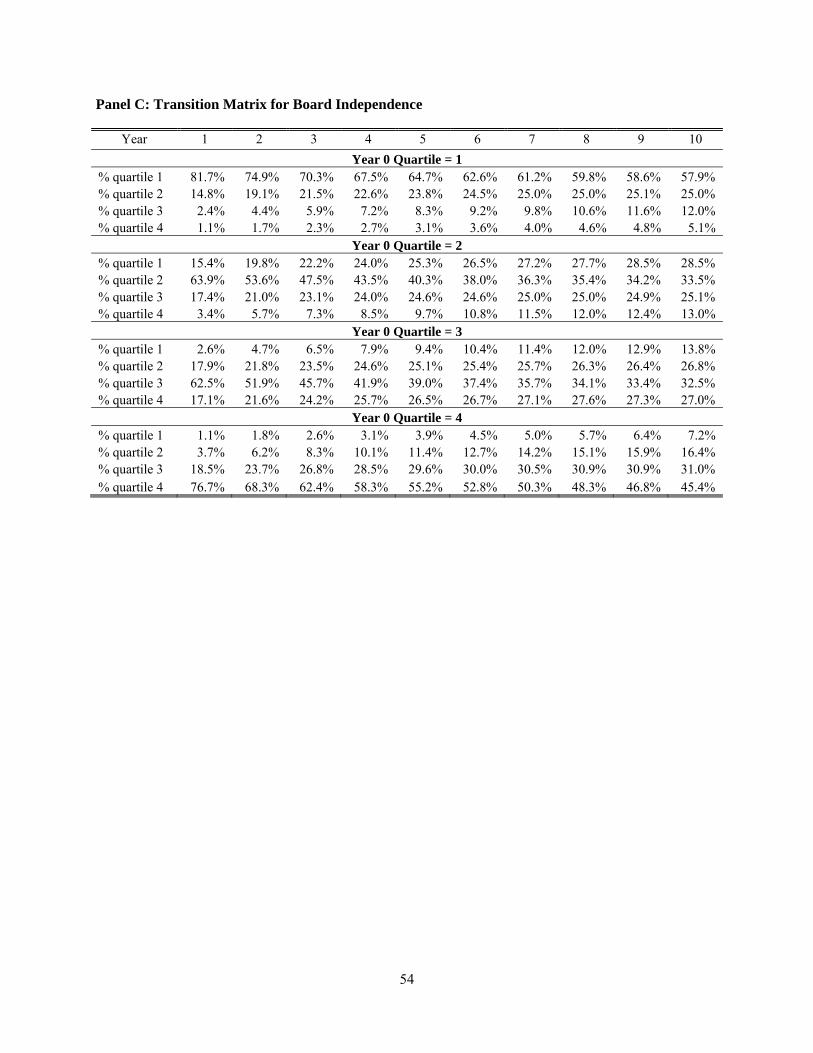
54
Panel C: Transition Matrix for Board Independence
Year 1 2 3 4 5 6 7 8 9 10
Year 0 Quartile = 1 % quartile 1 81.7% 74.9% 70.3% 67.5% 64.7% 62.6% 61.2% 59.8% 58.6% 57.9% % quartile 2 14.8% 19.1% 21.5% 22.6% 23.8% 24.5% 25.0% 25.0% 25.1% 25.0% % quartile 3 2.4% 4.4% 5.9% 7.2% 8.3% 9.2% 9.8% 10.6% 11.6% 12.0% % quartile 4 1.1% 1.7% 2.3% 2.7% 3.1% 3.6% 4.0% 4.6% 4.8% 5.1%
Year 0 Quartile = 2 % quartile 1 15.4% 19.8% 22.2% 24.0% 25.3% 26.5% 27.2% 27.7% 28.5% 28.5% % quartile 2 63.9% 53.6% 47.5% 43.5% 40.3% 38.0% 36.3% 35.4% 34.2% 33.5% % quartile 3 17.4% 21.0% 23.1% 24.0% 24.6% 24.6% 25.0% 25.0% 24.9% 25.1% % quartile 4 3.4% 5.7% 7.3% 8.5% 9.7% 10.8% 11.5% 12.0% 12.4% 13.0%
Year 0 Quartile = 3 % quartile 1 2.6% 4.7% 6.5% 7.9% 9.4% 10.4% 11.4% 12.0% 12.9% 13.8% % quartile 2 17.9% 21.8% 23.5% 24.6% 25.1% 25.4% 25.7% 26.3% 26.4% 26.8% % quartile 3 62.5% 51.9% 45.7% 41.9% 39.0% 37.4% 35.7% 34.1% 33.4% 32.5% % quartile 4 17.1% 21.6% 24.2% 25.7% 26.5% 26.7% 27.1% 27.6% 27.3% 27.0%
Year 0 Quartile = 4 % quartile 1 1.1% 1.8% 2.6% 3.1% 3.9% 4.5% 5.0% 5.7% 6.4% 7.2% % quartile 2 3.7% 6.2% 8.3% 10.1% 11.4% 12.7% 14.2% 15.1% 15.9% 16.4% % quartile 3 18.5% 23.7% 26.8% 28.5% 29.6% 30.0% 30.5% 30.9% 30.9% 31.0% % quartile 4 76.7% 68.3% 62.4% 58.3% 55.2% 52.8% 50.3% 48.3% 46.8% 45.4%

55
Table 8 – CEO Turnover Conditional on Firm Performance and CEO Power
This table examines how CEO power affects the sensitivity of CEO turnover to firm performance proxied by changes in return on assets (ROA) defined as income before taxes (as ‘IB’ in Compustat) and average stock return for the 12-month period prior to the fiscal year ending date. All accounting variables are from Moody’s Industrial Manual or Compustat and stock returns are from CRSP. OLS regressions with firm and year fixed effects are used throughout the table, although results largely hold up in logit models with firm fixed effects (i.e., conditional logit). Panel A estimates the average effect of firm performance on CEO turnover. Panel B estimates the effect conditional on CEO power. As a proxy for CEO power, columns 1 to 5 use a dummy “Low independence” that is equal to one if the board independence ratio is less than the median, a dummy for CEO-chairman duality, a dummy for average ROA during the CEO’s past three years higher than the median, a dummy for average stock returns during the CEO’s past three years higher than the median, and a dummy for CEO tenure higher than its median, respectively. All standard errors are adjusted for sample clustering at the firm level. *, **, and *** represent results significant at the 10, 5, and 1% levels, respectively.
Panel A: Average Effects
Dep. Var. - Model CEO Turnover [t]{0,1} - OLS (1) (2) (3) (4) (5) (6) ΔROA [t] -0.253*** - -0.185*** -0.223*** - -0.173***
(-10.03) - (-6.87) (-9.93) - (-7.32) ΔROA [t-1] -0.146*** - -0.090*** - - -
(-6.01) - (-3.47) - - - Excess Ret [t] - -0.478*** -0.360*** - -0.432*** -0.336***
- (-10.82) (-7.07) - (-10.02) (-7.26) Excess Ret [t-1] - -0.333*** -0.276*** - - -
- (-8.40) (-5.86) - - - CEO tenure 0.007*** 0.007*** 0.007*** 0.007*** 0.007*** 0.007***
(22.10) (22.45) (22.17) (22.07) (22.40) (22.09) Log assets -0.012*** -0.012*** -0.013*** -0.012*** -0.012*** -0.013***
(-3.84) (-4.19) (-4.08) (-4.19) (-4.25) (-4.39) q -0.008*** -0.001 -0.001 -0.010*** -0.005** -0.005*
(-2.93) (-0.46) (-0.20) (-3.84) (-2.12) (-1.78) Firm fixed effects Y Y Y Y Y Y Year fixed effects Y Y Y Y Y Y R2 0.127 0.125 0.130 0.127 0.124 0.128 N 71197 82221 69600 79823 82834 78404

56
Panel B: Turnover Conditional on CEO Power
Dep. Var. - Model CEO Turnover [t]{0,1} - OLS Power proxy: Low indep. Chairman dual High ROA High return Long tenure (1) (2) (3) (4) (5) ΔROA [t] -0.193*** -0.288*** -0.423*** -0.377*** -0.173***
(-7.27) (-5.86) (-15.08) (-13.60) (-6.39) ΔROA [t] × Power 0.095* 0.192*** 0.958*** 0.837*** -0.002
(1.72) (3.38) (20.88) (18.49) (-0.04) Excess Ret [t] -0.363*** -0.580*** -0.427*** -1.711*** -0.381***
(-7.12) (-6.43) (-8.38) (-26.72) (-7.39) Excess Ret [t] × Power 0.109 0.291*** 0.179** 2.616*** 0.199**
(1.27) (2.98) (2.30) (36.40) (2.37) Power -0.004 -0.212*** -0.043*** -0.050*** -0.003
(-0.88) (-36.64) (-12.35) (-16.43) (-0.49) CEO tenure 0.007*** 0.012*** 0.007*** 0.007*** 0.007***
(22.09) (23.72) (21.30) (22.49) (14.81) Log assets -0.013*** -0.007* -0.011*** -0.012*** -0.013***
(-4.40) (-1.74) (-3.72) (-4.13) (-4.40) q -0.005* 0.001 -0.004 -0.011*** -0.005*
(-1.78) (0.22) (-1.61) (-4.20) (-1.77) Firm fixed effects Y Y Y Y Y Year fixed effects Y Y Y Y Y
R2 0.129 0.209 0.137 0.149 0.129 N 78404 52368 78404 78404 78404
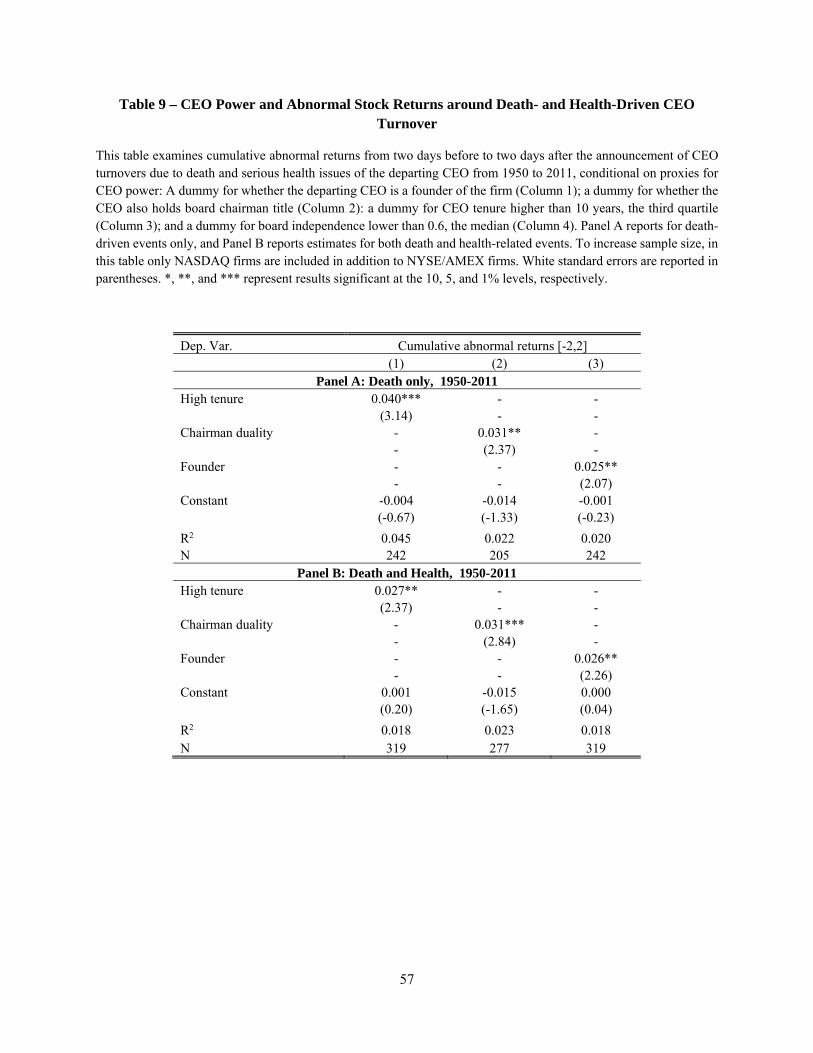
57
Table 9 – CEO Power and Abnormal Stock Returns around Death- and Health-Driven CEO Turnover
This table examines cumulative abnormal returns from two days before to two days after the announcement of CEO turnovers due to death and serious health issues of the departing CEO from 1950 to 2011, conditional on proxies for CEO power: A dummy for whether the departing CEO is a founder of the firm (Column 1); a dummy for whether the CEO also holds board chairman title (Column 2): a dummy for CEO tenure higher than 10 years, the third quartile (Column 3); and a dummy for board independence lower than 0.6, the median (Column 4). Panel A reports for death-driven events only, and Panel B reports estimates for both death and health-related events. To increase sample size, in this table only NASDAQ firms are included in addition to NYSE/AMEX firms. White standard errors are reported in parentheses. *, **, and *** represent results significant at the 10, 5, and 1% levels, respectively.
Dep. Var. Cumulative abnormal returns [-2,2] (1) (2) (3)
Panel A: Death only, 1950-2011 High tenure 0.040*** - -
(3.14) - - Chairman duality - 0.031** -
- (2.37) - Founder - - 0.025**
- - (2.07) Constant -0.004 -0.014 -0.001
(-0.67) (-1.33) (-0.23)
R2 0.045 0.022 0.020 N 242 205 242
Panel B: Death and Health, 1950-2011 High tenure 0.027** - -
(2.37) - - Chairman duality - 0.031*** -
- (2.84) - Founder - - 0.026**
- - (2.26) Constant 0.001 -0.015 0.000
(0.20) (-1.65) (0.04)
R2 0.018 0.023 0.018 N 319 277 319

58
Appendix Table – CEO Tenure and Board Independence: Subsample and Survival Analysis
This table provides robustness tests for the effect of CEO tenure on board independence. Panel A splits the full sample into subsamples consisting of different time periods; Panel B uses subsamples that require that the firm survive more than a certain number of years. Firms with no or only one reported director are excluded from the sample. Firm fixed effects are used throughout the table. All standard errors are adjusted for sample clustering at the firm level. *, **, and *** represent results significant at the 10, 5, and 1% levels, respectively.
Panel A: Sub Sample Periods
Dep. Var. Independence ratio
(1) (2) (3) (4) (5)
Sample: 1918-1947 1948-1977 1978-2011 1996-2011
(ISS period) 1996-2011
(ISS period)
CEO tenure -0.226*** -0.031 -0.111*** -0.022 -0.267***
(-4.25) (-1.02) (-3.97) (-0.59) (-6.46)
Firm-level controls Y Y Y Y Y
Firm fixed effects Y Y Y Y N
Year fixed effects Y Y Y Y Y
R2 0.774 0.747 0.660 0.702 0.147
N 13049 30498 48071 23774 23774
Panel B: Firm Survival
Dep. Var. Independence ratio
(1) (2) (3) (4) (5)
Sample: Full
sample Survive > 2
years Survive > 5
years Survive > 10
years Survive > 15
years
CEO tenure -0.145*** -0.145*** -0.144*** -0.140*** -0.135***
(-6.59) (-6.61) (-6.59) (-6.40) (-6.04)
Firm-level controls Y Y Y Y Y
Firm fixed effects Y Y Y Y Y
Year fixed effects Y Y Y Y Y
R2 0.660 0.657 0.650 0.637 0.630
N 91618 90965 88285 81511 72559