Embed Size (px)
Citation preview
7/28/2016
1
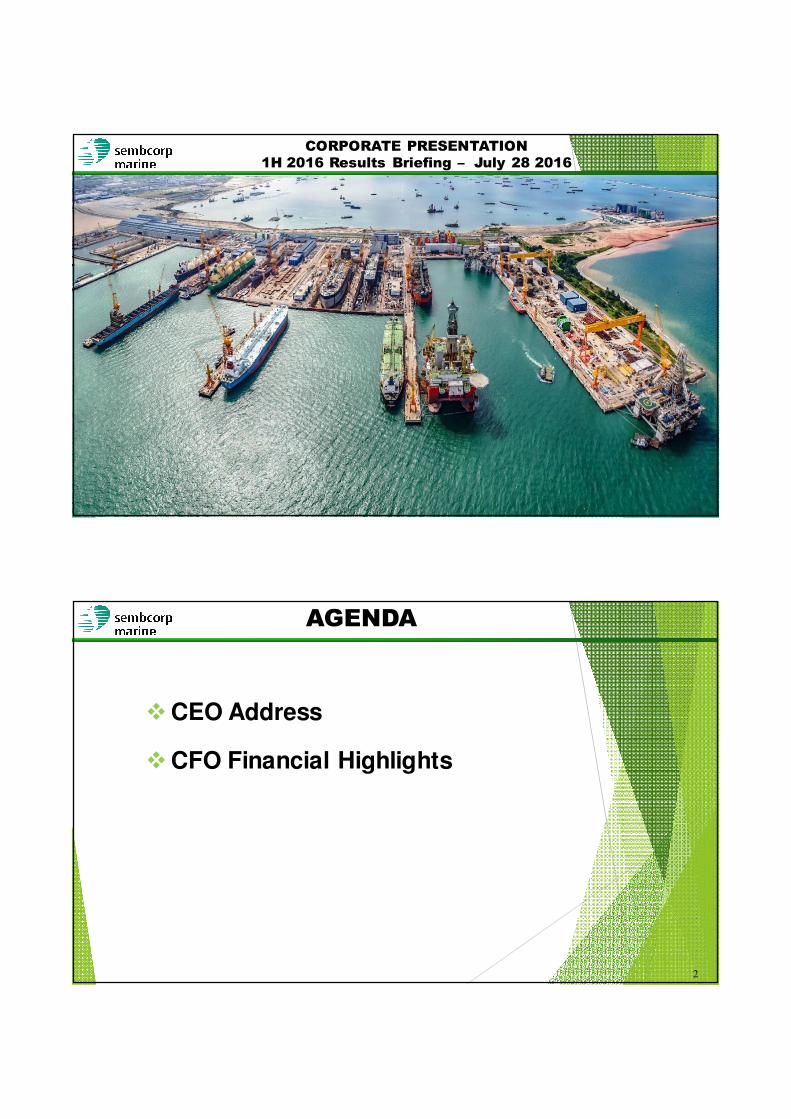
CORPORATE PRESENTATION1H 2016 Results Briefing – July 28 2016
Aerial view of Phase I of Sembcorp Marine TuasBoulevard Yard
1
Aerial view of Tuas Boulevard Yard Phase I and II
�CEO Address
�CFO Financial Highlights
AGENDA
2

7/28/2016
2
CEO ADDRESS
� Macro Environment update
� Financial performance for 1H 2016
� Operations Review
� Outlook and Prospects
3
� Global economic growth subdued.
Brexit raises concern of weaker
economic growth.
� Oil prices have slipped off recent
highs. Price crash since 2014 has
resulted in sweeping capex cuts.
� Offshore rig charter rates and
utilization continue to slide.
� Navigate with prudence and caution,
focused on preserving and growing
stakeholder value despite
challenges.
Macro environment remains weak
4Source: Reuters

7/28/2016
3
Key Highlights for 1H 2016:
� Total revenue of $1.8 billion.
� Net Profit was $66 million.
� Interim dividend of 1.5 cents.
2Q 2016 operating profit before
FX effects: $86 million (1Q 2016:
$65 million).
Financial Performance
5
215
66
2,511
1,827
0
50
100
150
200
250
0
500
1000
1500
2000
2500
1H 2015 1H 2016
S$
mil
lio
n
S$
mil
lio
n
1H 2016 Revenue and Profit
Net Profit Revenue
� Key deliveries in 1H 2016 have improved overall cash flow and
strengthened Sembcorp Marine’s balance sheet. With more
deliveries scheduled for the rest of this year and the next, we
expect this to continue.
� Secured creditable S$320 million in new orders (all non-drilling
solutions), despite very tough market conditions. We expect to
continue to grow our order book.
� Net order book at S$9.2 billion as at June 30, 2016. Excluding
Sete Brasil projects, net order book stands at S$6 billion.
Operations Review
6

7/28/2016
4
Delivered to Prosafe in 1Q 2016
Deliveries in 2016 – Safe Zephyrus
Project: Construction of GVA 3000E DP3 Accommodation Semi-sub for Harsh-environment
Operations for Charterer Det norske
Delivery: 1Q 2016
Operation: Norway
7
Delivered to MODEC in 1Q 2016
Deliveries in 2016 – FPSO Prof. John EA Mills
Project: Repair and life extension, and conversion of a VLCC into a Floating Production
Storage and Offloading (FPSO) vessel for Tullow Oil
Delivery: 1Q 2016
Operation: Tweneboa-Enyenra-Ntomme (TEN ) field, Ghana
8

7/28/2016
5
Delivered to Det norske oljeselskap ASA, Norway
Deliveries in 2016 – Ivar Aasen PDQ platform topsides
Project: Engineering, Procurement and Construction of Process, Drilling and Quarters (PDQ) Platform
Topsides for Ivar Aasen Development in the North Sea
Delivery: 2Q 2016
Operation: Ivar Aasen field, Norwegian North Sea
9
Delivered toMaersk Highlander UK Ltd
Deliveries in 2016 – Maersk Highlander
Project: Construction of F&G JU 2000E Jack-up for Harsh-
environment operations in the Culzean Field Development, in
UK North Sea
Delivery: 2Q 2016
Operation: Culzean Field, UK North Sea
10

7/28/2016
6
World’s largest jack-up for Noble Corporation
Deliveries in 2016 – Noble Lloyd Noble
Project: Harsh-environment GustoMSC CJ70 Jack-up built to
Statoil’s ‘Category J’ requirements; largest in the world and
first of its kind to fully comply with both Norwegian and UK
regulatory standards.
Delivery: July 2016
Operation: Statoil’s Mariner field development, North Sea
� Sembcorp Marine announced on April 22, 2016 that Sete Brasil’s
shareholders had approved a resolution to file for judicial
reorganization.
� We have commenced arbitration proceedings against various
subsidiaries of Sete Brasil to preserve our interests under our EPC
contracts. The arbitration proceedings are ongoing.
� Sete Brasil is preparing to present its restructuring plan and is in active
discussions with its various creditors. We continue to engage with Sete
Brasil.
� We believe provisions of $329 million made in 4Q2015/FY2015 for the
Sete Brasil contracts are adequate under present circumstances.
Update on Sete Brasil
12

7/28/2016
7
� Several rigs due for delivery in our order book have been deferred. We
are in discussions with customers to progress these contracts.
� Standstill agreement with North Atlantic Drilling for the delivery of the
West Rigel semi-submersible rig extended to September 2, 2016. Both
parties are marketing the rig for charter or sale at an acceptable price.
� Arbitration proceedings underway with Marco Polo Marine for the non-
payment of a jack-up rig. Contract has been terminated.
� Provisions of $280 million taken in 4Q 2015, in case of prolonged
deferment or possible cancellation of rigs, should be adequate under
current circumstances.
Update on other drilling rig contracts
13
� Majority of current S$9.2 billion order book is with progressive
payment terms. Less than 20% of the order book is for drilling rigs
with backend loaded payment terms.
� Average upfront payment for these rigs approximates 30%.
� Ongoing vessel deliveries generated positive operating cashflow
with more to come.
� A large part of our new yard capex has been expended.
� Transformation strategy allows for greater synergy of capabilities
and optimum use of resources across various yard locations.
Cash flow and Liquidity
14

7/28/2016
8
� Offshore oil & gas sector to remain challenging in short to
medium term.
� Planned diversification from exploration into development &
production segments is gathering steam and reaping gains.
� Acquisition of an additional 44% stake in Gravifloat on March 9,
2016 raises Sembcorp Marine’s stake to strategic 56%.
� Recently acquired a 50% stake in KANFA Aragon, a process
design and engineering group specializing in floater solutions.
� Looking to develop new proprietary capabilities, designs and
solutions to differentiate from competition.
Outlook & Strategy
15
� New flagship Tuas Boulevard yard and our mega steel fabrication facility
has helped unlock new opportunities. Enabled the move up the value
chain to secure more complex contracts.
� Our Brazilian shipyard Estaleiro Jurong Aracruz (EJA) positions us to tap
opportunities not just in Brazil, but also in Latin America and West Africa.
In May 2016, EJA marked a key operational milestone with successful
completion of its first repair vessel, the bulk carrier Olympic Gemini.
� Expand beyond drilling solutions to non-drilling and other product
segments within the oil and gas value chain. For example, through
Gravifloat. Also acquired 50% stake in KANFA Aragon AS, a process
design and engineering group.
� Workforce sustainability is key to enable us to ride the future industry
recovery. We continue to rigorously optimise manpower requirements.
Investing in the future
16

7/28/2016
9
� Strategic investments in infrastructure and technology have
enhanced our resilience to navigate through these difficult times.
� Sembcorp Marine has gone through several down-cycles and
built a strong core to weather the elements.
� Management to adopt disciplined approach to manage costs and
finances to ensure adequate cash and improved gearing.
� Key priority is timely and effective execution of order book and
to be proactive to seek fresh opportunities to grow our business
and order book.
Resilient and Ready
17
CFO Presentation
� Earnings Performance
� Financial Position
18
7/28/2016
10
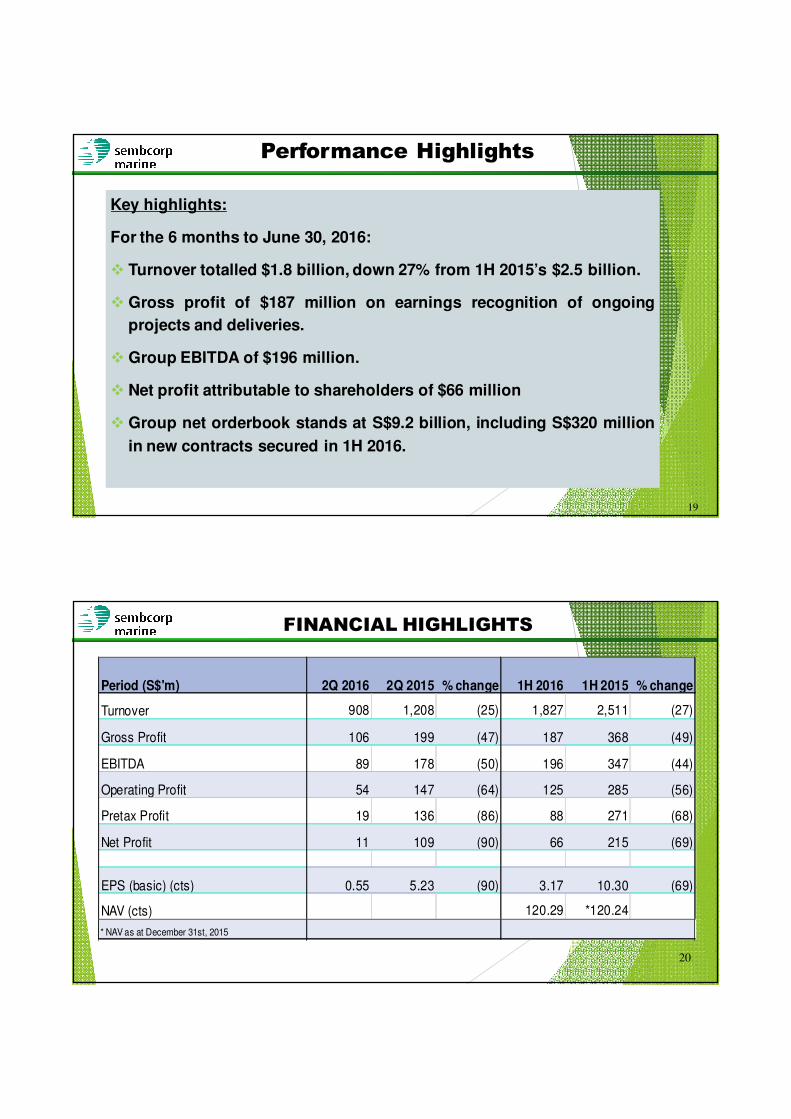
Key highlights:
For the 6 months to June 30, 2016:
� Turnover totalled $1.8 billion, down 27% from 1H 2015’s $2.5 billion.
� Gross profit of $187 million on earnings recognition of ongoing
projects and deliveries.
� Group EBITDA of $196 million.
� Net profit attributable to shareholders of $66 million
� Group net orderbook stands at S$9.2 billion, including S$320 million
in new contracts secured in 1H 2016.
Performance Highlights
19
20
FINANCIAL HIGHLIGHTS
Period (S$'m) 2Q 2016 2Q 2015 % change 1H 2016 1H 2015 % change
Turnover 908 1,208 (25) 1,827 2,511 (27)
Gross Profit 106 199 (47) 187 368 (49)
EBITDA 89 178 (50) 196 347 (44)
Operating Profit 54 147 (64) 125 285 (56)
Pretax Profit 19 136 (86) 88 271 (68)
Net Profit 11 109 (90) 66 215 (69)
EPS (basic) (cts) 0.55 5.23 (90) 3.17 10.30 (69)
NAV (cts) 120.29 *120.24
* NAV as at December 31st, 2015

7/28/2016
11
1H 2016 TURNOVER: S$1.8 billion
21
943 1,050 1,335 1,304
918
1,217 1,124
1,341 1,208
908
892
1,659
1,712
1,130
1,378
1,693
1,445
1,327
4,430
5,526 5,832
4,968
1,827
-
1,000
2,000
3,000
4,000
5,000
6,000
7,000
2012 2013 2014 2015 2016
$ m
illio
n
1Q 2Q 3Q 4Q
1H2016 Net Profit at S$66 million
22
113 119 122 106 106
55
145 122 132 109 109
11
116 130 132
49 70
126 182 174
-535
99
538 556 560
(290)
384
66
-800
-600
-400
-200
0
200
400
600
800
2012 2013 2014 2015 2015 excluding provisions and non-operating
items
2016
$ m
illio
n
1Q 2Q 3Q 4Q NOI

7/28/2016
12
Rigs & Floaters
53%Repairs & Upgrades
13%
Offshore Platforms
32%
Other Activities
2%
1H 2016 Turnover: $1.8 billion
Rigs & Floaters
69%
Repairs & Upgrades
11%
Offshore Platforms
19%
Other Activities
1%
1H 2015 Turnover: $2.5 billion
Business Review: Turnover by Segments
23
Turnover (S$ million) 1H 2016 1H 2015 % change 2Q 2016 2Q 2015 % change
Rigs & Floaters 956 1,721 (45) 416 774 (46)
Repairs & Upgrades 245 266 (8) 146 166 (12)
Offshore Platforms 589 488 21 328 251 31
Other Activities 37 37 n.m. 19 18 7
TOTAL 1,827 2,511 (27) 909 1,208 (25)
24
862943
737
554644
707
459
125986 1,129 866 695 708 844 587 187
15.1
20.7
18.6
12.511.7 12.1
8.9
6.9
17.2
24.8
21.9
15.7
12.8
14.5
11.410.2
0
5
10
15
20
25
30
0
200
400
600
800
1000
1200
2009 2010 2011 2012 2013 2014 2015(excl. provisions)
1H 2016
% m
arg
ins
$ m
illi
on
Operating Profit $m
Gross Profit $m
Operating Profit Margin %
Gross Profit Margin %
Gross and operating profit margins

7/28/2016
13
0
100
200
300
400
500
600
700
800
2009 2010 2011 2012 2013 2014 2015 1H 2015
1H 2016
706
646 644 642681
622
557
266245
Ship repair revenue ($million)
Core Business: Repairs & Upgrades
25
Year 1H 2016 1H 2015 % change
No. of vessels repaired 258 235 10
Average value per vessel ($m) 0.95 1.13 (16)
Total repair revenue contribution ($m) 245 266 (8)
• Ship repair revenue declined 8% year on year to $245 million on lower average revenue per vessel.
• Rig building revenue fell 62% yoy to S$523 million in 1H 2016.Three deliveries made in 1H 2016.
2,127
1,108
797
2,0012,295
1,803
670 543254
1,508
1,940
1,408
127
836
980
447384
222
228
433996
1311
448
47
3635
3048
2205
2356
3564
3779
2428
1375
523
0
500
1,000
1,500
2,000
2,500
3,000
3,500
4,000
2009 2010 2011 2012 2013 2014 2015 1H2015 1H2016
S$ MILLION
Jack-up SemiSub- drilling, accomodation, well intervention, crane Drillship
Core Business: Rig Building
26
JACK-UP RIGS SCHEDULE
No. of completed rigs YTD 2016 2* Maersk Highlander to Maersk Drilling
* Noble Lloyd Noble to Noble Corp
No. of projects in WIP stages 1 * BOTL/JDC Hakuryu 14 JU 2
No. of projects technically completed
stage5 * Oro Negro Vastus Jack-up
* Perisai Pacific 102 Jack-up
* Oro Negro Jack-up
* Oro Negro Jack-up
* Perisai Pacific 103 Jack-up
SEMI-SUBS & DRILLSHIPSSCHEDULE
No. of projects delivered in 1H 2016 1
* Safe Zephyrus to Prosafe - accommodation semisub
No of projects in WIP stage 12 * Helix semi-well intervention 1 (Q7000)
* Drillship 1st unit, Sete Brasil, Arpoador
* Harsh-environment CS60 semi-rig, Seadrill
* Drillship 2nd
unit, Sete Brasil
* Drillship 3rd unit, Sete Brasil
* Drillship 4th
unit, Sete Brasil
* 1st drillship for Transocean, JE III
* 2nd drillship for Transocean, JE III
* Heerema Offshore semi crane vessel
* Drillship 5th
unit, Sete Brasil
* Drillship 6th
unit, Sete Brasil
* Drillship 7th
unit, Sete Brasil

7/28/2016
14
• Floaters revenue increased 26% yoy to $433 million in 1H 2016
• FPSO Prof. John EA Mills recently delivered to Modec in 1Q 2016.
• 7 projects in work-in-progress stage.
Core Business: Floaters revenue robust
-
100
200
300
400
500
600
700
800
900
2009 2010 2011 2012 2013 2014 2015 1H 2015
1H 2016
599
501
719
621
336
428
891
345
433
$ MILLION
Revenue – Floaters ($m) Offshore conversionsNo. of
projects Brief description
No. of Projects recently delivered in 1H 2016 1
* FPSO Prof. John EA Mills to Modec for Ghana Ten field
No. of projects in the WIP
Stage 6 * FSO Gina Krog
* P68 FPSO for Petrobras* P71 FPSO for Petrobras
* FPSO Norte - Kaombo(Olympia)
* FPSO Libra
* FPSO Sul - Kaombo(Antartica)
No. of projects in the Planning & Engineering stage 1
* FSO newbuild – Modec for Culzean field
27
-
200
400
600
800
1,000
1,200
2009 2010 2011 2012 2013 2014 2015 1H 2015
1H 2016
744
319 354
774 868
925 1,017
488 589
Revenue - Offshore Platforms ($m)
Core Business: Offshore Platforms sales in healthy uptrend
Offshore PlatformsNo. of
projects Brief description
Number of projects
delivered in 1H 2016 1 * Ivar Aasen
Number of projects in the
WIP stage 5 * Wheatstone
* Siemens Dudgeon
* Maersk Culzean
topsides
* Yamal LNG Batch 3/4/5* Yamal PAU module
28
• Offshore Platforms revenue increased 21% year on year to $589 million in 1H 2016
• 4 projects in work-in-progress stage.

7/28/2016
15
CAPITAL, GEARING &ROE
29
30
CASHFLOW

7/28/2016
16
New Contracts Secured by Product Type ($320 million)
31* Semisubmersibles include drilling, well intervention, accommodation and crane units
292 556 693 1,009 1,643
314 180 230
550 780 79
1,174
298
1,565
140-
1,935 1,875
1,335
2,581 871
723
376 1,557
439
1,292
-
6,999
-
1,360
-
2,000
4,000
6,000
8,000
10,000
12,000
2009 2010 2011 2012 2013 2014 2015 2016 YTD
S$
millio
n
Contracts secured todate [excludes Repair]
Drillship
Semi-submersible/intervention/crane
Jack Up
Offshore Platforms
Floaters
Net Order Book at $9.2 billion
32
797 647 765 1,352 968
2,232 1,876 1,646 409 638 1,070
782 1,267
887 1,832 1,470
871 1,642
2,775 2,020 2,398
1,591 625
408 3,463 1,491
486 1,908
1,608 660 1,533
1,305
6,666 6,096
6,062 4,502
4,397
5,540
4,418 5,096
12,728 12,337
11,432
10,368
9,226
-
2,000
4,000
6,000
8,000
10,000
12,000
14,000
2009 2010 2011 2012 2013 2014 2015 2016 YTD
S$
millio
n
Net Orderbook (by product type)
Drillship
Semi-submersible
Jack Up
Offshore Platform
Floaters

7/28/2016
17
33
OFFSHORE PLATFORMS
18%
RIGS & FLOATERS
82%
Offshore Platform
18%
Floaters18%
Jackup6%
* Semisubs15%
Drillships43%
2015 – Total $10.4 billion
OFFSHOREPLATFORMS
16%
RIGS & FLOATERS
84%
Offshore Platforms
16%
Floaters18%
Jackup4%
* Semisubs14%
Drillships48%
2016 YTD – Total $9.2 billion
Net order backlog by division and product type
* Semisubmersibles include drilling, well intervention, accommodation and crane units
1H 2016 ResultsAppendix
34

7/28/2016
18
ROBUST BUSINESS MODEL
FOUR KEY CAPABILITIES

7/28/2016
19
Leaders in offshore marine engineering solutions
37
Increased stake in Gravifloat to 56% after buying an additional 44% for US$38 million
• Under the agreement, the Company will eventually increase its stake by a further 44% to 100% through an equity purchase at the same price.
• GraviFloat was formed to design, deliver and operate re-deployable, gravity-based, modularised LNG and LPG Terminals for installation in shallow waters.
• Incorporated in Norway in 2006 as a spin-off of LMG Marin (a marine & engineering and naval architecture company), GraviFloat is headquartered in Bergen.
• GraviFloat technology allows the LNG terminal to be fully built and completed at a shipyard and installed in shallow waters to facilitate direct ship loading of LNG.
• It offers a more cost effective solution compared with FSRU (floating, storage and regasification units) and land terminals, and can be designed for both liquefaction and receiving terminal services.
38
Growing nonGrowing non--drilling solutions drilling solutions -- GravifloatGravifloat

7/28/2016
20
The GF Design Platform can integrate witha variety of topsides to form a unit. Eachunit can operate as a standalone platform,or be connected with other units,depending on type and scale required.
Various operations under the GF-Design: -
• GF-SRU – a storage and regassificationunit
• GF-Power – a small scale LNG plant with CCGT plants, with integrated storage, regas and terminal functions
• GF-LNG – integrated LNG terminals, and liquefaction plant and LNG export terminal
• GF-Bunkering Terminal – storage for redistribution and/or bunkering
39
Growing nonGrowing non--drilling solutions drilling solutions -- GravifloatGravifloat
Liquefaction plant and LNG export terminal with capacity for 2 to 3 million tons of LNG per year. .
Based on either the 30,000m3 or the 60,000m3 modules the GF-SRU comprises a nearshore and scalable receiving, storage and regasification terminal that can be adapted to meet the actual demand.
A small-scale LNG power generation.
39
Growing new technology solutions – SSP Offshore
Sembcorp Marine to offer new tech solutions using circular hull form with SSP Offshore
• The Group signed a sales & purchase agreement with SSP Offshore to acquire substantially all its business assets for US$21 million.
• Key assets of SSP Offshore include its flagship SSP Floater technology – the next-generation circular hull form – and the company’s entire portfolio of proprietary SSP® (Satellite Services Platform) solutions, including the SSP Driller for deep-water drilling, the SSP Plus FPSO for production and storage, and the SSP Hub for logistic hub applications.
• The acquisition of SSP Offshore assets is in line with the Group’s strategy of diversifying its product offerings and expanding into new market segments to further grow its offshore and marine business.
40

7/28/2016
21
This release may contain forward-looking statements that involve risks
and uncertainties. Actual future performance, outcomes and results may
differ materially from those expressed in forward-looking statements as
a result of a number of risks, uncertainties and assumptions.
Representative examples of these factors include (without limitation)
general industry and economic conditions, interest rate trends,
exchange rate movement, cost of capital and capital availability,
competition from other companies and venues for sale and distribution
of goods and services, shifts in customer demands, customers and
partners, changes in operating expenses, including employee wages,
benefits and training, governmental and public policy changes. The
forward-looking statements reflect the current views of Management on
future trends and developments.