Embed Size (px)
Citation preview

CENTRAL BANK OF SRI LANKA
SELECTEDECONOMIC INDICATORS
September 2006
. Economic Research Department 30, Janadhipathi Mawatha
Colombo 1 Tel. : (94 11) 2477177 E-mail : [email protected]
Website : http://www.centralbanklanka.org
CONTENTS
SUBJECT PAGE
1 TRENDS IN ECONOMIC INDICATORS (Charts) I-III
2 SUMMARY IV
3 QUARTERLY GROSS DOMESTIC PRODUCT 1
4 AGRICULTURE 2
5 INDUSTRY 3
6 TELECOMMUNICATIONS 3
7 ENERGY 4
8 HOUSING & CONSTRUCTION 4
9 TRANSPORT 5
10 PORTS 5
11 PRICES 6
12 AVERAGE RETAIL PRICES (PETTAH MARKET) 6
13 UNEMPLOYMENT & WAGE INDICES 6
14 GOVERNMENT FINANCE 7
15 MONETARY AGGREGATES 8
16 BANKING 9
17 INTEREST RATES 10
18 CREDIT CARDS 11
19 COMMERCIAL PAPER 11
20 SHARE MARKET 11
21 EXTERNAL TRADE 12
22 INTERNATIONAL FINANCE 17
TRENDS IN ECONOMIC INDICATORS
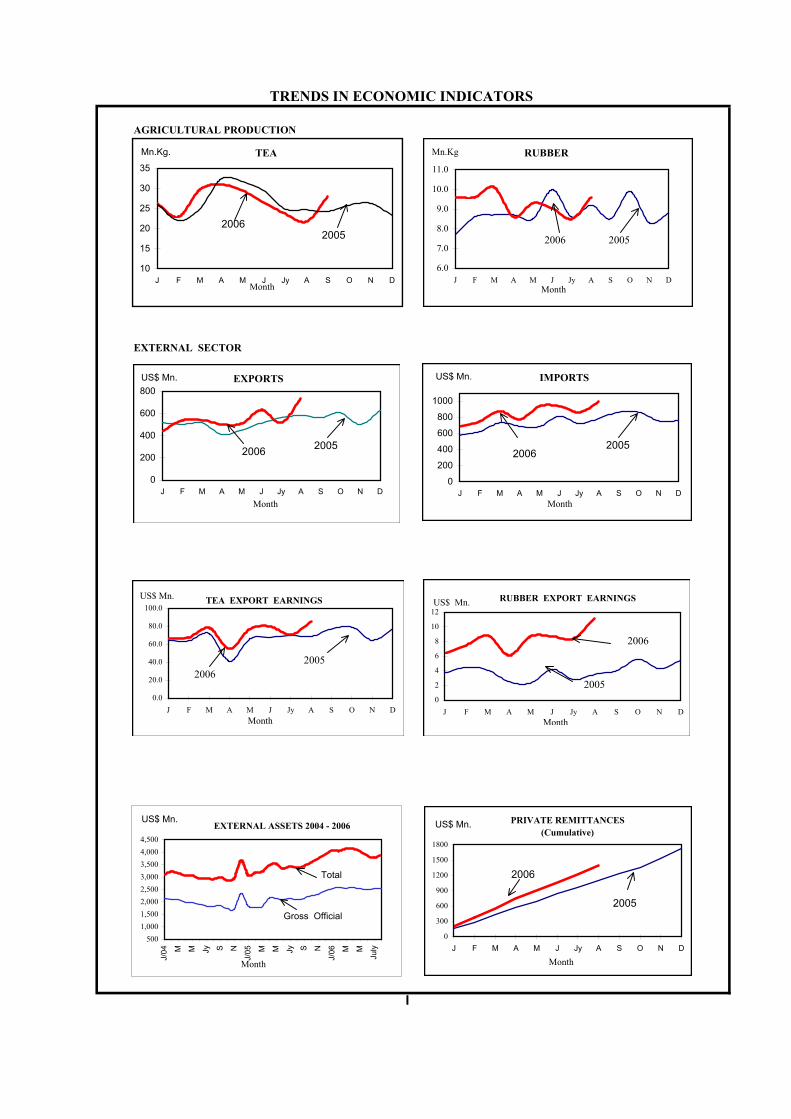
AGRICULTURAL PRODUCTION
EXTERNAL SECTOR
I
10
15
20
25
30
35
J F M A M J Jy A S O N D
TEAMn.Kg.
Month
20052006
6.0
7.0
8.0
9.0
10.0
11.0
J F M A M J Jy A S O N D
RUBBERMn.Kg
2006 2005
Month
0
200
400
600
800
J F M A M J Jy A S O N D
EXPORTSUS$ Mn.
Month
20052006
0
200
400
600
800
1000
J F M A M J Jy A S O N D
US$ Mn. IMPORTS
20052006
Month
0
2
4
6
8
10
12
J F M A M J Jy A S O N D
RUBBER EXPORT EARNINGSUS$ Mn.
2005
2006
Month
0.0
20.0
40.0
60.0
80.0
100.0
J F M A M J Jy A S O N D
TEA EXPORT EARNINGSUS$ Mn.
20062005
Month
PRIVATE REMITTANCES(Cumulative)
0
300
600
900
1200
1500
1800
J F M A M J Jy A S O N D
Month
2006
2005
US$ Mn.
5001,0001,5002,0002,5003,0003,5004,0004,500
J/04 M M Jy S N
J/05 M M Jy S N
J/06 M M
July
EXTERNAL ASSETS 2004 - 2006
Month
US$ Mn.
Total
Gross Official
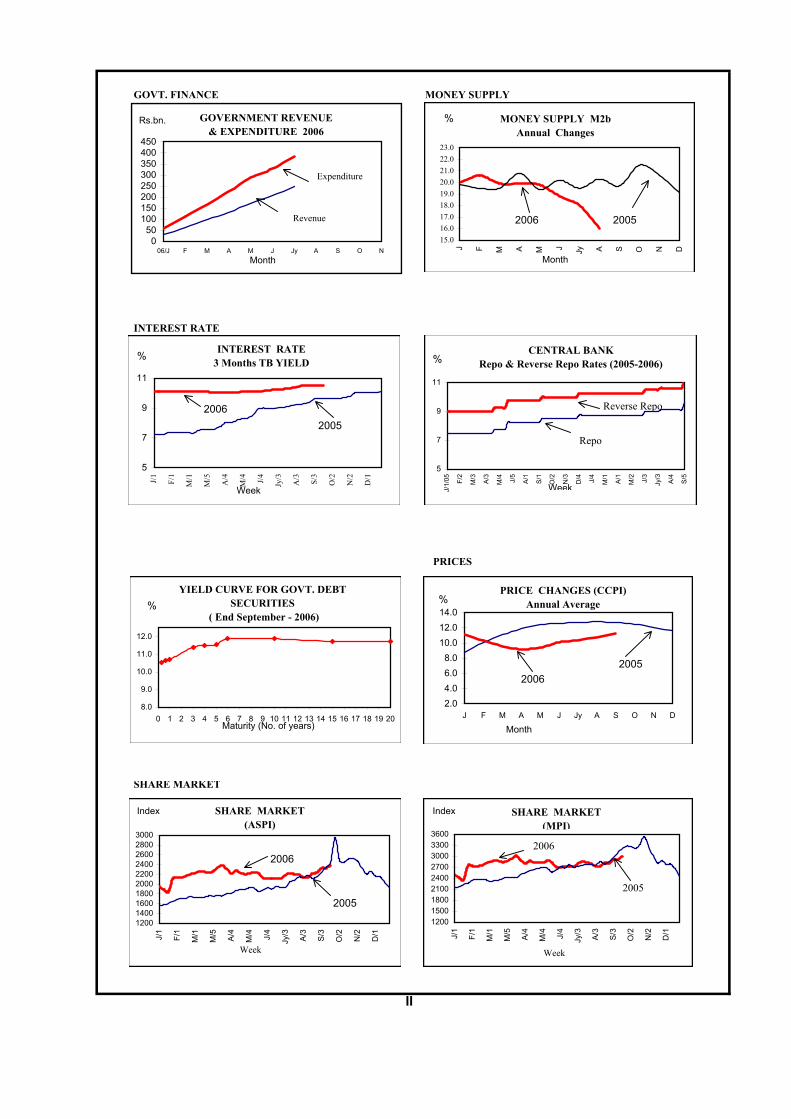
GOVT. FINANCE MONEY SUPPLY
INTEREST RATE
PRICES
SHARE MARKET
II
15.016.017.018.019.020.021.022.023.0
J F M A M J Jy A S O N D
% MONEY SUPPLY M2bAnnual Changes
20052006
Month
050
100150200250300350400450
06/J F M A M J Jy A S O N
GOVERNMENT REVENUE& EXPENDITURE 2006
Rs.bn.
Expenditure
Revenue
Month
1200140016001800200022002400260028003000
J/1
F/1
M/1
M/5
A/4
M/4 J/4
Jy/3
A/3
S/3
O/2
N/2
D/1
SHARE MARKET(ASPI)
Index
Week
2005
2006
120015001800210024002700300033003600
J/1
F/1
M/1
M/5
A/4
M/4 J/4
Jy/3
A/3
S/3
O/2
N/2
D/1
Week
SHARE MARKET(MPI)
Index
2005
2006
2.04.06.08.0
10.012.014.0
J F M A M J Jy A S O N D
%
20062005
PRICE CHANGES (CCPI)Annual Average
Month
5
7
9
11
J/1
F/1
M/1
M/5
A/4
M/4 J/4
Jy/3
A/3 S/3
O/2
N/2
D/1
INTEREST RATE3 Months TB YIELD%
Week
20052006
5
7
9
11
J/1/
05 F/2
M/3 A/3
M/4 J/5
A/1
S/1
O/2
N/3
D/4 J/4
M/1 A/1
M/2 J/3
Jy/3
A/4
S/5
Week
CENTRAL BANK Repo & Reverse Repo Rates (2005-2006)
Repo
Reverse Repo
%
8.0
9.0
10.0
11.0
12.0
0 1 2 3 4 5 6 7 8 9 10 11 12 13 14 15 16 17 18 19 20Maturity (No. of years)
YIELD CURVE FOR GOVT. DEBT SECURITIES
( End September - 2006)%
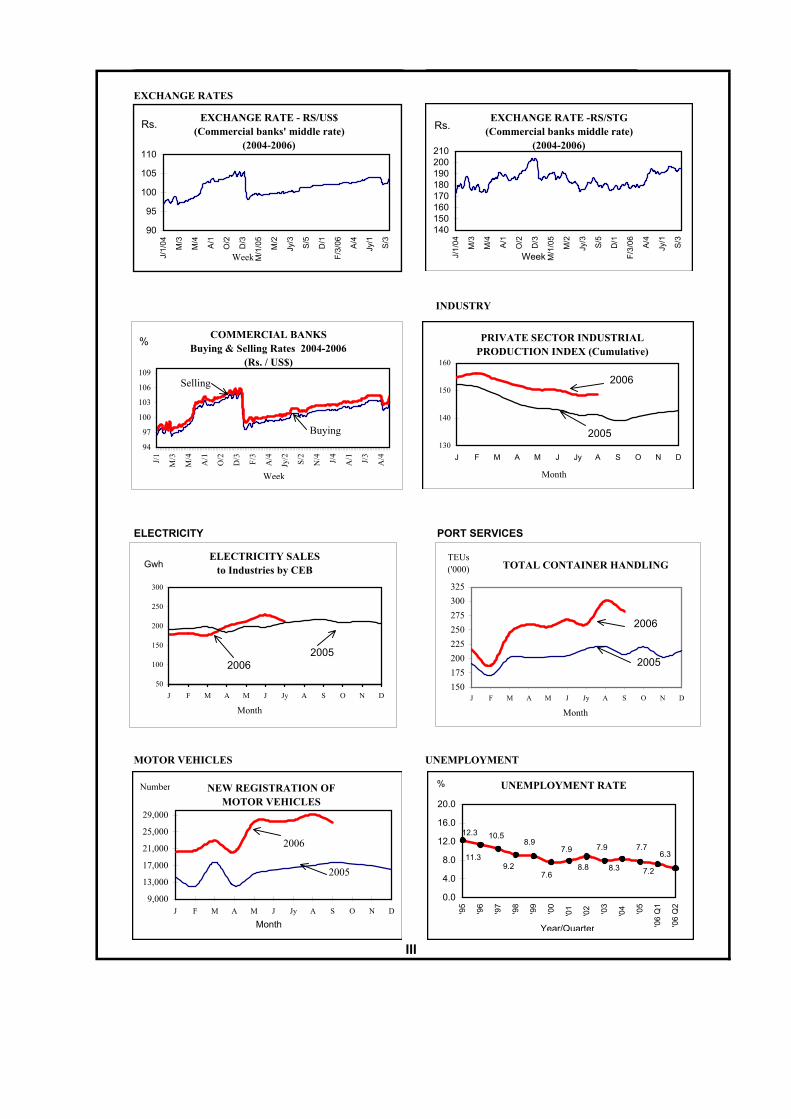
EXCHANGE RATES
INDUSTRY
ELECTRICITY PORT SERVICES
MOTOR VEHICLES UNEMPLOYMENT
III
90
95
100
105
110J/
1/04 M/3
M/4
A/1
O/2
D/3
M/1
/05
M/2
Jy/3
S/5
D/1
F/3/
06 A/4
Jy/1
S/3
EXCHANGE RATE - RS/US$(Commercial banks' middle rate)
(2004-2006)
Rs.
Week
140150160170180190200210
J/1/
04 M/3
M/4
A/1
O/2
D/3
M/1
/05
M/2
Jy/3
S/5
D/1
F/3/
06 A/4
Jy/1
S/3
Week
EXCHANGE RATE -RS/STG(Commercial banks middle rate)
(2004-2006)
Rs.
130
140
150
160
J F M A M J Jy A S O N D
PRIVATE SECTOR INDUSTRIAL PRODUCTION INDEX (Cumulative)
2005
2006
Month
6.3
7.2
7.7
8.3
7.9
8.8
7.9
7.69.2
8.910.512.3
11.3
0.0
4.0
8.0
12.0
16.0
20.0
'95
'96
'97
'98
'99
'00
'01
'02 '03
'04 '05
'06
Q1
'06
Q2
UNEMPLOYMENT RATE%%
Year/Quarter
9,000
13,000
17,000
21,000
25,000
29,000
J F M A M J Jy A S O N D
NEW REGISTRATION OFMOTOR VEHICLES
Number
2005
2006
Month
50
100
150
200
250
300
J F M A M J Jy A S O N D
20062005
Gwh
Month
ELECTRICITY SALES to Industries by CEB
94
97
100
103
106
109
J/1
M/3
M/4
A/1
O/2
D/3 F/3
A/4
Jy/2 S/2
N/4 J/4
A/1 J/3
A/4
COMMERCIAL BANKSBuying & Selling Rates 2004-2006
(Rs. / US$)
Selling
Buying
%
Week
TOTAL CONTAINER HANDLING
150175200225250275300325
J F M A M J Jy A S O N D
Month
TEUs ('000)
2006
2005

SUMMARY OF SELECTED ECONOMIC INDICATORS September 2006
Item Period Unit 2005 2006 % ChangeProduction
a). Tea Jan. - Sep. Mn. Kgs. 240.9 238.1 -1.2b). Rubber Jan. - Aug. Mn. Kgs. 69.9 74.3 6.3d). Coconut Jan. - Aug. Mn.Nuts 1,628.0 1,767.5 8.6
c). Fish Jan. - Aug. '000 MT 81.2 151.3 86.32004/2005 2005/2006
e). Paddy Maha(a) '000 MT 2,013 2,136 6.12005 2006
Yala(b) '000 MT 1,234 1,157 -6.22005 2006
f). Electricity Generation Jan. - Aug. Gwh. 5,753.0 6,251.0 8.7g) Private Sector Industrial
Volume Index Jan. - Aug. 1997 = 100 141.2 148.7 5.4h) Public Sector Major Industrial
Output Index Jan. - Aug. 1997 = 100 103.3 111.8 8.2External Sector
a). External Trade Exports Jan. - Aug. US$ Mn. 4,051 4,411 8.9 Imports Jan. - Aug. 5,626 6,811 21.1 Balance of Trade Jan. - Aug. -1,575 -2,400 52.4b). Balance of Payments Trade Account Jan. - June US$ Mn. -1,211.3 -1,798.0 -48.4 Current Account Jan. - June -372.2 -682.2 83.3 Overall Balance Jan. - June 173.9 146.1 -16.0
End Dec.'05 End Aug. '06
Total Reserves (c) US$ Mn. 3,924 3,889 -0.9Govt. Finance 2005 2006
a). Revenue Jan. - July Rs. Mn. 203,899 246,805 21.0b). Current Expenditure Jan. - July Rs. Mn. 247,063 303,539 22.9
Money & Share Markets a). Money Supply
Narrow Money M1 End August Rs. Mn. 212,080 238,622 12.5Broad Money M2 End August Rs. Mn. 757,307 906,553 19.7Consolidated Broad Money(M2b)(d) End August Rs. Mn. 945,538 1,097,189 16.0
Broad Money M4 End April Rs. Mn. 1,147,700 1,362,462 18.7b.) Share Market
ASPI End September 1985 = 100 2,434.4 2,383.4 -2.1 MPI End September 1998.12.31=1000 3,208.9 3,006.2 -6.3 Market Capitalisation End September Rs. Bn. 734.8 729.5 -0.7
Prices (Annual Avg. % Change) 12 months ending
a) CCPI September 1952 = 100 12.7 11.2
b) SLCPI August 1995-1997 = 100 14.3 6.3
c) CDCPI August Oct.1996 - 11.3 6.2 Sep. 1997=100
d) WPI August 1974=100 17.2 8.0
(a) Sep\Oct-March\April (c) Excluding ACU receipts (b) April\May-Aug\Sep (d) Inclusive of FCBUs
IV

Growth rates (%) Contribution to Sector ( Rs. Mn.) First Quarter Growth (%)
First Quarter2004 2005 (a) 2006 (b) 05/04 06/05 2005 (a) 2006 (b)
Agriculture 47,391 47,069 50,706 -0.7 7.7 -3.1 17.4
Industry 63,642 68,406 72,255 7.5 5.6 45.6 18.4
Services 129,620 135,635 149,088 4.6 9.9 57.5 64.2GDP 240,653 251,109 272,049 4.3 8.3 100.0 100.0
At constant (1996) factor cost prices (a) Revised (b) Provisional
Growth rates (%) Contribution to Sector Second Quarter Growth (%)
Second Quarter2004 2005 (a) 2006(b) 05/04 06/05 2005 (a) 2006(b)
Agriculture 37,212 36,247 38,559 -2.6 6.4 -6.9 12.8
Industry 59,373 64,660 68,970 8.9 6.7 37.6 23.9
Services 126,843 136,574 147,951 7.7 8.3 69.2 63.2GDP 223,428 237,482 255,480 6.3 7.6 100.0 100.0
At constant (1996) factor cost prices (a) Revised (b) Provisional
Growth rates (%) Contribution to Sector First Half Growth (%)
first Half2004 2005 (a) 2006 (b) 05/04 06/05 2005 (a) 2006 (b)
Agriculture 84,603 83,315 89,265 -1.5 7.1 -5.3 15.3
Industry 123,015 133,066 141,225 8.2 6.1 41.0 21.0
Services 256,464 272,209 297,039 6.1 9.1 64.2 63.8 GDP 464,082 488,591 527,530 5.3 8.0 100.0 100.0
At constant (1996) factor cost prices (a) Revised (b) Provisional
Growth rates (%) Contribution to Sector Fourth Quarter Growth (%)
Third Quarter2003 2004 (a) 2005 (b) 04/03 05/04 2004 2005 (a)
Agriculture 49,088 47,693 49,877 -2.8 4.6 -12.5 12.6
Industry 64,807 68,730 74,880 6.1 8.9 35.1 35.4
Services 142,450 151,100 160,155 6.1 6.0 77.4 52.0 GDP 256,346 267,534 284,912 4.4 6.5 100.0 100.0
At constant (1996) factor cost prices (a) Revised (b) Provisional
1. GDP ESTIMATES
First Half(Rs. Mn)
Fourth Quarter(Rs. Mn)
Second Quarter(Rs. Mn)
First Quarter
Page 1
Item UNIT 2005 2006* CHANGEAbsolute Percentage
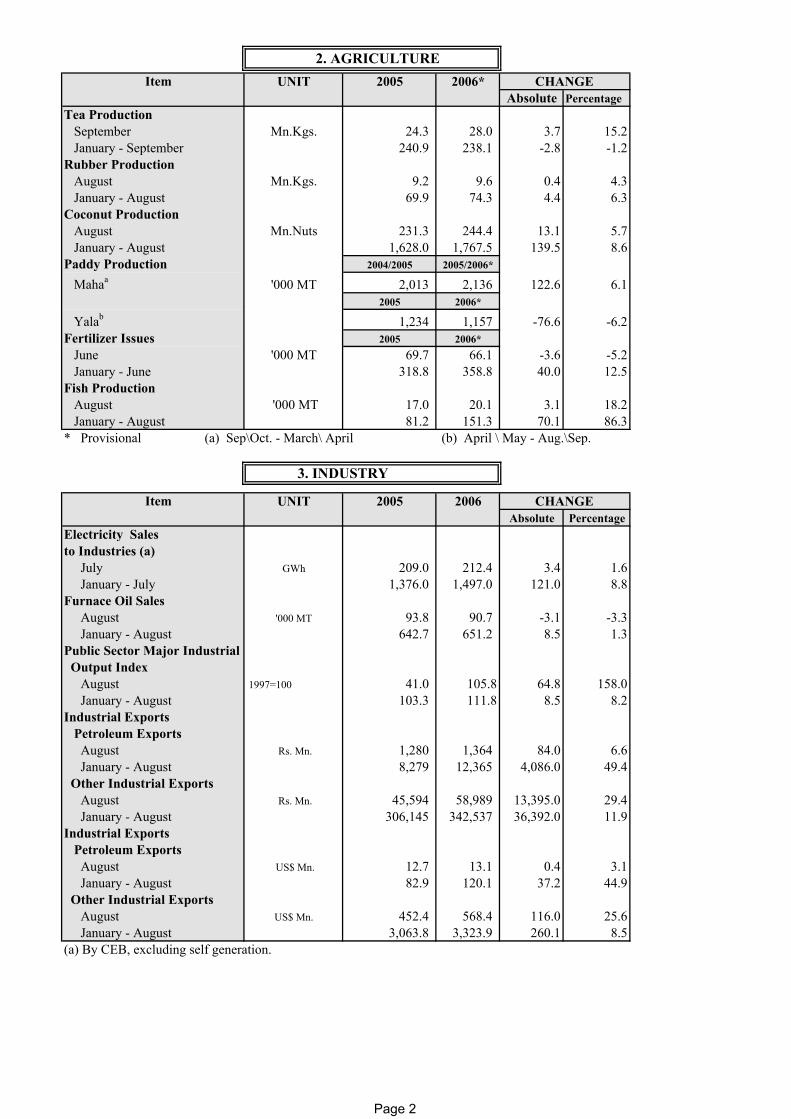
Tea Production September Mn.Kgs. 24.3 28.0 3.7 15.2 January - September 240.9 238.1 -2.8 -1.2Rubber Production August Mn.Kgs. 9.2 9.6 0.4 4.3 January - August 69.9 74.3 4.4 6.3Coconut Production August Mn.Nuts 231.3 244.4 13.1 5.7 January - August 1,628.0 1,767.5 139.5 8.6Paddy Production 2004/2005 2005/2006*
Mahaa '000 MT 2,013 2,136 122.6 6.12005 2006*
Yalab 1,234 1,157 -76.6 -6.2Fertilizer Issues 2005 2006* June '000 MT 69.7 66.1 -3.6 -5.2 January - June 318.8 358.8 40.0 12.5Fish Production August '000 MT 17.0 20.1 3.1 18.2 January - August 81.2 151.3 70.1 86.3* Provisional (a) Sep\Oct. - March\ April (b) April \ May - Aug.\Sep.
Item UNIT 2005 2006 CHANGEAbsolute Percentage
Electricity Sales to Industries (a) July GWh 209.0 212.4 3.4 1.6 January - July 1,376.0 1,497.0 121.0 8.8Furnace Oil Sales August '000 MT 93.8 90.7 -3.1 -3.3 January - August 642.7 651.2 8.5 1.3Public Sector Major Industrial Output Index August 1997=100 41.0 105.8 64.8 158.0 January - August 103.3 111.8 8.5 8.2Industrial Exports Petroleum Exports August Rs. Mn. 1,280 1,364 84.0 6.6 January - August 8,279 12,365 4,086.0 49.4 Other Industrial Exports August Rs. Mn. 45,594 58,989 13,395.0 29.4
January - August 306,145 342,537 36,392.0 11.9Industrial Exports Petroleum Exports August US$ Mn. 12.7 13.1 0.4 3.1 January - August 82.9 120.1 37.2 44.9 Other Industrial Exports August US$ Mn. 452.4 568.4 116.0 25.6 January - August 3,063.8 3,323.9 260.1 8.5(a) By CEB, excluding self generation.
2. AGRICULTURE
3. INDUSTRY
Page 2

( Industry cont…..)
Item
August Jan - Aug. August Jan - Aug.
Food, beverages & tobacco products 147.0 140.8 156.0 148.9 5.8 Food 151.2 148.7 159.4 156.6 5.3 Liquor 154.3 145.7 168.7 157.3 8.0 Beverages 167.2 142.8 182.1 155.0 8.6 Tobacco 100.6 102.2 102.6 104.2 1.9
Textile, wearing apparel & leather products 128.9 137.3 137.5 143.0 4.2 Apparel 134.6 143.2 143.8 148.9 4.0 Textile 93.5 98.5 98.3 104.1 5.7 Leather 103.2 110.5 108.4 116.5 5.5
Wood & wood products 145.7 125.0 153.7 130.8 4.7Paper & paper products 144.8 121.2 153.1 127.4 5.1Chemicals, ruber , plastic & petroleum 165.5 159.5 177.5 169.9 6.6 products Chemical & fertilizer 109.3 126.1 123.6 136.1 8.0 Rubber 235.0 201.9 245.2 215.3 6.6 Plastic & PVC 173.0 162.1 196.2 176.5 8.9 Pharmaceuticals & detergents 123.6 134.1 132.9 140.7 4.9Non metalic mineral products 136.8 139.5 154.0 152.9 9.6 Diamond processing 68.9 134.4 79.5 146.3 8.9 Ceramic products 143.6 116.6 151.8 125.1 7.3 Cement 149.5 148.6 171.6 164.0 10.4 Building Materials 153.7 152.6 176.5 168.7 10.6Basic metal products 168.9 149.7 180.5 157.8 5.4Fabricated metal products 161.8 135.2 170.8 140.5 3.9Other industrial products (n.e.s.) 132.5 128.2 137.8 132.9 3.7
Total 141.2 141.2 151.0 148.7 5.4
Absolute Percentage
Telephones (Fixed lines) Number 1,243,993 1,509,913 265,920 21.4 Sri Lanka Telecom Phones Number 954,060 1,070,744 116,684 12.2 Wireless Local Loop Phones Number 289,933 439,169 149,236 51.5 (Suntel and Lanka Bell)Telephone Density(excluding Cellular Phones) per 100 persons 6.32 7.59 1.27 20.1Telephone Density(including Cellular Phones per 100 persons 23.58 29.14 5.56 23.6Cellular Phones Number 3,393,345 4,284,256 890,911 26.3Public Pay Phones Number 6,285 7,260 975 15.5Internet and E - mail subscribers Number 115,072 125,800 10,728 9.3
* Provisional
2005 2006*
PRIVATE SECTOR MONTHLY INDUSTRIAL VOLUME INDEX ( 1997 = 100 )
End June 2006*Item UNIT End 2005
Percentage Change (Jan -
Aug.)
4.TELECOMMUNICATIONS
CHANGE
Page 3
Item UNIT 2005 2006 CHANGEAbsolute Percentage
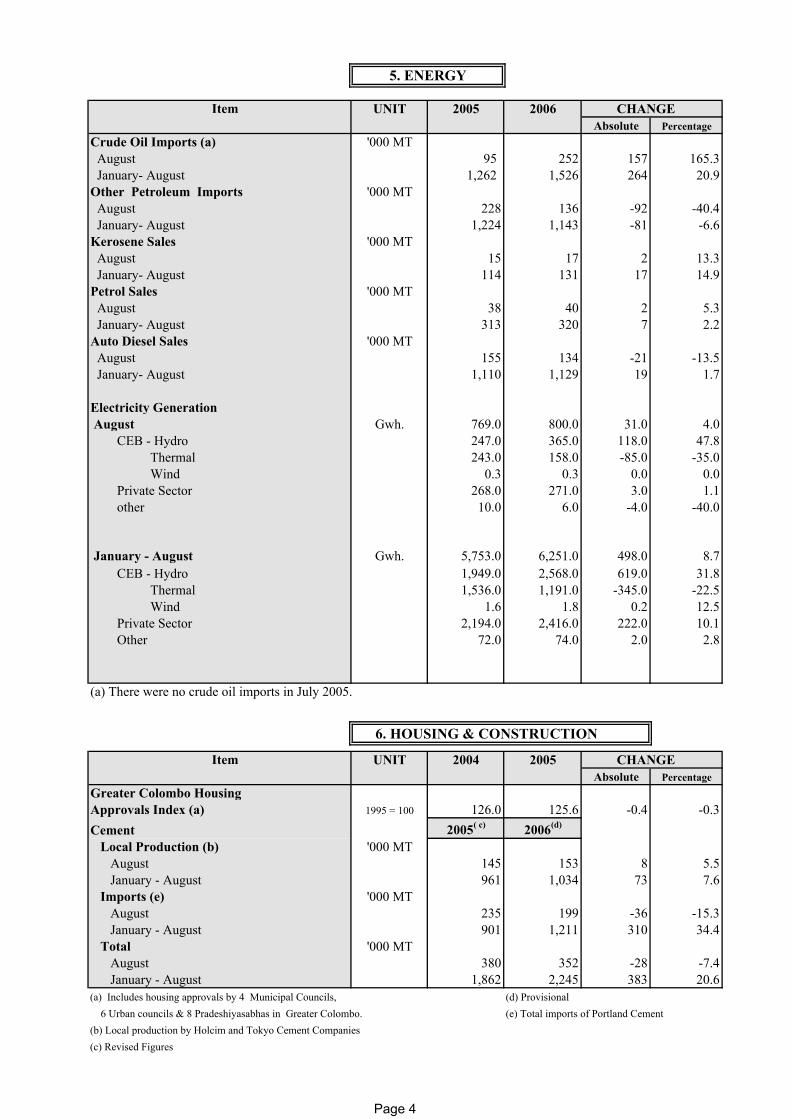
Crude Oil Imports (a) '000 MT August 95 252 157 165.3 January- August 1,262 1,526 264 20.9Other Petroleum Imports '000 MT August 228 136 -92 -40.4 January- August 1,224 1,143 -81 -6.6Kerosene Sales '000 MT August 15 17 2 13.3 January- August 114 131 17 14.9Petrol Sales '000 MT August 38 40 2 5.3 January- August 313 320 7 2.2Auto Diesel Sales '000 MT August 155 134 -21 -13.5 January- August 1,110 1,129 19 1.7
Electricity Generation August Gwh. 769.0 800.0 31.0 4.0 CEB - Hydro 247.0 365.0 118.0 47.8 Thermal 243.0 158.0 -85.0 -35.0 Wind 0.3 0.3 0.0 0.0 Private Sector 268.0 271.0 3.0 1.1 other 10.0 6.0 -4.0 -40.0
January - August Gwh. 5,753.0 6,251.0 498.0 8.7 CEB - Hydro 1,949.0 2,568.0 619.0 31.8 Thermal 1,536.0 1,191.0 -345.0 -22.5 Wind 1.6 1.8 0.2 12.5 Private Sector 2,194.0 2,416.0 222.0 10.1 Other 72.0 74.0 2.0 2.8
(a) There were no crude oil imports in July 2005.
6. HOUSING & CONSTRUCTION
Item UNIT 2004 2005 CHANGEAbsolute Percentage
Greater Colombo HousingApprovals Index (a) 1995 = 100 126.0 125.6 -0.4 -0.3Cement 2005( c) 2006(d) Local Production (b) '000 MT August 145 153 8 5.5 January - August 961 1,034 73 7.6 Imports (e) '000 MT August 235 199 -36 -15.3 January - August 901 1,211 310 34.4 Total '000 MT August 380 352 -28 -7.4 January - August 1,862 2,245 383 20.6(a) Includes housing approvals by 4 Municipal Councils, (d) Provisional 6 Urban councils & 8 Pradeshiyasabhas in Greater Colombo. (e) Total imports of Portland Cement(b) Local production by Holcim and Tokyo Cement Companies(c) Revised Figures
5. ENERGY
Page 4
7. TRANSPORT
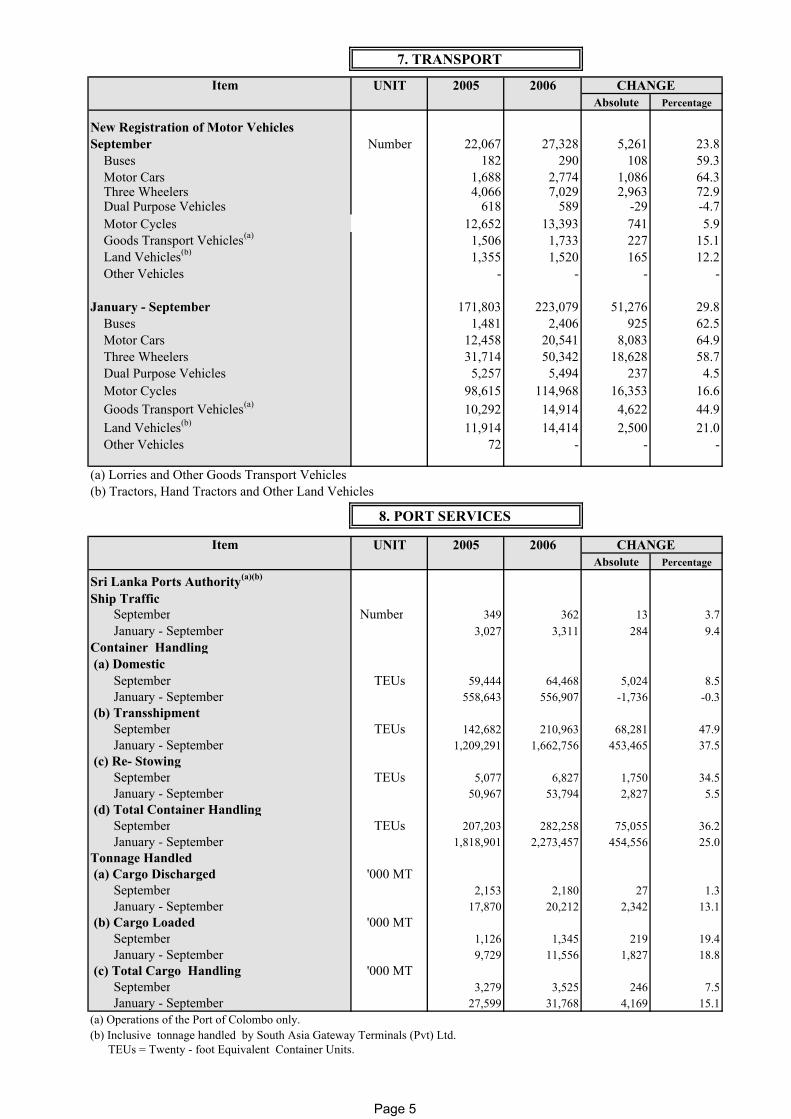
Item UNIT 2005 2006 CHANGEAbsolute Percentage
New Registration of Motor VehiclesSeptember Number 22,067 27,328 5,261 23.8 Buses 182 290 108 59.3 Motor Cars 1,688 2,774 1,086 64.3 Three Wheelers 4,066 7,029 2,963 72.9 Dual Purpose Vehicles 618 589 -29 -4.7 Motor Cycles 12,652 13,393 741 5.9 Goods Transport Vehicles(a) 1,506 1,733 227 15.1 Land Vehicles(b) 1,355 1,520 165 12.2 Other Vehicles - - - -
January - September 171,803 223,079 51,276 29.8 Buses 1,481 2,406 925 62.5 Motor Cars 12,458 20,541 8,083 64.9 Three Wheelers 31,714 50,342 18,628 58.7 Dual Purpose Vehicles 5,257 5,494 237 4.5 Motor Cycles 98,615 114,968 16,353 16.6 Goods Transport Vehicles(a) 10,292 14,914 4,622 44.9 Land Vehicles(b) 11,914 14,414 2,500 21.0 Other Vehicles 72 - - -
(a) Lorries and Other Goods Transport Vehicles
8. PORT SERVICES
Item UNIT 2005 2006 CHANGEAbsolute Percentage
Sri Lanka Ports Authority(a)(b) Ship Traffic
September Number 349 362 13 3.7 January - September 3,027 3,311 284 9.4Container Handling (a) Domestic September TEUs 59,444 64,468 5,024 8.5 January - September 558,643 556,907 -1,736 -0.3 (b) Transshipment September TEUs 142,682 210,963 68,281 47.9 January - September 1,209,291 1,662,756 453,465 37.5 (c) Re- Stowing September TEUs 5,077 6,827 1,750 34.5 January - September 50,967 53,794 2,827 5.5 (d) Total Container Handling September TEUs 207,203 282,258 75,055 36.2 January - September 1,818,901 2,273,457 454,556 25.0Tonnage Handled (a) Cargo Discharged '000 MT September 2,153 2,180 27 1.3 January - September 17,870 20,212 2,342 13.1 (b) Cargo Loaded '000 MT September 1,126 1,345 219 19.4 January - September 9,729 11,556 1,827 18.8 (c) Total Cargo Handling '000 MT September 3,279 3,525 246 7.5 January - September 27,599 31,768 4,169 15.1(a) Operations of the Port of Colombo only.(b) Inclusive tonnage handled by South Asia Gateway Terminals (Pvt) Ltd. TEUs = Twenty - foot Equivalent Container Units.
(b) Tractors, Hand Tractors and Other Land Vehicles
Page 5
9. PRICE INDICES Item BASE 2005 2006 CHANGE
PERIOD Absolute Percentage
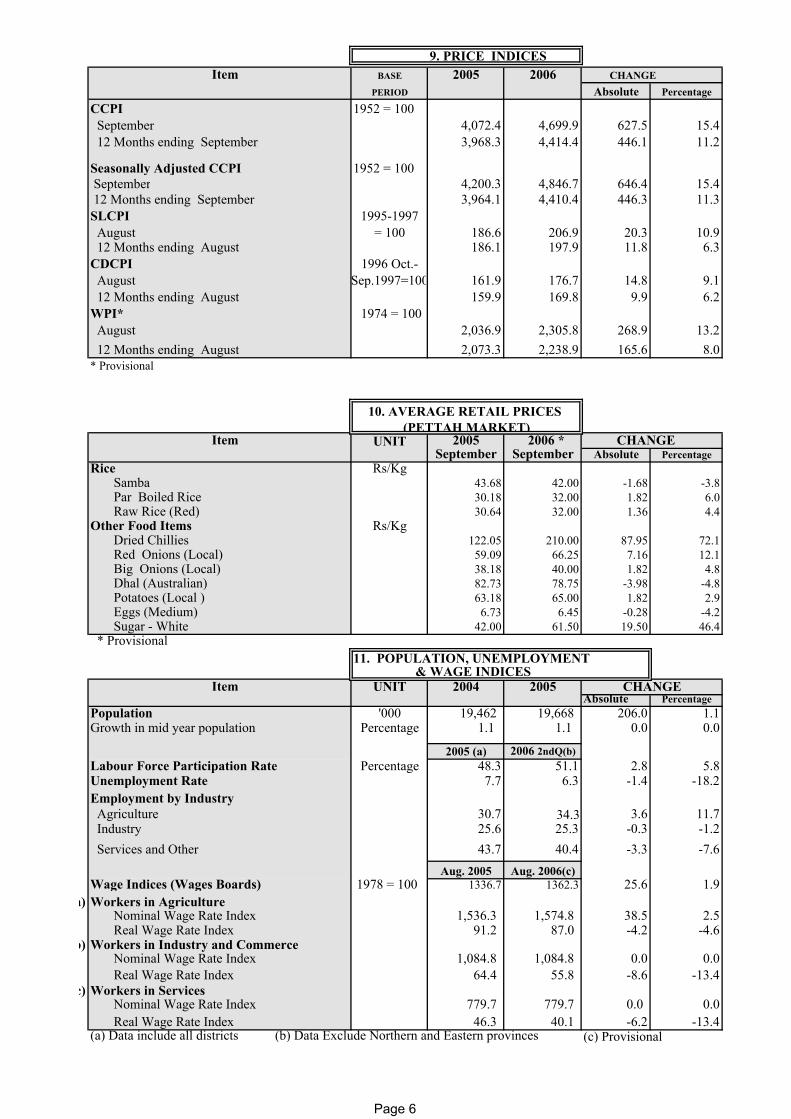
CCPI 1952 = 100 September 4,072.4 4,699.9 627.5 15.4 12 Months ending September 3,968.3 4,414.4 446.1 11.2
Seasonally Adjusted CCPI 1952 = 100 September 4,200.3 4,846.7 646.4 15.4 12 Months ending September 3,964.1 4,410.4 446.3 11.3SLCPI 1995-1997 August = 100 186.6 206.9 20.3 10.9 12 Months ending August 186.1 197.9 11.8 6.3CDCPI 1996 Oct.- August Sep.1997=100 161.9 176.7 14.8 9.1 12 Months ending August 159.9 169.8 9.9 6.2WPI* 1974 = 100 August 2,036.9 2,305.8 268.9 13.2 12 Months ending August 2,073.3 2,238.9 165.6 8.0
10. AVERAGE RETAIL PRICES (PETTAH MARKET)
Item UNIT 2005 2006 * CHANGESeptember September Absolute Percentage
Rice Rs/Kg Samba 43.68 42.00 -1.68 -3.8 Par Boiled Rice 30.18 32.00 1.82 6.0 Raw Rice (Red) 30.64 32.00 1.36 4.4Other Food Items Rs/Kg Dried Chillies 122.05 210.00 87.95 72.1 Red Onions (Local) 59.09 66.25 7.16 12.1 Big Onions (Local) 38.18 40.00 1.82 4.8 Dhal (Australian) 82.73 78.75 -3.98 -4.8 Potatoes (Local ) 63.18 65.00 1.82 2.9 Eggs (Medium) 6.73 6.45 -0.28 -4.2 Sugar - White 42.00 61.50 19.50 46.4 * Provisional
11. POPULATION, UNEMPLOYMENT
Item UNIT 2004 2005Absolute Percentage
Population '000 19,462 19,668 206.0 1.1Growth in mid year population Percentage 1.1 1.1 0.0 0.0
2005 (a) 2006 2ndQ(b)Labour Force Participation Rate Percentage 48.3 51.1 2.8 5.8Unemployment Rate 7.7 6.3 -1.4 -18.2Employment by Industry Agriculture 30.7 34.3 3.6 11.7 Industry 25.6 25.3 -0.3 -1.2 Services and Other 43.7 40.4 -3.3 -7.6
Aug. 2005 Aug. 2006(c)Wage Indices (Wages Boards) 1978 = 100 1336.7 1362.3 25.6 1.9
a) Workers in Agriculture Nominal Wage Rate Index 1,536.3 1,574.8 38.5 2.5 Real Wage Rate Index 91.2 87.0 -4.2 -4.6
b) Workers in Industry and Commerce Nominal Wage Rate Index 1,084.8 1,084.8 0.0 0.0 Real Wage Rate Index 64.4 55.8 -8.6 -13.4
c) Workers in Services Nominal Wage Rate Index 779.7 779.7 0.0 0.0 Real Wage Rate Index 46.3 40.1 -6.2 -13.4(a) Data include all districts (b) Data Exclude Northern and Eastern provinces
* Provisional
(c) Provisional
CHANGE & WAGE INDICES
Page 6
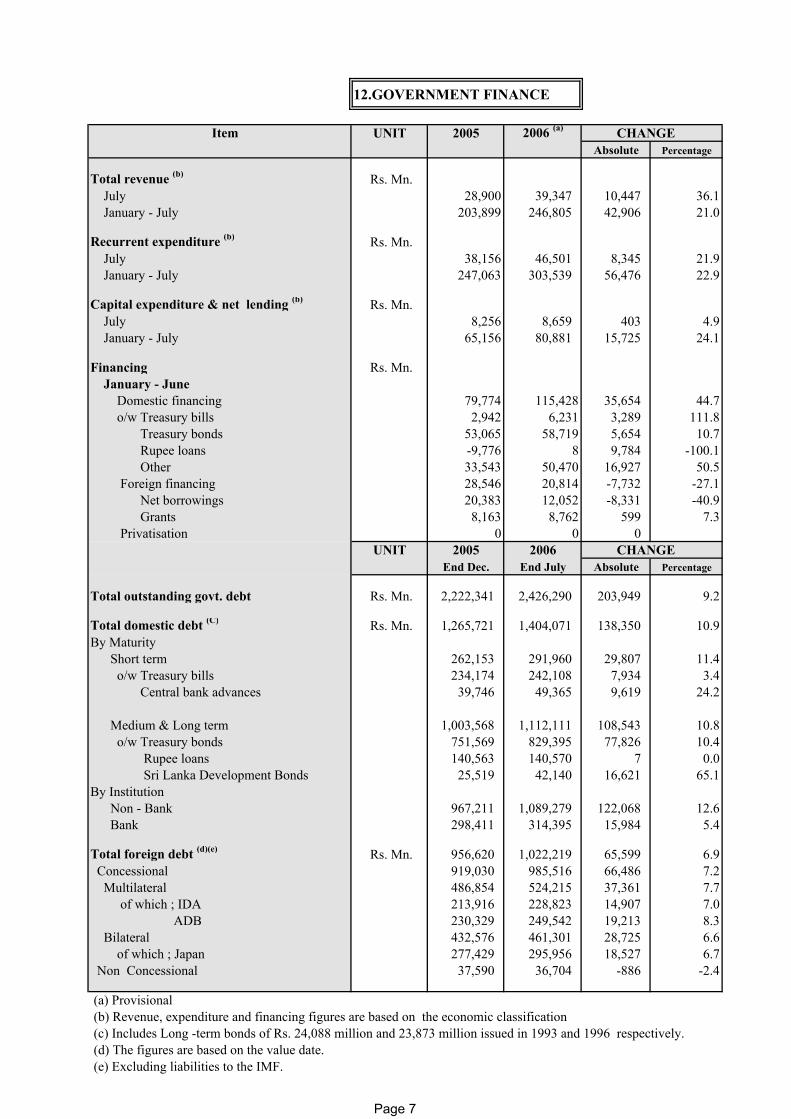
12.GOVERNMENT FINANCE
Item UNIT 2005 2006 (a) CHANGEAbsolute Percentage
Total revenue (b) Rs. Mn. July 28,900 39,347 10,447 36.1 January - July 203,899 246,805 42,906 21.0
Recurrent expenditure (b) Rs. Mn. July 38,156 46,501 8,345 21.9 January - July 247,063 303,539 56,476 22.9
Capital expenditure & net lending (b) Rs. Mn. July 8,256 8,659 403 4.9 January - July 65,156 80,881 15,725 24.1
Financing Rs. Mn. January - June Domestic financing 79,774 115,428 35,654 44.7 o/w Treasury bills 2,942 6,231 3,289 111.8 Treasury bonds 53,065 58,719 5,654 10.7 Rupee loans -9,776 8 9,784 -100.1 Other 33,543 50,470 16,927 50.5 Foreign financing 28,546 20,814 -7,732 -27.1 Net borrowings 20,383 12,052 -8,331 -40.9 Grants 8,163 8,762 599 7.3 Privatisation 0 0 0
UNIT 2005 2006 CHANGEEnd Dec. End July Absolute Percentage
Total outstanding govt. debt Rs. Mn. 2,222,341 2,426,290 203,949 9.2
Total domestic debt (C) Rs. Mn. 1,265,721 1,404,071 138,350 10.9By Maturity Short term 262,153 291,960 29,807 11.4 o/w Treasury bills 234,174 242,108 7,934 3.4 Central bank advances 39,746 49,365 9,619 24.2
Medium & Long term 1,003,568 1,112,111 108,543 10.8 o/w Treasury bonds 751,569 829,395 77,826 10.4 Rupee loans 140,563 140,570 7 0.0 Sri Lanka Development Bonds 25,519 42,140 16,621 65.1By Institution Non - Bank 967,211 1,089,279 122,068 12.6 Bank 298,411 314,395 15,984 5.4
Total foreign debt (d)(e) Rs. Mn. 956,620 1,022,219 65,599 6.9 Concessional 919,030 985,516 66,486 7.2 Multilateral 486,854 524,215 37,361 7.7 of which ; IDA 213,916 228,823 14,907 7.0 ADB 230,329 249,542 19,213 8.3 Bilateral 432,576 461,301 28,725 6.6 of which ; Japan 277,429 295,956 18,527 6.7 Non Concessional 37,590 36,704 -886 -2.4
(a) Provisional (b) Revenue, expenditure and financing figures are based on the economic classification (c) Includes Long -term bonds of Rs. 24,088 million and 23,873 million issued in 1993 and 1996 respectively. (d) The figures are based on the value date. (e) Excluding liabilities to the IMF.
Page 7

13. MONETARY AGGREGATES & UNDERLYING FACTORS
Item UNIT Beginning End CHANGEJanuary August Absolute Percentage
# Narrow Money Supply (M1) Rs. Mn. 2005 188,453 212,080 23,627 12.5 2006 230,702 238,622 7,920 3.4 Currency Held by the Public 2005 99,669 107,977 8,308 8.3 2006 114,070 121,483 7,413 6.5 Demand Deposits Held by the Public 2005 88,784 104,103 15,319 17.3 2006 116,632 117,140 508 0.4
# Broad Money Supply (M2)1 Rs. Mn.
2005 687,964 757,307 69,343 10.1 2006 822,932 906,553 83,621 10.2 Time & Savings Deposits Held by the Public (Quasi Money) Rs. Mn. 2005 499,511 545,227 45,716 9.2 2006 592,230 667,930 75,700 12.8 Underlying Factors(M2) Rs. Mn. Net Foreign Assets3
2005 129,153 140,041 10,888 8.4 2006 170,643 181,730 11,087 6.5 Domestic Credit
2005 734,605 792,719 58,114 7.9 2006 831,421 944,647 113,226 13.6
To Government (Net) 165,237 175,200 9,963 6.0 To Corporations 15,651 16,055 404 2.6 To Co- operatives 1,256 1,302 46 3.6 To Other Private Sector 649,277 752,090 102,813 15.8 Other Items (Net)3
2005 -175,793 -175,453 340 -0.2 2006 -179,132 -219,824 -40,692 22.7
# Consolidated Broad Money Supply(M2b)2 Rs.Mn. 2005 858,644 945,538 86,894 10.1 2006 1,022,278 1,097,189 74,911 7.3 Adjusted Time & Savings Deposits Held by the Public (Quasi Money) 2005 670,191 733,458 63,267 9.4 2006 791,576 858,566 66,990 8.5 Underlying Factors (M2b) Rs.Mn. Net Foreign Assets3
2005 170,218 188,569 18,351 10.8 2006 204,826 180,939 -23,888 -11.7 Domestic Credit 2005 895,942 966,566 70,624 7.9 2006 1,034,414 1,160,850 126,436 12.2 To Government (Net) 246,753 267,422 20,669 8.4 To Corporations 16,672 18,723 2,051 12.3 To Co- operatives 1,256 1,302 46 3.6 To Other Private Sector 769,732 873,403 103,671 13.5 Other Items (Net)3
2005 -207,515 -209,596 -2,081 1.0 2006 -216,962 -244,600 -27,638 12.7
# Reserve Money Rs. Mn. 2005 170,967 184,289 13,322 7.8 2006 197,932 213,895 15,963 8.1
# Money Multipliers M1 Multiplier 2005 1.10 1.15 2006 1.17 1.12 M2 Multiplier 2005 4.02 4.11 2006 4.16 4.24 M2b Multiplier 2005 5.02 5.13 2006 5.16 5.13 (1) M2 = M1 + Quasi Money * Provisional(2) Based on a consolidated monetary survey which covers aggregated data pertaining to both Domestic Banking Units (DBUs) and Foreign Currency Banking Units (FCBUs) of commercial banks operating in Sri Lanka. It also includes foreign currency deposits held by residents. M2b is the sum of M1 and adjusted quasi money. M1 is the same in both cases; i.e., DBU monetary survey and consolidated monetary survey.(3) Net Foreign Assets (NFA) of the Central Bank are based on market value from beginning of January 2002. This reflected in NFA and net other items.
Page 8

(Monetary Aggregates & Underlying Factors Contd …) Item UNIT Beginning End CHANGE
January April Absolute Percentage# Broad Money Supply (M4)* Rs.Mn.
2005 1,094,064 1,147,700 53,636 4.9 2006 1,293,974 1,362,462 68,488 5.3 Quasi Money 2005 909,042 943,719 34,677 3.8 2006 1,066,854 1,129,126 62,272 5.8 Underlying Factors (M4) Net Foreign Assets 2005 161,469 179,664 18,195 11.3 2006 195,767 220,992 25,225 12.9 Domestic Credit 2005 1,205,195 1,220,060 14,865 1.2 2006 1,411,409 1,482,169 70,760 5.0 To Government (Net) 409,362 429,332 19,970 4.9 To Corporations 16,672 18,667 1,995 12.0 To Other Private Sector 985,375 1,034,170 48,795 5.0 Other Items (Net) 2005 -272,600 -252,022 20,578 -7.5 2006 -313,201 -340,700 -27,499 8.8Reserve Money 2005 170,967 181,861 10,894 6.4 2006 197,932 216,094 18,162 9.2Money Multipliers M4 Multiplier 2005 6.40 6.31 -0.1 -1.4 2006 6.54 6.30 -0.2 -3.7
14. BANKING
Item UNIT 2005 2006 CHANGEEnd August End August Absolute Percentage
Commercial Banks(1) Loans & Advances (Total Outstanding) Rs. Mn. 603,393 759,417 156,024 25.9 Investment (Total Outstanding) Treasury Bills Rs. Mn. 31,257 45,154 13,897 44.5
Other Govt. Securities(2) 59,050 51,615 -7,435 -12.6
Other Investments 29,961 35,511 5,550 18.5
Total Deposits Rs. Mn. 871,777 1,021,955 150,178 17.2
Commercial Banks' Liquidity Excess Reserves and Cash in Hand Rs. Mn. 11,307 14,485 3,178 28.1
2005 2006 Call Market Borrowings
Last week of August Rs. Mn. 24,543 45,341 20,798 84.7 UNIT 2005 2006 CHANGE End Aug. End Aug. Absolute Percentage
Foreign Currency Banking Units(FCBUs)
Number of FCBUs Number 21 22 1 4.8
Total Assets / Liabilitiess Rs. Mn. 244,425 313,832 69,407 28.4 Assets Loans & Advances - Residents Rs. Mn. 177,945 235,502 57,557 32.3 Loans & Advances - Non-Residents 63,186 66,385 3,200 5.1 Other Assets 3,295 11,945 8,650 262.5 Liabilities Deposits & Borrowings - Residents Rs. Mn. 168,765 168,775 10 0.0 Deposits & Borrowings - Non-Residents 34,585 90,987 56,401 163.1 Other Liabilities 41,075 54,071 12,996 31.6National Savings Bank Time & Savings Deposits Rs. Mn. 184,446 204,367 19,921 10.8(1) Loans and advances include loans,overdrafts,bills (import,export and local bills) purchased and discounted. Prior to September 1998, loans and advances included loans, overdrafts,bills purchased and discounted (except export bills), investments and cash items in process of collection, to be consistent with the Monetary Survey.(2) Includes Rupee Securities and Treasury Bonds. Since 2001 November, balances in respect of dollar denominated Sri Lanka Development Bonds are included. *Provisional
* Based on financial survey which covers consolidated monetary survey data ( both DBUs & FCBUs) and transations of finance companies,licenced specialized banks and regional development banks.
Page 9
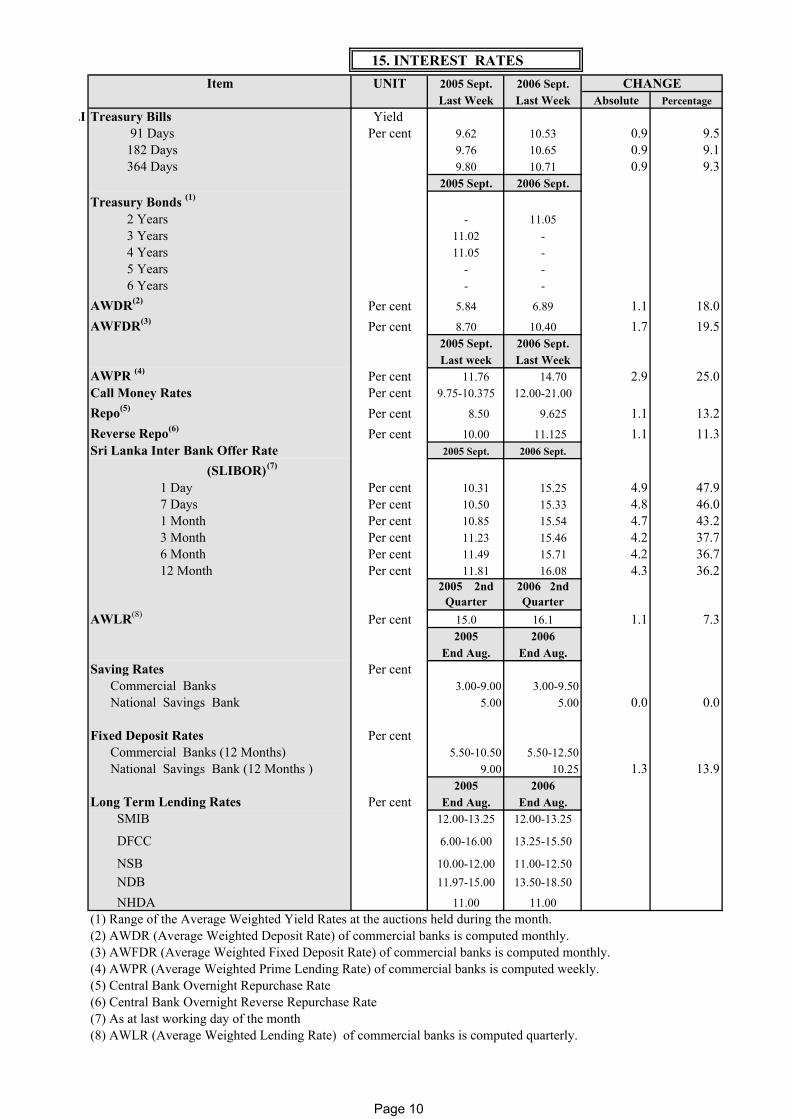
15. INTEREST RATESItem UNIT 2005 Sept. 2006 Sept. CHANGE
Last Week Last Week Absolute Percentage.I Treasury Bills Yield
91 Days Per cent 9.62 10.53 0.9 9.5 182 Days 9.76 10.65 0.9 9.1 364 Days 9.80 10.71 0.9 9.3
2005 Sept. 2006 Sept.Treasury Bonds (1)
2 Years - 11.05 3 Years 11.02 - 4 Years 11.05 - 5 Years - - 6 Years - -
AWDR(2) Per cent 5.84 6.89 1.1 18.0AWFDR(3) Per cent 8.70 10.40 1.7 19.5
2005 Sept. 2006 Sept.Last week Last Week
AWPR (4) Per cent 11.76 14.70 2.9 25.0Call Money Rates Per cent 9.75-10.375 12.00-21.00
Repo(5) Per cent 8.50 9.625 1.1 13.2Reverse Repo(6) Per cent 10.00 11.125 1.1 11.3Sri Lanka Inter Bank Offer Rate 2005 Sept. 2006 Sept.
(SLIBOR)(7)
1 Day Per cent 10.31 15.25 4.9 47.9 7 Days Per cent 10.50 15.33 4.8 46.0 1 Month Per cent 10.85 15.54 4.7 43.2 3 Month Per cent 11.23 15.46 4.2 37.7 6 Month Per cent 11.49 15.71 4.2 36.7 12 Month Per cent 11.81 16.08 4.3 36.2
2005 2nd Quarter
2006 2nd Quarter
AWLR(8) Per cent 15.0 16.1 1.1 7.32005 2006
End Aug. End Aug.Saving Rates Per cent Commercial Banks 3.00-9.00 3.00-9.50 National Savings Bank 5.00 5.00 0.0 0.0
Fixed Deposit Rates Per cent Commercial Banks (12 Months) 5.50-10.50 5.50-12.50
National Savings Bank (12 Months ) 9.00 10.25 1.3 13.92005 2006
Long Term Lending Rates Per cent End Aug. End Aug. SMIB 12.00-13.25 12.00-13.25
DFCC 6.00-16.00 13.25-15.50
NSB 10.00-12.00 11.00-12.50 NDB 11.97-15.00 13.50-18.50
NHDA 11.00 11.00(1) Range of the Average Weighted Yield Rates at the auctions held during the month.(2) AWDR (Average Weighted Deposit Rate) of commercial banks is computed monthly.(3) AWFDR (Average Weighted Fixed Deposit Rate) of commercial banks is computed monthly.
(4) AWPR (Average Weighted Prime Lending Rate) of commercial banks is computed weekly.(5) Central Bank Overnight Repurchase Rate(6) Central Bank Overnight Reverse Repurchase Rate(7) As at last working day of the month(8) AWLR (Average Weighted Lending Rate) of commercial banks is computed quarterly.
Page 10
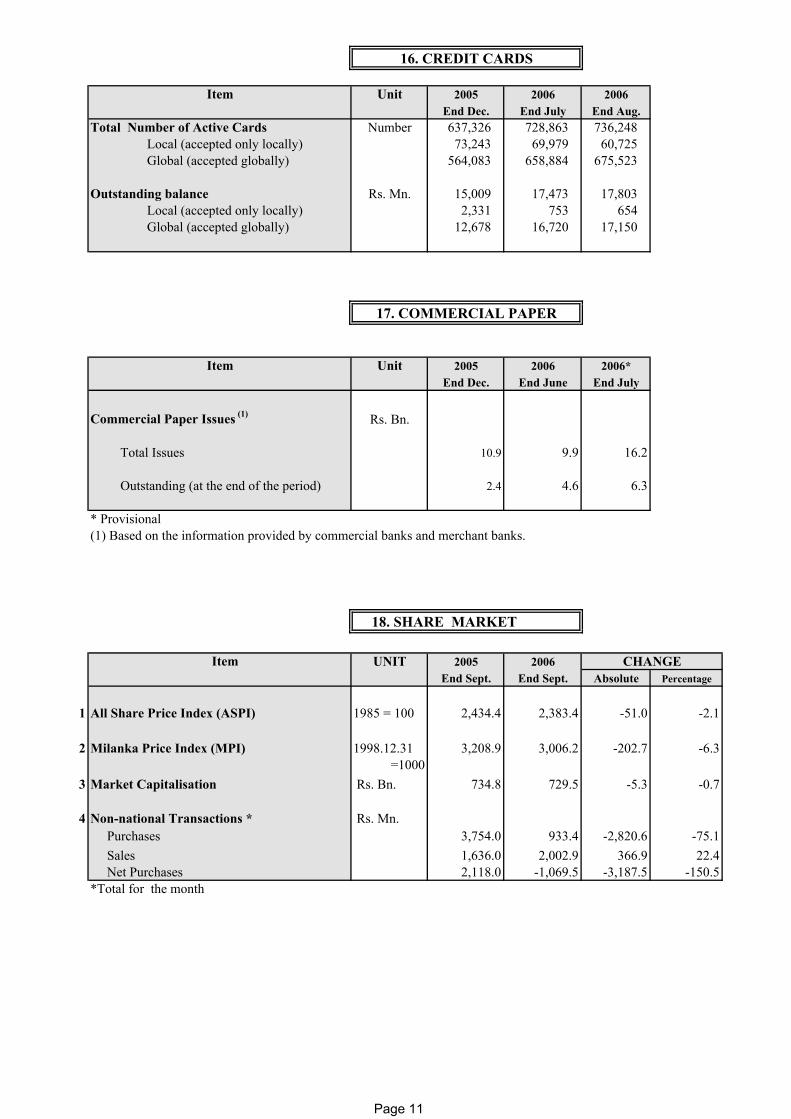
16. CREDIT CARDS
Item Unit 2005 2006 2006End Dec. End July End Aug.
Total Number of Active Cards Number 637,326 728,863 736,248 Local (accepted only locally) 73,243 69,979 60,725 Global (accepted globally) 564,083 658,884 675,523
Outstanding balance Rs. Mn. 15,009 17,473 17,803 Local (accepted only locally) 2,331 753 654 Global (accepted globally) 12,678 16,720 17,150
17. COMMERCIAL PAPER
Item Unit 2005 2006 2006*End Dec. End June End July
Commercial Paper Issues (1) Rs. Bn.
Total Issues 10.9 9.9 16.2
Outstanding (at the end of the period) 2.4 4.6 6.3
* Provisional(1) Based on the information provided by commercial banks and merchant banks.
18. SHARE MARKET
Item UNIT 2005 2006 CHANGEEnd Sept. End Sept. Absolute Percentage
1 All Share Price Index (ASPI) 1985 = 100 2,434.4 2,383.4 -51.0 -2.1
2 Milanka Price Index (MPI) 1998.12.31 3,208.9 3,006.2 -202.7 -6.3 =1000
3 Market Capitalisation Rs. Bn. 734.8 729.5 -5.3 -0.7
4 Non-national Transactions * Rs. Mn. Purchases 3,754.0 933.4 -2,820.6 -75.1
Sales 1,636.0 2,002.9 366.9 22.4 Net Purchases 2,118.0 -1,069.5 -3,187.5 -150.5*Total for the month
Page 11

19. EXTERNAL TRADE
Item UNIT 2005 2006* CHANGEAbsolute Percentage
Exports Rs. Mn.
August 58,902 76,173 17,271 29.3 January - August 404,725 454,567 49,841 12.3Imports August 79,354 103,120 23,766 29.9 January - August 562,114 701,833 139,719 24.9Balance of Trade August -20,452 -26,947 -6,495 31.8 January - August -157,389 -247,267 -89,878 57.1
Exports US $ Mn. August 585 734 150 25.6 January - August 4,051 4,411 361 8.9Imports August 787 994 206 26.2
January - August 5,626 6,811 1,186 21.1Balance of Trade August -203 -260 -57 27.9
January - August -1,575 -2,400 -825 52.4
Tourism Tourist Arrivals Number August 51,216 52,931 1,715 3.3 January - August 362,049 405,487 43,438 12.0
Earnings from Tourism August Rs. Mn. 3,107.0 4,005.8 899 28.9
US$ Mn. 30.8 38.6 8 25.2
January - August Rs. Mn. 21,338.2 30,450.5 9,112 42.7 US$ Mn. 213.5 295.7 82 38.5
* Provisional
Page 12

( External Trade Contd...) IMPORTS
Item UNIT 2005 2006* CHANGEAbsolute Percentage
Major Imports Consumer Goods - Total Rs. Mn. August 13,804 17,531 3,727 27.0 January - August 100,308 115,232 14,925 14.9
Rice August 38 63 25 64.6 January - August 1,396 316 -1,081 -77.4 Sugar August 1,156 1,827 671 58.0 January - August 8,774 13,372 4,599 52.4 Other Food and Beverages August 3,594 5,473 1,879 52.3 January - August 31,316 35,168 3,852 12.3 Non-Food Consumables August 9,016 10,169 1,153 12.8 January - August 58,822 66,377 7,555 12.8 Intermediate Goods - Total August 47,515 62,503 14,988 31.5 January - August 342,172 428,104 85,932 25.1 Wheat August - 1,179 1,179 - January - August 9,126 13,251 4,125 45.2
Petroleum August 15,769 21,456 5,686 36.1 January - August 99,520 150,109 50,590 50.8 Textile & Clothing August 13,775 15,538 1,763 12.8 January - August 98,073 103,081 5,008 5.1 Fertiliser August 547 1,897 1,350 247.0 January - August 8,899 13,327 4,428 49.8 Other Intermediate Goods August 17,424 22,435 5,010 28.8 January - August 126,553 148,335 21,782 17.2 Investment Goods - Total August 17,940 22,919 4,979 27.8 January - August 117,329 153,787 36,458 31.1 Total Imports - (Adjusted Figure) August 79,354 103,120 23,766 29.9 January - August 562,114 701,833 139,719 24.9
* Provisional
Page 13

( External Trade Contd...) Item UNIT 2005 2006* CHANGE
Absolute PercentageMajor Imports
Consumer Goods - Total US $ Mn. August 137.0 168.9 32.0 23.3 January - August 1,003.9 1,118.3 114.4 11.4 Rice August 0.4 0.6 0.2 59.9 January - August 14.0 3.1 -10.9 -78.1 Sugar August 11.5 17.6 6.1 53.4 January - August 87.8 129.9 42.1 48.0 Other Food and Beverages August 35.7 52.7 17.1 47.9 January - August 313.6 341.2 27.7 8.8 Non-Food Consumables August 89.5 98.0 8.5 9.5 January - August 588.6 644.1 55.5 9.4 Intermediate Goods - Total August 471.5 602.3 130.8 27.7 January - August 3,424.5 4,154.2 729.7 21.3 Wheat August 0.0 11.4 11.4 - January - August 91.5 128.6 37.1 40.5 Petroleum August 156.5 206.7 50.3 32.1 January - August 995.8 1,456.3 460.4 46.2 Textile & Clothing August 136.7 149.7 13.0 9.5 January - August 981.4 1,000.4 19.0 1.9 Fertiliser August 5.4 18.3 12.9 236.9 January - August 89.2 129.4 40.3 45.2 Other Intermediate Goods August 172.9 216.2 43.3 25.0 January - August 1,266.6 1,439.5 172.9 13.7 Investment Goods - Total August 178.0 220.8 42.8 24.1 January - August 1,174.1 1,492.7 318.6 27.1 Total Imports- (Adjusted value) August 787.4 993.6 206.2 26.2 January - August 5,625.7 6,811.2 1,185.5 21.1
* Provisional
Page 14
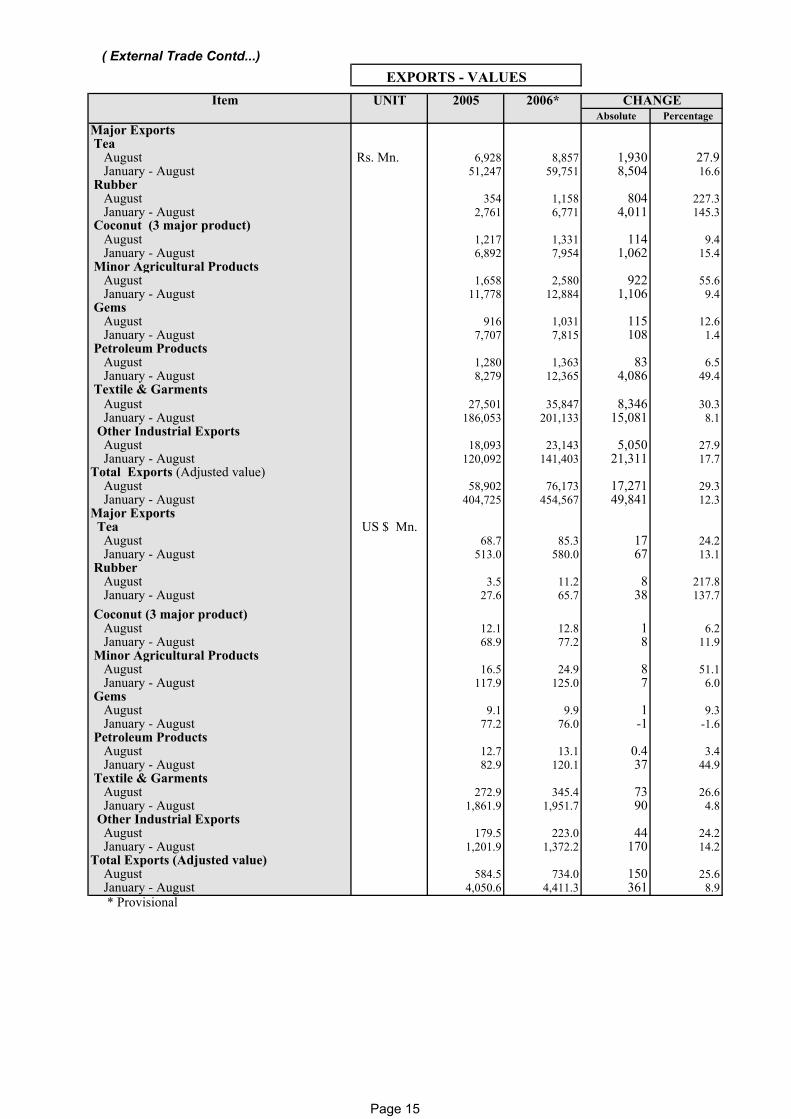
( External Trade Contd...) EXPORTS - VALUES
Item UNIT 2005 2006* CHANGEAbsolute Percentage
Major Exports Tea August Rs. Mn. 6,928 8,857 1,930 27.9 January - August 51,247 59,751 8,504 16.6 Rubber August 354 1,158 804 227.3 January - August 2,761 6,771 4,011 145.3 Coconut (3 major product) August 1,217 1,331 114 9.4 January - August 6,892 7,954 1,062 15.4 Minor Agricultural Products August 1,658 2,580 922 55.6 January - August 11,778 12,884 1,106 9.4 Gems August 916 1,031 115 12.6 January - August 7,707 7,815 108 1.4
Petroleum Products August 1,280 1,363 83 6.5 January - August 8,279 12,365 4,086 49.4 Textile & Garments August 27,501 35,847 8,346 30.3 January - August 186,053 201,133 15,081 8.1 Other Industrial Exports August 18,093 23,143 5,050 27.9 January - August 120,092 141,403 21,311 17.7Total Exports (Adjusted value) August 58,902 76,173 17,271 29.3 January - August 404,725 454,567 49,841 12.3Major Exports Tea US $ Mn. August 68.7 85.3 17 24.2 January - August 513.0 580.0 67 13.1 Rubber August 3.5 11.2 8 217.8 January - August 27.6 65.7 38 137.7 Coconut (3 major product) August 12.1 12.8 1 6.2 January - August 68.9 77.2 8 11.9 Minor Agricultural Products August 16.5 24.9 8 51.1 January - August 117.9 125.0 7 6.0 Gems August 9.1 9.9 1 9.3 January - August 77.2 76.0 -1 -1.6 Petroleum Products August 12.7 13.1 0.4 3.4 January - August 82.9 120.1 37 44.9 Textile & Garments August 272.9 345.4 73 26.6 January - August 1,861.9 1,951.7 90 4.8 Other Industrial Exports August 179.5 223.0 44 24.2 January - August 1,201.9 1,372.2 170 14.2Total Exports (Adjusted value) August 584.5 734.0 150 25.6 January - August 4,050.6 4,411.3 361 8.9 * Provisional
Page 15

( External Trade Contd...)
Item UNIT 2005 2006* CHANGEAugust August Absolute Percentage
Export Volume Tea Mn. Kg. 27.3 32.2 4.9 18.0 Rubber Mn. Kg. 2.2 4.7 2.4 110.1 Coconut Mn. Nuts 52.9 55.4 2.5 4.8Export Prices Tea Rs./ Kg. 253.89 275.16 21.3 8.4
US $/ Kg. 2.52 2.65 0.1 5.2 Rubber Rs./ Kg. 159.80 248.93 89.1 55.8
US $/ Kg. 1.59 2.40 0.8 51.3 Coconut Rs./ Nut 12.34 11.75 -0.6 -4.8
US $/ Nut 0.12 0.11 0.0 -7.5Colombo Auction Average Gross Price Tea Rs./ Kg. 178.13 196.96 18.8 10.6 Rubber Rs./ Kg. 145.75 223.14 77.4 53.1 Coconut Rs./ Nut 70.49 60.59 -9.9 -14.0Quantity Sold Tea Mn. Kg. 26.47 26.20 -0.3 -1.0
Import Volumes Rice MT '000 0.8 1.3 0.4 53.2 Wheat Grain MT '000 - 68.9 - - Sugar MT '000 36.4 38.0 1.6 4.3 Petroleum (Crude Oil) Barrels '000 698.0 1,856.0 1,159.0 166.1
Import Prices(Average) Rice Rs./MT 46,503.0 49,972.0 3,469.0 7.5
US$/MT 461.4 481.5 20.1 4.4 Wheat Grain Rs./MT - 17,120.0 - -
US$/MT - 165.0 - - Sugar Rs./MT 31,740.0 48,087.0 16,347.0 51.5
US$/MT 315.0 463.4 148.4 47.1 Petroleum(Crude Oil) Rs./Barrel 5,950.0 7,475.0 1,525.0 25.6
US$/Barrel 59.0 72.0 13.0 22.0
* Provisional
TRADE INDICES** ( 1997 = 100 )
Item 2005 2006*July July
# Total Exports Value 144.5 133.1 Quantity 132.8 117.9 Unit Value 108.8 112.9Total Imports Value 147.4 176.4 Quantity 153.6 165.8 Unit Value 96.0 106.4Terms of Trade 113.4 106.0** In US$ Terms * Provisional
MAJOR EXPORTS & IMPORTS - VOLUMES AND PRICES
Page 16
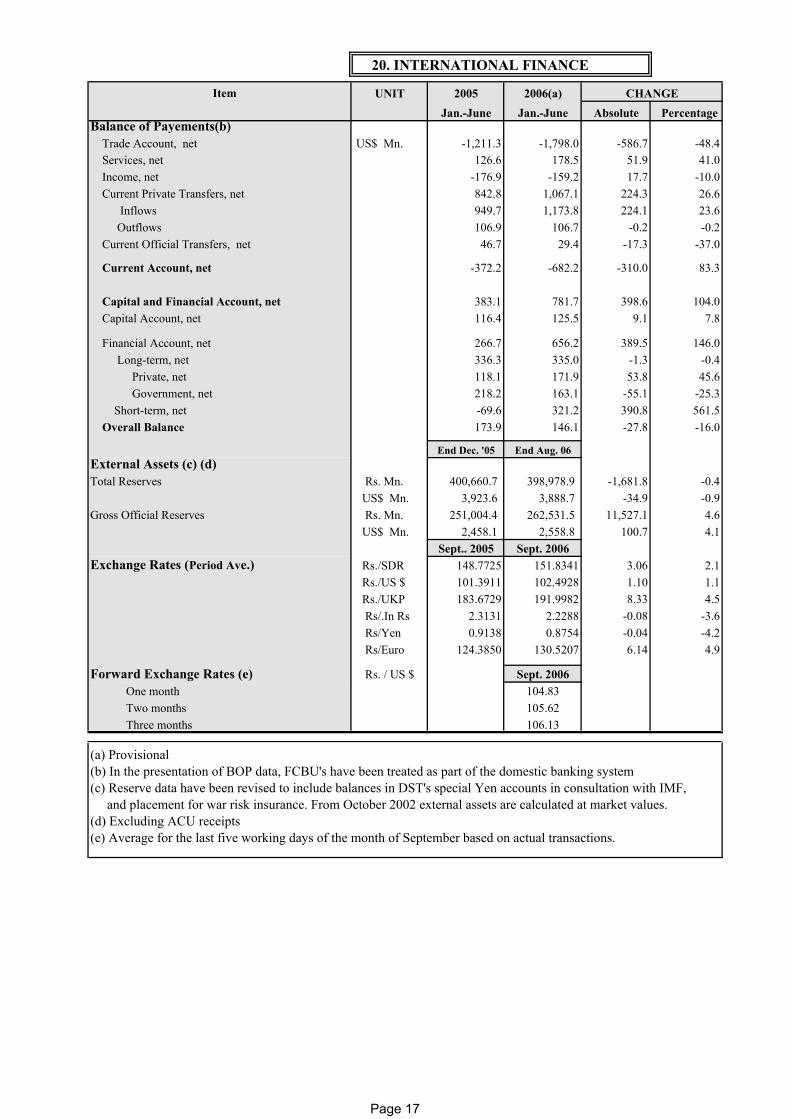
20. INTERNATIONAL FINANCE
Item UNIT 2005 2006(a) CHANGEJan.-June Jan.-June Absolute Percentage
Balance of Payements(b) Trade Account, net US$ Mn. -1,211.3 -1,798.0 -586.7 -48.4 Services, net 126.6 178.5 51.9 41.0 Income, net -176.9 -159.2 17.7 -10.0 Current Private Transfers, net 842.8 1,067.1 224.3 26.6 Inflows 949.7 1,173.8 224.1 23.6 Outflows 106.9 106.7 -0.2 -0.2 Current Official Transfers, net 46.7 29.4 -17.3 -37.0
Current Account, net -372.2 -682.2 -310.0 83.3
Capital and Financial Account, net 383.1 781.7 398.6 104.0 Capital Account, net 116.4 125.5 9.1 7.8
Financial Account, net 266.7 656.2 389.5 146.0 Long-term, net 336.3 335.0 -1.3 -0.4 Private, net 118.1 171.9 53.8 45.6 Government, net 218.2 163.1 -55.1 -25.3 Short-term, net -69.6 321.2 390.8 561.5 Overall Balance 173.9 146.1 -27.8 -16.0
End Dec. '05 End Aug. 06External Assets (c) (d)Total Reserves Rs. Mn. 400,660.7 398,978.9 -1,681.8 -0.4
US$ Mn. 3,923.6 3,888.7 -34.9 -0.9Gross Official Reserves Rs. Mn. 251,004.4 262,531.5 11,527.1 4.6
US$ Mn. 2,458.1 2,558.8 100.7 4.1 Sept.. 2005 Sept. 2006 Exchange Rates (Period Ave.) Rs./SDR 148.7725 151.8341 3.06 2.1 Rs./US $ 101.3911 102.4928 1.10 1.1
Rs./UKP 183.6729 191.9982 8.33 4.5 Rs/.In Rs 2.3131 2.2288 -0.08 -3.6 Rs/Yen 0.9138 0.8754 -0.04 -4.2 Rs/Euro 124.3850 130.5207 6.14 4.9
Forward Exchange Rates (e) Rs. / US $ Sept. 2006 One month 104.83 Two months 105.62 Three months 106.13
(a) Provisional(b) In the presentation of BOP data, FCBU's have been treated as part of the domestic banking system(c) Reserve data have been revised to include balances in DST's special Yen accounts in consultation with IMF, and placement for war risk insurance. From October 2002 external assets are calculated at market values.(d) Excluding ACU receipts(e) Average for the last five working days of the month of September based on actual transactions.
Page 17