Embed Size (px)
Citation preview

World Small Hydropower Development Report 2016
Central America

Wor
ld S
mal
l Hyd
ropo
wer
Dev
elop
men
t Re
port
201
6
274
2.2 Central AmericaJosé Fábrega, Universidad Tecnológica de Panamá
Introduction to the region
Mexico and Central America comprise a unique region, bordered by the Pacific Ocean to the west and the Caribbean Sea and Atlantic Ocean to the east. The region includes eight countries: Belize, Costa Rica, El Salvador, Guatemala, Honduras, Mexico, Nicaragua and Panama. While the overall geographic nature of the region is narrow, the topography and climate of the region vary widely. Northern Mexico is arid while the southern regions of the country are humid to very humid. For the rest of the region, the climate is defined by altitude and proximity to the coast. For example, in Guatemala, the climate is temperate in areas above 1,000-2,000 m, while the lower regions are tropical, with temperatures that can reach 40°C.5
Mexico has 158 river basins with a total mean runoff estimated at 379,000 hm3/year. In Honduras, the most important river is the Ulúa, which flows 400 km to the Caribbean. In Belize, of the 18 major rivers and many perennial streams, the Belize River is the largest (290 km). In Nicaragua, the Rio Grande and its tributaries are the most extensive river system. El Salvador has 10 hydrographic regions that drain into the Pacific Ocean and the Lempa River. Costa Rica is divided into 34 major
basins, 17 basins for each side, with sizes between 207 km2 and 5,084 km2. There are 52 watersheds and around 500 rivers in Panama. Most of these rivers (70 per cent) run to the Pacific side (longer streams), with the other 30 per cent running to the Atlantic side. The most important river in Panama is the Chagres River, which forms the basis for the Panama Canal.
River streams define many borders in Central America. The Coco River runs along the Nicaragua/Honduras border, and the San Juan, Lempa and Sixaola Rivers represent part of the Nicaragua/Costa Rica, El Salvador/Honduras, and Costa Rica/Panamá borders respectively. Rivers define half of Honduras’ international borders. Finally, it is important to mention that the Lempa River basin composes half of El Salvador and its watershed is shared by El Salvador, Honduras and Guatemala.5
An overview of the countries in Central America is presented in Table 1. Mexico alone accounts for 55 per cent of the regional share of installed small hydropower (SHP) (Figure 1). Between the World Small Hydropower Development Report (WSHPDR) 2013 and WSHPDR 2016, the installed SHP capacity in the region has increased by 42 per cent from 598.5 MW to 855.2 MW, largely due to developments in Guatemala, Mexico and Panama (Figure 2).
TABLE 1
Overview of countries in Central America (+ % change from 2013)
Country Total population
(million)
Rural population
(%)
Electricity access (%)
Electrical capacity (MW)
Electricity generation (GWh/year)
Hydropower capacity
(MW)
Hydropower generation (GWh/year)
Belize 0.34 (0%) 56.3 (+8.3pp) 90.0 (+5pp) 141 (–2.1%) 621 (+60%) 54.5 (+2.8%) 250 (0%)
Costa Rica 4.8 (+3.0%) 23.5 (–12.5pp) 99.4 (+0.01pp)
2,682 (–13.7%)
10,201 (+5.1%)
1,662 (–1.1%)
7,254 (–0.1%)
El Salvador 6.1 (+1.6%) 33.7 (–2.3pp) 93.7 (+7.3pp) 1,583 (+20.6%) 5,876 (+1.9%) 487 (+3.1%) 1,768 (–14%)
Guatemala 14.9 (+3.5%) 52.4 (+1.4pp) 86.3 (+5.8pp) 3,170 (+26%)* 9,920 (+21.7%) 997 (+11.8%) 4,654 (+24%)
Honduras 8.7 (+14.4%) 38.0 (–10pp) 82.2 (+11.9pp)
1,850a (+7.4%)
8,141.6 (+14.2%)
623.5 (+17.4%)
2,597 (–15%)
Mexico 121 (+7%) 21.7 (–1.3pp) 98.4 (+0.7pp) 55,086 (–9.9%)
258,256 (–11.4%)
12,294 (+6.5%)
38,145 (+6.5%)
Nicaragua 5.9 (+2%) 42.2 (–0.8pp) 77.9 (+5.8pp) 1,275 (+42%) 4,163 (+10.1%)
119.4 (+13.3%)
456 (+39.8%)
Panama 3.7 (+4.2%) 38.2 (+13.2pp)
90.9 (+2.8pp)
2,828 (+18.2%)
9,256 (+17.7%)
1,623 (+20.1%)
N/A (-)
Total 165 (+6%) — — 68,615(–4.9%)
306,434 (–8.3%)
17,860 (+7.5%)
55,124 (—)
Sources: Various1,2,3,4,5,6,7
Note: The comparison is between data from WSHPDR 2013 and WSHPDR 2016.Note: An asterisk (*) indicates data were referenced from the 2013 country report, not the regional report.

Cen
tral
Am
eric
a
2.2
275
FIGURE 1
Share of regional installed capacity of SHP by country
Source: WSHPDR 20165
FIGURE 2
Net changes in installed capacity of SHP (MW) for Central America, 2013-2016
Sources: WSHPDR 2013,6 WSHPDR 20165
Note: The comparison is between data from WSHPDR 2013 and WSHPDR 2016. A negative net change can be due to closures or rehabilitation of SHP sites, and/or due to access to more accurate data for previous reporting.
The Central American Electric Interconnection System (SIEPAC) has been set up to create an integrated electricity market among El Salvador, Guatemala, Honduras, Costa Rica, Nicaragua and Panama. Once the installation of the SIEPAC line is finished, member states can exchange energy up to 300 MW. Besides the SIEPAC, a transmission line of 103 km has linked Mexico and Guatemala since April 2010. It has a capacity of 200 MW towards Guatemala and 70 MW in the opposite direction
These strategic projects allow energy transfers to the SIEPAC countries to serve the Regional Electric Market of Central America. Mexico is also connected to Belize by a transmission line with a capacity of 65 MW. To the north, Mexico has 11 interconnections with Texas and California in the USA. The capacities of those interconnections range from 36 to 800 MW. Great interest existed in a
Mexico55%
El Salvador4%
Costa Rica11%
Guatemala10%
Honduras9%
Belize1%
Panama10%
Nicaragua0.3%
116.7
Beliz
e
Cos
ta R
ica
El S
alva
dor
Gua
tem
ala
Hon
dura
s
Mex
ico
Nac
arag
ua
Pana
ma
47.8
20.8
-0.7
48.4
21
03
2012 plan that would link Panama and Colombia through a 614 km interconnection. However, this project has yet to be realized.8,9
The reduction of electricity tariffs and the inclusion of more renewable energy (RE) sources might become a major political challenge in the future. Except for Mexico (US$0.082/KWh), electricity tariffs are high in most countries of the region. Costa Rica has increased its rate from US$0.07/KWh in 2005 (at the time, the cheapest in the world) to US$0.17/kW in 2015. The opposition to new hydroelectric projects by the local population (native groups in many cases) is another political challenge that the region is facing.5
Small hydropower definition
The definition of SHP varies throughout the region (Table 2).
Costa Rica does not have an official definition of SHP, but considers installed capacity less than 20 MW to be plants with limited capacity. In Honduras and Belize, there is no definition or consensus for SHP. The rest of the countries have some specific classification, with the highest being a capacity of 30 MW in Mexico.
TABLE 2
Classification of SHP in Central America
Country Small (MW) Mini (MW)
Micro (kW)
Pico (kW)
Belize — — — —
Costa Rica “Limited capacity” < 20
— — —
El Salvador Up to 20 — — —
Guatemala Up to 10 — — —
Honduras — — — —
Mexico Up to 30 — — —
Nicaragua Up to 10 — — —
Panama Up to 10 or 20 — — —
Sources: WSHPDR 2013,6 WSHPDR 20165
Regional small hydropower overview and renewable energy policy
Despite the large number of watercourses in the region and the important role that large hydropower plants play in the energy sector of the region, SHP development has continued to remain a small fraction of overall hydro-generation. There is a large untapped potential, but more feasibility studies need to be conducted in order for many countries to fully utilize their SHP potential. There are several small projects in the Central America and Mexico region related specifically to SHP. For example, 30 MW of SHP is under construction in Honduras; and in Nicaragua,
Wor
ld S
mal
l Hyd
ropo
wer
Dev
elop
men
t Re
port
201
6
276
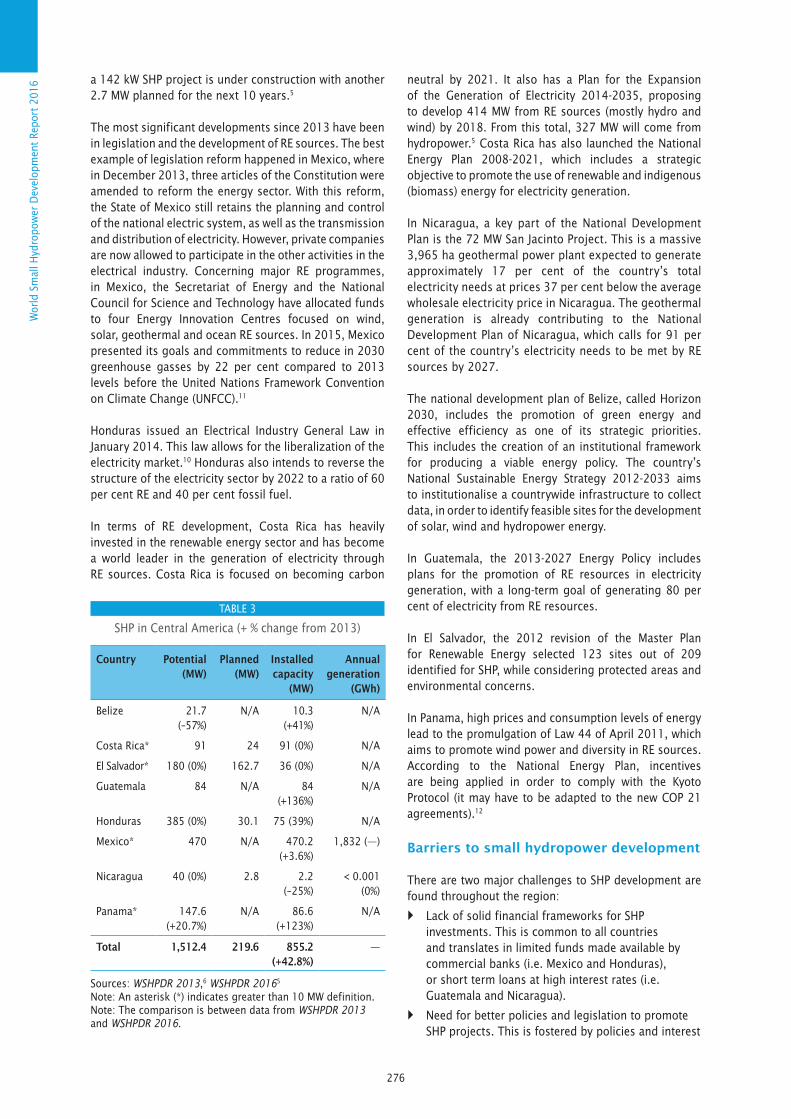
a 142 kW SHP project is under construction with another 2.7 MW planned for the next 10 years.5
The most significant developments since 2013 have been in legislation and the development of RE sources. The best example of legislation reform happened in Mexico, where in December 2013, three articles of the Constitution were amended to reform the energy sector. With this reform, the State of Mexico still retains the planning and control of the national electric system, as well as the transmission and distribution of electricity. However, private companies are now allowed to participate in the other activities in the electrical industry. Concerning major RE programmes, in Mexico, the Secretariat of Energy and the National Council for Science and Technology have allocated funds to four Energy Innovation Centres focused on wind, solar, geothermal and ocean RE sources. In 2015, Mexico presented its goals and commitments to reduce in 2030 greenhouse gasses by 22 per cent compared to 2013 levels before the United Nations Framework Convention on Climate Change (UNFCC).11
Honduras issued an Electrical Industry General Law in January 2014. This law allows for the liberalization of the electricity market.10 Honduras also intends to reverse the structure of the electricity sector by 2022 to a ratio of 60 per cent RE and 40 per cent fossil fuel.
In terms of RE development, Costa Rica has heavily invested in the renewable energy sector and has become a world leader in the generation of electricity through RE sources. Costa Rica is focused on becoming carbon
neutral by 2021. It also has a Plan for the Expansion of the Generation of Electricity 2014-2035, proposing to develop 414 MW from RE sources (mostly hydro and wind) by 2018. From this total, 327 MW will come from hydropower.5 Costa Rica has also launched the National Energy Plan 2008-2021, which includes a strategic objective to promote the use of renewable and indigenous (biomass) energy for electricity generation.
In Nicaragua, a key part of the National Development Plan is the 72 MW San Jacinto Project. This is a massive 3,965 ha geothermal power plant expected to generate approximately 17 per cent of the country’s total electricity needs at prices 37 per cent below the average wholesale electricity price in Nicaragua. The geothermal generation is already contributing to the National Development Plan of Nicaragua, which calls for 91 per cent of the country’s electricity needs to be met by RE sources by 2027.
The national development plan of Belize, called Horizon 2030, includes the promotion of green energy and effective efficiency as one of its strategic priorities. This includes the creation of an institutional framework for producing a viable energy policy. The country’s National Sustainable Energy Strategy 2012-2033 aims to institutionalise a countrywide infrastructure to collect data, in order to identify feasible sites for the development of solar, wind and hydropower energy.
In Guatemala, the 2013-2027 Energy Policy includes plans for the promotion of RE resources in electricity generation, with a long-term goal of generating 80 per cent of electricity from RE resources.
In El Salvador, the 2012 revision of the Master Plan for Renewable Energy selected 123 sites out of 209 identified for SHP, while considering protected areas and environmental concerns.
In Panama, high prices and consumption levels of energy lead to the promulgation of Law 44 of April 2011, which aims to promote wind power and diversity in RE sources. According to the National Energy Plan, incentives are being applied in order to comply with the Kyoto Protocol (it may have to be adapted to the new COP 21 agreements).12
Barriers to small hydropower development
There are two major challenges to SHP development are found throughout the region:
} Lack of solid financial frameworks for SHP investments. This is common to all countries and translates in limited funds made available by commercial banks (i.e. Mexico and Honduras), or short term loans at high interest rates (i.e. Guatemala and Nicaragua).
} Need for better policies and legislation to promote SHP projects. This is fostered by policies and interest
TABLE 3
SHP in Central America (+ % change from 2013)
Country Potential (MW)
Planned (MW)
Installed capacity
(MW)
Annual generation
(GWh)
Belize 21.7 (–57%)
N/A 10.3 (+41%)
N/A
Costa Rica* 91 24 91 (0%) N/A
El Salvador* 180 (0%) 162.7 36 (0%) N/A
Guatemala 84 N/A 84 (+136%)
N/A
Honduras 385 (0%) 30.1 75 (39%) N/A
Mexico* 470 N/A 470.2 (+3.6%)
1,832 (—)
Nicaragua 40 (0%) 2.8 2.2 (–25%)
< 0.001 (0%)
Panama* 147.6 (+20.7%)
N/A 86.6 (+123%)
N/A
Total 1,512.4 219.6 855.2 (+42.8%)
—
Sources: WSHPDR 2013,6 WSHPDR 20165
Note: An asterisk (*) indicates greater than 10 MW definition.Note: The comparison is between data from WSHPDR 2013 and WSHPDR 2016.

Cen
tral
Am
eric
a
2.2
277
groups focused on promoting fossil-fuel-fired energy projects (i.e. Mexico and Honduras). Also, even within RE sources, there seem to be preferences for the development of other types of RE projects (i.e. Mexico, Panama and El Salvador). Even in Panama, which possesses a favourable legal framework, the SHP sector development is not significant. Since SHP projects are small, incentives are necessary to level disadvantages such as proportionally more expensive permits and environmental impact studies (i.e. Costa Rica, Mexico and Nicaragua).
Besides these two major barriers, it is important to also consider other situations such as:
} Lack of reliable river flow data series and detailed hydropower potential inventories;
} Unregulated markets and lack of standards (i.e. Belize);
} Land rights issues (i.e. Guatemala);
} Limits to private investors participation in energy generation (i.e. Costa Rica).
References
1. World Bank (2014). Rural population (data from 2014). Available from http://data.worldbank.org/indicator/SP.RUR.TOTL. 2. World Bank (2012). Access to electricity (data from 2012). Available from http://data.worldbank.org/indicator/EG.ELC.ACCS.ZS. 3. World Bank (2014). Population, total. Available from http://data.worldbank.org.4. International Journal on Hydropower and Dams (2015). World Atlas and Industry Guide 2015. Surrey, UK: Aquamedia International. 5. World Small Hydropower Development Report 2016. Detailed data for specific countries is presented in the respective Country Reports. 6. Liu, H., Masera, D. and Esser, L., eds. (2013). World Small Hydropower Development Report 2013. United Nations Industrial Development Organization; International Center on Small Hydro Power. Available from www.smallhydroworld.org. 7. International Renewable Energy Agency (IRENA) (2015). Renewable Energy Capacity Statistics 2015.
Available from www.irena.org. 8. The Potential of Regional Power Sector Integration, Economic Consulting Associates Limited, UK, March 2010. 9. Organisation for Economic Co-operation and Development (OECD), (2014). Latin American Competition Forum - Session II - Electricity Markets in Latin America: Regional Integration and Competition Issue, Contribution from Costa Rica (DAF/COMP/LACF(2014)26). Available from www.oecd.org. 10. Mexico, Ley General de la Industria Electrica (2014). Available from www.enee.hn/noticias/LEY%20GENERAL%20DE%20LA%20INDUSTRIA%20EL%c9CTRICA%2004%2%20DEJULIO.pdf. 11. MIDEPLAN (2014). Plan Nacional de Desarrollo 2015-2018 “Alberto Cañas Escalante”. Available from http://documentos.mideplan.go.cr/alfresco/d/d/workspace/SpacesStore/cd1da1b4-868b-4f6f-bdf8-b2dee0525b76/PND%202015-2018%20Alberto%20Ca%C3%B1as%20Escalante%20WEB.pdf. 12. Panama, Secretaría Nacional de Energía (2011). Ley No. 44. April 25-2011.


![Workshop Hydropower and Fish.pptx [Schreibgeschützt] - Workshop Hydropower and Fish... · Workshop Hydropower and Fish Existing hydropower facilities: ... spawning grounds and shelter](https://img.dokumen.tips/doc/110x75/5a8733247f8b9afc5d8da3c5/workshop-hydropower-and-fishpptx-schreibgeschtzt-workshop-hydropower-and-fishworkshop.jpg)