Embed Size (px)
Citation preview

Census BasicsUP206A: Introduction to GIS

History• When was the first census?
–1790• How many people were counted?
–3.9 million• How many states did we have then?
– 13 original states, plus the districts of Kentucky, Maine, Vermont, and the Southwest Territory
• What questions were asked?– name of head of family– number of persons in each household of the following descriptions:
• free White males 16 years and upward, • free White males under 16 years, • free White females, • all other free persons (by sex and color) and slaves

Census 2000• When was it taken?
–April 1, 2000
• How many people were counted?
–281,421,906 (13.2 percent increase over the 248,709,873 in 1990)
• Questionnaire included seven questions for each household:– name– sex– age– relationship– Hispanic origin– race– owner/renter


Census 2010• When was it taken?
–April 1, 2010
• How many people were counted?
–308,745,538 (9.7 percent increase over the 281,421,906 in 2000)
• Questionnaire included ten questions for each household:– http://
2010.census.gov/2010census/about/interactive-form.php
• Release schedule
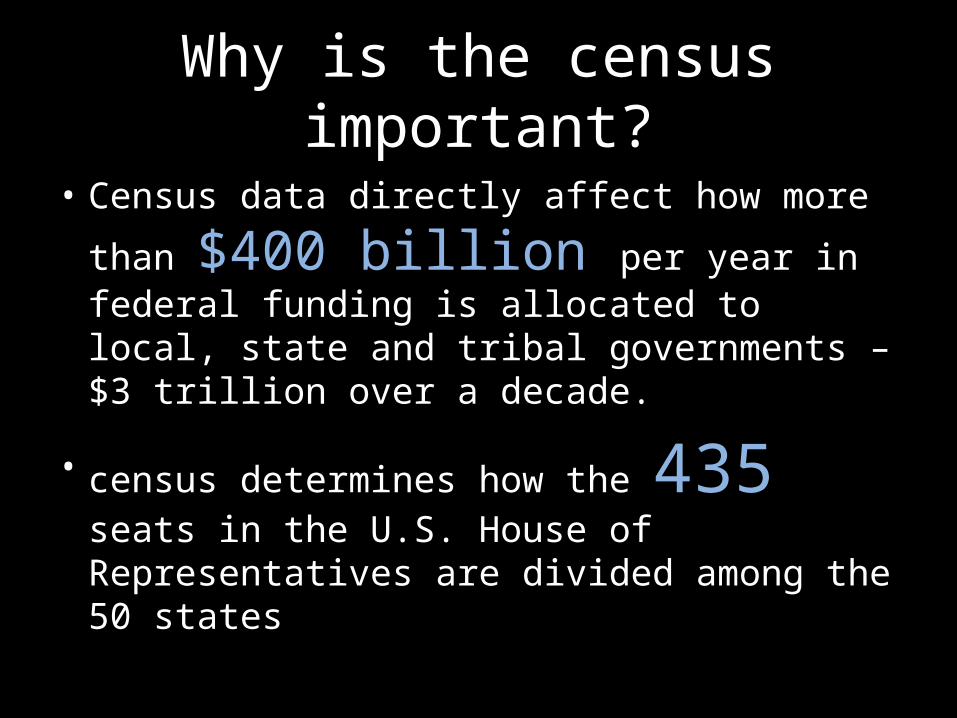
Why is the census important?
• Census data directly affect how more than
$400 billion per year in federal funding is allocated to local, state and tribal governments – $3 trillion over a decade.
• census determines how the 435 seats in the U.S. House of Representatives are divided among the 50 states

How is this money spent?Better infrastructure. More services. A brighter tomorrow for everyone. In fact, the information the census collects helps to determine how more than $400 billion dollars of federal funding each year is spent on infrastructure and services like:• Hospitals• Job training centers• Schools• Senior centers• Bridges, tunnels and other-public works
projects• Emergency services

SHORT AND LONG…Before 2010…

Short: how many?

Long: how we live• When was the long form introduced?
–1940 census
• How many people got the long form?
–17 percent of the households (1 out of every 6 households)
• What questions were asked?– ancestry– income– mortgage– size of the housing unit– disability– etc


What? No more long form?
• Meet the American Community Survey • The form• Replaces the long form
– ie, [old long form] = [new American community survey]
• From once in 10 years, to every year! (started in 2005)
• 1, 3, and 5 year estimates– Which to choose?– http://www.census.gov/acs/www/guidance_for_data_use
rs/estimates/
• You are in luck… the data is JUST becoming available, just in time for your final projects

Summary File 1
• counts and basic cross-tabulations of information collected from all people and housing units. – race, age, household size, owner/renter
• Lowest level geography: – Blocks

Summary File 3
• contains tables with social, economic and housing characteristics compiled from a sample of approximately 19 million housing units (about 1-in-6 households) that received the Census 2000 long-form questionnaire. Many tables are given for nine major race and Hispanic or Latino groups.
• Lowest level geography:– Block Groups/Census Tracts

Census Geography
UP206A: Introduction to GIS


Counties
• Counties in 48 States• Independent Cities in
4 States• Parishes in Louisiana• Cities and Boroughs
in Alaska
• 58 counties in California
• 3,141 counties in the US

Places
Incorporated Places (i.e. municipalities)
Census Designated Places (i.e. unincorporated areas)
1,081 places in California
25,150 places in the US

Census Tracts
Relatively homogenous population characteristics
Size: optimally 4,000 people, range between 1,000 and 8,000
2,054 census tracts in Los Angeles County
65,344 census tracts in the US

Block Groups
Groups of blocks (share the same first digit)
Smallest areas for which sample data available
Size: optimally 1,500 people, but range between 300 to 3,000
6,351 block groups in Los Angeles County
208,689 block groups in the US

Blocks
Smallest units of data tabulationCover the entire nationDo not cross census tracts or countiesGenerally bounded by visible features and
legal boundaries
Size: average about 100 people
89,614 blocks in Los Angeles County
8.2 million blocks in the US

ZCTA’s
• ZCTAs: ZIP Code Tabulation Areas• Approximate area representations of
USPS ZIP Code service areas• Based on Census 2000 blocks• To address difficulties in mapping USPS
ZIP Codes• May represent either a five or three-
digit USPS ZIP Code• http://www.census.gov/geo/ZCTA/zcta.
html

FIPS
• FIPS – Federal Information Processing Standards
06 037 701400 4STATE COUNTY CENSUS TRACT BLOCK
GROUP

Tiger Files
• Topologically Integrated Geographic Encoding and Referencing
• developed at the U.S. Census Bureau to support its mapping needs for the Decennial Census and other Bureau programs
• coverage of the United States, Puerto Rico, the U.S. Virgin Islands, American Samoa, Guam, the Commonwealth of the Northern Mariana Islands, and the Midway Islands
• http://www.census.gov/geo/www/tiger/

Data and Census Geography
• The larger the census geographic
unit, the greater the amount of data available (i.e. Single years of data by County)
• The smaller the census geographic unit, the less data available (i.e., Age in five-year categories for Census Tracts)